Article

Synthesis of Pyrrolo[3,4-b]pyridin-5-ones via Ugi–Zhu Reaction and In Vitro–In Silico Studies against Breast Carcinoma

by
Ivette Morales-Salazar
1,
Carlos E. Garduño-Albino
1,
Flora P. Montes-Enríquez
1,
Dania A. Nava-Tapia
2,
Napoleón Navarro-Tito
2,*,
Leonardo David Herrera-Zúñiga
1,*,
Eduardo González-Zamora
1 and
Alejandro Islas-Jácome
1,*
1
Departamento de Química, Universidad Autónoma Metropolitana-Iztapalapa, San Rafael Atlixco 186, Col. Vicentina, Iztapalapa, Ciudad de México 09340, Mexico
2
Laboratorio de Biología Celular del Cáncer, Universidad Autónoma de Guerrero, Chilpancingo de los Bravo 39086, Mexico
*
Authors to whom correspondence should be addressed.
Pharmaceuticals 2023, 16(11), 1562; https://doi.org/10.3390/ph16111562
Submission received: 12 October 2023 / Revised: 31 October 2023 / Accepted: 2 November 2023 / Published: 6 November 2023

Abstract

:
An Ugi–Zhu three-component reaction (UZ-3CR) coupled in a one-pot manner to a cascade process (N-acylation/aza Diels–Alder cycloaddition/decarboxylation/dehydration) was performed to synthesize a series of pyrrolo[3,4-b]pyridin-5-ones in 20% to 92% overall yields using ytterbium triflate as a catalyst, toluene as a solvent, and microwaves as a heat source. The synthesized molecules were evaluated in vitro against breast cancer cell lines MDA-MB-231 and MCF-7, finding that compound 1f, at a concentration of 6.25 μM, exhibited a potential cytotoxic effect. Then, to understand the interactions between synthesized compounds and the main proteins related to the cancer cell lines, docking studies were performed on the serine/threonine kinase 1 (AKT1) and Orexetine type 2 receptor (Ox2R), finding moderate to strong binding energies, which matched accurately with the in vitro results. Additionally, molecular dynamics were performed between proteins related to the studied cell lines and the three best ligands.

Graphical Abstract

1. Introduction

Breast cancer is the most common invasive neoplasm and the leading cause of death in women worldwide. According to the World Health Organization, 2.5 million new cases and 685,000 deaths were reported worldwide in 2020 [1]. Furthermore, it has been described that 90% of cancer deaths are associated with metastasis, and breast cancer cells spread mainly to secondary sites such as the bones, lungs, liver, brain, and lymph nodes [2]. One of the most common and widely accepted classifications of breast cancer is related to the expression of estrogen receptor (ER), progesterone receptor (PR), and human epidermal growth factor receptor 2 (HER2) [3,4]. According to this classification, breast cancer has been divided into six main subtypes: luminal A, luminal B, basal-like or triple-negative breast cancer (TNBC), basal-epithelial, normal-like, and claudin-low breast cancer [3,5]. Currently, the molecular characteristics of breast cancer have allowed the use of different cellular models as a first approach in the research of alternative or complementary treatments in breast cancer therapy, where cell lines such as MCF-7 (luminal subtype A) and MDA-MB-231 (TNBC subtype) are frequently used [6], for instance, in the present work.
Thus, to investigate the possible therapeutic effects of the synthesized pyrrolo[3,4-b]pyridin-5-ones 1a1k, molecular docking assays were performed using 20 protein targets related to breast cancer: Serine/Threonine-protein kinase AKT (AKT1), Troponin cardiac muscle (cTn), Cytochrome P450 2C9 (CYP2C9), Cytochrome P450 3A4 (CYP3A4), MAP kinase p38 alpha (p38α), Cathepsin S (CTSS), Cyclin-dependent kinase 2/cyclin A (Cdk2/CA), Insulin-degrading enzyme (IDE), Cyclin-dependent kinase 2/cyclin E (Cdk2/CE), Cyclin-dependent kinase 4 (CDK4), Mitogen-activated protein kinase 8 (MAPK8), Cathepsin L (CTSL), Serotonin 6 receptor (5-HT6), Dual specificity protein phosphatase 3 (DUSP3), GTPase Kras (KRAS), MAP kinase-activated protein kinase 3 (MAPK3), Metabotropic glutamate receptor 2 (mGluR2), Ghrelin receptor (ghrelinR), Histamine H3 receptor (H3), and Orexin-2 receptor (Ox2R). The best hits were confirmed using molecular dynamics (MD). Based on available information, there are no prior investigations into the potential of this compound series to target AKT1 [7,8] and Ox2R [9,10] as the main proteins relating to breast cancer. Compounds 1f, 1h, and 1k bind efficiently to catalytic sites of the two specific target proteins implicated in the proliferation of breast cancer cells. As a result, it can be observed that compounds 1f, 1h, and 1k possess advantageous structural characteristics, rendering them highly promising molecules with prospective therapeutic applications in antineoplastic treatments for breast cancer.

2. Results and Discussion

2.1. Synthesis

Multicomponent reactions are privileged synthetic tools due to the high atom economy observed when assembling polyheterocyclic cores in a one-pot manner [11]. Within MCRs, an elegant variation of the Ugi three-component reaction (U-3CR) called the Ugi–Zhu reaction (UZ-3CR) has been extensively developed in our research group to synthesize a broad variety of polyheterocyclic pyrrolo[3,4-b]pyridin-5-ones [12].
Thus, to achieve pyrrolo[3,4-b]pyridin-5-ones 1a1k, a one-pot process was performed by coupling an UZ-3CR to a cascade sequence: aza Diels–Alder/N-acylation/aromatization (decarboxylation/dehydration). In some of our previous reports, it was found that toluene and ytterbium triflate were the best solvent and catalyst, respectively, to perform this process [13,14]. Thus, it was necessary to synthesize isocyanoacetamides from racemic phenylalanine in three steps as reported by Zhu and co-workers: (1) amino acid N-formylation, (2) peptidic coupling, and (3) Ugi-type dehydration [15]. With isocyanides in hand, and according to the Ugi–Zhu process, the reaction between aldehydes 2 and amines 3 yielded the imines 4, which were activated with Lewis acid catalysts to promote α-nucleophilic attack by α-isocyanoacetamides 5. Then, through a non-prototropic chain-ring tautomerization, 5-aminooxazoles 6 were afforded. Thus, addition of maleic anhydride (7) promoted an aza Diels–Alder cycloaddition followed by the N-acylation/decarboxylation/dehydration cascade process to give the products 1a1k in moderate to good yields (20–92%) (Scheme 1). It is worth highlighting that only three small molecules (two molecules of water and one molecule of CO2) were released in all synthetic processes, demonstrating the process’s high atom economy under ecofriendly conditions.

2.2. Anticancer Activity

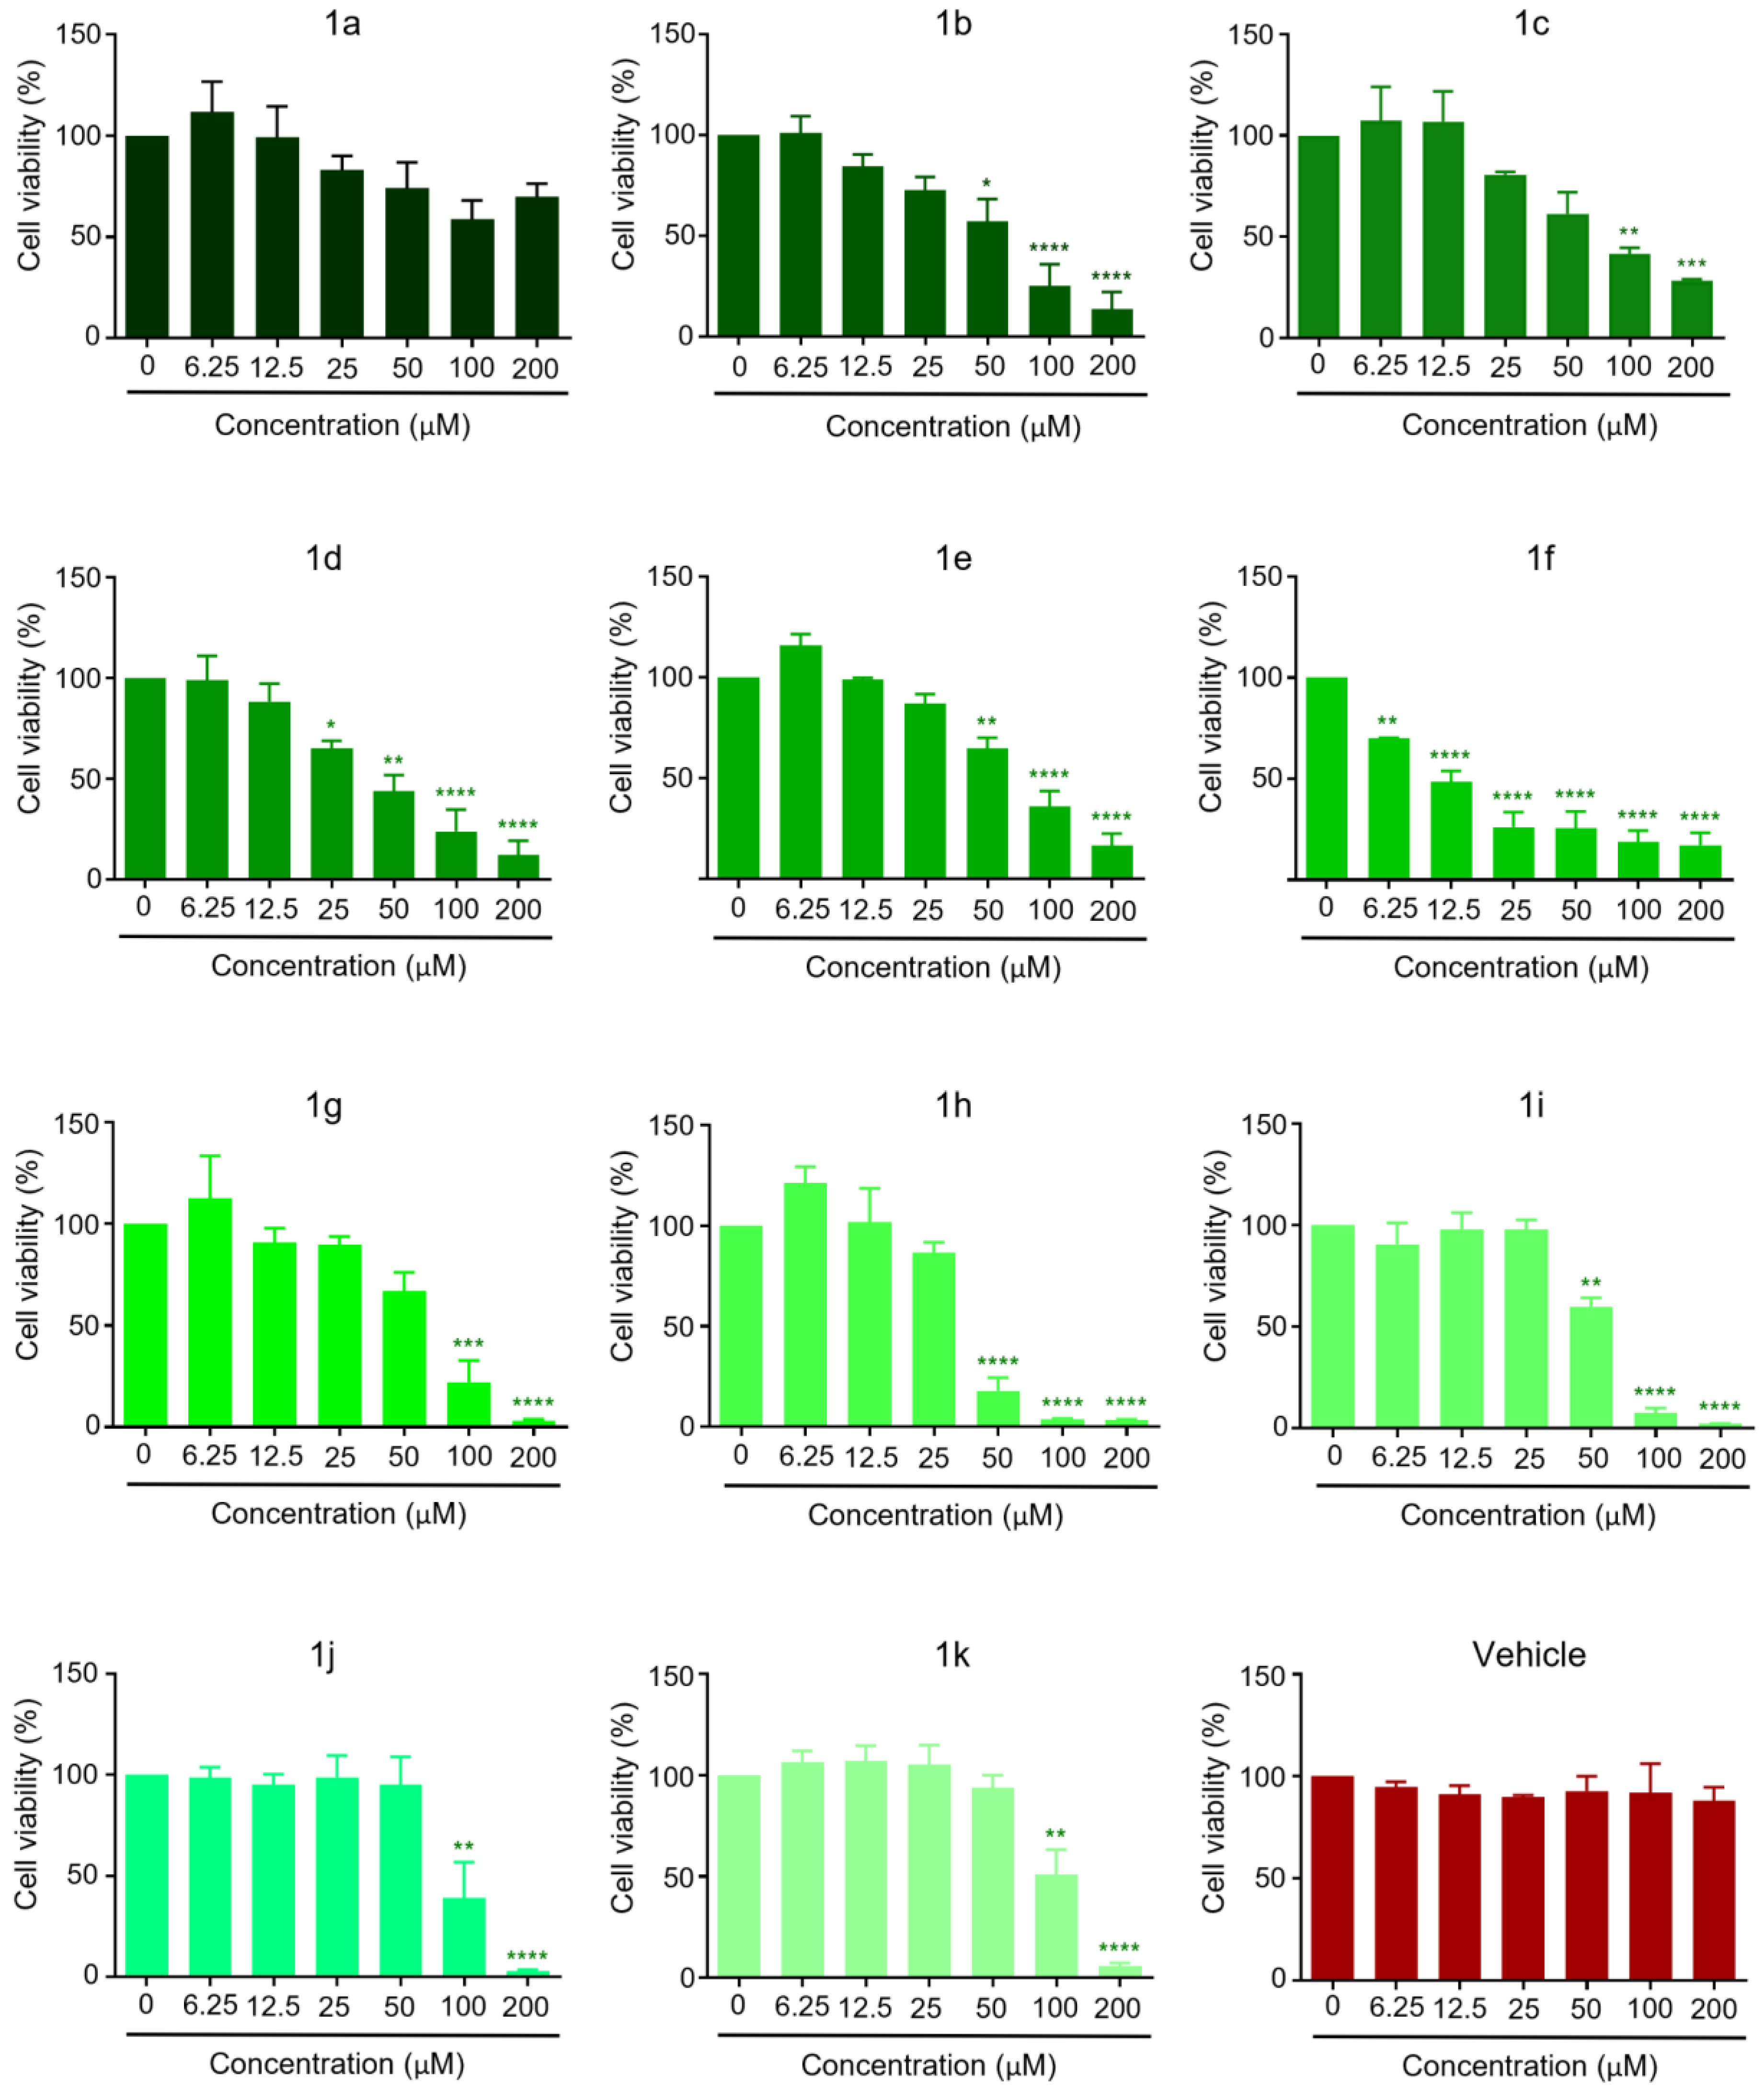
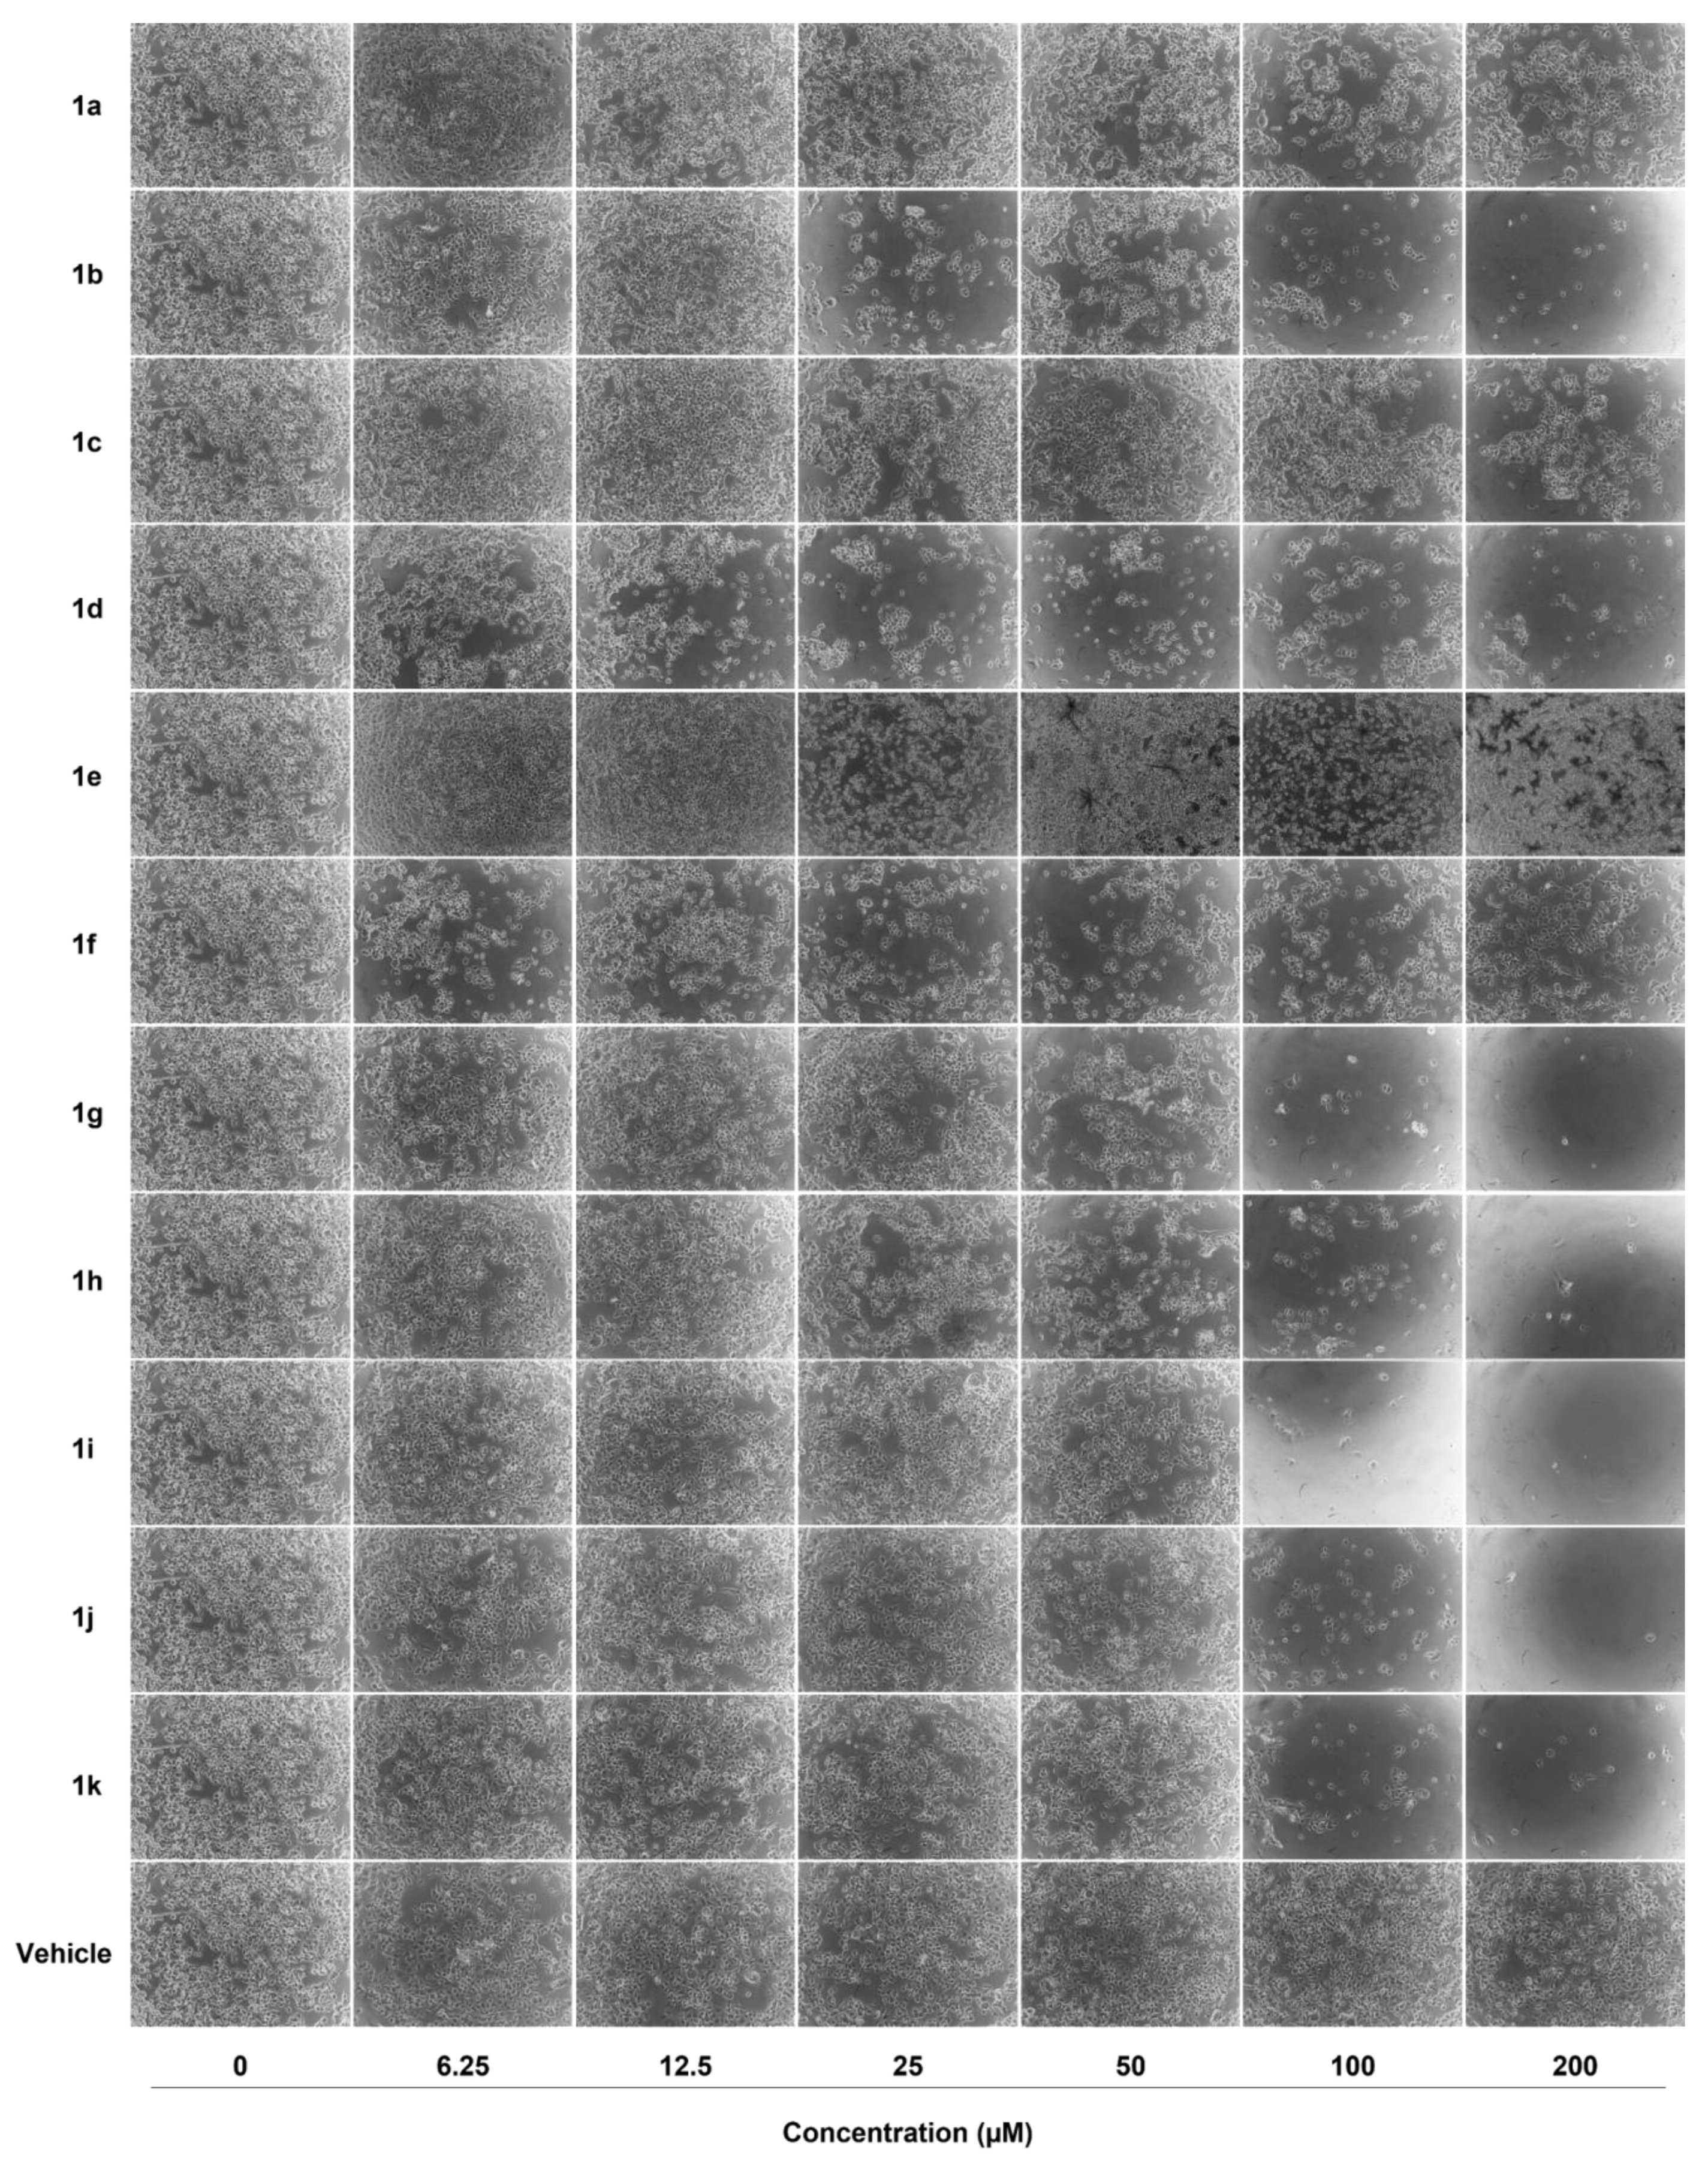
The effect of compounds 1a1k was evaluated on cell viability by MTT assays of two breast cancer cell lines, the triple-negative cell line MDA-MB-231 and the HER2-positive breast cancer line MCF-7. Results show that in the MDA-MB-231 cell line, the compounds that significantly decrease cell viability at lower concentrations are 1f (6.25 µM) and 1d (25 µM), whereas compounds 1b, 1e, 1h, and 1i decrease cell viability at 50 µM. Compounds 1c, 1g, 1j, and 1k decrease viability starting at 100 and 200 µM. Interestingly, no significant decrease was observed for compound 1a in MDA-MB-231 breast cancer cells (Figure 1 and Figure 2).
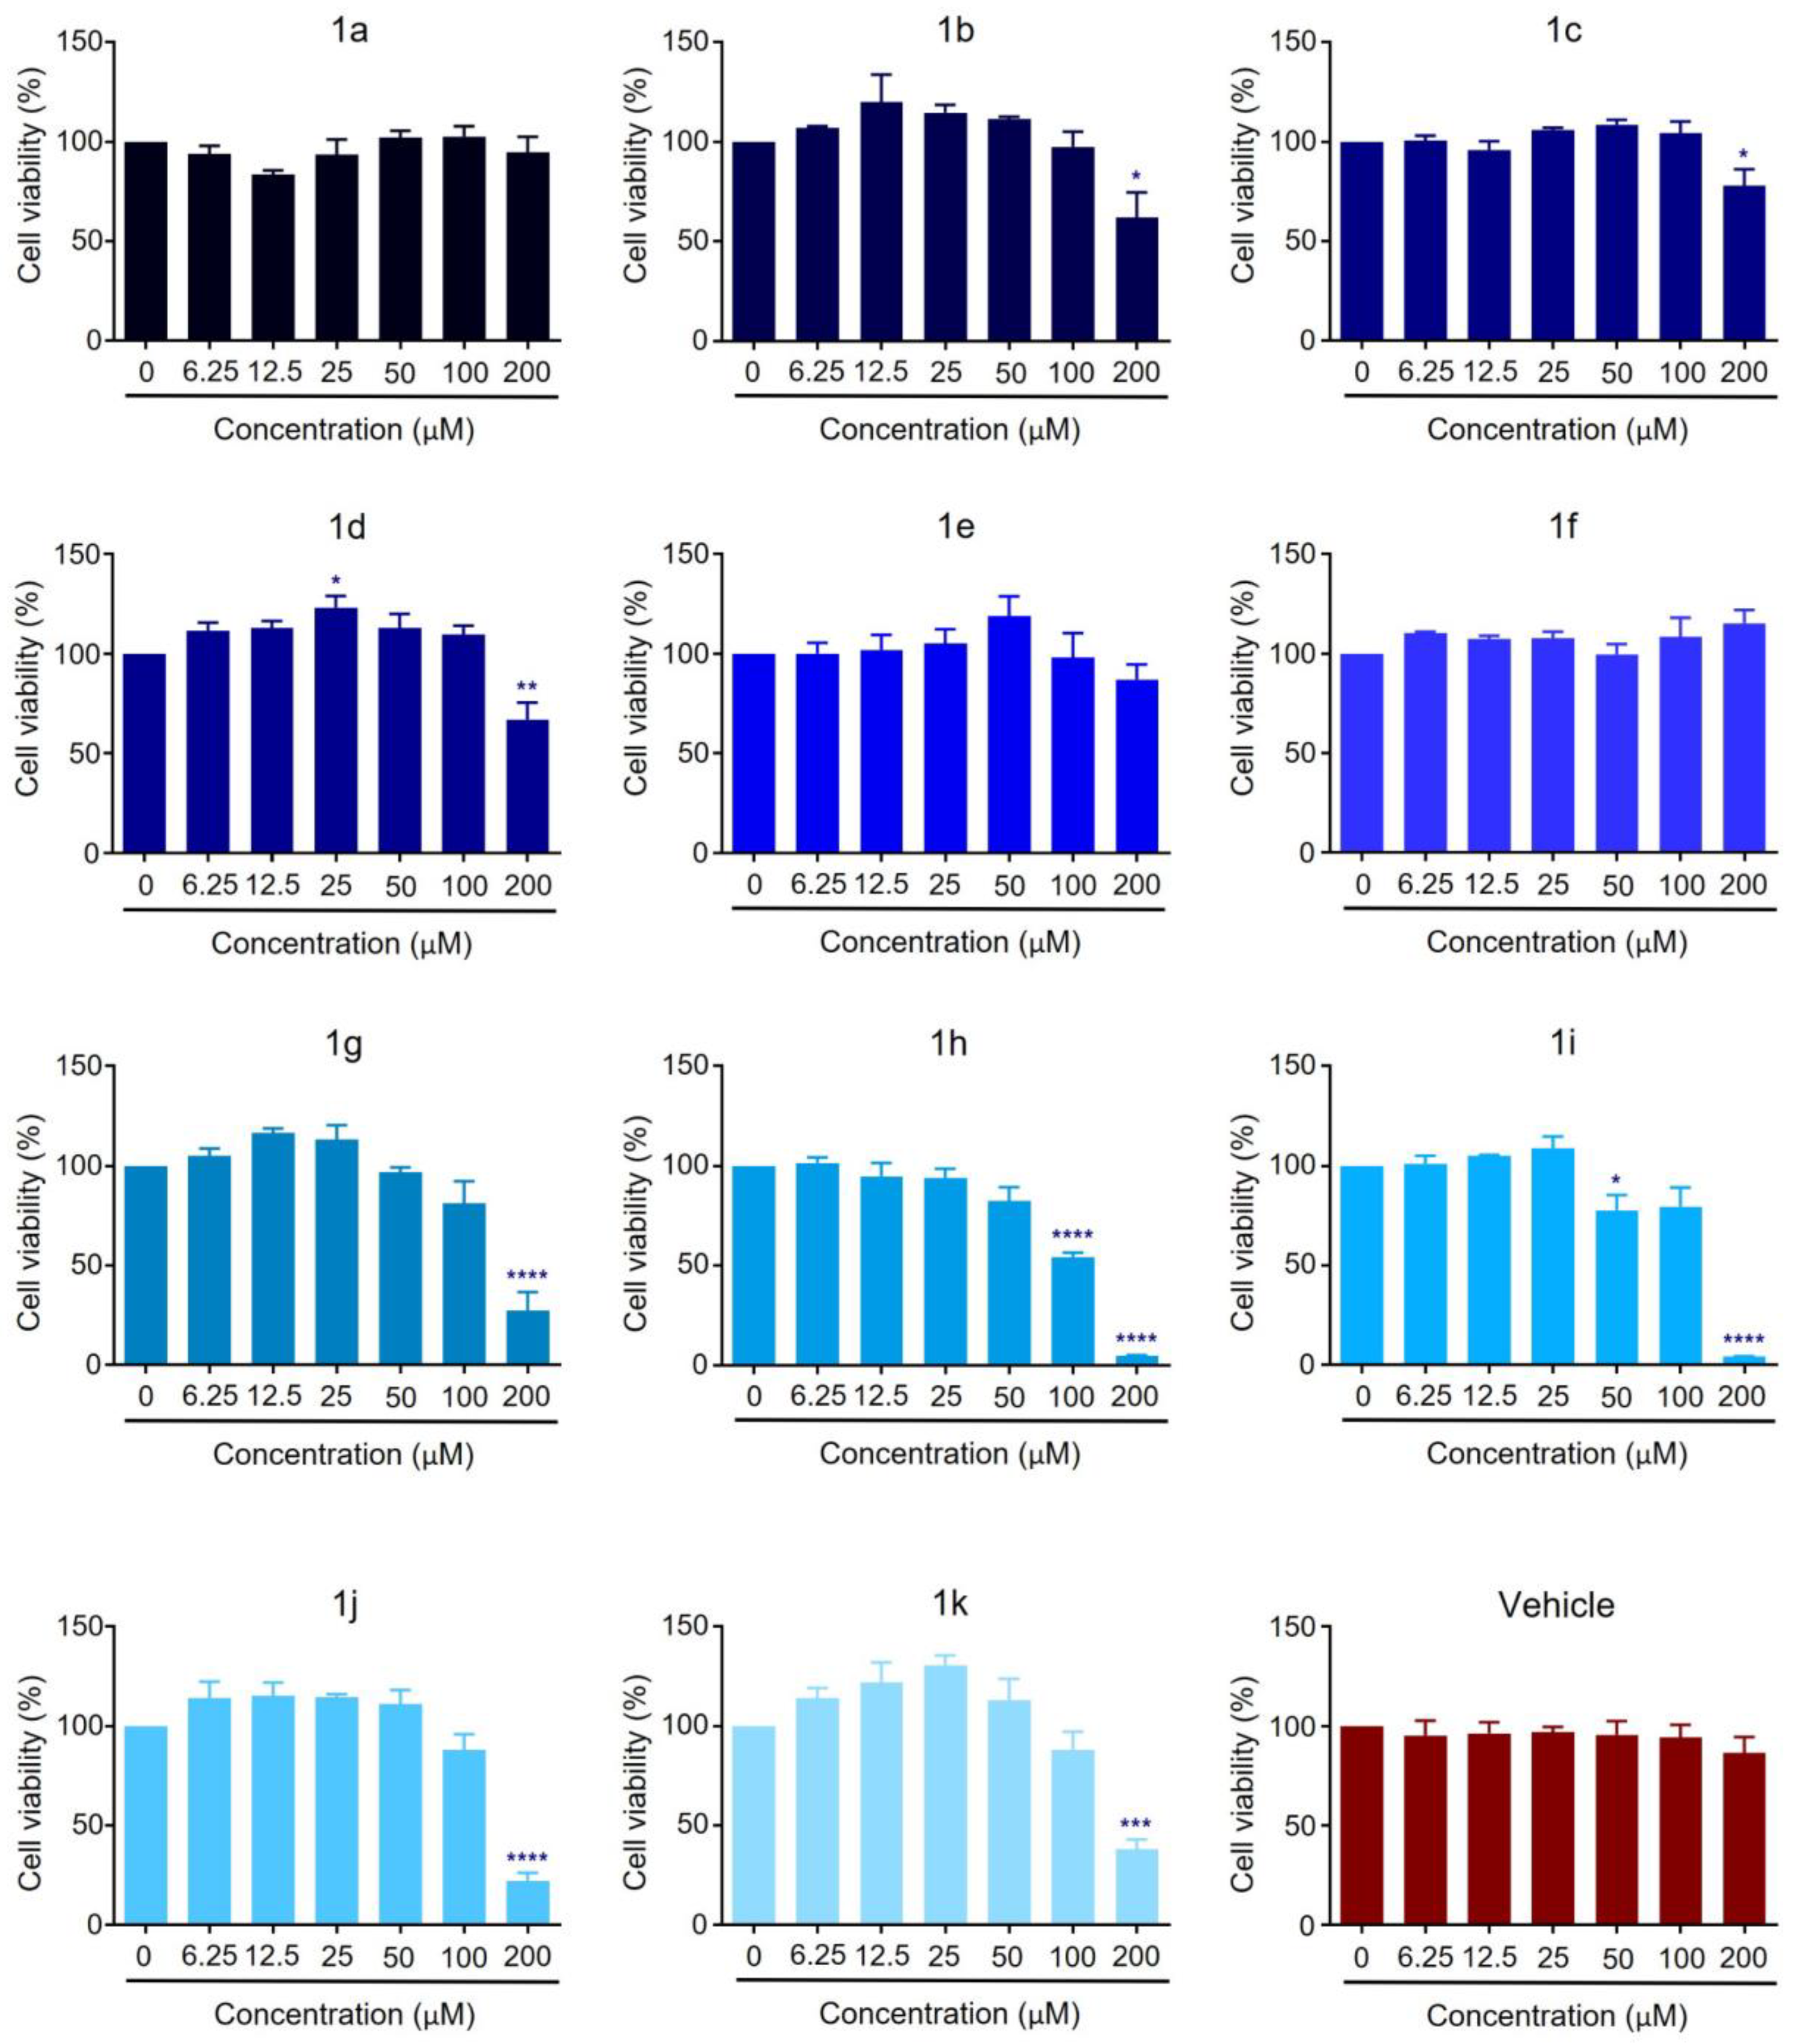
In particular, in the MCF-7 breast cancer cell line, compound 1i decreased cell viability at 50 μM, 1h at 100 μM, and 1b, 1c, 1d, 1g, 1j, and 1k at 200 μM. However, compounds 1a, 1e, and 1f had no significant effect on cell viability.
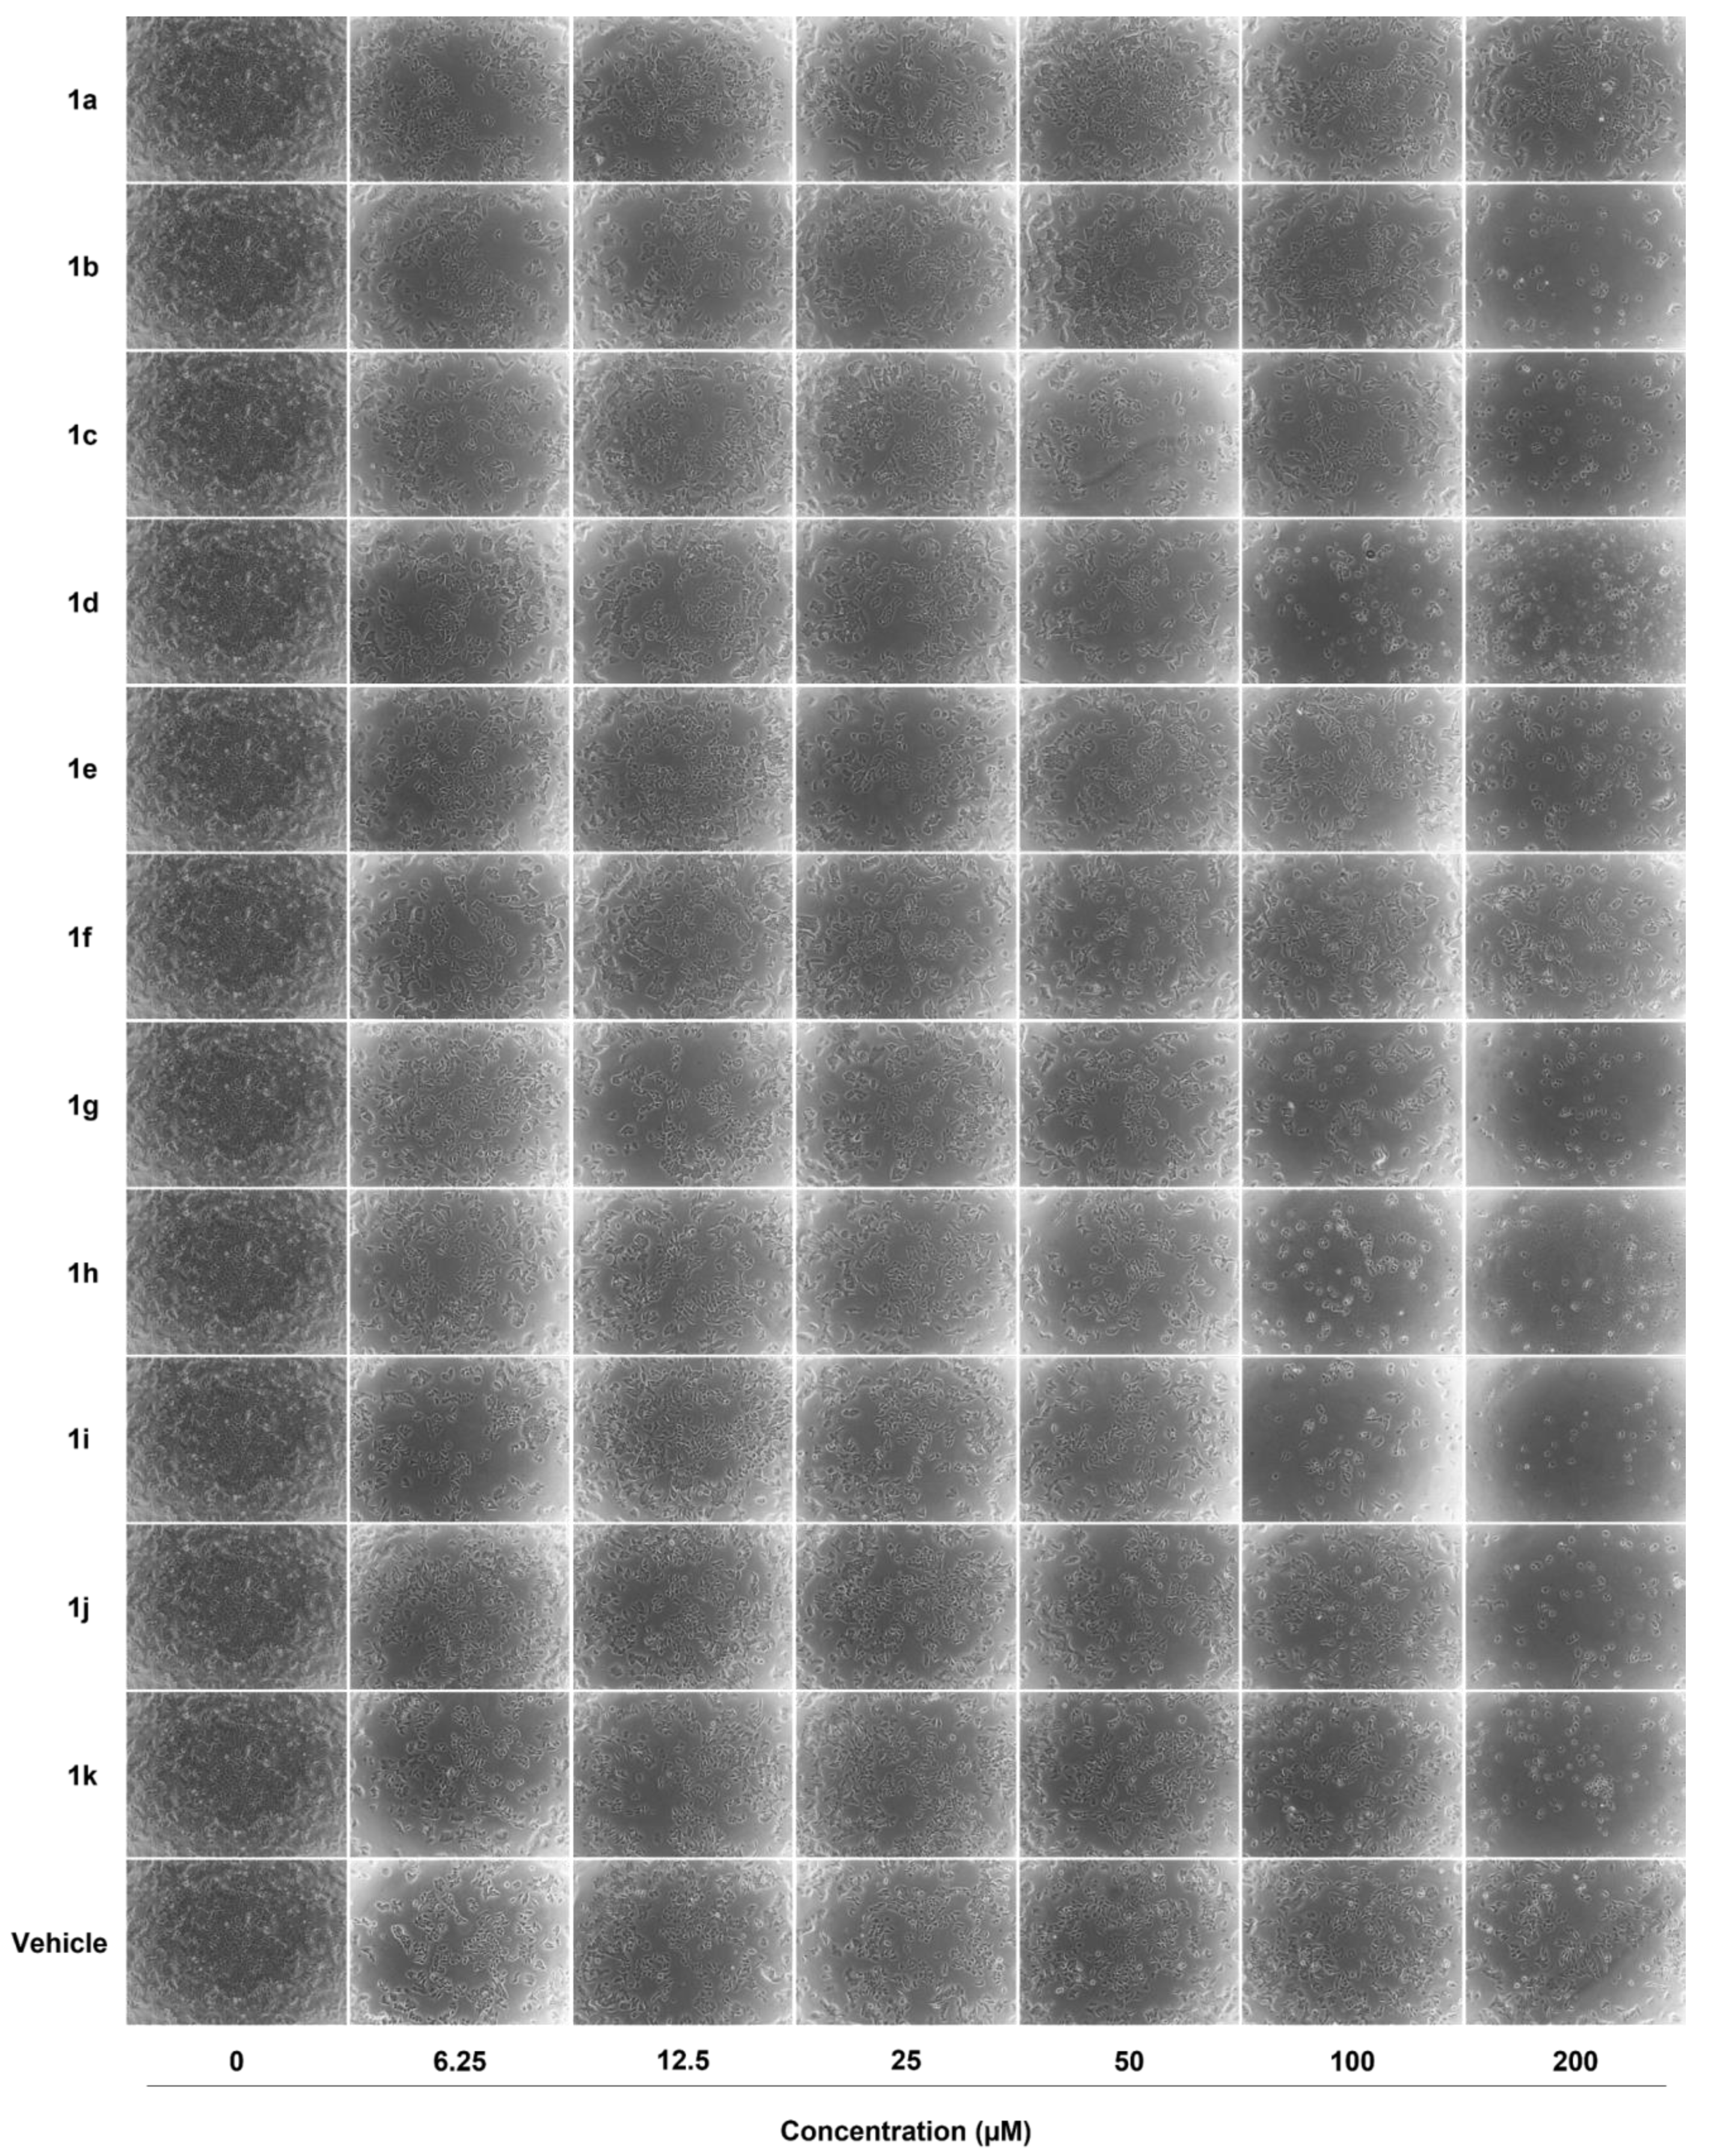
When photographs were taken of MCF-7 cells treated with different concentrations of the compounds 1a1k, effects were observed only at 100 and 200 μM with 1b, 1c, 1e, 1g, 1h, 1i, 1j, and 1k (Figure 3 and Figure 4). Interestingly, unlike MDA-MB-231 cells, where we observed effects from low concentrations, the effects in the MCF-7 cell line were seen only at high concentrations.
With the data obtained from the cell viability assays of the breast cancer cell lines MDA-MB-231 and MCF-7, the IC50 values were determined for all synthesized compounds with ranges from 0 to 200 µM. Of all the compounds tested, the lowest IC50 doses in MDA-MB-231 cells were for compounds 1f, 1i, and 1d (Table 1). Interestingly, no significant effects were observed with any compound in the MCF-7 breast cancer cell line. These data suggest that compound 1f has the most anticancer activity and that it is specific for MDA-MB-231 triple-negative breast cancer cells.
The importance of assessing cell viability in MDA-MB-231 and MCF-7 cancer cells treated with different concentrations of compounds 1a1k is due to the presence in their chemical structure of the pyrrolo[3,4-b]pyridin-5-one series, which is a fused-type polyheterocyclic system and is an aza-analogue of the isoindoline-1-one core [16]. Isoindolin-1-one has been described as the structural core of several natural and synthetic anticancer agents [17]. Moreover, in various recently published works, isoindolin-1-one related heterocyclic compounds have been tested against cancer cell lines [18,19,20,21]. In this sense, it was likely that the compounds could have biological activity by decreasing viability of mammary cancer cells +ER and +PR, and TNBC cells. Interestingly, in our study, the compounds tested had different effects depending on the cell line. Indeed, it was found that the compound with the highest biological activity in TNBC MDA-MB-231 cells was 1f, decreasing cell viability from the lowest concentration used (6.25 µM). According to the structural substituents of all molecules, compound 1f is the only one with sulfur atoms in its structure. Different studies have reported that sulfur is present in many compounds with biological activities, including anticancer properties, because it decreases cell proliferation and, therefore, metastasis in various cancer cell lines such as prostate cancer, murine colorectal cancer, and lung carcinoma [22,23].
On the other hand, an analysis was also performed with compounds 1a1k using the SwissTargetPrediction (Ver. 2019) and PASS-Protein-Target (Ver. 2.0) platforms. It was found that compound 1f may interact with proteins such as PI3K, which is a key regulator in growth, progression, survival, metabolism, protein synthesis, and angiogenesis of breast cancer; likewise, it can also participate in the risk of resistance to endocrine therapy and chemotherapy [24]. MAPKs are another essential family of proteins related to tumor progression [25,26]. Likewise, 1f can interact with CDK4, one of the regulatory proteins of cell cycle progression [27]. Indirectly, it can also interact with hypoxia-inducible factor-1-α (HIF-1-α), which facilitates the adaptation of cancer cells to hypoxic conditions, allowing tumor cells to survive during metabolic stress and enter a prolonged state of tumor dormancy [28].

2.3. In Silico Studies

2.3.1. Multi-Target Molecular Docking

The use of molecular docking simulations with organic compounds as inhibitors against numerous proteins is well known and often applied in both industrial and laboratory contexts. The purpose of these simulations is to minimize temporal intervals, decrease costs, and optimize research endeavors [29,30,31]. In the present investigation, molecular docking and MD techniques were used to ascertain and to authenticate inhibitors targeting diverse protein targets. A screening method was performed to identify possible protein targets for the compounds 1a1k using SwissTargetPrediction and PASS-Protein-Targets [32,33,34,35]. A total of 20 potential targets were identified in this study (Table S2, electronic Supplementary Material), each with a probability (P) greater than 0.8. Among these protein targets, 15 were found to be water-soluble proteins, including AKT1 (PDB-ID: 5KCV), CYP2C9 (PDB-ID: 1R9O), CYP3A4 (PDB-ID:8EXB), p38α (PDB-ID: 6SFI), CTSS (PDB-ID: 2FRA), Cdk2/CA (PDB-ID: 2R3F), Cdk2/CE (PDB-ID: 7E34), IDE (PDB-ID: 6EDS), CDK4 (PDB-ID: 2W9Z), MAPK8 (PDB-ID: 5IU2), CTSL (PDB-ID: 8C77), DUSP3 (PDB-ID: 3F81), MAPK3 (PDB-ID: 3FHR), KRAS (PDB-ID: 7SCX), and cTn (PDB-ID 4Y99). Additionally, five membrane proteins were identified as potential targets, namely 5-HT6 (PDB-ID: 7XTB), mGluR2 (PDB-ID: 7EPF), ghrelinR (PDB-ID: 7NA8), H3 (PDB-ID: 7F61), and Ox2R (PDB-ID: 6TPN).
A thorough target analysis demonstrates that pyrrolo[3,4-b]pyridin-5-one could interact with a significant number of proteins implicated in cancer-related disorders. In this context, it is plausible that compounds 1a1k may exhibit inhibitory properties akin to those observed in antineoplastic drugs. Therefore, these compounds may be identified as potential candidates for utilization in breast cancer therapy.
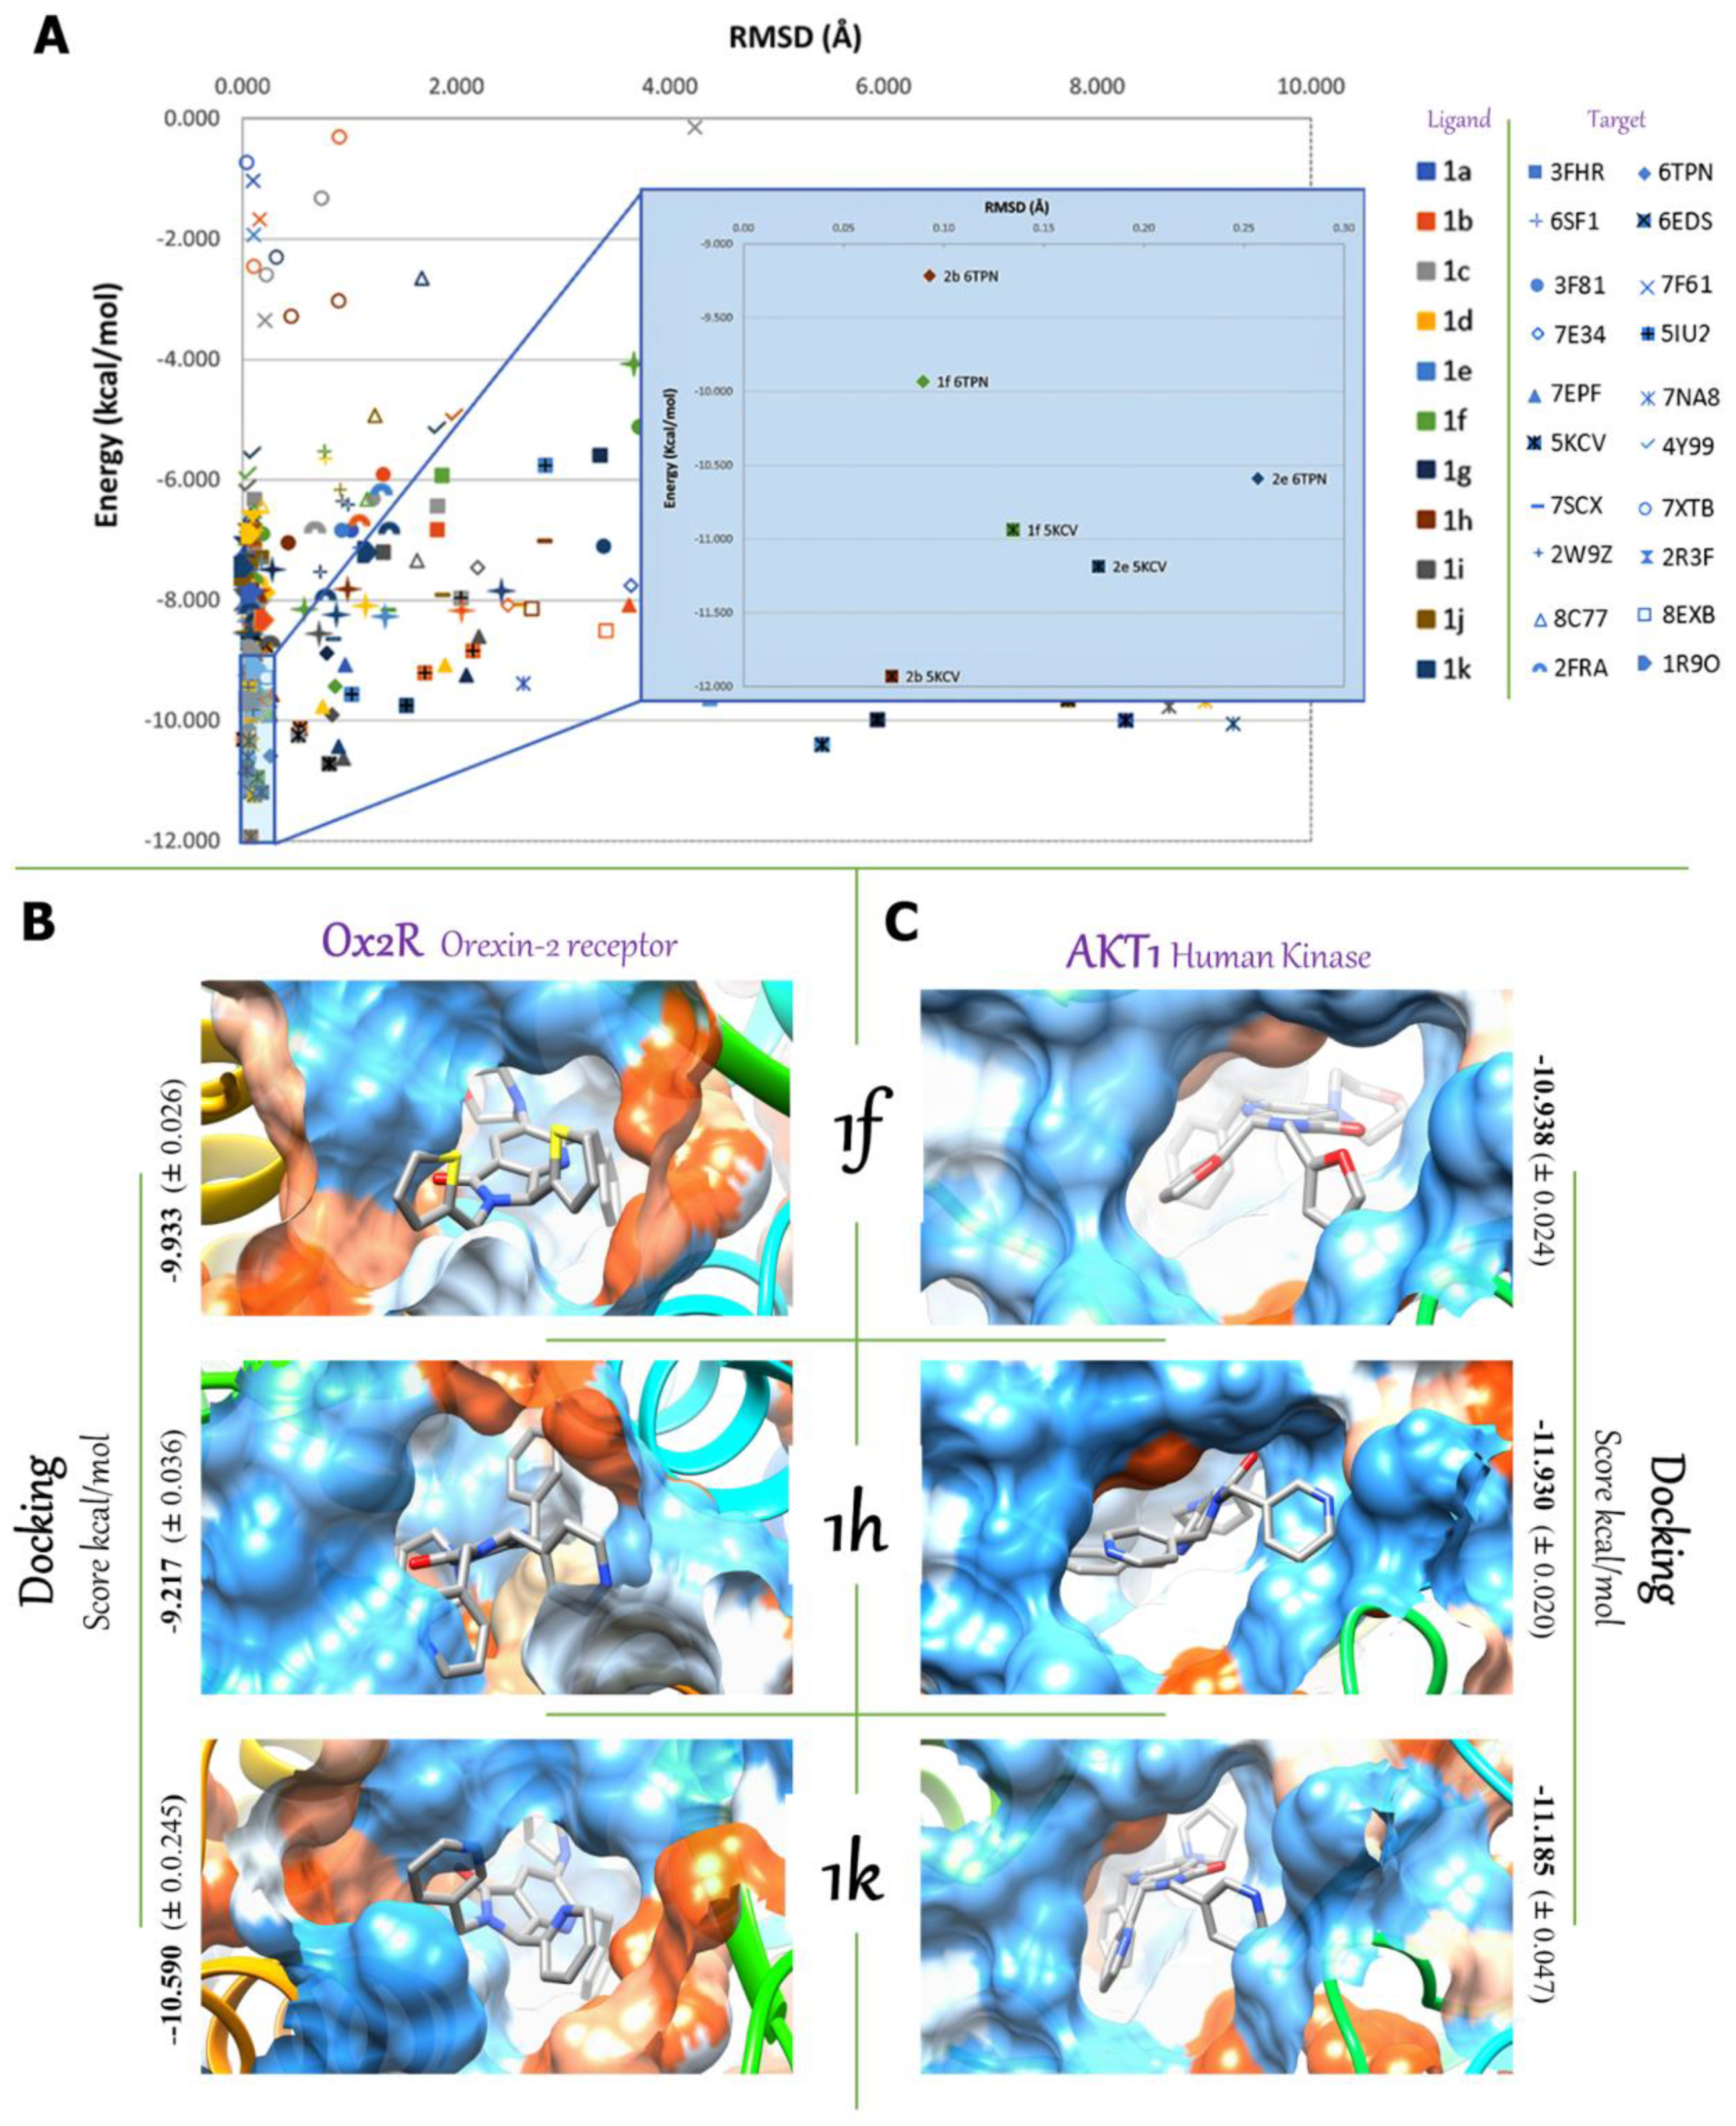
Breast cancer, a prominent contributor to female cancer-related mortality, frequently exhibits metastatic tendencies, disseminating across several anatomical sites. The primary aim of the computational research performed herein is to ascertain efficient approaches for identifying molecules exhibiting optimal binding possesses, utilizing docking scores as a basis for the evaluation. The task of determining the appropriate conformation of a ligand–protein complex in a computational molecular framework is accompanied by difficulties related to different docking techniques [36,37,38,39,40,41,42]. To investigate this matter, compounds 1a1k were subjected to individual docking simulations against each of the 20 possible protein therapeutic targets. The procedure encompassed the application of three scoring functions, afterwards followed by the re-evaluation of docking through the utilization of Autodock Vina. The findings unveiled a spectrum of interaction score energy values for all compounds, ranging from −7.00 to 12.00 kcal/mol (Table S3). The docking clusters are depicted in Figure 5A, wherein the lower-left quadrant contains the most advantageous binding pose. These poses are chosen based on the lowest root mean square deviation (RMSD), lowest energy score, and high cluster populations.
Then, predictions were made regarding the ADMETox characteristics of compounds 1a1k. This analysis involved the utilization of models that incorporate medicinal chemistry features, pharmacokinetics, drug likeness, and toxicity profiles. The analysis was performed using machine-learning techniques included in Protox-II and SwissADME. In the methodology for performing MD simulations, we opted for molecules that demonstrated favorable docking scores, desirable drug-like characteristics (Table S4), and low IC50 values. As a result, compounds 1f, 1h, and 1k were found to meet these criteria and demonstrated the highest positive rankings upon evaluation against the therapeutic targets Ox2R and AKT1.
AKT1 has been identified as a crucial regulator of key aspects of cancer and metastasis, resulting in a growing interest in its potential as a therapeutic target [43,44]. In addition, the OX2R receptor, which exhibits an absence of expression in healthy cells but is present in breast cancer cells, has emerged as a highly promising contender for targeted cancer therapy. The complete investigation of its possible significance in cancer cells must be undertaken. A thorough comprehension of these functions may be pivotal for advancing breast cancer therapy [10,45,46].
The main structure of AKT1 (UniProt: P31749) consists of two structural domains (Figure S24): the first encompasses a Pleckstrin Homology (PH) domain, spanning residues 6 to 105. The second domain includes residues 150 to 447 and is characterized by a conserved kinase domain. The N-Lobe (residue 144 to 230) and C-Lope motifs (residue 230 to 444), along with the G-loop (residue 157 to 162) and the activation loop (residue 350 to 360), come together to form this kinase domain. Our research primarily investigated the allosteric cavity generated between the PH and kinase domains. The presence of an allosteric pocket can confer benefits to our compounds in relation to AKT1 [44]. The utilization of an allosteric pocket provides a distinctive advantage over ATP-competitive inhibitors. Ox2R (UniProt: O43614) is composed of seven helical transmembrane segments (TM1 to TM7) that are interconnected by three intracellular loops (ICL1 to ICL3) and three extracellular loops (ECL1 to ECL3). The Ox2R variant with a truncated intracellular loop 3 (ICL3) was employed in this investigation (Figure S25), and the Ox2R target was constructed using the structural data provided by Asada et al. in 2022 (PDB-ID: 7XRR).
According to the docking results (Table S3) the compounds 1f, 1h, and 1k had the highest evaluation with the lower interaction score energy of −9.933, −9.217, and −10.59 kcal/mol, respectively, when evaluated against Ox2R. Similarly, these compounds achieved scores of −10.938, −11.930, and −11.185 kcal/mol, respectively, when assessed against AKT1. The findings from in silico molecular coupling investigations targeting AKT1 indicate that compounds 1f, 1h, and 1k have potential as tyrosine kinase allosteric inhibitors (AKT1-aIs). In the same manner, the aforementioned compounds exhibit inhibitory properties towards Ox2R, a GPCR receptor that is uniquely expressed in breast cancer cells and not in non-tumor cells [10,46], indicating that Ox2R has significant potential as a target for cancer treatment. Figure 5B displays the best docking pose inside the active sites of AKT1 and Ox2R with a conformational plasticity in the pocket. To date, our research has shown the potential of compounds 1f, 1h, and 1k as viable candidates with pro-apoptotic and antiproliferative properties, with notable low IC50 values. The ADMETox evaluation (Table S4) of compound 1f revealed that it exhibits favorable characteristics compared to compounds 1h and 1k. Furthermore, compound 1k displayed a higher toxicity than compound 1h. However, it is crucial to emphasize that compound 1k exhibits the most advantageous MCF-7/MDA-MB-231 IC50 ratio, which is valued at 1.59. The importance of this ratio lies in its capacity to enable the identification of compounds that have the potential to operate as anticancer agents, capable of affecting both cell lines at a lower dosage. In this way, 1f has been evaluated and classified as a Class V chemical, indicating that it has the potential to cause damage if ingested, with an LD50 that falls within the range of 2000 to 5000 mg/kg, indicating moderate toxicity. Furthermore, it exhibits a high level of absorption in the gastrointestinal tract, complies with Lipinski’s rule of five, and does not penetrate the blood–brain barrier. In contrast, it is possible for the compounds 1h and 1k to overcome this barrier and be categorized as Class III drugs, which are specifically identified as “toxic if consumed” (50 < LD50 ≤ 300). Regarding the ligand endpoints targeting toxicity, nuclear receptors, and stress pathways, it is projected that all three compounds will exhibit inactivity.
Figure 5A illustrates clustering graphs that indicate distinct groupings for each protein–ligand system. Each point within the graphs represents an individual cluster. The figure shows a magnified depiction of the energy scores that are optimally positioned in relation to the RMSD of the clusters with the highest population. Significantly, the interactions of 1f, 1h, and 1k with AKT1 and Ox2R demonstrate a strong correlation between scoring energy and RMSD, suggesting a substantial binding affinity. Figure 5B depicts the spatial arrangements of 1f, 1h, and 1k within the cavities of the Ox2R and AKT1 target proteins. The energy scores associated with each molecule are presented alongside their respective orientations. The atom–ligand pairs are visually distinguished by color, as carbon is shown as gray, nitrogen as blue, oxygen as red, and sulfur as yellow. The region surrounding the ligands within the pocket is primarily characterized by hydrophobic properties, as indicated by the blue color. Conversely, the remaining surface of the pocket exhibits polar characteristics, represented by the orange color. Nevertheless, the depth of the pocket is of such a magnitude that it poses a considerable challenge in terms of visualizing the entirety of its surface. By directing attention only to the pocket region, a more distinct exterior perspective can be achieved.

2.3.2. Molecular Dynamic Simulation Studies of 1f, 1h, and 1k on AKT1 and Ox2R

Thus far, it has been established that compounds 1f, 1h, and 1k demonstrate positive binding scores with AKT1 and Ox2R target proteins, together with moderately hazardous IC50 values at experimentally determined inhibitory dosages. To determine the accurate conformations of the ligands and examine the impact of conformational alterations on side chains during recognition processes, as well as to obtain a deeper understanding of the interaction energies and mechanisms that govern the interactions between ligands and the target proteins, a series of three individual simulations (replicas) were performed for each ligand/protein system. Each simulation had a duration of 100 ns. To ensure the representativeness of the population for energy calculations, we combined the final 80 ns of each replica. Following that, we conducted a clustering analysis to categorize conformational states that exhibited similarity in the simulations and so minimize structural variation.
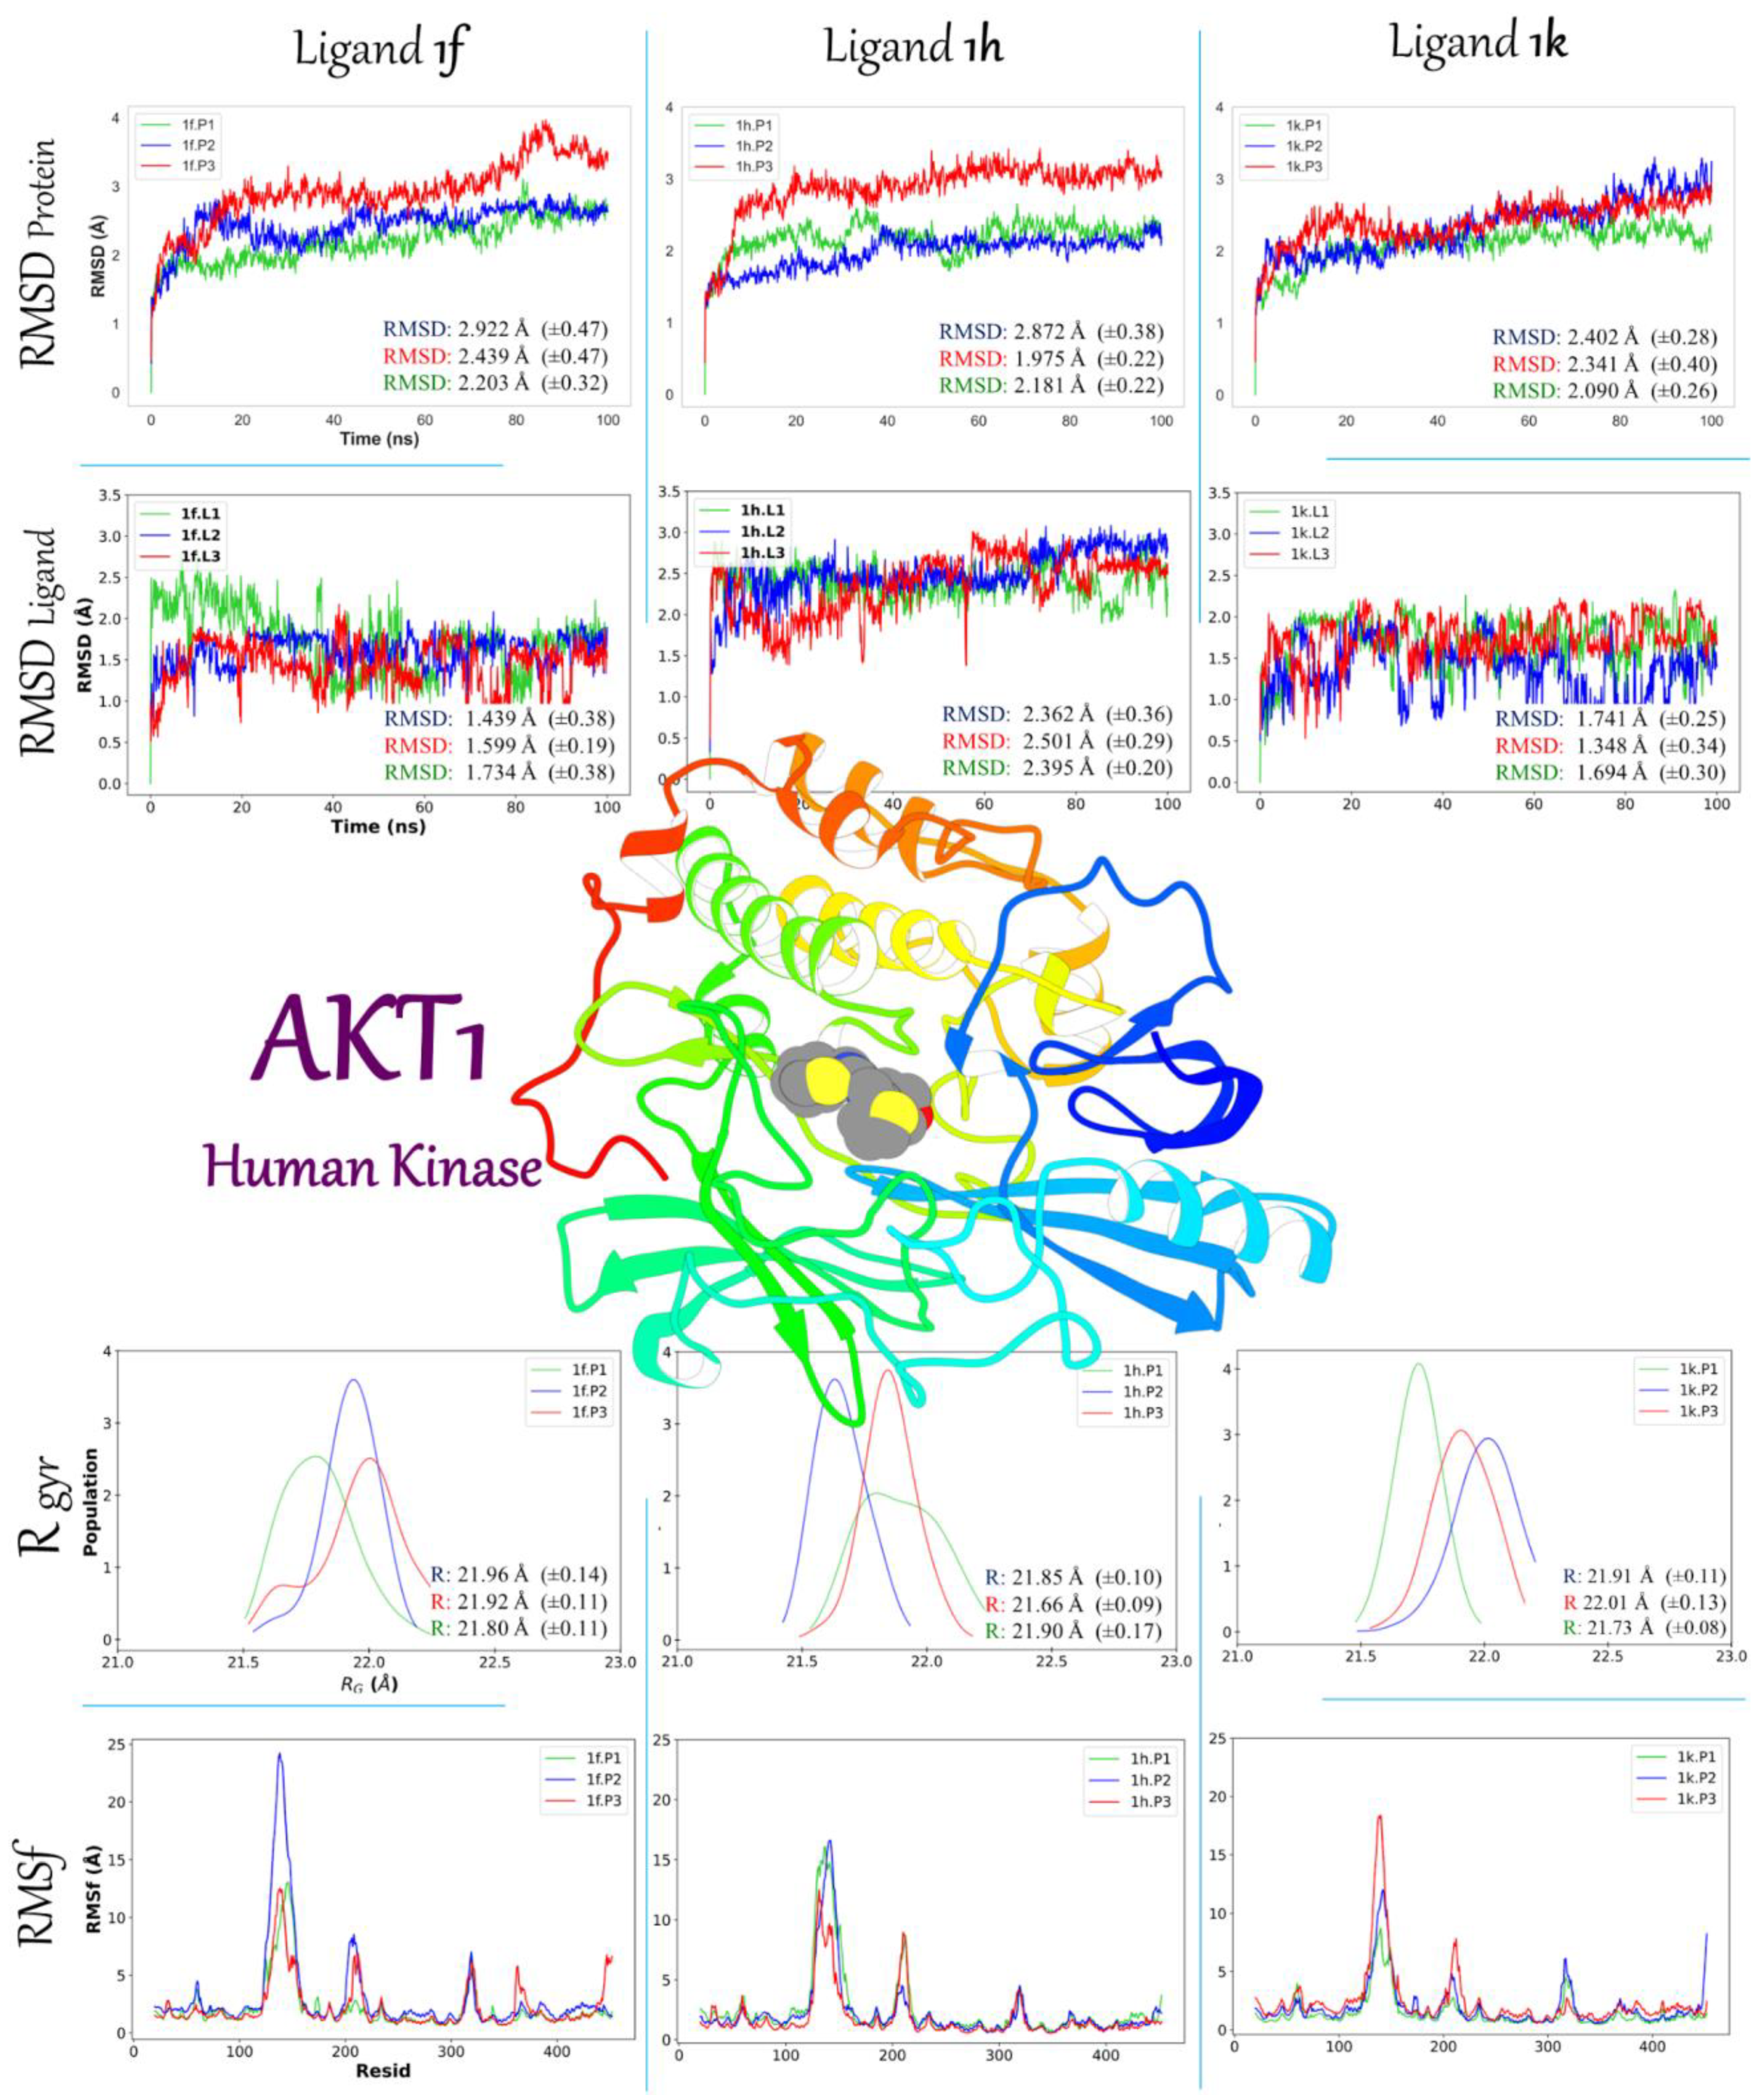
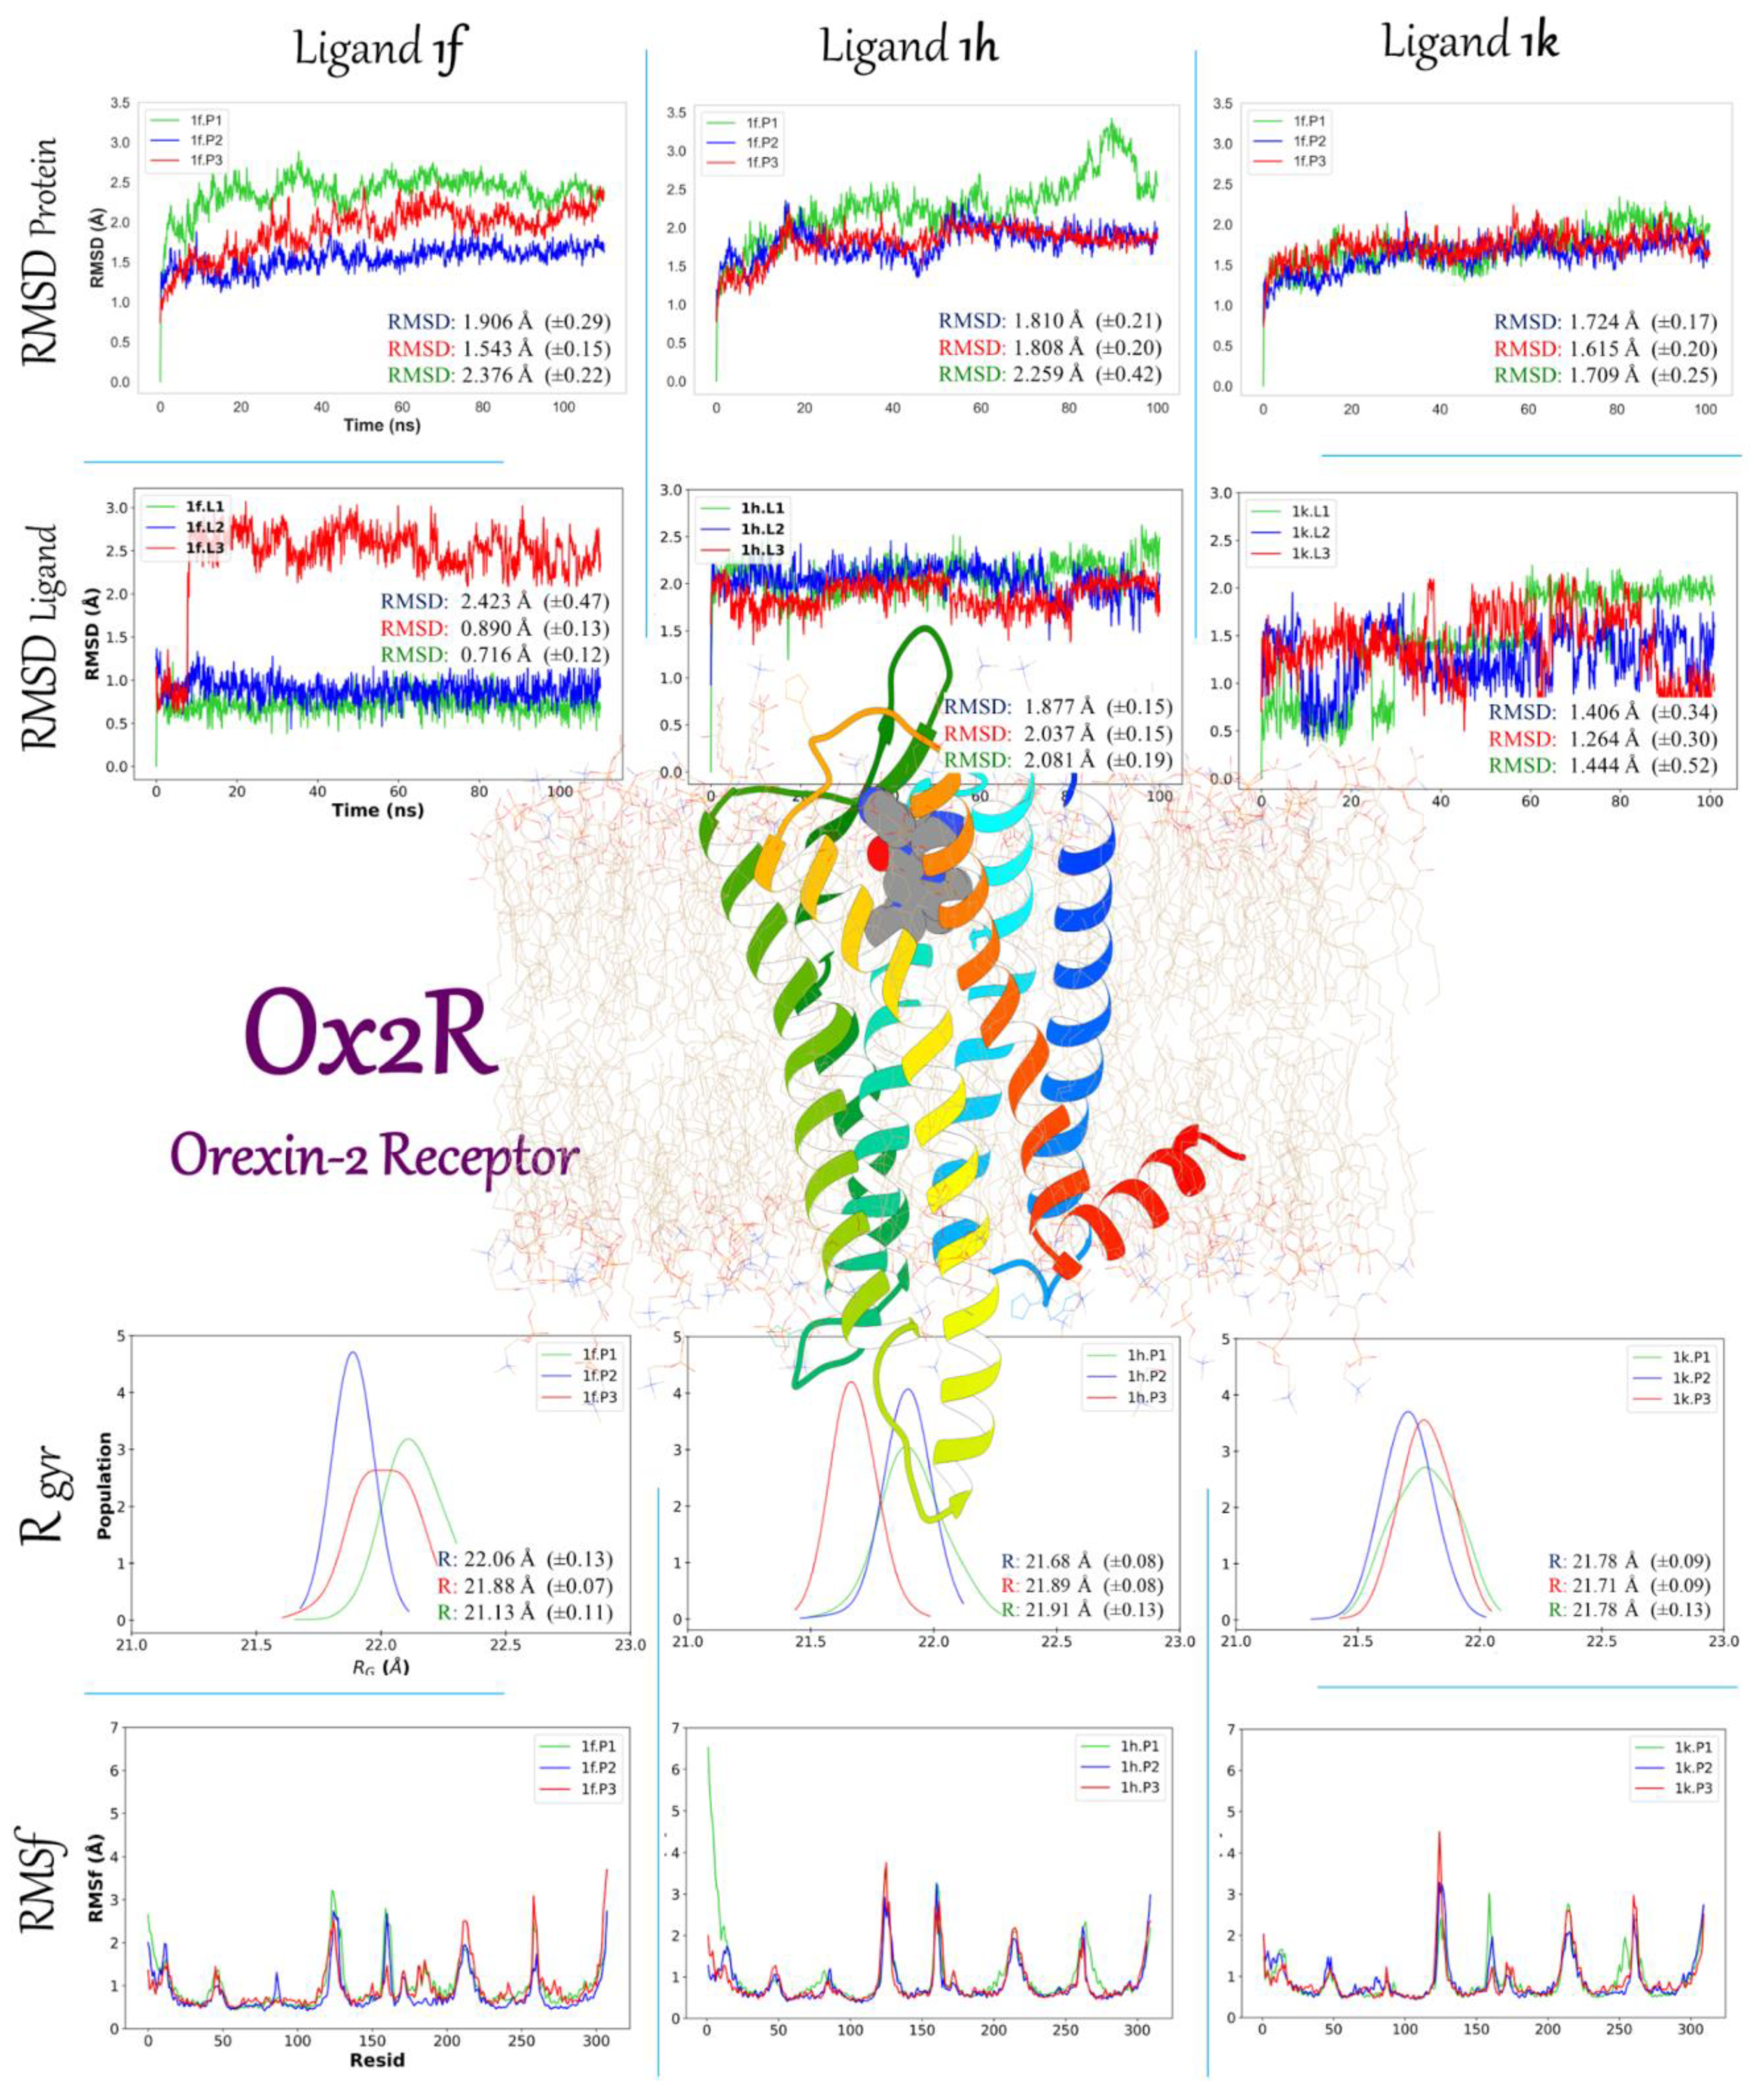
The RMSD findings, as depicted in Figure 6 and Figure 7, indicate that the simulations attain stability starting from 20 ns, apart from one of the three replicas performed for the 1f/AKT1 system (Figure 6, blue line), 1k/AKT1 system (Figure 6, red line), and 1h/Ox2R system (Figure 7, green line). This observation suggests that these replicas may have experienced either a lack of stabilization or demonstrated more significant variations in comparison to the remaining two replicas. In this context, it is shown that systems incorporating the AKT1 protein exhibit RMSD values below 4 Å, while systems containing Ox2R demonstrate RMSD values below 3.5 Å (Table S5). Consequently, all trajectories were incorporated into the clustering procedure. Similar trends were detected in a ligand RMSD study, akin to those observed in protein RMSD analysis. As illustrated in Figure 6, compound 1k exhibits fluctuations that are correlated with those of AKT1. Compound 1f displays an imbalance noticed in the final 20 ns that matches with the sudden increase in the protein RMSD. With respect to the second replica of 1f/Ox2R, as seen by the blue line in Figure 7, it is evident that 1f experiences a displacement, which is likely attributable to a rotating motion occurring within the binding site. No ligand RMSD systems surpassed 3 Å. Hence, despite the presence of noticeable visual variations in certain replicas, the ligands consistently maintained their position within the binding pockets. It is worth mentioning that there is an observable association between the movements of ligands within the cavity and the mechanical motions of the protein. This implies the presence of a useful stimulus–response relationship.
The graphical representations (Figure 6) within the study illustrate the protein–RMSD (alpha-carbon), ligand–RMSD, root mean square fluctuations (RMSf), and normalized distribution of the radius of gyration (Rgyr) across a simulated time period of 100 ns in each replicate of every one of the systems. The replicates are distinguished by distinct colors, with replicate 1 represented by blue, replicate 2 denoted by red, and replicate 3 indicated by green. To minimize the possibility of incorrect interpretation, the first graph for each descriptor is provided with axis labels. The central region of the diagram illustrates the AKT1 target protein’s structure using cartoon representations. Additionally, the 1h ligand has been added into the allosteric binding pocket.
Minor alterations were detected in the variations of individual amino acid’s RMSf. In the context of AKT1 (Figure 6), it is seen that the linking-loop connecting the PH domain to the kinase domain displays significant oscillations, with a maximum amplitude of 25 Å. This suggests that the linking-loop has the capacity to assume many conformations, including open, closed, or intermediate states (Movie S1, see page S60 on Supplementary Material) during the interaction with AKT1-aIs, which may have the capacity to modulate cell signaling downstream. Regarding Ox2R, the RMSf demonstrates the stability of the six transmembrane helices and the occurrence of high-rate oscillations in the interconnecting loops (Movie S2). Nevertheless, the analysis of TM5 reveals slight fluctuation variations in two replicas during the interaction of Ox2R with 1f. The limited extent of variations seen in the remaining systems implies a state of inactivity that maintains stability throughout oscillations in MD. Nonetheless, it is worth noting that all three systems display alterations in the structure of TM5, TM6, TM7, and H8 (Figure S26). Moreover, the results demonstrate that compounds 1f, 1h, and 1k exhibit an influence on the conformational alterations occurring in the sidechains of the active pockets, interdomain linking loops in AKT1, and the transmembrane domains (TMs) in Ox2R. These findings may offer a possible rationale for the observed lowered IC50 values.
Regarding the acquired data, Rgyr is a metric utilized to assess the protein’s dynamic behavior, specifically its changes in structural compactness, which can be interpreted as expansions or contractions in its total globular size. Figure 6 and Figure 7 illustrate the varying Rgyr values observed for the AKT1 and Ox2R structures, exhibiting oscillations within the range of 21.5 to 22.0 Å for both systems (Table S5).
The internal graphics (Figure 7) illustrate the protein–RMSD (α-carbon), ligand–RMSD, RMSf, and normalized distribution of Rgyr across a simulated time of 100 ns in each replicate of every system. The replicates are distinguished by their respective colors, with blue representing replicate 1, red representing replicate 2, and green representing replicate 3. To minimize the possibility of incorrect interpretation, the first graph for each descriptor is provided with axis labels. The central region of the diagram illustrates the Ox2R target protein’s structure in cartoon representations, whereby a 1k ligand has been introduced into the active pocket.
Into two AKT1 replicas, there is an observed phenomenon of a widened distribution of the population bell curve or the presence of two distinct populations. This observation cannot be attributed to a denaturation state. One instance illustrating this behavior is replica 2 (Figure 6, red line) pertaining to ligand 1f, wherein the observed variations arise from the movements of the linking-loop (Movie S1) between PH and kinase domains. The observed variations could potentially be attributed to the allosteric dynamics of inhibited AKT1. In the context of Ox2R, the population oscillations observed for Rgyr are shown to be constant and similar between replicates. Nevertheless, the systems undergo the most sudden alterations when Ox2R encounters ligand 1f. Within this particular setting, it is possible that ligand 1f elicits disturbances in the dynamic “breathing” fluctuations of Ox2R. These perturbations may align with its function as an inhibitor in the process of Ox2R inactivation, thereby suppressing its signaling functions.

2.3.3. Binding Free Energy 1f, 1h, and 1k

The MD simulations were employed to understand the binding interactions between the compounds (1f, 1h, and 1k) with target proteins (AKT1 and Ox2R) [47,48,49]. Hence, the computational method known as MM/GBSA was employed to calculate the interaction binding energy between compounds 1f, 1h, and 1k and the proteins AKT1 and Ox2R. This method is recognized for its cost-effective nature [50,51,52]. The clustering analysis was performed on the three concatenated replicates across the final 80 ns of each simulation. Following the clustering approach, the cluster with the highest population, which accounted for at least 75% of the combined simulation dataset consisting of 1800 randomly selected structures, was further analyzed using the MM/GBSA method.
Based on the computed interaction energies, it can be inferred that the complexes involving putative compounds 1f, 1h, and 1k exhibit stabilization mostly due to non-polar contributions (Table 2), when interacting with the protein therapeutic targets. In the context of AKT1, compound 1f was observed to bind to the allosteric pocket with an interaction energy of −18.48 kcal/mol. Comparatively, the similarity compounds 1h and 1f exhibited interaction energies of −19.50 and −26.42 kcal/mol, respectively. Regarding the Ox2R inhibitor, it was observed that compound 1f had a binding affinity of −14.26 kcal/mol towards the active site. Similarly, compounds 1h and 1k displayed binding affinities of −23.62 and 23.06 kcal/mol, respectively. The interaction energy of both systems was found to exhibit contributions from Van der Waals (vdW) forces ranging from 45 to 55 kcal/mol. In contrast, the electrostatic contributions varied from −5 to −25 kcal/mol. These results suggest that the vdW contributions were more energetically advantageous in comparison to the electrostatic contributions (Table 2).
The positive contribution of the polar interaction energy presents a drawback in the interaction process due to its positive contribution, which varies from 35 to 55 kcal/mol (Table 2). Within this framework, the non-polar nature of ligands 1f, 1h, and 1k gives rise to the possibility of transitory electron shifts. These shifts lead to the formation of temporary dipoles and play a crucial role in determining the attractive forces between the side chains of the pocket targets and the inhibitors. The compounds under investigation possess a chemical composition characterized by a substantial electron count, rendering them very susceptible to polarization. This inherent property, in conjunction with hydrophobic interactions, provides a plausible explanation for the inhibitors’ affinity towards the binding sites associated with the AKT1 and Ox2R targets. Our findings demonstrate that ligands 1f and 1k prefer acting as allosteric inhibitors of AKT1. Additionally, ligand 1h may be suggested as an inhibitor (inverse agonist) of Ox2R.
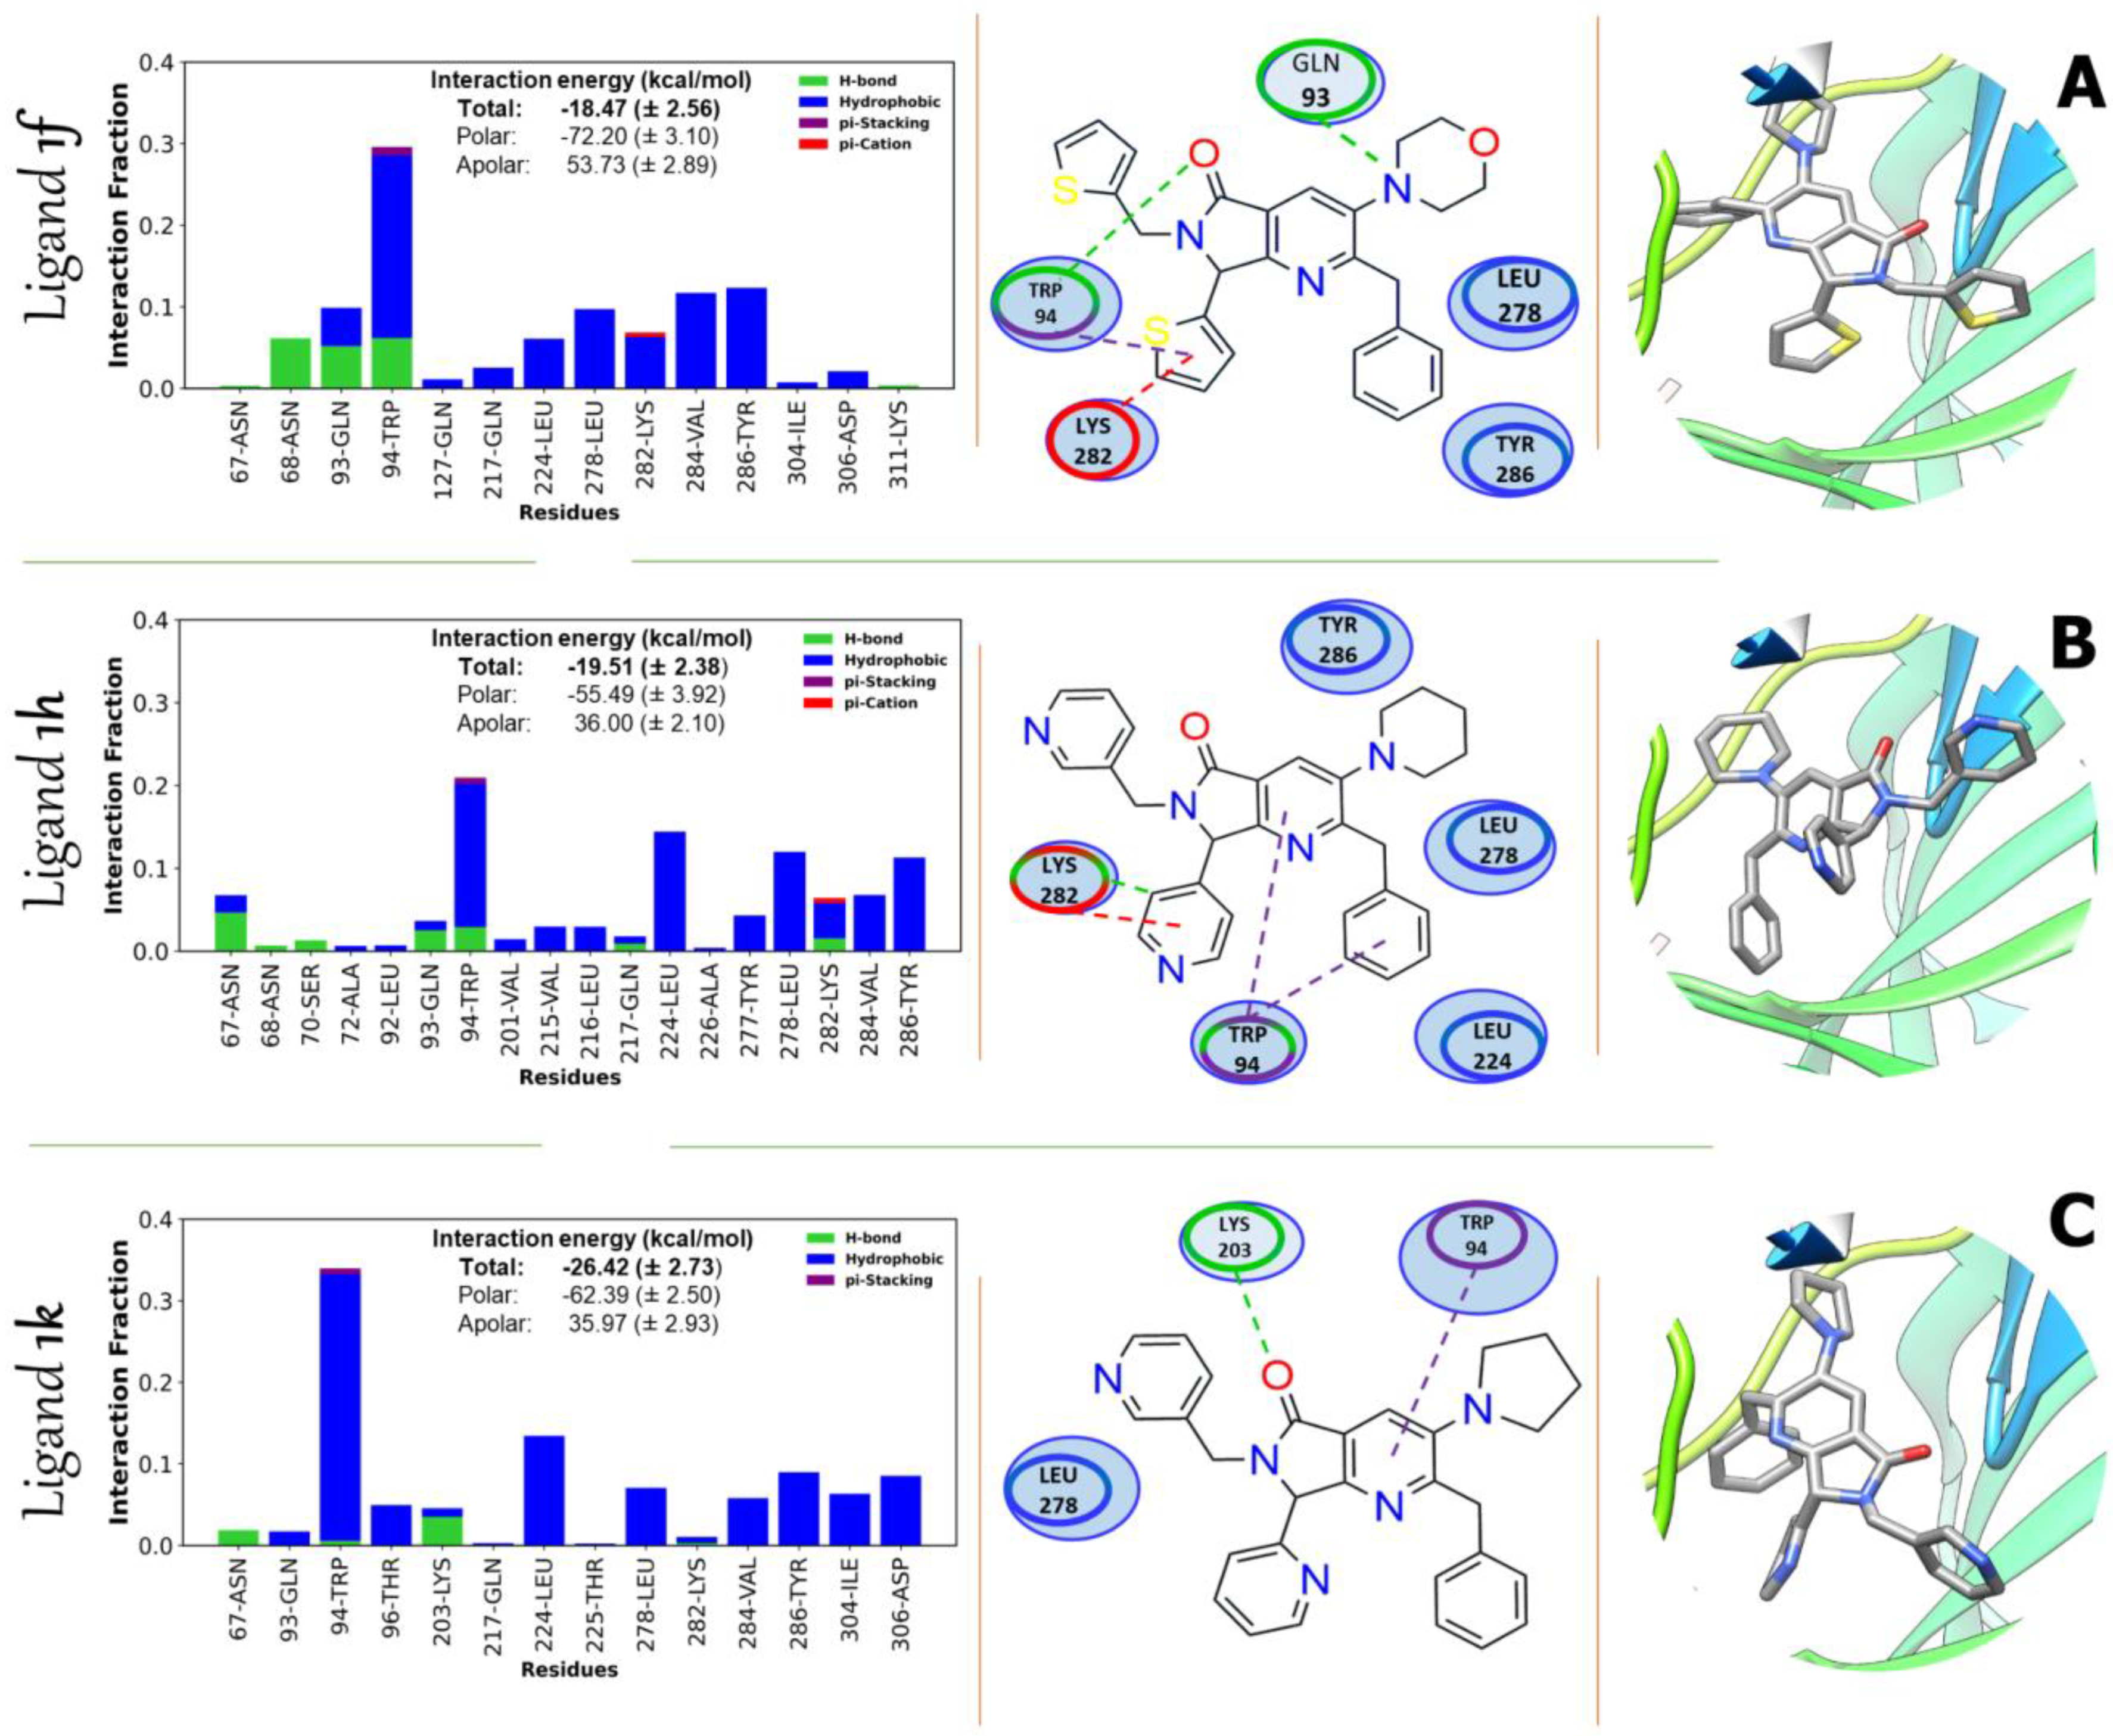
In addition, an analysis was conducted to decompose the energy of the interaction by residue (Table S6). This analysis aimed to discover the specific residues involved in the interaction process that contribute a significant energy value of more than 0.5 kcal/mol within a 5 Å radius from the surface of the ligand. In the case of AKT1, the residues GLN93, TRP94, and VAL284 made notable contributions (Figure 8). Specifically, for residue GLN93, the calculated energy values were −2.69 kcal/mol, −1.22 kcal/mol, and −1.12 kcal/mol for the compounds 1f, 1h, and 1k, respectively. Similarly, for residue TRP94, the energy values were −3.64 kcal/mol, −2.60 kcal/mol, and −3.67 kcal/mol for the 1f, 1h, and 1k inhibitors, respectively. Lastly, for residue VAL284, the energy values were −2.02 kcal/mol, −1.48 kcal/mol, and −2.11 kcal/mol for the 1f, 1h, and 1k inhibitors, respectively. TRP94 present the most advantageous interaction energies among the three compounds (Figure 8). These include π-stacking-type interactions with the neighboring thiophene attached to the nitrogen atom of the pyrrolo[3,4-b]pyridin-5-one nucleus, hydrogen bonding with the oxygen of the pyrrolo[3,4-b]pyridin-5-one nucleus, and hydrophobic interactions for ligand 1f.
A comparable phenomenon was noted while examining the behavior of ligand 1h (Figure 8). However, in this case, the indole group of TRP94 exhibited a specific orientation that facilitated the formation of π-stacking and perpendicular contacts between the pyrrolo[3,4-b]pyridin-5-one nucleus and the benzene substituent. Moreover, it was observed that ligand 1k exclusively formed π-stacking interactions with the pyrrolo[3,4-b]pyridin-5-one nucleus. Similarly, ligands 1f and 1h exhibited significant interactions with the amino acid residue LYS282, which subsequently displayed strong interactions with neighboring residues within the kinase domain, including VAL284, TYR286, and ARG287 (Figure 8). These four residues hold significant importance in the activation process of AKT1.
The bar graphs depicted in Figure 8 and Figure 9 showcase the interactions governing the recognition process for AKT1 and Ox2R between compounds 1f, 1h, and 1k, respectively. Additionally, both display the residence periods of these interactions, measured in snapshots, and rated by the Protein-Ligand Interaction Profiler (PLIP). The horizontal axis of the graphs reflects residue counts, while the vertical axis corresponds to population percentages. Each bar represents the average interaction type. The inset of the graphs illustrates the interaction energy (measured in kcal/mol) between the substrate and each possible inhibitor. Specifically, it focuses on residues located within a 5 Å radius of the binding allosteric site. Following this, a two-dimensional heatmap illustrates the interactions of AKT1 and Ox2R with compound interactions. The heatmap was generated using snapshots obtained from the representative structure of the most populated cluster, and the interactions were evaluated using Discovery Studio. The fingerprint map illustrates the predominant interactions between AKT1 residues and the compounds, with a particular focus on the preservation of TRP94 and LYS282 π-stacking, hydrophobic, and π–cation interactions. Similarly, it highlights the interactions between Ox2R residues and compounds, with a particular focus on preserving LYS2526.58, TYR2687.31, and PHE2717.34 π-stacking, hydrophobic, and π–cation contacts throughout the 100 ns MD production simulations for compounds 1f, 1h, and 1k. At some point, a 3D inhibitor spatial conformation is presented for each complex. Figure 8 and Figure 9 illustrate the spatial arrangement of the compounds within the allosteric pocket of AKT1 and the active pocket of Ox2R.
The activation of the ATP binding site is conditioned upon conformational changes in the AKT1 activation loop. This modification occurs exclusively when the phosphorylated activation loop interacts with specific residues (LYS282, VAL294, TYR286, or ARG287) situated within the kinase domain. In light of this, we have put forth a hypothesis suggesting that the binding of compounds 1f and 1h to the allosteric site could potentially impede ATP binding. The interaction between residues LYS282, VAL294, and TYR286 within the activation loop is hindered by the presence of 1f and 1h. Hence, the strategic placement of compounds 1f and 1h, which exhibit advantageous energy values as indicated in Table 2, at the allosteric site will impede the dephosphorylation process of the activation loop. As a result, inactivation of AKT1 downstream signaling would show reduced efficacy. Compound 1k, which demonstrated the most substantial interaction energy of −26.42 kcal/mol with AKT1, exhibited comparable interaction patterns to inhibitors 1f and 1h. However, it also displayed a broader energy distribution, engaging a larger number of residues (Figure 8. This collective effect resulted in a favorable increase in interaction energy, thereby promoting inhibition. In addition, the hydrophobic residues, including LEU278 and THR305, play a significant role in the hydrophobic interaction energy within the allosteric site of AKT1. The simulation results demonstrate that ligands 1f, 1h, and 1k (Figure 8) exhibit several conformations, indicating their potential interactions with residues such as ASN67, ASN68, GLN93, and TRP94 in the PH motifs, as well as GLN217, LEU224, and THR225 in the N-Lobe, and LEU278, LYS282, VAL 284, and TYR286 in the C-Lobe.
The interactions in Ox2R did not correspond with the results presented by Nagahara et al. in 2015 regarding the regulation of Ox2R via specific residues Thr1112.60, Asp1152.64, His3507.38, and Tyr3547.42 (referred to as the agonistic tetrad) [53]. Nevertheless, a previous investigation conducted by Heifetz et al. in 2013 underscored the significance of TYR2687.31 (TYR3177.38 in its native form as Ox2R) in facilitating the activation of OX2R by orexin peptide A [54]. In this context, it is observed that compounds obstructed the TYR2687.31 interactions; Figure 9. Compound 1f predominantly engages with the side chains of the amino acids TRP841.58, LYS2526.58, TYR2687.31, and PHE2717.34 (Figure 9). These interactions are characterized by respective binding energy contributions of −1.23 kcal/mol, −0.52 kcal/mol, −1.79 kcal/mol, and −1.17 kcal/mol (Table S6). Compound 1h exhibits a prominent interaction with the side chains of amino acids LYS2526.58, TYR2687.31, and PHE2717.34, resulting in binding energy contributions of −0.91 kcal/mol, −1.65 kcal/mol, and −2.44 kcal/mol, respectively. 1k predominantly forms associations with the side chains of amino acids TYR2687.31 and PHE2717.34, resulting in binding energy contributions of −1.57 kcal/mol and −1.63 kcal/mol, respectively.
The energy increase experienced by each residue is primarily determined by the specific contact exerted by each ligand (Figure 9). Regarding this matter, residue PHE2717.34 facilitates a hydrophobic contact and a π-stacking interaction with ligand 1f. The π-stacking interaction is observed between TYR2687.31 and the thiophene group attached to the nitrogen atom of the pyrrolo[3,4-b]pyridin-5-one nucleus. The consistency of this interaction is observed across all inhibitors, with the sole difference being the way in which residue PHE2717.34 is accommodated on the pyrrolo[3,4-b]pyridin-5-one nucleus. This adjustment is contingent upon the orientation of the inhibitors, as illustrated in Figure 9. In the instance of LYS2526.58, it mostly engages in hydrogen bonding and π–cation interactions, either with the pyrrolo[3,4-b]pyridin-5-one core of 1f or the amino pyridine substituent of 1h. In the present context, the observed variability in energy contributions pertaining to ligand 1h may provide insights into the factors underlying the more favorable interaction energy between inhibitor 1h and Ox2R, as opposed to AKT1.
Given the significant involvement of the amino acid TYR2687.31 in the activation mechanisms of Ox2R, as well as its apparent inhibition by ligands 1f, 1h, and 1k through favorable interactions, it can plausibly be suggested that these ligands have the potential to interfere with the interactions between transmembrane helices 5 (TM5) and 6 (TM6). The potential intermembrane contact described may give rise to an inhibitor outcome due to the interconnected inward motion of TM5 and TM6 helices, which is also associated with the activation of Ox2R [50,51,52,53,54,55,56,57]. Therefore, it can be postulated that the three inhibitors could disrupt the connections between transmembrane helices. In a manner analogous to the simulations performed for compounds 1f, 1h, and 1k with AKT1, the simulations undertaken to explore the inhibition of Ox2R reveal that compounds 1f, 1h, and 1k assume several conformations and display noteworthy interactions with TM6 and TM7 (Figure S26).

3. Materials and Methods

3.1. Synthesis

3.1.1. General Information, Instrumentation, Software, and Chemicals

1H and 13C nuclear magnetic resonance (NMR) spectra were acquired on a Bruker AMX Advance III spectrometer (500 MHz, Fällande, Uster, Switzerland). The solvent used for NMR experiments was deuterated chloroform (CDCl3). Chemical shifts are reported in parts per million (δ/ppm). Coupling constants are reported in Hertz (J/Hz). Internal reference for NMR spectra was tetramethylsilane (TMS) at 0.00 ppm. Multiplicities of the signals are reported using the standard abbreviations: singlet (s), doublet (d), triplet (t), quartet (q), and multiplet (m). NMR spectra were analyzed using the MestReNova software (Ver. 12.0.0-20080). Infrared (IR) spectra were acquired on a Perkin Elmer 1600 spectrometer (Norwalk, CT, USA) using the attenuated total reflectance (ATR) method. The maximum absorbance peaks are reported in reciprocal centimeters (νmax/cm−1). IR spectra were analyzed using the Report Builder software (Ver. 2.01). High-resolution mass spectroscopy (HRMS) spectra were acquired by electrospray ionization (ESI) on a Micro-TOF II spectrometer Bruker Daltonics GmbH (Bremen, Germany). HRMS samples were injected directly (Apollo source) and analyzed by time-of-flight method (TOF). HRMS spectra were analyzed using the Compass analysis software (Ver. 1.5, Flex Control and Flex Analysis by Bruker Daltonics, Inc.). Microwave-assisted reactions were performed in closed-vessel mode on a CEM Discover SP MW-reactor (Matthews, North Carolina, CA, USA). Reaction progress was monitored by thin-layer chromatography (TLC) and the spots were visualized under ultraviolet (UV) light (254 or 365 nm). Flash columns packed with oxide aluminum in a 0.063–0.200 mm mesh particle size were used to purify the products. Mixtures of hexanes (Hex) and ethyl acetate (EtOAc) in 1:1 or 1:2 (v/v) proportion were used to run TLC, aluminum oxide columns, and to measure the retention factor (Rf) values (using the same mobile phase for all the experiments). All starting reagents and solvents were used as received (without further purification, distillation, or dehydration). Chemical structures were drawn using the ChemDraw Professional software (Ver. 15.0.0.106, Perkin Elmer Informatics, Cambridge, MA, USA). The purity for all synthesized products (>95%) was assessed by NMR.

3.1.2. Synthesis and Characterization of the Pyrrolo[3,4-b]pyridin-5-ones 1g1k

General procedure (GP): The corresponding aldehydes 2 (1.0 equiv.) and the amines 3 (0.1 mmol, 1.0 equiv.) were placed in a sealed CEM Discover microwave reaction tube (10 mL) and diluted in toluene (1.0 mL). Then, the mixture was stirred and heated using microwave irradiation (65 °C, 100 W) for 5 min, and ytterbium(III) triflate (0.03 equiv.) was added. The mixture was stirred and heated using microwave irradiation (65 °C, 100 W) for 5 min, and then the corresponding isocyanides 5 (1.2 equiv.) were added. The new mixture was stirred and again heated using microwave irradiation (70 °C, 150 W) for 15 min, and then maleic anhydride (7) (1.4 equiv.) was added. Finally, the reaction mixture was stirred and heated using microwave irradiation (80 °C, 150 W) for 15 min. Then, the solvent was removed to dryness under vacuum. The crude was extracted using dichloromethane (3 × 25.0 mL) and Na2CO3 (aq.) (3 × 25 mL), and then washed with brine (3 × 25 mL). The organic layer was dried using anhydrous Na2SO4, filtered, and concentrated to dryness under vacuum. The new crude was purified by aluminum oxide column chromatography using mixtures of hexanes (Hex) and ethyl acetate (EtOAc) in 1:1 (v/v) proportions as a mobile phase to isolate the corresponding pyrrolo[3,4-b]pyridin-5-ones 1g1k.
  • 2-benzyl-3-(diethylamino)-7-(pyridin-3-yl)-6-(pyridin-3-ylmethyl)-6,7-dihydro-5H-pyrrolo[3,4-b]pyridin-5-one (1g)
According to the GP, 3-Pyridinecarboxaldehyde (100.0 μL), 3-Picolylamine (107.0 μL), ytterbium(III) triflate (19.0 mg), N,N-diethyl-2-isocyano-3-phenylpropanamide (289.0 mg), and maleic anhydride (143.0 mg) were reacted together in toluene (1.0 mL) to afford 1g (27.0 mg, 22%) as a yellow oil; Rf = (Hex–AcOEt = 1:1, v/v); FT-IR (ATR) νmax/cm−1 1693 (C = O); 1H NMR (500 MHz, CDCl3): δ 8.65 (dd, J = 4.8, 1.7 Hz, 1H), 8.56 (dd, J = 4.8, 1.7 Hz, 1H), 8.51 (d, J = 2.4 Hz, 1H), 8.47 (d, J = 2.4 Hz, 1H), 7.92 (s, 1H), 7.62–7.59 (m, 1H), 7.41–7.37 (m, 1H), 7.33–7.30 (m, 1H), 7.29–7.26 (m, 1H), 7.19–7.13 (m, 5H), 5.38 (d, J = 15.3 Hz, 1H), 5.31 (s, 1H), 4.32 (d, J = 14.0 Hz, 1H), 4.17 (d, J = 14.0 Hz, 1H), 4.00 (d, J = 15.2 Hz, 1H), 3.03 (q, J = 7.1 Hz, 4H), 0.97 (t, J = 7.1 Hz, 6H) ppm; 13C NMR (125 MHz, CDCl3): δ 167.4, 164.1, 158.7, 150.2, 149.6 (2), 149.3, 146.9, 139.2, 136.1, 135.3, 132.2, 131.2, 128.9 (2), 127.9 (2), 125.9, 125.7, 123.8, 123.7, 122.8, 62.3, 47.6 (2), 41.7, 39.8, 12.0 (2) ppm; HRMS (ESI+): m/z calcd for C29H29N5O [M + H]+ 464.2450, found 464.2445.
  • 2-benzyl-3-(piperidin-1-yl)-6-(pyridin-3-ylmethyl)-7-(pyridin-4-yl)-6,7-dihydro-5H-pyrrolo[3,4-b]pyridin-5-one (1h)
According to the GP, 4-Pyridinecarboxaldehyde (100.0 μL), 3-Picolylamine (106.0 μL), ytterbium(III) triflate (19.0 mg), 2-isocyano-3-phenyl-1-(piperidin-1-yl)propan-1-one (300.0 mg), and maleic anhydride (141.0 mg) were reacted together in toluene (1.0 mL) to afford 1h (25.0 mg, 20%) as a yellow oil; Rf = (Hex–AcOEt = 1:1, v/v); FT-IR (ATR) νmax/cm−1 1694 (C = O); 1H NMR (500 MHz, CDCl3): δ 8.62–8.60 (m, 2H), 8.53 (dd, J = 4.8, 1.7 Hz, 1H), 8.42–8.40 (m, 1H), 7.84 (s, 1H), 7.56–7.53 (m, 1H), 7.23 (ddd, J = 7.8, 4.8, 0.9 Hz, 1H), 7.17–7.12 (m, 5H), 7.10–7.08 (m, 2H), 5.40 (d, J = 15.2 Hz, 1H), 5.18 (s, 1H), 4.23 (d, J = 13.9 Hz, 1H), 4.12 (d, J = 13.9 Hz, 1H), 3.91 (d, J = 15.2 Hz, 1H), 2.82–2.78 (m, 4H), 1.75–1.69 (m, 4H), 1.62–1.57 (m, 2H) ppm; 13C NMR (125 MHz, CDCl3): δ 167.6, 162.7, 157.9, 150.5 (2), 149.8, 149.6, 149.4, 144.6, 139.1, 136.2, 132.1, 128.8 (2), 128.1 (2), 126.1, 123.8, 123.3, 122.9, 122.6 (2), 63.3, 54.2 (2), 41.8, 39.7, 26.3 (2), 23.9 ppm; HRMS (ESI+): m/z calcd for C30H30N5O [M + H]+ 476.2437, found 476.2445.
  • 2-benzyl-3-(piperidin-1-yl)-7-(pyridin-2-yl)-6-(pyridin-3-ylmethyl)-6,7-dihydro-5H-pyrrolo[3,4-b]pyridin-5-one (1i)
According to the GP, 2-Pyridinecarboxaldehyde (100 μL), 3-Picolylamine (108 μL), ytterbium(III) triflate (19 mg), 2-isocyano-3-phenyl-1-(piperidin-1-yl)propan-1-one (306 mg), and maleic anhydride (144 mg) were reacted together in toluene (1.0 mL) to afford 1i (115 mg, 92%) as a yellow oil; Rf = (Hex–AcOEt = 1:1, v/v); FT-IR (ATR) νmax/cm−1 1691 (C = O); 1H NMR (500 MHz, CDCl3): δ 8.58 (ddd, J = 4.9, 1.8, 0.9 Hz, 1H), 8.46 (dd, J = 4.8, 1.7 Hz, 1H), 8.41–8.39 (m, 1H), 7.87 (s, 1H), 7.61–7.57 (m, 2H), 7.24–7.19 (m, 2H), 7.17–7.06 (m, 3H), 7.05–7.01 (m, 1H), 5.46 (s, 1H), 5.20 (d, J = 15.1 Hz, 1H), 4.22 (d, J = 13.6 Hz, 1H), 4.20–4.16 (m, 2H), 2.81–2.75 (m, 4H), 1.74–1.65 (m, 4H), 1.61–1.53 (m, 2H) ppm; 13C NMR (125 MHz, CDCl3): δ 167.5, 162.2, 158.3, 155.4, 149.9, 149.8, 149.6, 148.9, 139.4, 136.9, 136.3, 132.7, 128.8 (2), 128.0 (2), 125.9, 123.8, 123.5, 123.4, 123.4, 123.0, 66.2, 54.2 (2), 42.1, 39.8, 26.3 (2), 23.9 ppm; HRMS (ESI+): m/z calcd for C30H30N5O [M + H]+ 476.2442, found 476.2445.
  • 2-benzyl-3-(diethylamino)-7-(pyridin-2-yl)-6-(pyridin-3-ylmethyl)-6,7-dihydro-5H-pyrrolo[3,4-b]pyridin-5-one (1j)
According to the GP, 2-Pyridinecarboxaldehyde (100 μL), 3-Picolylamine (108 μL), ytterbium(III) triflate (19 mg), N,N-diethyl-2-isocyano-3-phenylpropanamide (291 mg), and maleic anhydride (144 mg) were reacted together in toluene (1.0 mL) to afford 1j (90 mg, 74%) as a yellow oil; Rf = (Hex–AcOEt = 1:1, v/v); FT-IR (ATR) νmax/cm−1 1692 (C = O); 1H NMR (500 MHz, CDCl3): δ 8.60 (ddd, J = 4.9, 1.8, 0.9 Hz, 1H), 8.47 (dd, J = 4.8, 1.7 Hz, 1H), 8.41 (dd, J = 2.3, 0.8 Hz, 1H), 7.88 (s, 1H), 7.61 (dddd, J = 7.7, 5.1, 2.7, 1.8 Hz, 2H), 7.23 (ddd, J = 7.6, 4.9, 1.2 Hz, 1H), 7.19 (ddd, J = 7.9, 4.8, 0.8 Hz, 1H), 7.14–7.11 (m, 5H), 7.03 (d, J = 7.8, 1.0 Hz, 1H), 5.47 (s, 1H), 5.22 (d, J = 15.1 Hz, 1H), 4.25 (d, J = 13.9 Hz, 1H), 4.23–4.17 (m, 2H), 2.97 (q, J = 7.1 Hz, 4H), 0.92 (t, J = 7.1 Hz, 6H) ppm; 13C NMR (125 MHz, CDCl3): δ 167.5, 163.6, 158.4, 155.3, 149.9, 149.8, 148.9, 146.7, 139.4, 136.8, 136.3, 132.6, 129.5, 128.9 (2), 127.8 (2), 125.8, 123.5, 123.4, 122.9, 66.2, 47.7 (2), 42.1, 39.8, 12.0 (2) ppm; HRMS (ESI+): m/z calcd for C29H30N5O [M + H]+ 464.2445, found 464.2545.
  • 2-benzyl-7-(pyridin-2-yl)-6-(pyridin-3-ylmethyl)-3-(pyrrolidin-1-yl)-6,7-dihydro-5H-pyrrolo[3,4-b]pyridin-5-one (1k)
According to the GP, 2-Pyridinecarboxaldehyde (100 μL), 3-Picolylamine (108 μL), ytterbium(III) triflate (19 mg), 2-isocyano-3-phenyl-1-(pyrrolidin-1-yl)propan-1-one (288 mg), and maleic anhydride (144 mg) were reacted together in toluene (1.0 mL) to afford 1k (110 mg, 91%) as a yellow oil; Rf = (Hex–AcOEt = 1:1, v/v); FT-IR (ATR) νmax/cm−1 1693 (C = O); 1H NMR (500 MHz, CDCl3): δ 8.57 (ddd, J = 4.9, 1.8, 0.9 Hz, 1H), 8.45 (dd, J = 4.8, 1.7 Hz, 1H), 8.41 (dd, J = 2.3, 0.8 Hz, 1H), 7.67 (s, 1H), 7.58 (dd, J = 7.6, 1.8 Hz, 2H), 7.23–7.09 (m, 5H), 7.05–7.02 (m, 2H), 7.01 (d, J = 7.8 Hz, 1H), 5.44 (s, 1H), 5.19 (d, J = 15.1 Hz, 1H), 4.24 (d, J = 5.5 Hz, 2H), 4.18 (d, J = 15.2 Hz, 1H), 3.20–3.09 (m, 4H), 1.92–1.82 (m, 4H) ppm; 13C NMR (125 MHz, CDCl3): δ 167.7, 156.4, 155.6, 155.1, 149.7, 149.6, 148.8, 146.1, 139.4, 136.7, 136.1, 132.6, 128.3 (2), 127.9 (2), 125.7, 123.5, 123.3, 123.1, 122.8, 118.5, 66.0, 51.8 (2), 42.0, 41.5, 25.0 (2) ppm; HRMS (ESI+): m/z calcd for C29H28N5O [M + H]+ 462.2298, found 462.2288

3.2. Anticancer Activity

3.2.1. Reagents

Culture Dulbecco’s Modified Eagle Medium (DMEM) was purchased from Sigma-Aldrich (St Louis, MO, USA), antibiotics/antimycotics GIBCO® (5240-062). MTT (M2128) was purchased from Sigma-Aldrich (St Louis, MO, USA).

3.2.2. Cell Culture

The MCF-7 and MDA-MB-231 breast cancer cells lines were obtained from ATCC (Manassas, VA), and were cultured in DMEM/F12 medium (50:50, V:V; Sigma-Aldrich, St Louis, MO, USA) with 5% fetal bovine serum (FBS) and 1% antibiotic (penicillin G/streptomycin, Gibco, Waltham, MA, USA). Cells were maintained in a humidified atmosphere with 5% CO2 at 37 °C. The MCF-7 and MDA-MB-231 breast cancer cells were serum-deprived for 24 h before treatment.

3.2.3. Cell Viability Assays

Viability was measured by MTT (3-[4,5-dimethylthiazol-2-yl]-2,5 diphenyl tetrazolium bromide) assay. A quantity of 2 × 10⁴ cells were seeded and grown overnight in a 96-well plate. Treatments with the synthesized compounds were performed by employing different concentrations ranging from 6.25 to 200 mM. After 24 h and 48 h of treatment, 0.5 mg/mL MTT was added to each well and incubated at 37 °C for 4 h, protected from light. Formazan crystals were dissolved in DMSO, and absorbances were measured at 570 nm in a MultiskanTM GO microplate spectrophotometer (ThermoScientific, Waltham, MA, USA). The percentage of cell viability was calculated as the ratio of optical densities of the control and experimental groups.

3.2.4. Statistical Analysis

The results are presented as the mean ± SD. Data were analyzed statistically by one-way ANOVA, and comparisons were performed by Dunnett’s multiple comparison test. A statistical probability of p < 0.05 was considered significant.

3.3. In Silico Studies

3.3.1. ADME and Tox Properties

The assessment of Absorption, Distribution, Metabolism, Excretion, and Toxicity (ADMETox) characteristics was carried out. The assessment of ADMETox characteristics was conducted using the SwissADME (Ver. 2017) [58] and ProTox-II (Ver. 2021) [59] tools. The predictions were conducted using support vector machine (SVM) and machine learning techniques, respectively. Multiple criteria were evaluated, including gastrointestinal absorption, permeability across the blood–brain barrier, potential as a substrate or inhibitor of P-glycoprotein, inhibition of the cytochrome family, and suitability for artificial synthesis.

3.3.2. Target Selection and Active Pocket Determination

The process of selecting targets for ligands 1a1k was conducted via SwissTargetPrediction (Ver. 2019) [60] and PASS-Protein-Target (Ver. 2.0) [61], which are computational systems that use a machine learning approach. The therapeutic targets that were selected for further investigation were those that had the greatest likelihood and significance in relation to breast cancer. A total of 20 proteins (Table S2) with known structures in the Protein Data Bank (PDB) https://www.rcsb.org/ (accessed on 8 February 2023) [62] were chosen for the virtual screening procedure. The active pocket was identified using the Ligand Designer program [63], available on the publicly accessible CHARM-GUI [64]. The G-LoSA method was used to identify the appropriate active site, as indicated by a GA-score greater than 0.9 (Table S2).

3.3.3. Ligand Optimization

The ligands 1a1k underwent a geometric complete geometry optimization, accompanied by a frequency calculation in Gaussian 09 (Table S7). This optimization was conducted without any limitations to get the structures that had the lowest energy [36,65]. The optimization procedure used the B3LYP/6-31+g(d) basis set and approach, adding a solvent model based on the density of charge (SMD). The optimum shape was achieved in conditions of high moisture. After the production of output xyz files, the ligands were subjected to processing using Discovery Studio [66]. The first stage of this process was the conversion of the ligand files into SDF format, followed by the addition of polar hydrogens. Following that, the ligands underwent processing using the Meeko program (available at https://github.com/forlilab/Meeko) (accessed on 10 August 2023) to produce pdbqt files. These files were then combined using the ADFR software package (Ver. 1.0) [67].

3.3.4. Homology Modeling and Docking Simulations

The process of modeling missing segments in the crystallographic proteins was carried out using SwissModel (Table S8) [68]. The crystallographic structures of the proteins were used as templates, and the modeling was performed by considering the GMQE and QMEANDisCo values, both of which were required to be greater than 0.9. The assessment of model integrity was conducted using Molprobity [69] and VERIFY3D [70]. The elucidated proteins were used as targets for molecular docking [42]. The non-protein components that were found in the crystallographic structures were eliminated from the receptor. Subsequently, the structure was subjected to minimization using the YASARA server [71] in an aqueous environment with a solvent shell of 6 Å. Additionally, the pKa values of the amino acids were estimated at a pH of 7.4. The minimization process was terminated when the energy exhibited an improvement of less than 0.0119 kcal/mol (0.05 kJ/mol) and 200 steps in the steepest descent method.
Autodock Vina version 1.2.5 [72] was used for the purpose of molecular docking. Distinct grid centers and sizes were established for each target protein (Table S2). The docking simulations were conducted autonomously with three distinct force fields: AD4, Vina, and Vinardo. A total of 13,860 independent docking experiments were conducted, where each of the 11 ligands was docked 20 times to each of the 20-target proteins, using the three different force fields. To assess the reliability of the docking outcomes and the prediction of the active site, a crystallographic ligand was submitted to blind docking over two proteins of twenty target proteins. The calculated RMSD values were found to be 3.18 Å for the water-soluble protein MAPK8 (PDB-ID: 5IU2) and 5.57 Å for the membrane protein ghrelinR (PDB-ID: 7NA8). The superposition of the blind docking is depicted in Figure S27 [73,74,75,76].
To improve the accuracy of the docking analysis, the ligands were subjected to a redocking procedure and subsequently classified using a clustering, with a cutoff of 0.5 Å. The ligands selected for subsequent MD analyses were those with binding scores that were one standard deviation below the mean and belonged to the most densely populated clusters [42].

3.3.5. Molecular Dynamics Simulations

The molecular complexes that displayed the most favorable energy scores and exhibited the lowest IC50 values were chosen for subsequent MD simulations using the GROMACS program [77]. The protonation states of each protein were modified to conform to the physiological pH using the propKa tool [78] available on the PDB2PQR website (https://server.poissonboltzmann.org/) (accessed on 14 August 2023). The construction of input files was carried out with the Input Generator CHARMM-GUI [79]. The CHARMM36m force field [80] was used for the simulations. The Ligand Reader and Modeler CHARMM-GUI suite [81] was used in conjunction with CGenFF to get the ligand parameters.
The orthorhombic cell, with a thickness of 15 Å, was used to enclose each system. TIP3P water molecules were employed to surround the cell and, to neutralize the system’s charge, 0.15 M NaCl was introduced. A total of eighteen systems were constructed, with nine of them using AKT kinases (AKT1), while the other nine systems included the Orexin-2 receptor (Ox2R). The systems underwent a sequential process, which included an initial minimization phase consisting of 10,000 iterations using the steepest descent method. This was followed by two subsequent phases of MD simulations, with the first phase lasting 10 ns and conducted in the NVT ensemble, and the second phase lasting 20 ns and conducted in the NPT ensemble. These MD simulations were performed to achieve system equilibration. Following that, MD simulations lasting 100 ns were conducted. In the case of AKT1 systems, a timestep of 4 femtoseconds was used together with Hydrogen-Mass-Repartitioning (HMR) [82]. Conversely, for Ox2R, a timestep of 2 femtoseconds was utilized. The use of periodic boundary conditions (PBC) and Particle-Mesh-Ewald (PME) was employed for the treatment of electrostatic interactions. Inside the NPT ensemble, the temperature coupling was performed using the velocity rescale method, and the pressure coupling was performed using the Parrinello–Rahman method. The system was maintained at a temperature of 310.15 K and a pressure of 1 bar.
The simulation of Ox2R, a membrane protein, using the parameters established by Marrink et al. (2014) [83] and Im et al. (2022) [84], specifically designed for a human plasma membrane. The lipid content of the inner leaflet was found to be composed of 3-palmitoyl-2-oleoyl-d-glycero-1-phosphatidylcholine (POPC), 1-palmitoyl-2-linoleoyl-phosphatidylcholine (PLPC), 1-palmitoyl-2-arachidonyl-phosphatidylethanolamine (PAPE), 3-palmitoyl-2-oleoyl-d-glycero-1-phosphatidylethanolamine (POPE), sphingomyelin (SSM), n-stearoyl-sphingomyelin (NSM), and cholesterol (CHL1) in a ratio of 16:22:3:3:11:11:4:37, respectively. On the other hand, the outer leaflet exhibited a lipid composition consisting of POPC, PLPC, PAPE, POPE, phosphatidylinositol (POPI), 1-palmitoyl-2-arachidonyl-phosphatidylserine (PAPS), 3-palmitoyl-2-oleoyl-d-glycero-1-phosphatidic acid (POPA), SSM, NSM, and CHL1 in a ratio of 7:11:12:14:5:11:1:5:5:29. The construction of the asymmetric mammalian plasma membrane with 203 was carried out with the Membrane Builder suite [85] inside the CHARMM-GUI.
The MD simulations were carried out in triplicate, with each run being independent. The simulations encompassed three distinct ligands (1f, 1h, and 1k) and two target proteins (AKT1 and Ox2R), yielding a total of six systems, each with three replicas. The total time of the overall simulation effort was 1.8 µs. The trajectory analysis was conducted using the MDAnalysis software (Ver. 2.6.1) [86], and the pictures were displayed using Chimera [87].

3.3.6. Binding Free Energy

The molecular mechanics generalized Born surface area (MM/GBSA) approximation was used to obtain the interaction energy [88,89,90]. The gmx_MMPBSA program, which is derived from AMBER’s MMPBSA.py [91,92], was used to calculate the interactions energies of MM/GBSA. The GB approximation is a computational method that efficiently incorporates solvation effects into molecular interactions. A clustering study was conducted by concatenating the three replicas for each system, with the objective of calculating the interaction energy. The clustering analysis was conducted on the equilibrated segment of the simulation, which spanned 240 ns and consisted of 2400 frames. The clustering analysis was conducted utilizing the GROMACS cluster program, with a cutoff value of 2.0 Å [93,94], specifically targeting α-carbons to guarantee the inclusion of a minimum of 75% of the structures in the first cluster.
The binding free energy (ΔG binding) was determined according to the equation:
Δ G b i n d i n g = G c o m p l e x ( G p r o t e i n + G l i g a n d )
Calculation of free energy value G :
G = E M M + G s o l v T S M M
where:
  • Δ G b i n d i n g : represents the binding free energy.
  • G c o m p l e x : is the energy of the complex.
  • G p r o t e i n : in complex is the energy of the protein in the complex.
  • G l i g a n d : in complex is the energy of the ligand in the complex.
  • G denotes the calculated free energy value.
  • E M M stands for the molecular mechanics energy.
  • G s o l v is the solvation energy.
  • T represents the temperature.
  • S M M refers to the average molecular mechanics entropy.
Since entropy was not calculated during the experiment, the reported binding free energies only show the enthalpic part of the binding free energy [42]. To examine the protein–ligand interactions, we used the PLIP version 2.2.2 [95,96]. The Ballesteros numbering scheme, developed by Ox2R, was implemented using the online platform available at https://gproteindb.org/residue/residuetable (accessed on 8 February 2023) [97].

4. Conclusions

The investigation of molecules potentially possessing pharmacological properties that may effectively engage multiple protein receptors offers a promising strategy for addressing sophisticated medical problems, such as breast cancer. The pharmaceutical compounds synthesized for the present study exhibited interesting properties and numerous benefits, including the abilities to enhance therapeutic efficacy through synergistic interactions with various targets, enhance safety profiles, and decrease required dosages. Then, computer simulations were performed to enhance the progress of multi-target molecules for the treatment of cancer and accelerate the identification and progression of innovative therapeutic treatments.
Interestingly, of all compounds evaluated here, compound 1f showed the greatest potential as a viable and promising candidate for cancer treatment in triple-negative breast cancer, exhibiting the lowest IC50 at 14.8 mM and morphological changes, indicative of decreased cell viability in the triple-negative breast cancer cell line MDA-MB-231. Nevertheless, there is a dearth of comprehension around the precise pathways through which 1f exhibits its antineoplastic properties, underscoring the imperative for additional investigation in the realm of cancer treatment.

Supplementary Materials

The following supporting information can be downloaded at: https://www.mdpi.com/article/10.3390/ph16111562/s1, (1) workflow, (2) structures of compounds in vitro assayed, (3) spectra of all new compounds (1H NMR, 13C NMR, HRMS and FT-IR, (4) in silico study details (docking data and molecular dynamics), and (5) supplementary references.

Author Contributions

Methodology, I.M.-S., Formal analysis, C.E.G.-A. and F.P.M.-E.; Data curation, D.A.N.-T.; Investigation and writing—original draft preparation, L.D.H.-Z. and E.G.-Z.; Funding acquisition and writing—review and editing, N.N.-T. and A.I.-J. All authors have read and agreed to the published version of the manuscript.

Funding

A.I.-J. acknowledges “Proyecto Apoyado por el Fondo Sectorial de Investigación para la Educación CONACyT-SEP CB-2017-2018 (A1-S-32582)” for financial support.

Institutional Review Board Statement

Not applicable.

Informed Consent Statement

Not applicable.

Data Availability Statement

The data presented in this study are available on request from the corresponding author A.I.-J.

Acknowledgments

I.M.-S. thanks CONAHCyT—México for her PhD scholarship (947606). All authors gratefully acknowledge Citlalli A. Arroyo-Gómez, Atilano Gutiérrez-Carrillo, and Mónica A. Rincón-Guevara for IR, NMR, and HRMS acquisitions, respectively.

Conflicts of Interest

The authors declare no conflict of interest. The funders had no role in the design of the study; in the collection, analyses, or interpretation of data; in the writing of the manuscript; or in the decision to publish the results.

References

  1. Arnold, M.; Morgan, E.; Rumgay, H.; Mafra, A.; Singh, D.; Laversanne, M.; Vignat, J.; Gralow, J.R.; Cardoso, F.; Siesling, S.; et al. Current and Future Burden of Breast Cancer: Global Statistics for 2020 and 2040. Breast 2022, 66, 15–23. [Google Scholar] [CrossRef]
  2. Riggio, A.I.; Varley, K.E.; Welm, A.L. The Lingering Mysteries of Metastatic Recurrence in Breast Cancer. Br. J. Cancer 2021, 124, 13–26. [Google Scholar] [CrossRef]
  3. Tsang, J.Y.S.; Tse, G.M. Molecular Classification of Breast Cancer. Adv. Anat. Pathol. 2020, 27, 27–35. [Google Scholar] [CrossRef]
  4. Łukasiewicz, S.; Czeczelewski, M.; Forma, A.; Baj, J.; Sitarz, R.; Stanisławek, A. Breast Cancer—Epidemiology, Risk Factors, Classification, Prognostic Markers, and Current Treatment Strategies—An Updated Review. Cancers 2021, 13, 4287. [Google Scholar] [CrossRef] [PubMed]
  5. Conti, A.; Duggento, A.; Indovina, I.; Guerrisi, M.; Toschi, N. Radiomics in Breast Cancer Classification and Prediction. Semin. Cancer Biol. 2021, 72, 238–250. [Google Scholar] [CrossRef]
  6. Boix-Montesinos, P.; Soriano-Teruel, P.M.; Armiñán, A.; Orzáez, M.; Vicent, M.J. The Past, Present, and Future of Breast Cancer Models for Nanomedicine Development. Adv. Drug Deliv. Rev. 2021, 173, 306–330. [Google Scholar] [CrossRef] [PubMed]
  7. Martorana, F.; Motta, G.; Pavone, G.; Motta, L.; Stella, S.; Vitale, S.R.; Manzella, L.; Vigneri, P. AKT inhibitors: New weapons in the fight against breast cancer? Front. Pharmacol. 2021, 12, 662232. [Google Scholar] [CrossRef]
  8. George, B.; Gui, B.; Raguraman, R.; Paul, A.M.; Nakshatri, H.; Pillai, M.R.; Kumar, R. AKT1 transcriptomic landscape in breast cancer cells. Cells 2022, 11, 2290. [Google Scholar] [CrossRef]
  9. Marcos, P.; Coveñas, R. Involvement of the Orexinergic System in Cancer: Antitumor Strategies and Future Perspectives. Appl. Sci. 2023, 13, 7596. [Google Scholar] [CrossRef]
  10. Kishida, M.; Ishige, K.; Horibe, T.; Tada, N.; Koibuchi, N.; Shoda, J.; Kita, K.; Kawakami, K. Orexin 2 receptor as a potential target for immunotoxin and antibody-drug conjugate cancer therapy. Oncol. Lett. 2012, 3, 525–529. [Google Scholar] [CrossRef]
  11. Ibarra, I.A.; Islas-Jácome, A.; González-Zamora, E. Synthesis of polyheterocycles via multicomponent reactions. Org. Biomol. Chem. 2018, 16, 1402. [Google Scholar] [CrossRef]
  12. Flores-Reyes, J.C.; Islas-Jácome, A.; González-Zamora, E. The Ugi three-component reaction and its variants. Org. Chem. Front. 2021, 8, 5460–5514. [Google Scholar] [CrossRef]
  13. Morales-Salazar, I.; Montes-Enríquez, F.P.; Garduño-Albino, C.E.; García-Sánchez, M.A.; Ibarra, I.A.; Rojas-Aguirre, Y.; García-Hernández, M.E.; Sarmiento-Silva, R.E.; Alcaraz-Estrada, S.L.; Díaz-Cervantes, E.; et al. Synthesis of bis-furyl-pyrrolo[3,4-b]pyridin-5-ones via Ugi–Zhu reaction and in vitro activity assays against human SARS-CoV-2 and in silico studies on its main proteins. RSC Med. Chem. 2023, 14, 154–165. [Google Scholar] [CrossRef]
  14. Morales-Salazar, I.; Rincón-Guevara, M.A.; González-Zamora, E.; Islas-Jácome, A. 2-Benzyl-3-morpholino-7-(thiophen-2-yl)-6-(thiophen-2-ylmethyl)-6,7-dihydro-5H-pyrrolo [3,4-b] pyridin-5-one. Molbank 2022, 4, M1503. [Google Scholar] [CrossRef]
  15. Fayol, A.; Housseman, C.; Sun, X.; Janvier, P.; Bienaymé, H.; Zhu, J. Synthesis of α-Isocyano-α-alkyl(aryl)acetamides and their use in the multicomponent synthesis of 5-aminooxazole, pyrrolo[3,4-b]pyridin-5-one and 4,5,6,7-tetrahydrofuro[2,3-c]pyridine. Synthesis 2005, 1, 161–165. [Google Scholar] [CrossRef]
  16. Zamudio-Medina, A.; García-González, A.N.; Herrera-Carrillo, G.K.; Zárate-Zárate, D.; Benavides-Macías, A.; Tamariz, J.; Ibarra, I.A.; Islas-Jácome, A.; González-Zamora, E. Synthesis of polyheterocyclic pyrrolo[3,4-b]pyridin-5-ones via a one-pot (Ugi-3CR/aza diels-alder/N-acylation/aromatization/SN2) process. A suitable alternative towards novel aza-analogues of falipamil. Molecules 2018, 23, 1–20. [Google Scholar] [CrossRef] [PubMed]
  17. Speck, K.; Magauer, T. The chemistry of isoindole natural products. Beilstein J. Org. Chem. 2013, 9, 2048–2078. [Google Scholar] [CrossRef]
  18. Ayoup, M.S.; Mansour, A.F.; Abdel-Hamid, H.; Abu-Serie, M.M.; Mohyeldin, S.M.; Teleb, M. Nature-inspired new isoindole-based Passerini adducts as efficient tumor-selective apoptotic inducers via caspase-3/7 activation. Eur. J. Med. Chem. 2023, 245, 114865. [Google Scholar] [CrossRef] [PubMed]
  19. Barreca, M.; Spano, V.; Rocca, R.; Bivacqua, R.; Gualtieri, G.; Raimondi, M.V.; Gaudio, E.; Bortolozzi, R.; Manfreda, L.; Bai, R.; et al. Identification of pyrrolo [3′,4′:3,4] cyclohepta [1,2-d][1,2] oxazoles as promising new candidates for the treatment of lymphomas. Eur. J. Med. Chem. 2023, 254, 115372. [Google Scholar] [CrossRef] [PubMed]
  20. Tan, A.; Yaglioglu, A.S.; Kishali, N.H.; Sahin, E.; Kara, Y. Evaluation of cytotoxic potentials of some isoindole-1,3-dione derivatives on HeLa, C6 and A549 cancer cell lines. Med. Chem. 2020, 16, 69–77. [Google Scholar] [CrossRef] [PubMed]
  21. Grillone, K.; Riillo, C.; Rocca, R.; Ascrizzi, S.; Spanò, V.; Scionti, F.; Polerà, N.; Maruca, A.; Barreca, M.; Juli, G.; et al. The New Microtubule-Targeting Agent SIX2G Induces Immunogenic Cell Death in Multiple Myeloma. Int. J. Mol. Sci. 2022, 23, 10222. [Google Scholar] [CrossRef] [PubMed]
  22. Krishnappa, S.; Naganna, C.M.; Rajan, H.K.; Rajashekarappa, S.; Gowdru, H.B. Cytotoxic and apoptotic effects of chemogenic and biogenic nano-sulfur on human carcinoma cells: A comparative study. ACS Omega 2021, 6, 32548–32562. [Google Scholar] [CrossRef]
  23. Shoaib, S.; Ansari, M.A.; Ghazwani, M.; Hani, U.; Jamous, Y.F.; Alali, Z.; Ahmad, W.; Weir, S.A.; Alomary, M.N.; Yusuf, N.; et al. Prospective Epigenetic Actions of Organo-Sulfur Compounds against Cancer: Perspectives and Molecular Mechanisms. Cancers 2023, 15, 697. [Google Scholar] [CrossRef] [PubMed]
  24. Fuso, P.; Muratore, M.; D’angelo, T.; Paris, I.; Carbognin, L.; Tiberi, G.; Pavese, F.; Duranti, S.; Orlandi, A.; Tortora, G.; et al. PI3K Inhibitors in Advanced Breast Cancer: The Past, The Present, New Challenges and Future Perspectives. Cancers 2022, 14, 2161. [Google Scholar] [CrossRef] [PubMed]
  25. Jiang, W.; Wang, X.; Zhang, C.; Xue, L.; Yang, L. Expression and clinical significance of MAPK and EGFR in triple–negative breast cancer. Oncol. Lett. 2020, 19, 1842–1848. [Google Scholar] [CrossRef] [PubMed]
  26. Lee, S.; Rauch, J.; Kolch, W. Targeting MAPK signaling in cancer: Mechanisms of drug resistance and sensitivity. Int. J. Mol. Sci. 2020, 21, 1102. [Google Scholar] [CrossRef] [PubMed]
  27. Ding, L.; Cao, J.; Lin, W.; Chen, H.; Xiong, X.; Ao, H.; Yu, M.; Lin, J.; Cui, Q. The roles of cyclin-dependent kinases in cell-cycle progression and therapeutic strategies in human breast cancer. Int. J. Mol. Sci. 2020, 21, 1960. [Google Scholar] [CrossRef] [PubMed]
  28. Collin, L.J.; Maliniak, M.L.; Cronin-Fenton, D.P.; Ahern, T.P.; Christensen, K.B.; Ulrichsen, S.P.; Lash, T.L. Hypoxia-inducible factor-1α expression and breast cancer recurrence in a Danish population-based case control study. Breast Cancer Res. 2021, 23, 103. [Google Scholar] [CrossRef]
  29. 29. Adelusi, T.I.; Oyedele AQ, K.; Boyenle, I.D.; Ogunlana, A.T.; Adeyemi, R.O.; Ukachi, C.D.; Abdul-Hammed, M. Molecular modeling in drug discovery. Inform. Med. Unlocked 2022, 29, 100880. [Google Scholar] [CrossRef]
  30. Vieira, T.F.; Sousa, S.F. Receptor-Based Virtual Screening of Large Libraries in a Multi-Level In Silico Approach. In Advanced Methods in Structural Biology, 1st ed.; Springer: New York, NY, USA, 2023; pp. 261–267. [Google Scholar]
  31. Sivakumar, K.C.; Haixiao, J.; Naman, C.B.; Sajeevan, T.P. Prospects of multitarget drug designing strategies by linking molecular docking and molecular dynamics to explore the protein–ligand recognition process. Drug Dev. Res. 2020, 81, 685–699. [Google Scholar] [CrossRef]
  32. Mayr, F.; Möller, G.; Garscha, U.; Fischer, J.; Rodríguez Castaño, P.; Inderbinen, S.G.; Temml, V.; Waltenberger, B.; Schwaiger, S.; Hartmann, R.W.; et al. Finding new molecular targets of familiar natural products using in silico target prediction. Int. J. Mol. Sci. 2020, 21, 7102. [Google Scholar] [CrossRef] [PubMed]
  33. Yang, S.Q.; Zhang, L.X.; Ge, Y.J.; Zhang, J.W.; Hu, J.X.; Shen, C.Y.; Lu, A.P.; Hou, T.J.; Cao, D.S. In-silico target prediction by ensemble chemogenomic model based on multi-scale information of chemical structures and protein sequences. J. Cheminform. 2023, 15, 48. [Google Scholar] [CrossRef]
  34. Karasev, D.A.; Sobolev, B.N.; Lagunin, A.A.; Filimonov, D.A.; Poroikov, V.V. The method predicting interaction between protein targets and small-molecular ligands with the wide applicability domain. Comput. Biol. Chem. 2022, 98, 107674. [Google Scholar] [CrossRef]
  35. Madanagopal, P.; Ramprabhu, N.; Jagadeesan, R. In silico prediction and structure-based multitargeted molecular docking analysis of selected bioactive compounds against mucormycosis. Bull. Natl. Res. Cent. 2022, 46, 24. [Google Scholar] [CrossRef] [PubMed]
  36. El-Bindary, A.A.; Mohamed, G.G.; El-Sonbati, A.Z.; Diab, M.A.; Hassan, W.M.I.; Morgan, S.M.; Elkholy, A.K. Geometrical structure, potentiometric, molecular docking and thermodynamic studies of azo dye ligand and its metal complexes. J. Mol. Liq. 2016, 218, 138–149. [Google Scholar] [CrossRef]
  37. Boittier, E.D.; Tang, Y.Y.; Buckley, M.E.; Schuurs, Z.P.; Richard, D.J.; Gandhi, N.S. Assessing molecular docking tools to guide targeted drug discovery of CD38 inhibitors. Int. J. Mol. Sci. 2020, 21, 5183. [Google Scholar] [CrossRef] [PubMed]
  38. Zheng, L.; Meng, J.; Jiang, K.; Lan, H.; Wang, Z.; Lin, M.; Li, W.; Guo, H.; Wei, Y.; Mu, Y. Improving protein–ligand docking and screening accuracies by incorporating a scoring function correction term. Brief. Bioinform. 2022, 23, bbac051. [Google Scholar] [CrossRef]
  39. Ramírez, D.; Caballero, J. Is it reliable to take the molecular docking top scoring position as the best solution without considering available structural data? Molecules 2018, 23, 1038. [Google Scholar] [CrossRef]
  40. Kode, J.; Kovvuri, J.; Nagaraju, B.; Jadhav, S.; Barkume, M.; Sen, S.; Kasinathan, N.K.; Chaudhari, P.; Mohanty, B.S.; Gour, J.; et al. Synthesis, biological evaluation, and molecular docking analysis of phenstatin based indole linked chalcones as anticancer agents and tubulin polymerization inhibitors. Bioorg. Chem. 2020, 105, 104447. [Google Scholar] [CrossRef]
  41. Palacio-Rodríguez, K.; Lans, I.; Cavasotto, C.N.; Cossio, P. Exponential consensus ranking improves the outcome in docking and receptor ensemble docking. Sci. Rep. 2019, 9, 5142. [Google Scholar] [CrossRef] [PubMed]
  42. Millán-Pacheco, C.; Rios-Soto, L.; Corral-Rodríguez, N.; Sierra-Campos, E.; Valdez-Solana, M.; Téllez-Valencia, A.; Avitia-Domínguez, C. Discovery of Potential Noncovalent Inhibitors of Dehydroquinate Dehydratase from Methicillin-Resistant Staphylococcus aureus through Computational-Driven Drug Design. Pharmaceuticals 2023, 16, 1148. [Google Scholar] [CrossRef]
  43. Hinz, N.; Jücker, M. Distinct functions of AKT isoforms in breast cancer: A comprehensive review. Cell Commun. Signal. 2019, 17, 154. [Google Scholar] [CrossRef]
  44. Lapierre, J.M.; Eathiraj, S.; Vensel, D.; Liu, Y.; Bull, C.O.; Cornell-Kennon, S.; Iimura, S.; Kelleher, E.W.; Kizer, D.E.; Koerner, S.; et al. Discovery of 3-(3-(4-(1-Aminocyclobutyl) phenyl)-5-phenyl-3 H-imidazo [4,5-b] pyridin-2-yl) pyridin-2-amine (ARQ 092): An orally bioavailable, selective, and potent allosteric AKT inhibitor. J. Med. Chem. 2016, 59, 6455–6469. [Google Scholar] [CrossRef]
  45. Asada, H.; Im, D.; Hotta, Y.; Yasuda, S.; Murata, T.; Suno, R.; Iwata, S. Molecular basis for anti-insomnia drug design from structure of lemborexant-bound orexin 2 receptor. Structure 2022, 30, 1582–1589. [Google Scholar] [CrossRef] [PubMed]
  46. Couvineau, A.; Nicole, P.; Gratio, V.; Voisin, T. The Orexin receptors: Structural and anti-tumoral properties. Front. Endocrinol. 2022, 13, 931970. [Google Scholar] [CrossRef] [PubMed]
  47. Wang, D.D.; Zhu, M.; Yan, H. Computationally predicting binding affinity in protein–ligand complexes: Free energy-based simulations and machine learning-based scoring functions. Brief. Bioinform. 2021, 22, bbaa107. [Google Scholar] [CrossRef]
  48. Yu, Y.; Wang, Z.; Wang, L.; Tian, S.; Hou, T.; Sun, H. Predicting the mutation effects of protein–ligand interactions via end-point binding free energy calculations: Strategies and analyses. J. Cheminform. 2022, 14, 56. [Google Scholar] [CrossRef]
  49. Muegge, I.; Hu, Y. Recent Advances in Alchemical Binding Free Energy Calculations for Drug Discovery. ACS Med. Chem. Lett. 2023, 14, 244–250. [Google Scholar] [CrossRef] [PubMed]
  50. Sun, Y.; He, X.; Hou, T.; Cai, L.; Man, V.H.; Wang, J. Development and test of highly accurate endpoint free energy methods. 1: Evaluation of ABCG2 charge model on solvation free energy prediction and optimization of atom radii suitable for more accurate solvation free energy prediction by the PBSA method. J. Comput. Chem. 2023, 44, 1334–1346. [Google Scholar] [CrossRef]
  51. Yang, M.; Bo, Z.; Xu, T.; Xu, B.; Wang, D.; Zheng, H. Uni-GBSA: An open-source and web-based automatic workflow to perform MM/GB (PB) SA calculations for virtual screening. Brief. Bioinform. 2023, 24, bbad218. [Google Scholar] [CrossRef] [PubMed]
  52. Molani, F.; Webb, S.; Cho, A.E. Combining QM/MM Calculations with Classical Mining Minima to Predict Protein–Ligand Binding Free Energy. J. Chem. Inf. Model. 2023, 63, 2728–2734. [Google Scholar] [CrossRef] [PubMed]
  53. Nagahara, T.; Saitoh, T.; Kutsumura, N.; Irukayama-Tomobe, Y.; Ogawa, Y.; Kuroda, D.; Gouda, H.; Kumagai, H.; Fujii, H.; Yanagisawa, M.; et al. Design and synthesis of non-peptide, selective orexin receptor 2 agonists. J. Med. Chem. 2015, 58, 7931–7937. [Google Scholar] [CrossRef] [PubMed]
  54. Heifetz, A.; Barker, O.; Morris, G.B.; Law, R.J.; Slack, M.; Biggin, P.C. Toward an understanding of agonist binding to human Orexin-1 and Orexin-2 receptors with G-protein-coupled receptor modeling and site-directed mutagenesis. Biochemistry 2013, 52, 8246–8260. [Google Scholar] [CrossRef] [PubMed]
  55. Janockova, J.; Dolezal, R.; Nepovimova, E.; Kobrlova, T.; Benkova, M.; Kuca, K.; Konecny, J.; Mezeiova, E.; Melikova, M.; Hepnarova, V.; et al. Investigation of new orexin 2 receptor modulators using in silico and in vitro methods. Molecules 2018, 23, 2926. [Google Scholar] [CrossRef] [PubMed]
  56. Hong, C.; Byrne, N.J.; Zamlynny, B.; Tummala, S.; Xiao, L.; Shipman, J.M.; Partridge, A.T.; Minnick, C.; Breslin, M.J.; Rudd, M.T.; et al. Structures of active-state orexin receptor 2 rationalize peptide and small-molecule agonist recognition and receptor activation. Nat. Commun. 2021, 12, 815. [Google Scholar] [CrossRef]
  57. Karhu, L.; Magarkar, A.; Bunker, A.; Xhaard, H. Determinants of Orexin Receptor Binding and Activation—A Molecular Dynamics Study. J. Phys. Chem. B. 2019, 123, 2609–2622. [Google Scholar] [CrossRef] [PubMed]
  58. Daina, A.; Michielin, O.; Zoete, V. SwissADME: A free web tool to evaluate pharmacokinetics, drug-likeness and medicinal chemistry friendliness of small molecules. Sci. Rep. 2017, 7, 42717. [Google Scholar] [CrossRef] [PubMed]
  59. Banerjee, P.; Eckert, A.O.; Schrey, A.K.; Preissner, R. ProTox-II: A webserver for the prediction of toxicity of chemicals. Nucleic Acids Res. 2018, 46, W257–W263. [Google Scholar] [CrossRef]
  60. Daina, A.; Michielin, O.; Zoete, V. SwissTargetPrediction: Updated data and new features for efficient prediction of protein targets of small molecules. Nucleic Acids Res. 2019, 47, W357–W364. [Google Scholar] [CrossRef]
  61. Pogodin, P.V.; Lagunin, A.A.; Filimonov, D.A.; Poroikov, V.V. PASS Targets: Ligand-based multi-target computational system based on a public data and naïve Bayes approach. SAR QSAR Environ. Res. 2015, 26, 783–793. [Google Scholar] [CrossRef]
  62. Berman, H.M.; Westbrook, J.; Feng, Z.; Gilliland, G.; Bhat, T.N.; Weissig, H.; Shindyalov, I.N.; Bourne, P.E. The protein data bank. Nucleic Acids Res. 2000, 28, 235–242. [Google Scholar] [CrossRef]
  63. Guterres, H.; Park, S.J.; Cao, Y.; Im, W. CHARMM-GUI ligand designer for template-based virtual ligand design in a binding site. J. Chem. Inf. Model 2021, 61, 5336–5342. [Google Scholar] [CrossRef] [PubMed]
  64. Jo, S.; Kim, T.; Iyer, V.G.; Im, W. CHARMM-GUI: A web-based graphical user interface for CHARMM. J. Comput. Chem. 2008, 29, 1859–1865. [Google Scholar] [CrossRef]
  65. Frisch, M.J.; Trucks, G.W.; Schlegel, H.B.; Scuseria, G.E.; Robb, M.A.; Cheeseman, J.R.; Scalmani, G.; Barone, V.; Mennucci, B.; Petersson, G.A.; et al. Gaussian 09, Revision A. 02; Gaussian Inc.: Wallingford, CT, USA, 2009. [Google Scholar]
  66. Studio, D. Dassault Systemes BIOVIA, Discovery Studio Modelling Environment, Release 4.5; Accelrys Softw Inc.: San Diego, CA, USA, 2015. [Google Scholar]
  67. Te Velde, G.T.; Bickelhaupt, F.M.; Baerends, E.J.; Fonseca Guerra, C.; van Gisbergen, S.J.; Snijders, J.G.; Ziegler, T. Chemistry with ADF. J. Comput. Chem. 2001, 22, 931–967. [Google Scholar] [CrossRef]
  68. Waterhouse, A.; Bertoni, M.; Bienert, S.; Studer, G.; Tauriello, G.; Gumienny, R.; Heer, F.T.; de Beer, T.A.P.; Rempfer, C.; Bordoli, L.; et al. SWISS-MODEL: Homology modelling of protein structures and complexes. Nucleic Acids Res. 2018, 46, W296–W303. [Google Scholar] [CrossRef]
  69. Chen, V.B.; Arendall, W.B.; Headd, J.J.; Keedy, D.A.; Immormino, R.M.; Kapral, G.J.; Murray, L.W.; Richardson, J.S.; Richardson, D.C. MolProbity: All-atom structure validation for macromolecular crystallography. Acta Cryst. 2010, 66, 12–21. [Google Scholar] [CrossRef] [PubMed]
  70. Eisenberg, D.; Lüthy, R.; Bowie, J.U. VERIFY3D: Assessment of protein models with three-dimensional profiles. In Methods in Enzymology; Academic Press: Cambridge, MA, USA, 1997; Volume 277, pp. 396–404. [Google Scholar]
  71. Krieger, E.; Joo, K.; Lee, J.; Lee, J.; Raman, S.; Thompson, J.; Tyka, M.; Baker, D.; Karplus, K. Improving physical realism, stereochemistry, and side-chain accuracy in homology modeling: Four approaches that performed well in CASP8. Proteins Struct. Funct. Genet. 2009, 77, 114–122. [Google Scholar] [CrossRef]
  72. Eberhardt, J.; Santos-Martins, D.; Tillack, A.F.; Forli, S. AutoDock Vina 1.2. 0: New docking methods, expanded force field, and python bindings. J. Chem. Inf. Model. 2021, 61, 3891–3898. [Google Scholar] [CrossRef] [PubMed]
  73. Hetényi, C.; Van der Spoel, D. Blind docking of drug-sized compounds to proteins with up to a thousand residues. FEBS lett. 2006, 580, 1447–1450. [Google Scholar] [CrossRef] [PubMed]
  74. Jofily, P.; Pascutti, P.G.; Torres, P.H. Improving blind docking in DOCK6 through an automated preliminary fragment probing strategy. Molecules 2021, 26, 1224. [Google Scholar] [CrossRef] [PubMed]
  75. Lee, H.S.; Zhang, Y. BSP-SLIM: A blind low-resolution ligand-protein docking approach using predicted protein structures. Proteins Struct. Funct. Genet. 2012, 80, 93–110. [Google Scholar] [CrossRef] [PubMed]
  76. Agarwal, R.; Smith, J.C. Speed vs accuracy: Effect on ligand pose accuracy of varying box size and exhaustiveness in AutoDock vina. Mol. Inform. 2023, 42, 2200188. [Google Scholar] [CrossRef] [PubMed]
  77. Abraham, M.J.; Murtola, T.; Schulz, R.; Páll, S.; Smith, J.C.; Hess, B.; Lindahl, E. GROMACS: High performance molecular simulations through multi-level parallelism from laptops to supercomputers. SoftwareX 2015, 1, 19–25. [Google Scholar] [CrossRef]
  78. Dolinsky, T.J.; Czodrowski, P.; Li, H.; Nielsen, J.E.; Jensen, J.H.; Klebe, G.; Baker, N.A. PDB2PQR: Expanding and upgrading automated preparation of biomolecular structures for molecular simulations. Nucleic Acids Res. 2007, 35, W522–W525. [Google Scholar] [CrossRef] [PubMed]
  79. Lee, J.; Cheng, X.; Jo, S.; MacKerell, A.D.; Klauda, J.B.; Im, W. CHARMM-GUI input generator for NAMD, GROMACS, AMBER, OpenMM, and CHARMM/OpenMM simulations using the CHARMM36 additive force field. Biophys. J. 2016, 110, 641a. [Google Scholar] [CrossRef]
  80. Huang, J.; Rauscher, S.; Nawrocki, G.; Ran, T.; Feig, M.; De Groot, B.L.; Grubmüller, H.; MacKerell, A.D., Jr. CHARMM36m: An improved force field for folded and intrinsically disordered proteins. Nat. Methods 2017, 14, 71–73. [Google Scholar] [CrossRef] [PubMed]
  81. Kim, S.; Lee, J.; Jo, S.; Brooks III, C.L.; Lee, H.S.; Im, W. CHARMM-GUI ligand reader and modeler for CHARMM force field generation of small molecules. J. Comput. Chem. 2017, 38, 1879–1886. [Google Scholar] [CrossRef] [PubMed]
  82. Balusek, C.; Hwang, H.; Lau, C.H.; Lundquist, K.; Hazel, A.; Pavlova, A.; Lynch, D.L.; Reggio, P.H.; Wang, Y.; Gumbart, J.C. Accelerating membrane simulations with hydrogen mass repartitioning. J. Chem. Theory Comput. 2019, 15, 4673–4686. [Google Scholar] [CrossRef]
  83. Ingólfsson, H.I.; Melo, M.N.; Van Eerden, F.J.; Arnarez, C.; Lopez, C.A.; Wassenaar, T.A.; Periole, X.; de Vries, A.H.; Tieleman, D.P.; Marrink, S.J. Lipid organization of the plasma membrane. J. Am. Chem. Soc. 2014, 136, 14554–14559. [Google Scholar] [CrossRef] [PubMed]
  84. Pogozheva, I.D.; Armstrong, G.A.; Kong, L.; Hartnagel, T.J.; Carpino, C.A.; Gee, S.E.; Picarello, D.M.; Rubin, D.S.; Lee, J.; Park, S.; et al. Comparative molecular dynamics simulation studies of realistic eukaryotic, prokaryotic, and archaeal membranes. J. Chem. Inf. Model. 2022, 62, 1036–1051. [Google Scholar] [CrossRef]
  85. Wu, E.L.; Cheng, X.; Jo, S.; Rui, H.; Song, K.C.; Dávila-Contreras, E.M.; Qi, Y.; Lee, J.; Monje-Galvan, V.; Venable, R.M.; et al. CHARMM-GUI membrane builder toward realistic biological membrane simulations. J. Comput. Chem. 2014, 35, 1997–2004. [Google Scholar] [CrossRef]
  86. Michaud-Agrawal, N.; Denning, E.J.; Woolf, T.B.; Beckstein, O. MDAnalysis: A toolkit for the analysis of molecular dynamics simulations. J. Comput. Chem. 2011, 32, 2319–2327. [Google Scholar] [CrossRef] [PubMed]
  87. Pettersen, E.F.; Goddard, T.D.; Huang, C.C.; Couch, G.S.; Greenblatt, D.M.; Meng, E.C.; Ferrin, T.E. UCSF Chimera: A visualization system for exploratory research and analysis. J. Comput. Chem. 2004, 25, 1605–1612. [Google Scholar] [CrossRef] [PubMed]
  88. Hou, T.; Wang, J.; Li, Y.; Wang, W. Assessing the performance of the MM/PBSA and MM/GBSA methods. The accuracy of binding free energy calculations based on molecular dynamics simulations. J. Chem. Inf. Model. 2011, 51, 69–82. [Google Scholar] [CrossRef] [PubMed]
  89. Forouzesh, N.; Mishra, N. An effective MM/GBSA protocol for absolute binding free energy calculations: A case study on SARS-CoV-2 spike protein and the human ACE2 receptor. Molecules 2021, 26, 2383. [Google Scholar] [CrossRef]
  90. Dasmahapatra, U.; Kumar, C.K.; Das, S.; Subramanian, P.T.; Murali, P.; Isaac, A.E.; Ramanathan, K.; MM, B.; Chanda, K. In-silico molecular modelling, MM/GBSA binding free energy and molecular dynamics simulation study of novel pyrido fused imidazo [4, 5-c] quinolines as potential anti-tumor agents. Front. Chem. 2022, 10, 991369. [Google Scholar] [CrossRef] [PubMed]
  91. Valdés-Tresanco, M.S.; Valdés-Tresanco, M.E.; Valiente, P.A.; Moreno, E. gmx_MMPBSA: A new tool to perform end-state free energy calculations with GROMACS. J. Chem. Theory Comput. 2021, 17, 6281–6291. [Google Scholar] [CrossRef] [PubMed]
  92. Miller, B.R., III; McGee, T.D., Jr.; Swails, J.M.; Homeyer, N.; Gohlke, H.; Roitberg, A.E. MMPBSA. py: An efficient program for end-state free energy calculations. J. Chem. Theory Comput. 2012, 8, 3314–3321. [Google Scholar] [CrossRef] [PubMed]
  93. Kufareva, I.; Abagyan, R. Methods in Molecular Biology; Springer: Berlin/Heidelberg, Germany, 2012; Volume 857, pp. 231–257. [Google Scholar]
  94. Carugo, O. How root-mean-square distance (rmsd) values depend on the resolution of protein structures that are compared. J. Appl. Crystallogr. 2003, 36, 125–128. [Google Scholar] [CrossRef]
  95. Adasme, M.F.; Linnemann, K.L.; Bolz, S.N.; Kaiser, F.; Salentin, S.; Haupt, V.J.; Schroeder, M. PLIP 2021: Expanding the scope of the protein–ligand interaction profiler to DNA and RNA. Nucleic Acids Res. 2021, 49, W530–W534. [Google Scholar] [CrossRef]
  96. Atanda, H.; Balogun, T.A.; Alshehri, M.M.; Olivos-Ramirez, G.; Vilca-Quispe, J.; Chenet-Zuta, M.; Cárdenas-Cárdenas, R.; Delgado Wong, H.; Ropón-Palacios, G.; Umar, H.I. In silico study revealed the inhibitory activity of selected phytomolecules of C. rotundus against VacA implicated in gastric ulcer. J. Biomol. Struct. Dyn. 2022, 1–12. [Google Scholar] [CrossRef] [PubMed]
  97. Pándy-Szekeres, G.; Munk, C.; Tsonkov, T.M.; Mordalski, S.; Harpsøe, K.; Hauser, A.S.; Bojarski, A.J.; Gloriam, D.E. GPCRdb in 2018: Adding GPCR structure models and ligands. Nucleic Acids Res. 2018, 46, D440–D446. [Google Scholar] [CrossRef] [PubMed]
Scheme 1. Synthesis of pyrrolo[3,4-b]pyridin-5-ones 1a1k.
Pharmaceuticals 16 01562 sch001
Figure 1. Effect of compounds 1a1k on cell viability of MDA-MB-231 cells. The MDA-MB-231 cell line was exposed to 0, 6.25, 12.5, 25, 50, 100, and 200 µM of the chemical compounds for 48 h. The graphs are representative of the % cell viability concerning the control and are representative of three independent experiments. Statistical significance was calculated by ANOVA and Dunnett, ±SD with values of * p < 0.05, ** p < 0.01, *** p < 0.001, and **** p < 0.0001 indicating statistical significance.
Pharmaceuticals 16 01562 g001
Figure 2. Effect of compounds 1a1k on the cell viability of MDA-MB-231 cells. Representative phase contrast microscopy images of MDA-MB-231 tumor cells. The cells were treated with different concentrations of the chemical molecules (0, 6.25, 12.5, 25, 50, 100, and 200 µM) or vehicle (DMSO) for 48 h. Images of morphological changes were taken at 48 h with a 10× objective.
Pharmaceuticals 16 01562 g002
Figure 3. Effect of chemical compounds 1a1k on cell viability of MCF-7 cells. The MCF-7 cell line was exposed to 0, 6.25, 12.5, 25, 50, 100, and 200 µM of the compounds for 48 h. The graphs are representative of the % cell viability concerning the control and are representative of three independent experiments. Statistical significance was calculated by ANOVA and Dunnett, ±SD with values of * p < 0.05, ** p < 0.01, *** p < 0.001, and **** p < 0.0001 considered statistically significant.
Pharmaceuticals 16 01562 g003
Figure 4. Effect of chemical compounds 1a1k on cell viability of MCF-7 cells. Representative bright-field microscopy images of MCF-7 tumor cells. Cells were treated with different concentrations of the chemical molecules (0, 6.25, 12.5, 25, 25, 50, 100, and 200 µM) or vehicle (DMSO) for 48 h. Images of the morphological changes at 48 h were taken with a 10× objective on an inverted microscope.
Pharmaceuticals 16 01562 g004
Figure 5. Docking results: (A) energy vs. RMSD, (B) docking to Ox2R, (C) docking to AKT1.
Pharmaceuticals 16 01562 g005
Figure 6. MD structure equilibrating descriptors for the interactions 1f, 1h, and 1k with AKT1.
Pharmaceuticals 16 01562 g006
Figure 7. Structural equilibrating descriptors obtained by MD simulations for the interactions 1f, 1h, and 1k with the Ox2R receptor.
Pharmaceuticals 16 01562 g007
Figure 8. Main interactions between the protein target AKT1 and compounds 1f, 1h, and 1k. These interactions are represented by the following arrangements: (A) 1f, (B) 1h, and (C) 1k. Color coding: The interactions are visually depicted using circles containing residue names and lines indicating their spatial arrangement. The interaction colors are consistent across both the bar chart and the 2D maps. Green indicates hydrogen bonding interactions, while blue represents hydrophobic interactions. Purple is used for π-stacking interactions, and red is employed for π–cation interactions. The atom–ligand pairs are visually differentiated based on their respective colors. Carbon is represented by the color gray, nitrogen by blue, oxygen by red, and sulfur by yellow.
Pharmaceuticals 16 01562 g008
Figure 9. Main interactions that occur between the protein target Ox2R and compounds 1f, 1h, and 1k. These interactions are represented by the following arrangements: (A) 1f, (B) 1h, and (C) 1k. Color coding: The interactions are visually depicted using circles containing residue names and lines indicating their spatial arrangement. The interaction colors are consistent across both the bar chart and the 2D maps. Green indicates hydrogen bonding interactions, while blue represents hydrophobic interactions. Purple is used for π-stacking interactions, and red is employed for π–cation interactions. The atom–ligand pairs are visually differentiated based on their respective colors. Carbon is represented by the color gray, nitrogen by blue, oxygen by red, and sulfur by yellow.
Pharmaceuticals 16 01562 g009
Table 1. IC50 of the different compounds in MCF-7 and MDA-MB-231 breast cancer cells.
CompoundMCF-7
IC50 (µM)
MDA-MB-231
IC50 (µM)
1a−2432.33696114.998827
1b277.0771289.7144132
1c554.323499117.833333
1d331.47687767.8459821
1e753.234501377.5989269
1f753.23450114.8518557
1g158.18360868.6064836
1h109.62402975.5411255
1i123.021285459.4034271
1j159.28899196.820554
1k187.18081117.33474
Table 2. Binding interaction energies for potential inhibitors targeting AKT1 and Ox2R.
Contributions of Binding Interaction Energy (kcal/mol)
InhibitorEvdWEELEEGBESURFGApolarGpolarTotal
AKT11f−51.85 (±1.92)−20.35 (±1.96)60.17 (±3.17)−6.44 (±0.46)−72.20 (±3.04)53.73 (±2.89)−18.48 (±1.56)
1h−45.38 (±1.83)−10.11 (±1.32)42.04 (±2.37)−6.05 (±0.50)−55.49 (±3.92)36.00 (±3.10)−19.5 (±0.38)
1k−54.5 (±2.31)−7.88 (±0.66)42.70 (±2.30)−6.74 (±0.50)−62.39 (±2.50)35.97 (±3.93)−26.42 (±0.73)
Ox2R1f−46.71 (±1.99)−15.97 (±1.3)54.37 (±2.36)−5.95 (±0.40)−62.68 (±3.82)48.41 (±4.33)−14.26 (±0.26)
1h−44.55 (±2.09)−26.08 (±1.77)53.22 (±3.84)−6.21 (±0.370)−70.63 (±3.15)47.01 (±4.90)−23.62 (±1.20)
1k−48.87 (±2.71)−24.26 (±1.22)56.38 (±3.08)−6.31 (±0.56)−73.13 (±2.01)50.07 (±2.78)−23.06 (±1.12)
Inhibitors with negative values signify heightened substrate interactions with the targets.
Disclaimer/Publisher’s Note: The statements, opinions and data contained in all publications are solely those of the individual author(s) and contributor(s) and not of MDPI and/or the editor(s). MDPI and/or the editor(s) disclaim responsibility for any injury to people or property resulting from any ideas, methods, instructions or products referred to in the content.