Abstract
The high-sulfated derivative of Ulva pertusa polysaccharide (HU), with unclear structure, has better anti-hyperlipidmia activity than U pertusa polysaccharide ulvan (U). In this study, we explore the main structure of HU and its therapeutic effect against nonalcoholic fatty liver disease (NAFLD). The main structure of HU was elucidated using FT-IR and NMR (13C, 1H, COSY, HSQC, HMBC). The anti-NAFLD activity of HU was explored using the high-fat diet mouse model to detect indicators of blood lipid and liver function and observe the pathologic changes in epididymal fat and the liver. Results showed that HU had these main structural fragments: →4)-β-D-Glcp(1→4)-α-L-Rhap2,3S(1→; →4)-α-L-Rhap3S(1→4)-β-D-Xylp2,3S(1→; →4)-α-L-Rhap3S(1→4)-β-D-Xylp(1→; →4)-α-L-IdopA3S(1→4)-α-L-Rhap3S(1→; →4)-β-D-GlcpA(1→3)-α-L-Rhap(1→; →4)-α-L-IdopA3S(1→4)-β-D-Glcp3Me(1→; →4)-β-D-Xylp2,3S(1→4)-α-L-IdopA3S(1→; and →4)-β-D-Xylp(1→4)-α-L-IdopA3S(1→. Treatment results indicated that HU markedly decreased levels of TC, LDL-C, TG, and AST. Furthermore, lipid droplets in the liver were reduced, and the abnormal enlargement of epididymal fat cells was suppressed. Thus, HU appears to have a protective effect on the development of NAFLD.
1. Introduction
The green seaweed Ulva pertusa (Chlorophyta) is a main contributor to microalgal bloom, or green tide, a serious marine environmental problem in coastal regions [1,2]. Improving the application of U pertusa can reduce the damage of green tide to the marine ecology. In recent years, various uses of green algae, such as for dietary supplementation, have been investigated. U pertusa polysaccharide ulvan (U), a rich biologic component in U pertusa, has been found to have antioxidant [3], immune-modulatory [4], anti-hyperlipidemia [5], antiviral [6], and antiradiation [7] activities.
With the prevalence of obesity and metabolic disorder-related diseases, nonalcoholic fatty liver disease (NAFLD), which is characterized by excessive deposition of fat in hepatocytes, has become the most common chronic liver disease with an estimated worldwide prevalence of 25.2% [8]. As the growing population of NAFLD patients ages, this will likely result in higher rates of decompensated cirrhosis, hepatocellular carcinoma, and liver-related deaths [9]. Currently, the first-line treatment for NAFLD is lifestyle modifications, such as through diet and exercise for weight loss. Approved therapeutic drugs for NAFLD are still lacking [10]. However, several pharmaceuticals are under investigation and show promise, such as nuclear receptor-targeting drugs, metabolic hormone agents, antifibrotic drugs, and combination therapies [11].
In recent years, marine algae polysaccharides with high sulfate content have attracted attention in the treatment of NAFLD [12]. For example, Zhang et al. [13] found that liver steatosis and hepatocellular ballooning induced by NAFLD were significantly attenuated by a polysaccharide derived from Laminaria japonica. Investigation by Ren et al. [14] revealed that sulfated polysaccharide from Enteromorpha prolifera decreased serum glyceral trimyristate level by increasing hydrogen sulfide production, suggesting that it attenuated NAFLD in rats fed a high-fat diet (HFD).
Molecular modification, such as sulfation [15] and molecular weight alteration [16], significantly impact the biologic activities of polysaccharides. Our previous investigation found anti-hyperlipidemic activity of ulvan was improved after increasing the content of sulfate [17]. Thus, we hypothesize that this uniqueness of high-sulfated ulvan (HU) may have therapeutic activity against NAFLD.
In this study, the main sugar residues of HU were characterized by average molecular weight, monosaccharide composition, Fourier transform infrared (FT-IR) spectroscopy, and nuclear magnetic resonance (NMR) analyses to identify for the first time the specific linked forms of sugar residues. In addition, we used the mouse model of NAFLD to study the pharmacologic activity of HU in alleviating NAFLD by measuring blood lipid indicators and morphologic observations of epididymal fat, liver and epididymal fat cells, and lipid deposition in the mouse liver.
2. Results and Discussion
2.1. Chemical Components of U and HU
Sulfate content of U and HU were 19.9% and 34.7%, respectively (Table 1). Sulfate content of HU was about 1.7 times that of U, demonstrating that HU was successfully synthesized. Total sugar content of HU was 54.1%, higher than that of U. Average molecular weights of HU and U were 22.6 kDa and 143.5 kDa, respectively. Analysis of monosaccharide composition revealed that U and HU were mainly composed of Rhap and Xylp. In addition, both U and HU contained GlcpA, indicating that U and HU were acidic polysaccharides [18].

Table 1.
Chemical components of U and HU.
2.2. FT-IR Spectrum Analysis of U and HU
FT-IR analysis revealed the absorptions at 1267 cm−1 and 850 cm−1 corresponded to the bending variation of S=O and C–O–S, respectively [19,20] (Figure 1). Moreover, the S=O and C–O–S signal intensities of HU were stronger than those of U, which indicates a higher degree of sulfation for HU. The absorption signals of HU and U were approximately the same. This indicates that, except for the increase in sulfate content, no new products were synthesized in the sulfation process. The peak at 918 cm−1 may have been caused by β-pyranoside linkage [21].
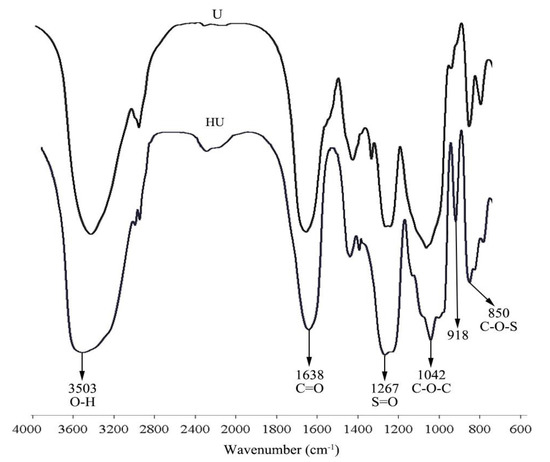
Figure 1.
FT-IR spectrum of U and HU.
2.3. NMR Analyses of HU and U
The 1H NMR (Figure 2A) and COSY NMR (Figure 3A) of U revealed six anomeric proton signals. Their chemical shifts were 4.94, 4.80, 4.95, 4.90, 4.56, and 4.66 ppm, respectively. The peak at 1.36 ppm was due to the C-6 methyl protons of Rhap [22]. There were six anomeric carbon signals at 97.64, 99.99, 98.35, 101.09, 103.10, and 103.34 ppm in 13C NMR of U (Figure 2B). The chemical shifts of signals in the range of 60–80 ppm were assigned to sugar ring carbons. Peaks at around 16.96, 57.33, and 175.41 ppm were ascribed to the C-6 of Rhap, carbon atom of -OCH3, and the carboxyl signal of uronic acid, respectively [23,24,25].
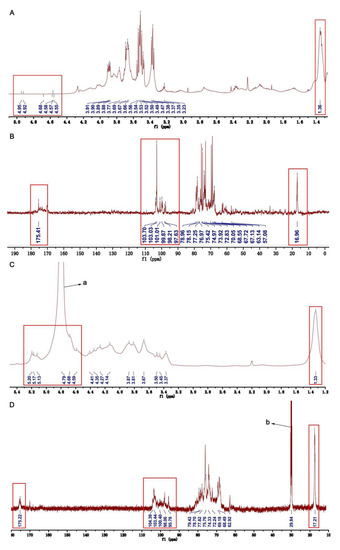
Figure 2.
One-dimensional NMR of U and HU. (A) 1H NMR of U. (B) 13C NMR of U. (C) 1H NMR of HU. (D) 13C NMR of HU. (a) The peak of HOD. (b) The peak of acetone-d6 (defining peak).
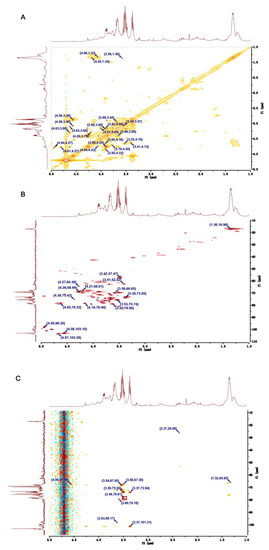
Figure 3.
Two-dimensional NMR of U. (A) COSY NMR of U. (B) HSQC NMR of U. (C) HMBC NMR of U.
Through analyzing the COSY and HSQC NMR spectra of U, the main chemical shifts of H and C were observed (Table 2). The signals at 4.94/97.64 and at 4.80/99.99 ppm in the anomeric region of HSQC spectrum were assigned to H1/C1 of residues Ⅰ and Ⅱ, respectively (Figure 3B). The correlated signals of protons and carbon atoms were separately assigned through analyzing the COSY and HSQC spectra (Figure 3A,B). Due to the existence of the sulfate group, H and C exhibited high chemical shifts. Compared with the C-3 (75.50 ppm) in residue Ⅰ, the C-3 (78.32 ppm) shift in residue Ⅱ was higher. Furthermore, the C-4 (78.20 ppm) shift in residue Ⅱ was low-field, such that residue Ⅱ was demonstrated as 1,4-α-L-Rhap3S. By the same way, the low-field chemical shift of C-3 (75.50 ppm) in residue Ⅰ indicated that residue Ⅰ was 1,3-α-L-Rhap [26,27,28].
Table 2.
1H and 3C NMR chemical shifts of U and HU recorded in D2O.
Residue Ⅲ had an anomeric signal at 4.95/98.35 ppm in the HSQC spectrum (Figure 3B). The shifts of H1–H5 and C1–C6 were obtained from the COSY spectrum and HSQC spectrum, respectively (Figure 3A,B). In addition, a C-6 shift was at around 175.41 ppm, and a C-4 shift at 78.40 ppm was a down-shift, which implied residue Ⅲ was 1,4-β-D-GlcpA [26,28,29].
Residue Ⅳ had the signal at 4.90/101.09 ppm in the anomeric region of the HSQC spectrum of U. According to the COSY spectrum (Figure 3A) and HSQC spectrum (Figure 3B), the chemical shifts of H2-H6 were 4.20, 3.77, 3.67, 3.99, and 3.69 ppm, and the shifts of C2-C6 were 70.00, 74.35, 75.01, 73.48, and 62.67 ppm. Moreover, the shift of C4 was in a low field. Above all, we speculate the residue Ⅳ was 1,4-β-D-Glcp [30].
Both of residue Ⅴ and residue Ⅳ had the same anomeric signal in HSQC spectrum (Figure 3B). Based on the COSY spectrum, the chemical shifts of H1-H6 were 4.90, 4.26, 4.04, 3.69, 3.90, and 3.41 ppm, respectively (Figure 3A). Similarly, the chemical shifts of C1-C6 were 101.90, 68.97, 78.82, 77.01, 76.47, and 62.52 ppm in HSQC spectrum, respectively (Figure 3B). The low-field shift of C-3 (78.82 ppm) demonstrated that -OMe was connected with the C-3 position of residue Ⅴ. As confirmation, in the HMBC spectrum the cross peak at 3.48/78.81 ppm were the corrections between the proton signal (3.47 ppm) of -OMe and C-3 (78.82 ppm) of residue Ⅴ (Figure 3C). In addition, compared with C-5 (76.47 ppm), the C-4 shift was at 77.01 ppm in the low-field region. Based on these results, residue Ⅴ could be identified as 1,4-β-D-Glcp3Me [31].
The signal at 4.56/103.10 ppm in the anomeric region of the HSQC spectrum of U was assigned to residue Ⅵ, and the C-4 shift at 78.38 ppm in the region of the high chemical shift suggested residue Ⅵ was 1,4-β-D-Xylp (Figure 3B) [27,32]. The shifts of proton signals were obtained through analyzing the COSY spectrum, which were 4.56, 3.66, 3.53, 4.16, and 3.41 ppm for H1–H5, respectively (Figure 3A). Similarly, shifts of C1–C5 were identified through the HSQC spectrum (Figure 3B).
Residue Ⅶ had an intense signal at 4.66/103.34 ppm in the anomeric region of the HSQC spectrum of U (Figure 3B). Based on the COSY spectrum, the chemical shifts of H1–H5 were identified (Figure 3A). According to the HSQC spectrum of U (Figure 3B), the carbon atom shifts in residue Ⅶ were assigned. The C-6 shift at 175.41 ppm in residue Ⅶ revealed the presence of uronic acid. In addition, the C-4 shift at 74.00 ppm was at low-field. Therefore, residue Ⅶ could be identified as 1,4-α-L-IdopA [26].
In the 1H NMR of HU, the peak at 1.33 ppm was attributed to the C-6 methyl proton in rhamnose (Figure 2C) [22,25]. The strong peak at 4.79 ppm was assigned to the HOD. The signals at 17.21 and 175.22 ppm in the 13C NMR of HU were assigned to the C-6 of rhamnose and uronic acid (Figure 2D) [24,25]. In addition, the strong signal at 29.84 ppm was assigned to acetone-d6. Of interest, from the 13C NMR, 1H NMR, COSY NMR, and HSQC NMR of HU, we found some anomeric signals, and the chemical shifts of H/C were at 5.19/95.99, 4.91/98.13, 4.76/100.71, 5.11/98.13, 4.66/104.03, 4.85/103.10, and 5.15/100.24 ppm. Based on published literature and our results of the NMRs of U, we assigned the anomeric signals at 5.19/95.99, 4.91/98.13, 4.76/100.71, 5.11/98.13, 4.66/104.03, and 4.85/103.10 ppm to sugar residues Ⅰ (1,3-α-L-Rhap), Ⅱ (1,4-α-L-Rhap3S), Ⅲ (1,4-β-D-GlcpA), Ⅳ (1,4-β-D-Glcp), Ⅴ (1,4-β-D-Glcp3Me), and Ⅷ (1,4-α-L-IdopA) in HU [26,27,28,29,31,32]. Chemical shifts of other protons and carbon atoms of sugar residues were identified by analyzing the COSY and HSQC Ns of HU and listed in Table 2.
Compared with chemical shifts of signals in the U NMRs, new signals appeared in the NMRs of HU, which may be the result of the sulfate linkage applied to U. From the COSY and HSQC NMRs of HU, we identified the chemical shifts of protons and carbon atoms for the new signals (Table 2). Sulfate attracts electrons to reduce the electron density around protons and carbon atoms such that the chemical shifts of protons and carbon atoms move to low-field. With this theory in mind, we speculated that the position of the sulfated group was in the sugar residues.
The anomeric signal at 4.66/104.03 ppm in the HSQC NMR of HU was ascribed to the H1/C1 in residue Ⅶ, 1,4-β-D-Xylp2,3S (Figure 4B). From the COSY NMR of HU, the proton signals at 4.27, 4.33, 3.85, 3.89, and 1.33 ppm were assigned to H2-H6, respectively (Figure 4A). By the same way, the shifts of other carbon atoms were identified from the HSQC NMR of HU (Figure 4B). Of interest, compared with the shifts of H/C in U, the H2/C2 (4.22/77.69 ppm) and H3/C3 (4.33/84.74 ppm) shifts of 1,4-β-D-Xylp in HU appeared in the low-field region. Therefore, we speculated that residue Ⅶ was 1,4-β-D-Xylp2,3S.
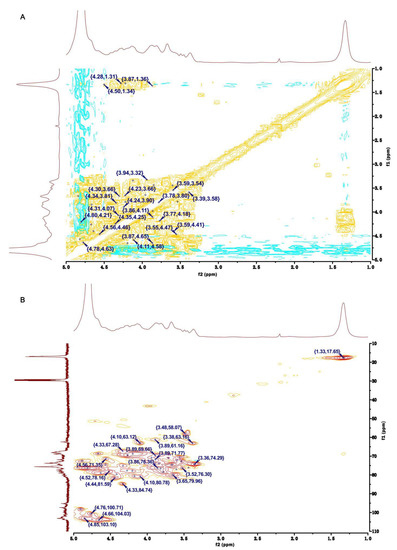
Figure 4.
Two-dimensional NMR of HU. (A) COSY NMR of HU. (B) HSQC NMR of HU.
In the HSQC NMR of HU, the anomeric signal at 5.15/100.24 ppm was assigned to H1/C1 of residue Ⅸ (Figure 4B). The shifts of H1-H6 and C1-C6 were identified by analyzing the COSY and HSQC NMR of HU (Figure 4A,B). Moreover, the H2/C2 (4.67/68.66 ppm) shift of HU was larger than the H2/C2 (4.27/64.38 ppm) shift of U. Based on this and the results of H/C shifts in 1,4-α-L-Rhap3S of U, residue Ⅸ was defined as 1,4-α-L-Rhap2,3S.
Residues Ⅷ and Ⅹ had the same signal (4.85/103.10 ppm) in the anomeric region of the HSQC NMR of HU (Figure 4B). The chemical shifts of protons and carbon atoms were assigned by COSY and HSQC NMRs of HU (Figure 4A,B). Moreover, the shifts of H3/C3 (4.89/72.45 ppm) in residue Ⅹ were higher than the H3/C3 (3.94/70.79 ppm) shift in residue Ⅷ. Thus, residue Ⅹ was assigned as 1,4-α-L-IdopA3S.
The linkage forms of residues in HU were deduced by analyzing the HMBC spectrum of HU (Figure 5). H1 of residue Ⅳ was correlated with C4 of residue Ⅸ (Ⅳ H1/Ⅸ C4), which confirmed residue Ⅳ was attached at the 4-position of residue Ⅸ. The correlations between H1 of residue Ⅱ and C4 of residue Ⅶ (Ⅱ H1/Ⅶ C4) showed that there was a linkage between residue Ⅱ and the C4 of residue Ⅶ. By the same way, residue Ⅹ had interactions between H1 and the C4 of residue Ⅱ (Ⅹ H1/Ⅱ C4), indicating that residue Ⅹ was probably attached at the 4-position of residue Ⅱ. There were also correlations between H1 of residue Ⅲ and C3 of residue Ⅰ (Ⅲ H1/Ⅰ C3), demonstrating that the 1-position of residue Ⅲ was attached at the C3 of residue Ⅰ. In addition, residue Ⅴ had interactions between H4 and C1 of residue Ⅹ (Ⅴ H4/Ⅹ C1), confirming that there was bond between residue Ⅴ and the C1 of residue Ⅹ. Residue Ⅹ had interactions from H4 to C1 of residue Ⅶ (Ⅹ H4/Ⅶ C1), implying that there was linkage from the 1-position of residue Ⅶ to the C4 of residue Ⅹ.
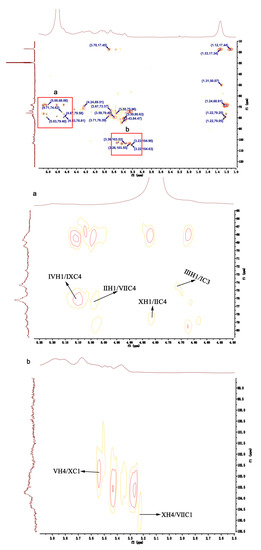
Figure 5.
HMBC NMR of HU.
These results indicate that the plausible structural fragments of HU are as follows: →4)-β-D-Glcp(1→4)-α-L-Rhap2,3S(1→;→4)-α-L-Rhap3S(1→4)-β-D-Xylp2,3S(1→;→4)-α-L-Rhap3S(1→4)-β-D-Xylp (1→;→4)-α-L-IdopA3S(1→4)-α-L-Rhap3S(1→;→4)-β-D-GlcpA(1→3)-α-L-Rhap(1→;→4)-α-L-IdopA3S(1→4)-β-D-Glcp3Me(1→;→4)-β-D-Xylp2,3S(1→4)-α-L-IdopA3S(1→; and→4)-β-D-Xylp(1→4)-α-L-IdopA3S(1→ (Figure 6).
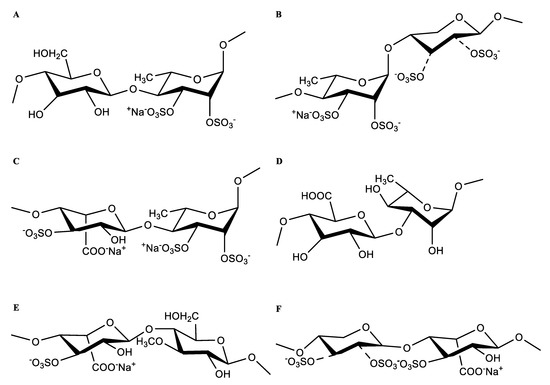
Figure 6.
The main form of residues linkage of HU. (A) →4)-β-D-Glcp(1→4)-α-L-Rhap2,3S(1→. (B) →4)-α-L-Rhap3S(1→4)-β-D-Xylp2,3S(1→. (C) →4)-α-L-IdopA3S(1→4)-α-L-Rhap3S(1→. (D) →4)-β-D-GlcpA(1→3)-α-L-Rhap(1→. (E) →4)-α-L-IdopA3S(1→4)-β-D-Glcp3Me(1→. (F) →4)-β-D-Xylp2,3S(1→4)-α-L-IdopA3S(1→.
OSO3: both positions 2 and 3 of xylose are substituted by sulphate, or one or neither position is substituted.
2.4. Effect of HU on Body Weight in Mice with NAFLD
A sedentary lifestyle and high fat eating habits are considered direct contributors to the development of NAFLD [33]. To examine the effects of HU on NAFLD, male C57BL/6 mice were fed either an HFD or normal diet for 16 weeks and treated with or without polysaccharides for 14 weeks. There was no significant difference in initial animal weight among the five groups (p > 0.05). As the study progressed, mice in the NAFLD group showed increasing slow activity and poor response. Mice in all groups gained weight, with the MOD group showing the most weight gain (Figure 7A). However, after administration of U and HU, weight gain was suppressed. There was a significant difference in weight between the HU and MOD groups (p < 0.01).
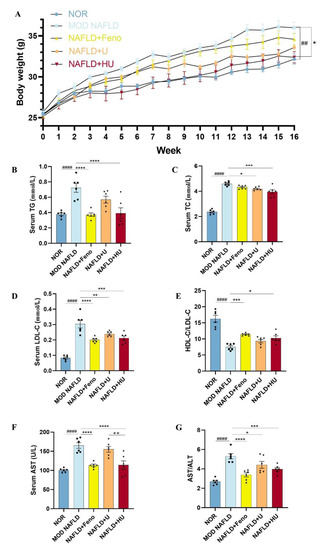
Figure 7.
Effects of U and HU on body weight, lipid metabolism indicators, and liver function in NAFLD mice. (A) Weight change over time. Results of blood parameters: (B) TG, (C) TC, (D) LDL-C, (E) HDL-C and LDL-C ratio, (F) ALT, (G) AST and ALT ratio. Data are shown as the mean ± SEM. ## p < 0.01, #### p < 0.01 vs. NOR group; * p < 0.05, ** p < 0.01, *** p < 0.005, **** p < 0.0001 vs. MOD group; ++ p < 0.01 vs. U group.
2.5. Effect of HU on the Abnormal Changes in Lipid Metabolism Indicators Caused by NAFLD
NAFLD is a hepatic manifestation of a metabolic syndrome and is accompanied by abnormal changes in blood lipids. Compared to mice fed a standard diet, the serum TG level in mice fed an HFD significantly increased (p < 0.01) and even reached a high of 0.72 ± 0.06 mmol/L (Figure 7B). Following HU treatment, TG decreased by 45.7% (p < 0.01), dropping to 0.39 ± 0.07 mmol/L. This result was similar to the NOR group (0.38 ± 0.02 mmol/L) and the Feno group (0.37 ± 0.02 mmol/L).
Excessive fat intake also leads to dyslipidemia. In this study, the level of LDL-C in the MOD mice reached a high of 0.30 ± 0.03 mmol/L. After administration of HU and U, LDL-C levels were reduced by 30.2% in the HU group (0.21 ± 0.01 mmol/L) and by 21.4% in the U group (0.24 ± 0.01 mmol/L). In addition, the inhibitory effects of both HU and U on the increase in LDL-C level were significant (p < 0.01) (Figure 7D). Furthermore, the ratio of HDL-C/LDL-C indicated that HU (p < 0.05) appeared to attenuate dyslipidemia changes caused by NAFLD more so than U (p > 0.05) when compared with the MOD group (Figure 7E).
The liver is the primary organ of cholesterol metabolism. Disturbance in the metabolism balance in the liver can lead to accumulation of lipids in the organ and to development of NAFLD. In this study, compared with the MOD group, TC levels significantly decreased from 4.59 ± 0.07 mmol/L to 3.95 ± 0.17 and 4.18 ± 0.05 mmol/L after HU and U treatments, respectively, levels of which were lower than the Feno group (4.33 ± 0.06 mmol/L). Statistical analysis showed that HU had a better trend of action (compared with the MOD group p < 0.01), although U attenuated elevated serum TC level associated with NAFLD as well (compared with the MOD group p < 0.05) (Figure 7C).
Inhibiting the reabsorption and increasing the excretion of bile acids (BAs) may be a main pathway for HU and U to exert a protective effect against NAFLD. BAs as cholesterol metabolites are involved in lipid metabolism and are released into the intestine to participate in lipid transport [34]. BAs facilitate digestion and absorption of nutrients, after which 95% of the BAs are reabsorbed by the intestine and transported back to the liver, and the rest are excreted with feces [35]. Research has shown that polysaccharides derived from some marine sources affect BA metabolism by reducing reabsorption of BAs, promoting the conversion from cholesterol to bile acid, and decreasing the level of lipids in the liver. For example, Ma et al. [36] found that oyster polysaccharide decreases expression of farnesoid X receptor (FXR) in the gut to reduce reabsorption of BAs. Gao et al. [37] showed that low molecular weight Laminaria japonica polysaccharide has a high bile acid binding capacity, which increases excretion of BAs. Our early investigation on U pertusa found that fecal BA content of hypercholesterolemic rats increased significantly after treatment with U [5].
2.6. Effect of HU on Liver Function in NAFLD Mice
In the MOD group, serum AST was 165.00 ± 7.492 U/L, and compared with the NOR group, it was increased by 64.18%, indicating that hepatocytes in the MOD mice were destroyed (Figure 7F). AST in the HU group (114.0 ± 10.98 U/L) decreased by 30.9% compared with the MOD group (p < 0.01), which was similar to the Feno group (113.5 ± 3.11 U/L). After treatment with U, the AST level in the NAFLD mice was reduced to 155.2 U/L, but the reduction was not significant.
ALT is mainly present in the cytoplasm of hepatocytes, and the AST/ALT level is positively correlated with the severity of hepatocyte necrosis. After administration of HU, not only was the AST level significantly reduced, but the AST/ALT ratio compared with the MOD group was also lower than that of U (p < 0.01). The results showed that HU has an inhibitory effect on ameliorating the abnormal changes in liver function induced by NAFLD compared with U (Figure 7G), although treatment with U and HU both decreased the ASL/ALT levels in NAFLD mice. Reduction in these blood parameters appears to indicate that damage to the liver was reduced following HU administration.
2.7. Effect of HU on Epididymal Adipose Tissue Changes Associated with NAFLD
TG is synthesized by the liver and stored in adipose cells. HFD-induced enlarged epididymal adipose cells affect epididymal fat volume [38]. In this study, adipose tissue volume was the largest in the MOD group. Following administration of U and HU, adipose tissue volume was reduced (Figure 8A). In addition, H&E staining revealed that the MOD group had the fewest number of adipose cells compared with other groups (Figure 8B,C). This was confirmed through semiquantitative analysis of H&E staining of the adipose cells. Of interest, the number of cells in the HU group was larger than that in the U group (p < 0.001), which suggests that the treatment effect of HU was better than U (Figure 8H).
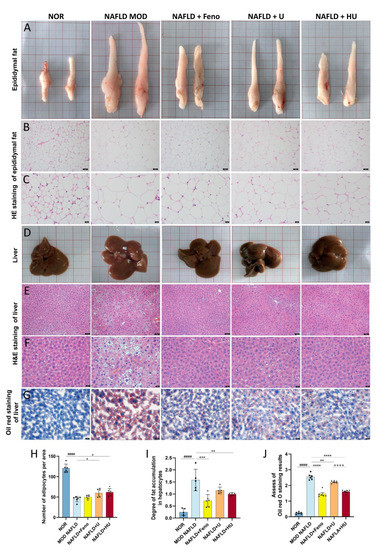
Figure 8.
Effects of U and HU on epididymal fat and liver in NAFLD mice. (A) Epididymal fat morphology. Epididymal fat H&E staining magnification 200× (scale bar = 50 µm) (B) and 400× (scale bar = 20 µm) (C). (D) Morphology of liver tissue. H&E stained liver tissue, magnification 200× (scale bar = 50 µm) (E) and 400× (scale bar = 20 µm) (F). (G) Oil red stained liver tissue, magnification 400× (scale bar = 20 µm). (H) Semiquantitative assessment of H&E stained epididymis adipose tissue. (I) Semiquantitative assessment of H&E stained liver tissue. (J) Semiquantitative assessment of oil red stained liver tissue. Data are shown as mean ± SEM. #### p < 0.01 vs. the NOR group; * p < 0.05, ** p < 0.01, *** p < 0.005, **** p < 0.0001 vs. MOD group; ++++ p < 0.0001 vs. U group.
2.8. Effect of HU on Liver Damage Caused by NAFLD
Morphologically, U and HU administration led to a tighter and more ruddy liver appearance, whereas the livers in the MOD mice fed HFD were paler, and their surfaces had an oily film (Figure 8D).
H&E staining revealed that hepatocyte morphology in the NOR group was normal with abundant cytoplasm and a round central nucleus, but in the MOD group, the nucleus shifted due to the large amount of lipid droplets that occupied the cells (Figure 8E,F). H&E staining results assessed by semiquantitative analysis found that, compared with the MOD group, after HU treatment, the vacuole area was significantly reduced (p < 0.01), and the extent of liver damage was reduced (Figure 8I). Furthermore, results from oil red O staining showed that lipid accumulation was alleviated in hepatocytes (Figure 8G). Although U also relieved lipid deposition in the liver of NAFLD mice, the therapeutic effect of HU was significantly better than U (Figure 8J) (p < 0.01 vs. U group).
Studies have demonstrated that introduction of a sulfate group enhances the negative charge of polysaccharides and intramolecular repulsion [39,40]. Sulfation also alters molecular chain conformation and flexibility in polysaccharides to expose more biologically active units, further augmenting the biologic activities of polysaccharides [41,42], which may account for the heightened efficacy of HU over U in our study. He et al. found Sarcodia ceylonensis polysaccharide (SCP), Ulva lactuca L. polysaccharide(ULLP), and Durvillaea antarctica polysaccharide (DAP) were all sulfated polysaccharides, except for Gracilaria lemaneiformis polysaccharide (GLP). Moreover, the antioxidant activity of SCP, ULLP and DAP were higher than that of GLP [43]. Similarly, the serum LDL-C levels and AST concentrations were lower in type 2 diabetic rats treated with high sulfate content Macrocystis pyrifera (L.) Ag. polysaccharides [44]. Changes in molecular weight also have effects on the biological activity of polysaccharides. Low-molecular weight fucoidan inhibits the differentiation of osteoclasts and reduces osteoporosis in ovariectomized rats [45]. Low molecular weight fucoidan (LMWF), a sulfated polysaccharide extracted from brown seaweeds, has shown strong anti-inflammatory and antioxidant activities. LMWF prevents NAFLD in db/db mice by activation of the SIRT1/AMPK/PGC1α signaling pathway [46]. In our work, HU has a lower molecular weight than U, and the anti-NAFLD effect of HU appears to be stronger in reducing the serum concentration of TC, TG, AST, and LDL-C.
The gut microbiota can be compared to a neglected organ and a second genome [47,48], while marine algae polysaccharides are considered a promising prebiotic for the health of an organism [49,50,51]. Sargassum fusiforme fucoidan re-established the gut microbiota, including reducing the number of harmful bacteria Helicobacter and increasing the number of beneficial bacteria Bacteroides, Lactobacillus, and Alistipes. This prebiotic effect of fucoidan may be responsible for the reduction of insulin resistance, the improvement of glucose and lipid metabolism disorders, and the enhancement of intestinal barrier function [52]. Neoagarooligosaccharides from Gelidium elegans increase the abundance of gut microbes such as Eubacterium fissicatena and Ruminococcaceae UCG-005 [53]. These bacteria were negatively associated with body weight and obesity-related metabolic factors, suggesting that neoagarooligosaccharides target the gut microbiota to improve obesity [54,55]. In addition, Ulva prolifera polysaccharide supplementation not only increased the antiobesity in bacteria such as Parasutterella, Faecalibaculum, and Bifidobacteria but also inhibited microorganisms associated with inflammation and metabolic disorders including Acetatifactor, Tyzzerella, Desulfovibrio, and Ruminoccoccus_1 [56].
The gut–liver axis not only involves the above-mentioned absorption and excretion of the BAs but also the production and utilization of short-chain fatty acids (SCFAs) [57]. SCFAs are produced when gut bacteria ferment dietary fibers and resistant starch. SCFAs are known to help reduce inflammation and support metabolism, among other health benefits [58]. The type and amount of SCFAs synthesized in the gut change due to dysbiosis, which may lead to NAFLD [59,60]. Seaweed polysaccharides are not easily digested and are fermented by intestinal bacteria to produce SCFAs [61,62]. The three main types of SCFAs are acetate, propionate, and butyrate. Acetate and propionate are involved in liver lipogenesis and gluconeogenesis, respectively. In particular, acetate is a precursor to cholesterol or fatty acids [63]. Studies on mice fed an HFD showed that SCFAs reduced liver fatty acid synthase activity and liver lipid synthesis [64].
From the results of our study, we speculate that the effect of HU in treating NAFLD was through the gut–liver axis. In future laboratory and animal studies, we will attempt to elucidate the mechanism of HU in treating NAFLD by detecting levels of bile acids in serum and fecal material and assessing the types and content of SCFAs after fermentation of HU with gut microbiota.
3. Materials and Methods
3.1. Materials and Reagents
Fresh U pertusa was obtained from the Qingdao coastal area of China. The algae species was identified by Chongmei Xu (Associate Professor, Weifang Medical University, China). Dialysis membrane with 3500 Da cutoff was purchased from Spectrum Chemical Manufacturing (New Brunswick, NJ, USA). All other chemical reagents were analytical grade.
3.2. Isolation of U
U was isolated from U pertusa using the method described by Yu et al. [5]. Briefly, dry U pertusa immersed in tap water was boiled for 4 h. The water extract was collected and concentrated to 25% of the initial volume under vacuum at 60 °C. The concentrated water extract was added to a mixture of ethanol and KCl to form final concentrations of 75% and 0.3%, respectively. The mixture was allowed to stand for 24 h to precipitate the polysaccharide. Finally, after soaking the precipitate in absolute ethanol for 36 h and drying at 60 °C, U was obtained.
3.3. Preparation of HU
HU was prepared by derivatization of U with a sulfation reagent [17]. The sulfation reagent was prepared by combining chlorosulfonic acid and formamide (v:v = 1:6) and reacted in an ice bath. U (4.0 g) was added to formamide (160 mL) and mixed for 30 min at 60 °C, after which the sulfation reagent (50 mL) was added. After reacting for 4 h, the mixture was cooled to room temperature and neutralized with 30% NaOH. Then, the mixture was dialyzed with tap water for 24 h and distilled water for 48 h. Finally, after concentrating and freeze-drying, HU was prepared.
3.4. Chemical Analysis of U and HU
Total sugar content was measured using the phenol-sulfuric acid method [65]. Rhamnose was used as a standard to detect the absorbance of the polysaccharide sample at 490 nm to obtain the total sugar content. Sulfate content was detected through the barium chloride-gelatin method [66]. Briefly, we added the HCl solution (0.2 mol/L) and the configured BaCl2-gelatin solution to the polysaccharide solution, then mixed well and let stand for 20 min. Next, we measured the OD value at 500 nm. In this experiment, K2SO4 was used as the standard.
3.5. Determination of Molecular Weights of U and HU
Molecular weights of U and HU were determined using high-performance liquid chromatography (HPLC). Briefly, the molecular weights of U and HU were detected by a TSK-Gel G3000PWXL column (7.5 × 300 mm; Tosoh, Tokyo, Japan) using HPLC (LC-20A; Shimadzu, Kyoto, Japan) under the following experimental conditions: column temperature 40 °C, 0.1 mol/L Na2SO4 as the mobile phase, and a flow rate of 0.5 mL/min. Dextran was used as the standard.
3.6. Analysis of Monosaccharide Compositions of U and HU
The PMP precolumn derivatizations of U and HU were performed using the flow the method of Wen, Cui, Dong, and Zhang [67]. The monosaccharide compositions of U and HU were measured using the HPLC YMC-Pack ODS-AQ column (250 × 4.6 nm, 5 μm; LC-20 A; Shimadzu) under the following conditions: column temperature 30 °C, the mixture of 0.4% triethylamine and acetonitrile (9:1) as mobile phase A, the mixture of 0.4% triethylamine and acetonitrile (4:6) as mobile phase B, and flow rate of 1.0 mL/min. In addition, rhamnose (Rhap), xylose (Xylp), mannose (Manp), glucose (Glcp), glucuronic acid (GlcpA), and fucose (Fucp) were used as the monosaccharide standards.
3.7. Analysis of FT-IR and NMR Spectrum of U and HU
The dried samples were crushed with KBr powder using a mortar and pestle, and the resulting powder was pressed into pellets, which were then transferred to a Thermo/Nicolet Magna-Avatar 360 spectrometer (Thermo Scientific; Waltham, MA, USA) to obtain the FT-IR spectra. U was dissolved in D2O solvent, and HU was dissolved in a mixed solvent (D2O+C3D6O). The 1H-NMR, 13C-NMR, and 2D NMR (COSY, HSQC, HMBC) spectra of U and HU were obtained using an ultra-low temperature probe of a 600 MHz NMR spectrometer (600 MHz; AVANCE III; Bruker; Billerica, MA, USA).
3.8. Animal Models and Experimental Design
Male C57BL/6J mice were used as the NAFLD model, which was constructed to verify the effects of HU on NAFLD induced by a high-fat diet (HFD). All mice were eight weeks old when purchased from Vital River Laboratory Animal Technology (Beijing, China). They were housed in the animal barrier system at the Animal Laboratory Center of Weifang Medical University, where the temperature was maintained at 22 ± 2 °C with 50% ± 10% relative humidity, and a 12:12 h light/dark cycle.
After 1 week of adaptation, thirty male mice weighing 22–25 g were randomly divided into five groups with six mice in each group. The groups were designated normal diet (NOR), model (MOD), positive drug, U, and HU. The positive drug group mice were given fenofibrate solution at an intragastric dose of 30 mg/kg/d. The NOR and MOD mice were each given an equal volume of 0.2 mL distilled water intragastrically. Mice in the remaining two groups were given orally U or HU at 250 mg/kg/d. Except for the NOR group, mice in the other four groups were fed with HFD purchased from Huafukang Biotechnology (Beijing, China) for 16 continuous weeks. For the first two weeks, the animals only received feedings; then the gavage experiment was performed from the third through the sixteenth weeks [68]. Body weights were recorded once weekly, and the mental state of the mice was observed throughout the study. At the end of the experiment (week 16), all animals were weighed and anesthetized with 1% (w/v) sodium pentobarbital after overnight fasting. Blood samples were collected, and fresh mouse liver as well as epididymal fat tissue were harvested and washed with saline.
Animal experiments aimed to minimize distress to the animals and were performed according to the National Institutes of Health Guide for the Care and Use of Laboratory Animals (2011) and were approved by the Weifang Medical University Ethics Committee.
3.9. Biochemical Analysis of Blood Samples
Blood samples were collected from anesthetized mice via retro-orbital sampling. Blood sample tubes were allowed to stand at room temperature for 60 min followed by centrifugation for 15 min at 860 g. All serum biochemical indicators were measured using a biochemistry analyzer (Cobas 8000; Roche Diagnostics, Basel, Switzerland). The serum biochemistry indicators included total cholesterol (TC), triglycerides (TG), high-density lipoprotein cholesterol (HDL-C), low-density lipoprotein cholesterol (LDL-C), the ratio of HDL-C and LDL-C, glutamic oxaloacetic transaminase (AST), glutamic pyruvic transaminase (ALT), and the AST:ALT ratio.
3.10. Histopathologic Observations
Harvested livers were soaked overnight in 4% paraformaldehyde solution. Liver tissues then underwent paraffin embedding, continuous sectioning, dewaxing, hematoxylin–eosin (H&E) staining, and neutral gum sealing, among other testing. The liver tissues were also stained with oil red O. Epididymal adipose tissue was immersed in fixation fluid, followed by the H&E staining and processing as described above. Histomorphologic changes in the liver and epididymal fat tissue of each group were observed under 200× and 400× light microscopy (BX43; Olympus; Tokyo, Japan). Areas of liver lipid droplets and number of adipose tissue cells underwent semiquantitative computational evaluation using ImageJ software (National Institutes of Health, Bethesda, MD, USA). The percentage of liver parenchyma occupied by fatty liver cells was divided into four levels: 0–5%, 5–33%, 33–66%, or more than 66% [69].
3.11. Statistical Analysis
All data were expressed as mean ± standard error of mean (SEM). Statistical comparisons of data were carried out using one-way ANOVA by GraphPad Prism software version 6.0 (GraphPad Software Inc., La Jolla, CA, USA). Significant differences were set at p < 0.05.
4. Conclusions
We evaluated the main structural fragments and anti-NAFLD effect of HU. The results indicated that the main structural fragments of HU were →4)-β-D-Glcp(1→4)-α-L-Rhap2,3S(1→; →4)-α-L-Rhap3S(1→4)-β-D-Xylp2,3S(1→; →4)-α-L-Rhap3S(1→4)-β-D-Xylp(1→; →4)-α-L-IdopA3S(1→4)-α-L-Rhap3S(1→; →4)-β-D-GlcpA(1→3)-α-L-Rhap(1→; →4)-α-L-IdopA3S(1→4)-β-D-Glcp3Me(1→; →4)-β-D-Xylp2,3S(1→4)-α-L-IdopA3S(1→; and →4)-β-D-Xylp(1→4)-α-L-IdopA3S(1→. In NAFLD mice, HU not only improved serum lipid indicators (TC, TG, LDL-C, LDL-C/HDL-C) and liver function parameters (AST, AST/ALT) but also inhibited the abnormal enlargement of epididymal fat cells and massive deposition of lipid in the liver. Our current study highlights the potential of HU supplement as a functional food for preventing NAFLD. As a next step, we will explore HU in terms of dose dependence and toxicology as an anti-NAFLD drug. In addition, we plan to study the role and mechanism of HU in the treatment of NAFLD using animal experiments with fecal bacteria transplantation.
Author Contributions
Conceptualization, T.Z. and H.Q.; methodology, Y.W. and L.L.; software, S.W.; formal analysis, B.Z. and X.W.; investigation, Y.L. and K.C.; data curation, L.L. and Y.W.; writing—original draft preparation, Y.W. and L.L.; writing—review and editing, T.Z. and H.Q.; supervision, H.Q. and T.Z.; funding acquisition, T.Z. and H.Q. All authors have read and agreed to the published version of the manuscript.
Funding
This work was supported by the Beijing Natural Science Foundation (grant number 7212195); National Natural Science Foundation of China (grant numbers 81973627, 41206129); Natural Science Foundation of Shandong Province (grant number ZR2022MD058); National High Level Hospital Clinical Research Funding (grant number 2022-NHLHCRPY-06); and Weifang Medical University Teachers Domestic Scholar Program.
Institutional Review Board Statement
The study was approved by the Experimental Animal Ethics Committee of Weifang Medical College (2021SDL386).
Informed Consent Statement
Not applicable.
Data Availability Statement
Data is contained within article.
Acknowledgments
All NMR experiments were carried out at the Beijing NMR Center and the NMR facility of the National Center for Protein Sciences at Peking University. The authors thank Nissi S. Wang, MSc, for developmental editing of the manuscript and Li Hongwei’s guidance on the analysis of NMR spectra.
Conflicts of Interest
The authors declare no conflict of interest.
References
- Han, H.B.; Yan, L.; Song, W.; Wang, Z.L.; Zhang, X.L. Complete chloroplast genome of Ulva pertusa, one of the causal species of green macroalgal blooms in the coastal waters of Qinhuangdao, China. Mitochondrial DNA B Resour. 2020, 5, 1084–1086. [Google Scholar] [CrossRef]
- Xiao, J.; Wang, Z.; Song, H.; Fan, S.; Yuan, C.; Fu, M.; Miao, X.; Zhang, X.; Su, R.; Hu, C. An anomalous bi-macroalgal bloom caused by Ulva and Sargassum seaweeds during spring to summer of 2017 in the western Yellow Sea, China. Harmful Algae 2020, 93, 101760. [Google Scholar] [CrossRef] [PubMed]
- Le, B.; Golokhvast, K.S.; Yang, S.H.; Sun, S. Optimization of Microwave-Assisted Extraction of Polysaccharides from Ulva pertusa and Evaluation of Their Antioxidant Activity. Antioxidants 2019, 8, 129. [Google Scholar] [CrossRef] [PubMed]
- Han, Y.; Wu, Y.; Li, G.; Li, M.; Yan, R.; Xu, Z.; Lei, H.; Sun, Y.; Duan, X.; Hu, L.; et al. Structural characterization and transcript-metabolite correlation network of immunostimulatory effects of sulfated polysaccharides from green alga Ulva pertusa. Food Chem. 2021, 342, 128537. [Google Scholar] [CrossRef] [PubMed]
- Pengzhan, Y.; Ning, L.; Xiguang, L.; Gefei, Z.; Quanbin, Z.; Pengcheng, L. Antihyperlipidemic effects of different molecular weight sulfated polysaccharides from Ulva pertusa (Chlorophyta). Pharmacol. Res. 2003, 48, 543–549. [Google Scholar] [CrossRef]
- Chi, Y.; Zhang, M.; Wang, X.; Fu, X.; Guan, H.; Wang, P. Ulvan lyase assisted structural characterization of ulvan from Ulva pertusa and its antiviral activity against vesicular stomatitis virus. Int. J. Biol. Macromol. 2020, 157, 75–82. [Google Scholar] [CrossRef]
- Shi, J.; Cheng, C.; Zhao, H.; Jing, J.; Gong, N.; Lu, W. In vivo anti-radiation activities of the Ulva pertusa polysaccharides and polysaccharide-iron (III) complex. Int. J. Biol. Macromol. 2013, 60, 341–346. [Google Scholar] [CrossRef]
- Younossi, Z.M.; Koenig, A.B.; Abdelatif, D.; Fazel, Y.; Henry, L.; Wymer, M. Global epidemiology of nonalcoholic fatty liver disease-Meta-analytic assessment of prevalence, incidence, and outcomes. Hepatology 2016, 64, 73–84. [Google Scholar] [CrossRef]
- Ahmad, M.I.; Khan, M.U.; Kodali, S.; Shetty, A.; Bell, S.M.; Victor, D. Hepatocellular Carcinoma Due to Nonalcoholic Fatty Liver Disease: Current Concepts and Future Challenges. J. Hepatocell. Carcinoma. 2022, 9, 477–496. [Google Scholar] [CrossRef]
- Younossi, Z.M.; Corey, K.E.; Lim, J.K. AGA Clinical Practice Update on Lifestyle Modification Using Diet and Exercise to Achieve Weight Loss in the Management of Nonalcoholic Fatty Liver Disease: Expert Review. Gastroenterology 2021, 160, 912–918. [Google Scholar] [CrossRef]
- Schattenberg, J.M. Emerging Pharmacological Treatment in Nonalcoholic Steatohepatitis. Visc. Med. 2020, 36, 411–416. [Google Scholar] [CrossRef]
- Nair, D.G.; Weiskirchen, R.; Al-Musharafi, S.K. The use of marine-derived bioactive compounds as potential hepatoprotective agents. Acta. Pharmacol. Sin. 2015, 36, 158–170. [Google Scholar] [CrossRef]
- Zhang, Y.; Yang, L.; Zhao, N.; Hong, Z.; Cai, B.; Le, Q.; Yang, T.; Shi, L.; He, J. Soluble Polysaccharide Derived from Laminaria japonica Attenuates Obesity-Related Nonalcoholic Fatty Liver Disease Associated with Gut Microbiota Regulation. Mar. Drugs 2021, 19, 699. [Google Scholar] [CrossRef]
- Ren, R.; Yang, Z.; Zhao, A.; Huang, Y.; Lin, S.; Gong, J.; Chen, J.; Zhu, P.; Huang, F.; Lin, W. Sulfated polysaccharide from Enteromorpha prolifera increases hydrogen sulfide production and attenuates non-alcoholic fatty liver disease in high-fat diet rats. Food Funct. 2018, 9, 4376–4383. [Google Scholar] [CrossRef]
- Liu, X.; Chen, X.; Xie, L.; Xie, J.; Shen, M. Sulfated Chinese yam polysaccharide enhances the immunomodulatory activity of RAW 264.7 cells via the TLR4-MAPK/NF-κB signaling pathway. Food Funct. 2022, 13, 1316–1326. [Google Scholar] [CrossRef]
- Deng, Z.; Wu, N.; Wang, J.; Geng, L.; Yue, Y.; Wang, F.; Zhang, Q. Low molecular weight fucoidan fraction LF2 improves metabolic syndrome via up-regulating PI3K-AKT-mTOR axis and increasing the abundance of Akkermansia muciniphila in the gut microbiota. Int. J. Biol. Macromol. 2021, 193, 789–798. [Google Scholar] [CrossRef]
- Qi, H.; Huang, L.Y.; Liu, X.L.; Liu, D.M.; Zhang, Q.B.; Liu, S.M. Antihyperlipidemic activity of high sulfate content derivative of polysaccharide extracted from Ulva pertusa (Chlorophyta). Carbohydr. Polym. 2012, 87, 1637–1640. [Google Scholar] [CrossRef]
- Liu, Z.; Zhang, Y.; Ai, C.; Tian, W.; Wen, C.; Song, S.; Zhu, B. An acidic polysaccharide from Patinopecten yessoensis skirt prevents obesity and improves gut microbiota and metabolism of mice induced by high-fat diet. Food Res. Int. 2022, 154, 110980. [Google Scholar] [CrossRef]
- Cui, Y.; Liu, X.; Li, S.; Hao, L.; Du, J.; Gao, D.; Kang, Q.; Lu, J. Extraction, characterization and biological activity of sulfated polysaccharides from seaweed Dictyopteris divaricata. Int. J. Biol. Macromol. 2018, 117, 256–263. [Google Scholar] [CrossRef]
- Yang, Q.; Jiang, Y.; Fu, S.; Shen, Z.; Zong, W.; Xia, Z.; Zhan, Z.; Jiang, X. Protective Effects of Ulva lactuca Polysaccharide Extract on Oxidative Stress and Kidney Injury Induced by D-Galactose in Mice. Mar. Drugs 2021, 19, 539. [Google Scholar] [CrossRef]
- Zheng, Y.; Zhang, S.; Wang, Q.; Lu, X.; Lin, L.; Tian, Y.; Xiao, J.; Zheng, B. Characterization and hypoglycemic activity of a β-pyran polysaccharides from bamboo shoot (Leleba oldhami Nakal) shells. Carbohydr. Polym. 2016, 144, 438–446. [Google Scholar] [CrossRef] [PubMed]
- Olawuyi, I.F.; Lee, W.Y. Structural characterization, functional properties and antioxidant activities of polysaccharide extract obtained from okra leaves (Abelmoschus esculentus). Food Chem. 2021, 354, 129437. [Google Scholar] [CrossRef] [PubMed]
- Halaj, M.; Matulová, M.; Šutovská, M.; Barboríková, J.; Kazimierová, I.; Fraňová, S.; Přibyl, P.; Cepák, V.; Lukavský, J.; Capek, P. Chemico-physical and pharmacodynamic properties of extracellular Dictyosphaerium chlorelloides biopolymer. Carbohydr. Polym. 2018, 198, 215–224. [Google Scholar] [CrossRef] [PubMed]
- Tu, J.Q.; Liu, H.P.; Wen, Y.H.; Chen, P.; Liu, Z.T. A novel polysaccharide from Hericium erinaceus: Preparation, structural characteristics, thermal stabilities, and antioxidant activities in vitro. J. Food Biochem. 2021, 45, e13871. [Google Scholar] [CrossRef] [PubMed]
- Yao, H.Y.; Wang, J.Q.; Yin, J.Y.; Nie, S.P.; Xie, M.Y. A review of NMR analysis in polysaccharide structure and conformation: Progress, challenge and perspective. Food. Res. Int. 2021, 143, 110290. [Google Scholar] [CrossRef]
- de Carvalho, M.M.; de Freitas, R.A.; Ducatti, D.R.B.; Ferreira, L.G.; Gonçalves, A.G.; Colodi, F.G.; Mazepa, E.; Aranha, E.M.; Noseda, M.D.; Duarte, M.E.R. Modification of ulvans via periodate-chlorite oxidation: Chemical characterization and anticoagulant activity. Carbohydr. Polym. 2018, 197, 631–640. [Google Scholar] [CrossRef]
- Guidara, M.; Yaich, H.; Amor, I.B.; Fakhfakh, J.; Gargouri, J.; Lassoued, S.; Blecker, C.; Richel, A.; Attia, H.; Garna, H. Effect of extraction procedures on the chemical structure, antitumor and anticoagulant properties of ulvan from Ulva lactuca of Tunisia coast. Carbohydr. Polym. 2021, 253, 117283. [Google Scholar] [CrossRef]
- Wang, S.; Wang, W.; Hou, L.; Qin, L.; He, M.; Li, W.; Mao, W. A sulfated glucuronorhamnan from the green seaweed Monostroma nitidum: Characteristics of its structure and antiviral activity. Carbohydr. Polym. 2020, 227, 115280. [Google Scholar] [CrossRef]
- Glasson, C.R.K.; Luiten, C.A.; Carnachan, S.M.; Daines, A.M.; Kidgell, J.T.; Hinkley, S.F.R.; Praeger, C.; Andrade Martinez, M.; Sargison, L.; Magnusson, M.; et al. Structural characterization of ulvans extracted from blade (Ulva ohnoi) and filamentous (Ulva tepida and Ulva prolifera) species of cultivated Ulva. Int. J. Biol. Macromol. 2022, 194, 571–579. [Google Scholar] [CrossRef]
- Liu, W.; Li, W.; Sui, Y.; Li, X.Q.; Liu, C.; Jing, H.; Zhang, H.; Cao, W. Structure characterization and anti-leukemia activity of a novel polysaccharide from Angelica sinensis (Oliv.) Diels. Int. J. Biol. Macromol. 2019, 121, 161–172. [Google Scholar] [CrossRef]
- Gao, X.; Qu, H.; Shan, S.; Song, C.; Baranenko, D.; Li, Y.; Lu, W. A novel polysaccharide isolated from Ulva Pertusa: Structure and physicochemical property. Carbohydr. Polym. 2020, 233, 115849. [Google Scholar] [CrossRef]
- Patova, O.A.; Luаnda, A.; Paderin, N.M.; Popov, S.V.; Makangara, J.J.; Kuznetsov, S.P.; Kalmykova, E.N. Xylogalacturonan-enriched pectin from the fruit pulp of Adansonia digitata: Structural characterization and antidepressant-like effect. Carbohydr. Polym. 2021, 262, 117946. [Google Scholar] [CrossRef]
- Juanola, O.; Martínez-López, S.; Francés, R.; Gómez-Hurtado, I. Non-Alcoholic Fatty Liver Disease: Metabolic, Genetic, Epigenetic and Environmental Risk Factors. Int. J. Environ. Res. Public Health. 2021, 18, 5227. [Google Scholar] [CrossRef]
- Simbrunner, B.; Trauner, M.; Reiberger, T. Review article: Therapeutic aspects of bile acid signalling in the gut-liver axis. Aliment. Pharmacol. Ther. 2021, 54, 1243–1262. [Google Scholar] [CrossRef]
- Staley, C.; Weingarden, A.R.; Khoruts, A.; Sadowsky, M.J. Interaction of gut microbiota with bile acid metabolism and its influence on disease states. Appl. Microbiol. Biotechnol. 2017, 101, 47–64. [Google Scholar] [CrossRef]
- Ma, Y.; Liu, X.; Liu, D.; Yin, Z.; Yang, X.; Zeng, M. Oyster (Crassostrea gigas) Polysaccharide Ameliorates High-Fat-Diet-Induced Oxidative Stress and Inflammation in the Liver via the Bile Acid-FXR-AMPKα Pathway. J. Agric. Food Chem. 2022, 70, 8662–8671. [Google Scholar] [CrossRef]
- Gao, J.; Lin, L.; Sun, B.; Zhao, M. A comparison study on polysaccharides extracted from Laminaria japonica using different methods: Structural characterization and bile acid-binding capacity. Food Funct. 2017, 8, 3043–3052. [Google Scholar] [CrossRef]
- Bennick, R.A.; Nagengast, A.A.; DiAngelo, J.R. The SR proteins SF2 and RBP1 regulate triglyceride storage in the fat body of Drosophila. Biochem. Biophys. Res. Commun. 2019, 516, 928–933. [Google Scholar] [CrossRef]
- Li, Q.; Jiang, S.; Shi, W.; Qi, X.; Song, W.; Mou, J.; Yang, J. Structure characterization, antioxidant and immunoregulatory properties of a novel fucoidan from the sea cucumber Stichopus chloronotus. Carbohydr. Polym. 2020, 231, 115767. [Google Scholar] [CrossRef]
- Mou, J.; Zhuang, D.; Li, Q.; Song, W.; Yang, J. Comparison of chain conformation properties of bio-active fucosylated chondroitin sulfates from two different sea cucumbers. Int. J. Biol. Macromol. 2019, 133, 44–50. [Google Scholar] [CrossRef]
- Arlov, Ø.; Aachmann, F.L.; Feyzi, E.; Sundan, A.; Skjåk-Bræk, G. The Impact of Chain Length and Flexibility in the Interaction between Sulfated Alginates and HGF and FGF-2. Biomacromolecules 2015, 16, 3417–3424. [Google Scholar] [CrossRef] [PubMed]
- Chen, C.; Wu, W.; Xu, X.; Zhang, L.; Liu, Y.; Wang, K. Chain conformation and anti-tumor activity of derivatives of polysaccharide from Rhizoma Panacis Japonici. Carbohydr. Polym. 2014, 105, 308–316. [Google Scholar] [CrossRef] [PubMed]
- He, J.; Xu, Y.; Chen, H.; Sun, P. Extraction, Structural Characterization, and Potential Antioxidant Activity of the Polysaccharides from Four Seaweeds. Int. J. Mol. Sci. 2016, 17, 1988. [Google Scholar] [CrossRef] [PubMed]
- Jia, R.B.; Wu, J.; Li, Z.R.; Ou, Z.R.; Lin, L.; Sun, B.; Zhao, M. Structural characterization of polysaccharides from three seaweed species and their hypoglycemic and hypolipidemic activities in type 2 diabetic rats. Int. J. Biol. Macromol. 2020, 155, 1040–1049. [Google Scholar] [CrossRef] [PubMed]
- Jin, X.; Zhu, L.; Li, X.; Jia, J.; Zhang, Y.; Sun, X.; Ma, J.; Liu, Z.; Ma, X. Low-molecular weight fucoidan inhibits the differentiation of osteoclasts and reduces osteoporosis in ovariectomized rats. Mol. Med. Rep. 2017, 15, 890–898. [Google Scholar] [CrossRef]
- Zheng, Y.; Liu, T.; Wang, Z.; Xu, Y.; Zhang, Q.; Luo, D. Low molecular weight fucoidan attenuates liver injury via SIRT1/AMPK/PGC1α axis in db/db mice. Int. J. Biol. Macromol. 2018, 112, 929–936. [Google Scholar] [CrossRef]
- O’Hara, A.M.; Shanahan, F. The gut flora as a forgotten organ. EMBO Rep. 2006, 7, 688–693. [Google Scholar] [CrossRef]
- Zhu, B.; Wang, X.; Li, L. Human gut microbiome: The second genome of human body. Protein Cell 2010, 1, 718–725. [Google Scholar] [CrossRef]
- Cheong, K.L.; Yu, B.; Chen, J.; Zhong, S. A Comprehensive Review of the Cardioprotective Effect of Marine Algae Polysaccharide on the Gut Microbiota. Foods 2022, 11, 3550. [Google Scholar] [CrossRef]
- Shannon, E.; Conlon, M.; Hayes, M. Seaweed Components as Potential Modulators of the Gut Microbiota. Mar. Drugs 2021, 19, 358. [Google Scholar] [CrossRef]
- Wang, X.; Wang, X.; Jiang, H.; Cai, C.; Li, G.; Hao, J.; Yu, G. Marine polysaccharides attenuate metabolic syndrome by fermentation products and altering gut microbiota: An overview. Carbohydr. Polym. 2018, 195, 601–612. [Google Scholar] [CrossRef]
- Zhang, Y.; Zuo, J.; Yan, L.; Cheng, Y.; Li, Q.; Wu, S.; Chen, L.; Thring, R.W.; Yang, Y.; Gao, Y.; et al. Sargassum fusiforme Fucoidan Alleviates High-Fat Diet-Induced Obesity and Insulin Resistance Associated with the Improvement of Hepatic Oxidative Stress and Gut Microbiota Profile. J. Agric. Food Chem. 2020, 68, 10626–10638. [Google Scholar] [CrossRef]
- Oh, J.K.; Vasquez, R.; Kim, S.H.; Lee, J.H.; Kim, E.J.; Hong, S.K.; Kang, D.K. Neoagaro-Oligosaccharides modulate gut microbiota and alleviate body weight gain and metabolic syndrome in high-fat diet-induced obese rats. J. Funct. Foods 2022, 88, 104869. [Google Scholar] [CrossRef]
- Yue, C.; Li, M.; Li, J.; Han, X.; Zhu, H.; Yu, G.; Cheng, J. Medium-, long- and medium-chain-type structured lipids ameliorate high-fat diet-induced atherosclerosis by regulating inflammation, adipogenesis, and gut microbiota in ApoE(−/−) mice. Food Funct. 2020, 11, 5142–5155. [Google Scholar] [CrossRef]
- Zhao, L.; Zhang, Q.; Ma, W.; Tian, F.; Shen, H.; Zhou, M. A combination of quercetin and resveratrol reduces obesity in high-fat diet-fed rats by modulation of gut microbiota. Food Funct. 2017, 8, 4644–4656. [Google Scholar] [CrossRef]
- Pung, H.C.; Lin, W.S.; Lo, Y.C.; Hsu, C.C.; Ho, C.T.; Pan, M.H. Ulva prolifera polysaccharide exerts anti-obesity effects via upregulation of adiponectin expression and gut microbiota modulation in high-fat diet-fed C57BL/6 mice. J. Food Drug Anal. 2022, 30, 46–61. [Google Scholar] [CrossRef]
- Jia, B.; Zou, Y.; Han, X.; Bae, J.W.; Jeon, C.O. Gut microbiome-mediated mechanisms for reducing cholesterol levels: Implications for ameliorating cardiovascular disease. Trends. Microbiol. 2023, 01, 76–91. [Google Scholar] [CrossRef]
- Silva, Y.P.; Bernardi, A.; Frozza, R.L. The Role of Short-Chain Fatty Acids from Gut Microbiota in Gut-Brain Communication. Front. Endocrinol. 2020, 11, 25. [Google Scholar] [CrossRef]
- Canfora, E.E.; Meex, R.C.R.; Venema, K.; Blaak, E.E. Gut microbial metabolites in obesity, NAFLD and T2DM. Nat. Rev. Endocrinol. 2019, 15, 261–273. [Google Scholar] [CrossRef]
- Duparc, T.; Plovier, H.; Marrachelli, V.G.; Van, H.M.; Essaghir, A.; Ståhlman, M.; Matamoros, S.; Geurts, L.; Pardo-Tendero, M.M.; Druart, C.; et al. Hepatocyte MyD88 affects bile acids, gut microbiota and metabolome contributing to regulate glucose and lipid metabolism. Gut 2017, 66, 620–632. [Google Scholar] [CrossRef]
- Fu, X.; Cao, C.; Ren, B.; Zhang, B.; Huang, Q.; Li, C. Structural characterization and in vitro fermentation of a novel polysaccharide from Sargassum thunbergii and its impact on gut microbiota. Carbohydr. Polym. 2018, 183, 230–239. [Google Scholar] [CrossRef] [PubMed]
- Zheng, L.X.; Chen, X.Q.; Cheong, K.L. Current trends in marine algae polysaccharides: The digestive tract, microbial catabolism, and prebiotic potential. Int. J. Biol. Macromol. 2020, 151, 344–354. [Google Scholar] [CrossRef] [PubMed]
- Subramanian, S.; Goodspeed, L.; Wang, S.; Kim, J.; Zeng, L.; Ioannou, G.N.; Haigh, W.G.; Yeh, M.M.; Kowdley, K.V.; O’Brien, K.D.; et al. Dietary cholesterol exacerbates hepatic steatosis and inflammation in obese LDL receptor-deficient mice. J. Lipid Res. 2011, 52, 1626–1635. [Google Scholar] [CrossRef] [PubMed]
- Den Besten, G.; Bleeker, A.; Gerding, A.; van Eunen, K.; Havinga, R.; van Dijk, T.H.; Oosterveer, M.H.; Jonker, J.W.; Groen, A.K.; Reijngoud, D.J.; et al. Short-Chain Fatty Acids Protect Against High-Fat Diet-Induced Obesity via a PPARγ-Dependent Switch from Lipogenesis to Fat Oxidation. Diabetes 2015, 64, 2398–2408. [Google Scholar] [CrossRef]
- Dubois, M.; Gilles, K.; Hamilton, J.K.; Rebers, P.A.; Smith, F. A colorimetric method for the determination of sugars. Nature 1951, 168, 167. [Google Scholar] [CrossRef]
- Kawai, Y.; Seno, N.; Anno, K. A modified method for chondrosulfatase assay. Anal. Biochem. 1969, 32, 314–321. [Google Scholar] [CrossRef]
- Wen, M.; Cui, Y.; Dong, C.X.; Zhang, L. Quantitative changes in monosaccharides of Keemun black tea and qualitative analysis of theaflavins-glucose adducts during processing. Food Res. Int. 2021, 148, 110588. [Google Scholar] [CrossRef]
- Wang, Y.; Zhao, H.; Li, X.; Wang, Q.; Yan, M.; Zhang, H.; Zhao, T.; Zhang, N.; Zhang, P.; Peng, L.; et al. Formononetin alleviates hepatic steatosis by facilitating TFEB-mediated lysosome biogenesis and lipophagy. J. Nutr. Biochem. 2019, 73, 108214. [Google Scholar] [CrossRef]
- Castera, L.; Friedrich-Rust, M.; Loomba, R. Noninvasive Assessment of Liver Disease in Patients with Nonalcoholic Fatty Liver Disease. Gastroenterology 2019, 156, 1264–1281.e4. [Google Scholar] [CrossRef]
Disclaimer/Publisher’s Note: The statements, opinions and data contained in all publications are solely those of the individual author(s) and contributor(s) and not of MDPI and/or the editor(s). MDPI and/or the editor(s) disclaim responsibility for any injury to people or property resulting from any ideas, methods, instructions or products referred to in the content. |
© 2022 by the authors. Licensee MDPI, Basel, Switzerland. This article is an open access article distributed under the terms and conditions of the Creative Commons Attribution (CC BY) license (https://creativecommons.org/licenses/by/4.0/).