
Prospective Prediction of Dapaconazole Clinical Drug–Drug Interactions Using an In Vitro to In Vivo Extrapolation Equation and PBPK Modeling

 ,
,  ,
,
Abstract
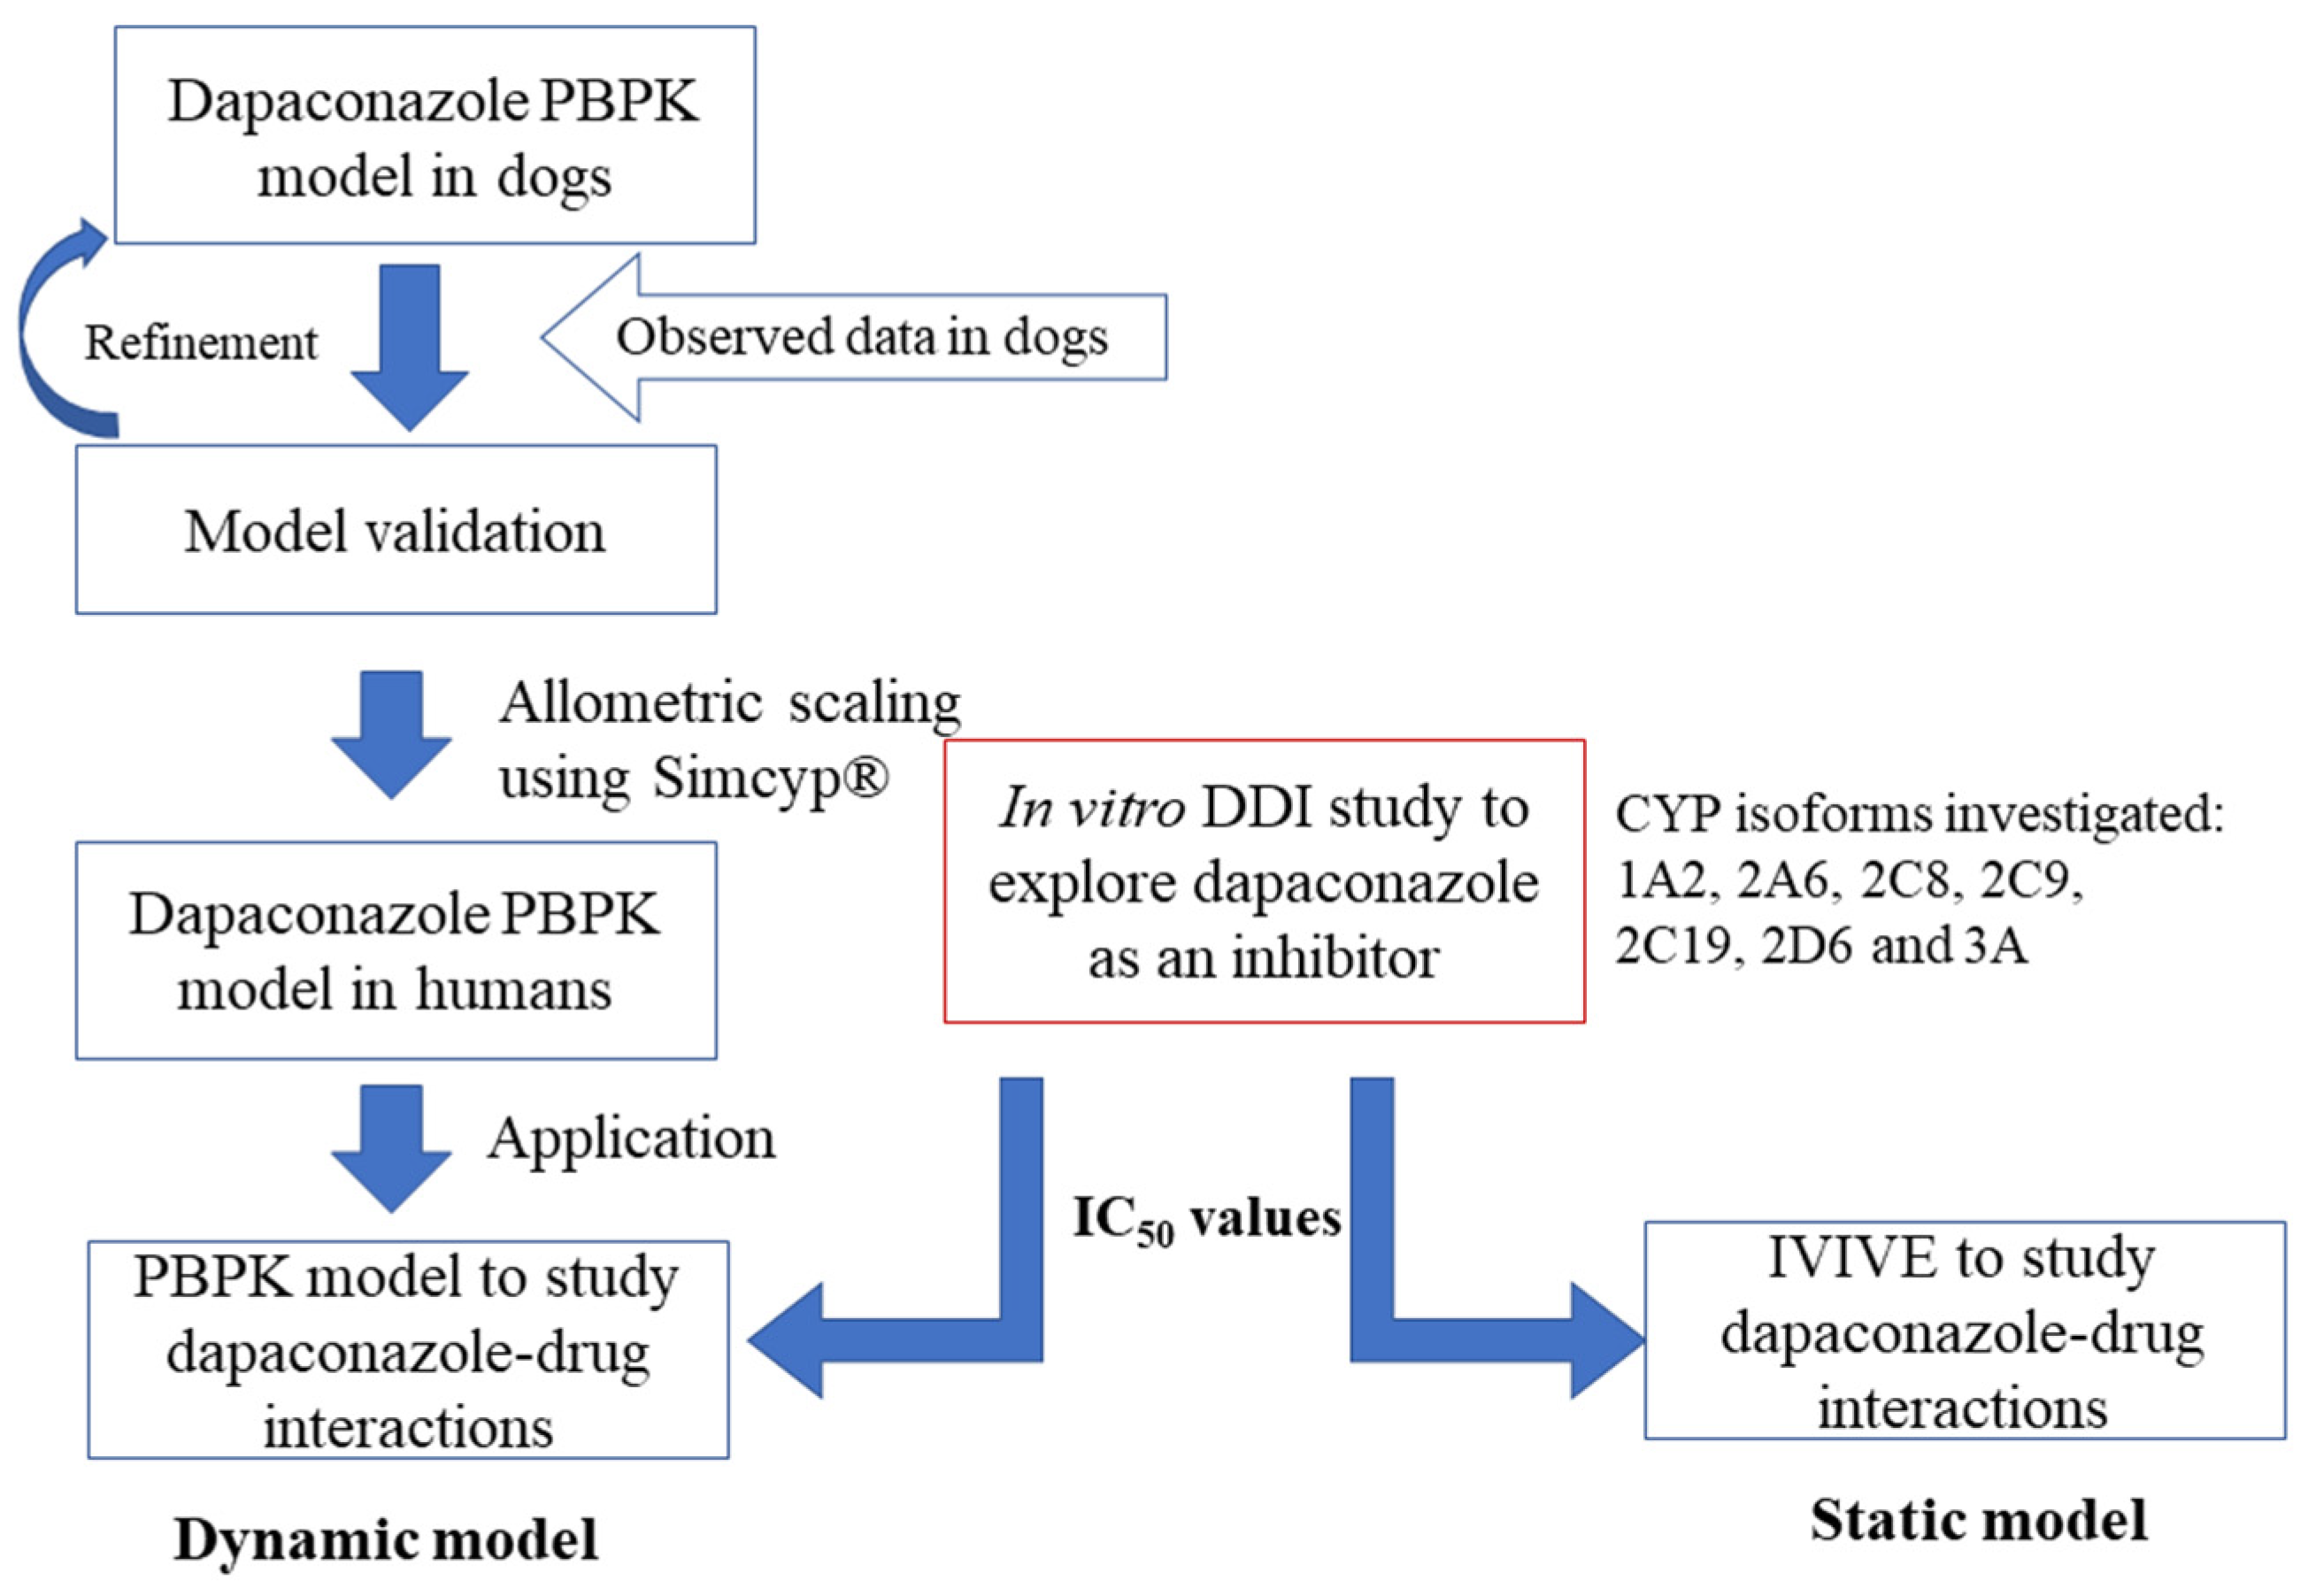
1. Introduction
2. Results
2.1. In Vitro DDI
2.2. Development of PBPK Model in Dogs
2.3. Extrapolation of the PBPK Model Developed in Dogs to Humans
2.4. DDI Prediction of Dapaconazole as an Inhibitor
3. Discussion
4. Materials and Methods
4.1. Chemicals and Reagents
4.2. In Vitro DDI
4.3. Analysis by LC-MS/MS
4.4. IC50 Determination
4.5. PBPK Model Strategy
4.6. Dynamic Model Analysis Using PBPK for DDI Prediction
4.7. Static Model Analysis Using IVIVE for DDI Prediction
4.8. Dapaconazole DDI Results Interpretation
5. Conclusions
Author Contributions
Funding
Institutional Review Board Statement
Informed Consent Statement
Data Availability Statement
Acknowledgments
Conflicts of Interest
References
- de Moraes, F.C.; Bittencourt, S.F.; Perissutti, E.; Frencentese, F.; Arruda, A.M.M.; Chen, L.S.; Babadópulos, T.; De Nucci, G. Quantification of Dapaconazole in Human Plasma Using High-Performance Liquid Chromatography Coupled to Tandem Mass Spectrometry: Application to a Phase I Study. J. Chromatogr. B Anal. Technol. Biomed. Life Sci. 2014, 958, 102–107. [Google Scholar] [CrossRef] [PubMed]
- Gagliano-Jucá, T.; Arruda, A.M.M.; Sampaio, M.F.; Lopes, A.G.; De Nucci, G. Phase I Study of the Novel Antifungal Agent Dapaconazole (Zilt®) in Healthy Volunters. Int. J. Pharmacol. 2014, 10, 507–512. [Google Scholar] [CrossRef]
- Gobbato, A.A.M.; Gobbato, C.A.R.S.; Moreno, R.A.; Antunes, N.d.J.; De Nucci, G. Dapaconazole versus Ketoconazole in the Treatment of Interdigital Tinea Pedis. Int. J. Clin. Pharmacol. Ther. 2017, 56, 31–33. [Google Scholar] [CrossRef] [PubMed]
- Gobbato, A.A.M.; Babadópulos, T.; Gobbato, C.A.R.S.; Ilha, J.O.; Antunes, N.J.; Moreno, R.A.; Campos, R.; De Nucci, G. Comparison of Dapaconazole with Miconazole in the Treatment of Tinea Cruris. J. Eur. Acad. Dermatol. Venereol. 2019, 33, 54–56. [Google Scholar] [CrossRef] [PubMed]
- Gobbato, A.A.M.; Babadópulos, T.; Gobbato, C.A.R.S.; Ilha, J.D.O.; Gagliano-Jucá, T.; De Nucci, G. A Randomized Double-Blind, Non-Inferiority Phase II Trial, Comparing Dapaconazole Tosylate 2% Cream with Ketoconazole 2% Cream in the Treatment of Pityriasis Versicolor. Expert Opin. Investig. Drugs 2015, 24, 1399–1407. [Google Scholar] [CrossRef] [PubMed]
- Keppler, A.F.; Sacurai, S.L.; Zaim, M.H.; Touzarim, C.E.C. Benzyl Aralkyl Ether Compounds, Method for Preparing Same, Intermediate Compounds, Use of Said Compounds, Method for Treatment and/or Prevention, Pharmaceutical Composition and Medicament Containing Same. U.S. Patent No. 8,975,289, 10 March 2015. [Google Scholar]
- Palo, J.S.; De Freitas, N.L.; Silva, S.G.N.; Rojas-moscoso, J.A.; Za, T.; Lescano, C.H.; Mendes, G.D.; De Nucci, G. Pharmacokinetics of Dapaconazole, A Novel Antifungal Agent, in Beagle Dogs and Inhibition of Cytochrome P450 Family 51. Anti-Infect. Agents 2018, 51, 15–21. [Google Scholar] [CrossRef]
- Gustafson, C.; Koslosky, M.; Leslie, J.; Walczak, C. Antifungal and Oral Anticancer Therapy Drug Interactions. Curr. Fungal Infect. Rep. 2020, 14, 130–140. [Google Scholar] [CrossRef]
- Niwa, T.; Imagawa, Y.; Yamazaki, H. Drug Interactions between Nine Antifungal Agents and Drugs Metabolized by Human Cytochromes P450. Curr. Drug Metab. 2014, 15, 651–679. [Google Scholar] [CrossRef]
- Yu, J.; Zhou, Z.; Owens, K.H.; Ritchie, T.K.; Ragueneau-Majlessi, I. What Can Be Learned from Recent New Drug Applications? A Systematic Review of Drug Interaction Data for Drugs Approved by the US FDA in 2015. Drug Metab. Dispos. 2017, 45, 86–108. [Google Scholar] [CrossRef]
- Caldwell, G.W.; Yan, Z. Optimization in Drug Discovery, 2nd ed.; Caldwell, G.W., Yan, Z., Eds.; Methods in Pharmacology and Toxicology; Humana Press: Totowa, NJ, USA, 2014; ISBN 9781627037419. [Google Scholar]
- Sudsakorn, S.; Bahadduri, P.; Fretland, J.; Lu, C. 2020 FDA Drug-Drug Interaction Guidance: A Comparison Analysis and Action Plan by Pharmaceutical Industrial Scientists. Curr. Drug Metab. 2020, 21, 403–426. [Google Scholar] [CrossRef]
- FDA, U.S. Guidance for Industry: In Vitro Drug Interaction Studies—Cytochrome P450 Enzyme and Transporter Mediated Drug Interactions. Available online: https://www.fda.gov/media/134582/download (accessed on 24 November 2021).
- Antunes, N.J.; Coombes, G.; Cunha, K.F.; Moreira, F.L.; Pilon, A.; Lopes, N.P.; Costa, J.L.; Kipper, K.; Couchman, L.; Johnston, A.; et al. In Vitro Metabolism of the New Antifungal Dapaconazole using liver microsomes. Drug Metab. Pharmacokinet. 2022, 47, 100475. [Google Scholar] [CrossRef] [PubMed]
- Rodgers, T.; Rowland, M. Physiologically Based Pharmacokinetic Modelling 2: Predicting the Tissue Distribution of Acids, Very Weak Bases, Neutrals and Zwitterions. J. Pharm. Sci. 2006, 95, 1238–1257. [Google Scholar] [CrossRef] [PubMed]
- Zou, P.; Zheng, N.; Yang, Y.; Yu, L.X.; Sun, D. Prediction of Volume of Distribution at Steady State in Humans: Comparison of Different Approaches. Expert Opin. Drug Metab. Toxicol. 2012, 8, 855–872. [Google Scholar] [CrossRef]
- Cho, H.Y.; Choi, G.W.; Lee, Y.B. Interpretation of Non-Clinical Data for Prediction of Human Pharmacokinetic Parameters: In Vitro-in Vivo Extrapolation and Allometric Scaling. Pharmaceutics 2019, 11, 168. [Google Scholar] [CrossRef]
- Peters, S.A.; Schroeder, P.E.; Giri, N.; Dolgos, H. Evaluation of the Use of Static and Dynamic Models to Predict Drug-Drug Interaction and Its Associated Variability: Impact on Drug Discovery and Early Development. Drug Metab. Dispos. 2012, 40, 1495–1507. [Google Scholar] [CrossRef] [PubMed]
- Hua, L.; Chiang, C.W.; Cong, W.; Li, J.; Wang, X.; Cheng, L.; Feng, W.; Quinney, S.K.; Wang, L.; Li, L. The Cancer Drug Fraction of Metabolism Database. CPT Pharmacomet. Syst. Pharmacol. 2019, 8, 511–519. [Google Scholar] [CrossRef] [PubMed]
- Siu, Y.A.; Lai, W.G. Impact of Probe Substrate Selection on Cytochrome P450 Reaction Phenotyping Using the Relative Activity Factor. Drug Metab. Dispos. 2017, 45, 183–189. [Google Scholar] [CrossRef]
- Lempers, V.J.C.; Martial, L.C.; Schreuder, M.F.; Blijlevens, N.M.; Burger, D.M.; Aarnoutse, R.E.; Brüggemann, R.J.M. Drug-Interactions of Azole Antifungals with Selected Immunosuppressants in Transplant Patients: Strategies for Optimal Management in Clinical Practice. Curr. Opin. Pharmacol. 2015, 24, 38–44. [Google Scholar] [CrossRef]
- Subramanian, M.; Tracy, T.S. Methods for Determination of Enzyme Kinetics and Metabolic Rates. In Encyclopedia of Drug Metabolism and Interactions; John Wiley & Sons, Inc.: Hoboken, NJ, USA, 2012; Volume 17, pp. 99–102. [Google Scholar]
- Wang, H.; Huang, H.; Li, H.; Teotico, D.G.; Sinz, M.; Baker, S.D.; Staudinger, J.; Kalpana, G.; Redinbo, M.R.; Mani, S. Cancer Therapy: Preclinical Activated Pregnenolone X-Receptor Is a T Arget for Ketoconazole and Its Analogs. Clin. Cancer Res. 2007, 13, 2488–2496. [Google Scholar] [CrossRef]
- Sakaeda, T.; Iwaki, K.; Kakumoto, M.; Nishikawa, M.; Niwa, T.; Jin, J.; Nakamura, T.; Nishiguchi, K.; Okamura, N.; Okumura, K. Effect of Micafungin on Cytochrome P450 3A4 and Multidrug Resistance Protein 1 Activities, and Its Comparison with Azole Antifungal Drugs. J. Pharm. Pharmacol. 2005, 57, 759–764. [Google Scholar] [CrossRef]
- Monostory, K.; Hazai, E.; Vereczkey, L. Inhibition of Cytochrome P450 Enzymes Participating in p -Nitrophenol Hydroxylation by Drugs Known as CYP2E1 Inhibitors. Chem. Interact. 2004, 147, 331–340. [Google Scholar] [CrossRef] [PubMed]
- Lamb, D.C.; Kelly, D.E.; Baldwin, B.C.; Kelly, S.L. Differential Inhibition of Human CYP3A4 and Candida Albicans CYP51 with Azole Antifungal Agents. Chem. Interact. 2000, 125, 165–175. [Google Scholar] [CrossRef] [PubMed]
- Youdim, K.A.; Lyons, R.; Payne, L.; Jones, B.C.; Saunders, K. Journal of Pharmaceutical and Biomedical Analysis An Automated, High-Throughput, 384 Well Cytochrome P450 Cocktail IC 50 Assay Using a Rapid Resolution LC—MS/MS End-Point. J. Pharm. Biomed. Anal. 2008, 48, 92–99. [Google Scholar] [CrossRef] [PubMed]
- Baldwin, S.J.; Clarke, S.E.; Chenery, R.J. Characterization of the Cytochrome P450 Enzymes Involved in the in Vitro Metabolism of Rosiglitazone. Br. J. Clin. Pharmacol. 1999, 48, 424–432. [Google Scholar] [CrossRef] [PubMed]
- Carrão, D.B.; Habenchus, M.D.; de Albuquerque, N.C.P.; da Silva, R.M.; Lopes, N.P.; de Oliveira, A.R.M. In Vitro Inhibition of Human CYP2D6 by the Chiral Pesticide Fipronil and Its Metabolite Fipronil Sulfone: Prediction of Pesticide-Drug Interactions. Toxicol. Lett. 2019, 313, 196–204. [Google Scholar] [CrossRef]
- Habenschus, M.D. Estudos de Inibição Das Enzimas Do Citocromo P450 Pelo Produto Natural (–)-Grandisina Utilizando Microssomas Hepáticos de. Humanos. Thesis, University of Sao Paulo, Ribeirao Preto, Brazil, 2016. Volume 127. Available online: https://www.teses.usp.br/teses/disponiveis/59/59138/tde-06072016-095943/publico/Dissertacao_Maisa_versao_resumida_corrigida.pdf (accessed on 17 September 2021).
- Walsky, R.L.; Obach, R.S. Validated Assays for Human Cytochrome P450 Activities. Drug Metab. Dispos. 2004, 32, 647–660. [Google Scholar] [CrossRef]
- Walsky, R.L.; Obach, R.S.; Gaman, E.A.; Gleeson, J.P.R.; Proctor, W.R. Selective Inhibition of Humam Cytochrome P4502C8 by Montelukast. Drug Metab. Dispos. 2005, 33, 413–418. [Google Scholar] [CrossRef]
- Walsky, R.L.; Gaman, E.A.; Obach, R.S. Examination of 209 Drugs for Inhibition of Cytochrome P450 2C8. J. Clin. Pharmacol. 2005, 45, 68–78. [Google Scholar] [CrossRef]
- Walsky, R.L.; Obach, R.S. A Comparison of 2-Phenyl-2-(1-Piperidinyl)Propane (PPP), 1,1′,1″-Phosphinothioylidynetrisaziridine (ThioTEPA), Clopidogrel, and Ticlopidine as Selective Inactivators of Human Cytochrome P450 2B6. Drug Metab. Dispos. 2007, 35, 2053–2059. [Google Scholar] [CrossRef]
- Dierks, E.A.; Stams, K.R.; Lim, H.K.; Cornelius, G.; Zhang, H.; Ball, S.E. A Method for the Simultaneous Evaluation of the Activities of Seven Major Human Drug-Metabolizing Cytochrome P450s Using an in Vitro Cocktail of Probe Substrates and Fast Gradient Liquid Chromatography Tandem Mass Spectrometry. Drug Metab. Dispos. 2001, 29, 23–29. [Google Scholar]
- Rowland Yeo, K.; Jamei, M.; Yang, J.; Tucker, G.T.; Rostami-Hodjegan, A. Physiologically Based Mechanistic Modelling to Predict Complex Drug-Drug Interactions Involving Simultaneous Competitive and Time-Dependent Enzyme Inhibition by Parent Compound and Its Metabolite in Both Liver and Gut-The Effect of Diltiazem on the Time-C. Eur. J. Pharm. Sci. 2010, 39, 298–309. [Google Scholar] [CrossRef] [PubMed]
- Rodrigues, A.D. Drug-Drug Interactions (Drugs and the Pharmaceutical Sciences), 2nd ed.; Rodrigues, A.D., Ed.; CRC Press Informa Healthcare: London, UK, 2007; Volume 179, ISBN 10: 0-8493-7593-2. [Google Scholar]
- FDA, U.S. Guidance for Industry: Clinical Drug Interaction Studies—Cytochrome P450 Enzyme- and Transporter-Mediated Drug Interactions. Available online: https://www.fda.gov/Drugs/GuidanceComplianceRegulatoryInformation/Guidances/default.htm%0Ahttps://www.fda.gov/media/134581/download (accessed on 24 November 2021).


| CYP450 Isoform | Substrate | Substrate Concentration (µM) | Marker | Inhibitor | Inhibitor Concentration (µM) | Microsome Concentration (mg/mL) | Incubation Time (min) | Internal Standard (Solvent) |
|---|---|---|---|---|---|---|---|---|
| 1A2 | Phenacetin | 12.03 | Acetominofen | Furafylline | 0.1–2.3 | 0.3 | 30 | Sulindac (MTBE) |
| 2A6 | Coumarin | 2.3 | 7-Hydroxycoumarin | Tranylcypromine | 0.1–2.0 | 0.3 | 30 | Dextrorphan (EA) |
| 2B6 | Bupropion | 81.7 | Hydroxybupropion | Clopidogrel | 0.01–0.05 | 0.1 | 10 | Sulindac (ACN) |
| 2C8 | Paclitaxel | 10.0 | 6α-Hydroxypaclitaxel | Quercetin | 1–5 | 0.4 | 20 | Dexthorphan (EA) |
| 2C9 | Diclofenac | 4.04 | 4′-Hydroxydiclofenac | Sulfaphenazole | 0.1–2.0 | 0.1 | 10 | Sulindac (CF 1) |
| 2C19 | S-mephenytoin | 57.2 | 4′-Hydroxymephenytoin | Tranylcypromine | 5–45 | 0.2 | 40 | Dextrorphan (EA) |
| 2D6 | Bufuralol | 5.4 | 1′-Hydroxybufuralol | Quinidine | 0.001–0.3 | 0.25 | 30 | Dextrorphan (EA 2) |
| 3A | Midazolam | 2.27 | 1-Hydroxymidazolam | Ketoconazole | 0.01–0.05 | 0.1 | 5 | Diazepam (EA) |
| 3A | Nifedipine | 7.0 | Dehydronifedipine | Ketoconazole | 0.01–0.05 | 0.15 | 15 | Diazepam (EA) |
| CYP Isoform | Marker | MRM Transitions | CE (Volts) | CXP (Volts) |
|---|---|---|---|---|
| 1A2 | Acetominofen | 152.11 > 109.90 152.11 > 65.20 | 23 43 | 08 04 |
| 2A6 | 7-Hydroxycoumarin | 162.99 > 107.00 162.99 > 77.10 | 31 47 | 08 06 |
| 2B6 | Hydroxybupropion | 256.22 > 238.00 256.22 > 238.00 | 17 35 | 14 12 |
| 2C8 | 6α-Hydroxypaclitaxel | 870.42 > 139.00 870.42 > 104.90 | 21 77 | 08 10 |
| 2C9 | 4′-Hydroxydiclofenac | 312.02 > 231.10 312.02 > 231.10 | 27 43 | 14 20 |
| 2C19 | 4′-Hydroxymephenytoin | 235.11 > 150.10 235.11 > 141.00 | 25 15 | 12 10 |
| 2D6 | 1′-Hydroxybufuralol | 278.25 > 186.00 278.25 > 159.00 | 25 33 | 26 12 |
| 3A 1 | 1-Hydroxymidazolam | 342.06 > 234.00 342.06 > 108.90 | 31 45 | 14 08 |
| 3A 2 | Dehydronifedipine | 345.00 > 283.90 345.00 > 267.80 | 35 26 | 10 08 |
| IS | Diazepam | 285.12 > 154.10 285.12 > 193.00 | 37 43 | 10 16 |
| IS | Sulindac | 357.14 > 233.10 357.14 > 233.10 | 59 47 | 16 14 |
| IS | Dextrorphan | 258.30 > 157.10 258.30 > 199.10 | 49 37 | 10 18 |
| CYP Isoform | IC50 (µM) Dapaconazole | IC50 (µM) Positive Control |
|---|---|---|
| 1A2 | 3.682 (0.1295) | 0.5847 (0.08698)—Furafylline |
| 2A6 | 20.7 (0.0561) | 0.7994 (0.08698)—Tranylcypromine |
| 2C8 | 104.1 (0.4935) | 0.6221 (0.5273)—Quercetin |
| 2C9 | 0.2186 (0.1047) | 0.4467 (0.3811)—Sulfaphenazole |
| 2C19 | 0.05297 (0.01904) | 0.4467 (0.3811)—Tranylcypromine |
| 2D6 | 0.8675 (0.2102) | 0.03712 (0.07987)—Quinidine |
| 3A 1 | 0.007693 (0.001267) | 0.003445 (1.161)—Ketoconazole |
| 3A 2 | 0.03032 (0.05029) | 0.003667 (0.3481)—Ketoconazole |
| Dog Model | Human Model | |||
|---|---|---|---|---|
| Parameters | Value | Reference | Value | Reference |
| Physical chemistry | ||||
| Molecular weight (g/mol) | 415.2 | Drugbank | 415.2 | Drugbank |
| log P | 5.63 | Drugbank | 5.63 | Drugbank |
| pKa (monoprotic base) | 6.77 | Drugbank | 6.77 | Drugbank |
| Unbound fraction | 0.037 | Antunes et al. [14] | 0.077 | Antunes et al. [14] |
| Blood/Plasma | 1 * | Assumed | 6.08 | Simcyp predicted |
| Distribution | Minimal + SAC model | Minimal+ SAC model | ||
| Vss (L/kg) | 6.359 | Predicted Method 2 | 6.35 | Simcyp Allometry (simple allometry) |
| Vsac (L/kg) | 3.883 | Best fit | 3.883 | Allometry |
| Kin/Kout (1/h) | 0.0262/0.01582 | Best fit | 0.0262/0.01582 | Allometry |
| Kp | 0.01 | Best fit | 0.01 | Allometry |
| Elimination | ||||
| CL IV (L/h) | According to IV dose simulated | Palo et al. [7] | 35.5 | Simcyp Allometry (simple allometry) |
| CL int. mic. µL/min/mg | 258 | Antunes et al. [14] | 118.5 | Antunes et al. [14] |
| fu,inc | 0.97 | Antunes et al. [14] | 0.94 | Antunes et al. [14] |
| Intravenous Dose | 1 mg/kg | |||
|---|---|---|---|---|
| Parameters | AUC0-t (ng/mL.h) | Cmax (ng/mL) | CL (mL/min) | t1/2 Terminal (h) |
| Predicted | 306.7 | 404.7 | 543.5 | 1.9 |
| Observed 1 | 255.0 | 373.2 | 700.0 | 2.1 |
| Observed/predicted ratio | 0.83 | 0.92 | 1.29 | 1.08 |
| 2 mg/kg | ||||
| Predicted | 613.3 | 809.3 | 543.5 | 1.9 |
| Observed 1 | 779.9 | 1444.7 | 591.7 | 2.5 |
| Observed/predicted ratio | 1.27 | 1.78 | 1.09 | 1.29 |
| 20 mg/kg | ||||
| Predicted | 7331.2 | 8097.3 | 454.7 | 2.2 |
| Observed 1 | 4780.1 | 4708.3 | 700.0 | 2.3 |
| Observed/predicted ratio | 0.65 | 0.58 | 1.54 | 1.04 |
| CYP. | Substrate | [I](µM) | Ki (µM) | R1 | fm | Static AUCR | Dynamic AUCR | FDA Classification [13] |
|---|---|---|---|---|---|---|---|---|
| 1A2 | Phenacetin | 9.5 | 1.84 | 1.20 | 0.71 | 1.86 | 1.17 | Weak |
| 2C8 | Paclitaxel | 9.5 | 52.05 | 1.01 | 0.5 | 3.00 | 1.46 1 | Moderate |
| 2C9 | Diclofenac | 9.5 | 0.11 | 4.43 | 0.87 | 1.95 | 1.38 2 | Weak |
| 2C19 | S-Mephenytoin | 9.5 | 0.03 | 15.14 | 0.89 | 3.86 | 5.36 | Strong |
| 2D6 | Bufuralol | 9.5 | 0.43 | 1.86 | 0.66 | 2.31 | 1.51 | Moderate |
| 3A4 | Midazolam | 9.5 | 0.004 | 98.26 | 0.88 | 19.45 | 5.14 | Strong |
| 3A4 | Nifedipine | 9.5 | 0.02 | 25.70 | 0.96 | 5.31 | 4.05 | Strong |
Disclaimer/Publisher’s Note: The statements, opinions and data contained in all publications are solely those of the individual author(s) and contributor(s) and not of MDPI and/or the editor(s). MDPI and/or the editor(s) disclaim responsibility for any injury to people or property resulting from any ideas, methods, instructions or products referred to in the content. |
© 2022 by the authors. Licensee MDPI, Basel, Switzerland. This article is an open access article distributed under the terms and conditions of the Creative Commons Attribution (CC BY) license (https://creativecommons.org/licenses/by/4.0/).
Share and Cite
Antunes, N.d.J.; Moreira, F.d.L.; Kipper, K.; Couchman, L.; Lebre, D.T.; Johnston, A.; De Nucci, G. Prospective Prediction of Dapaconazole Clinical Drug–Drug Interactions Using an In Vitro to In Vivo Extrapolation Equation and PBPK Modeling. Pharmaceuticals 2023, 16, 28. https://doi.org/10.3390/ph16010028
Antunes NdJ, Moreira FdL, Kipper K, Couchman L, Lebre DT, Johnston A, De Nucci G. Prospective Prediction of Dapaconazole Clinical Drug–Drug Interactions Using an In Vitro to In Vivo Extrapolation Equation and PBPK Modeling. Pharmaceuticals. 2023; 16(1):28. https://doi.org/10.3390/ph16010028
Chicago/Turabian StyleAntunes, Natalícia de Jesus, Fernanda de Lima Moreira, Karin Kipper, Lewis Couchman, Daniel Temponi Lebre, Atholl Johnston, and Gilberto De Nucci. 2023. "Prospective Prediction of Dapaconazole Clinical Drug–Drug Interactions Using an In Vitro to In Vivo Extrapolation Equation and PBPK Modeling" Pharmaceuticals 16, no. 1: 28. https://doi.org/10.3390/ph16010028
APA StyleAntunes, N. d. J., Moreira, F. d. L., Kipper, K., Couchman, L., Lebre, D. T., Johnston, A., & De Nucci, G. (2023). Prospective Prediction of Dapaconazole Clinical Drug–Drug Interactions Using an In Vitro to In Vivo Extrapolation Equation and PBPK Modeling. Pharmaceuticals, 16(1), 28. https://doi.org/10.3390/ph16010028