3.2. Selection of Anti-Adhesive Additives and Optimization of IH-UF
A decrease in mechanical shape resulting from the force exerted is a significant obstacle for unfolding the films. Polymer substances having glass transition temperatures near room temperature with the flexibility to retain their actual structure are helpful in this type of preparation. They go through slight distortion and regain their elasticity as needed [
18,
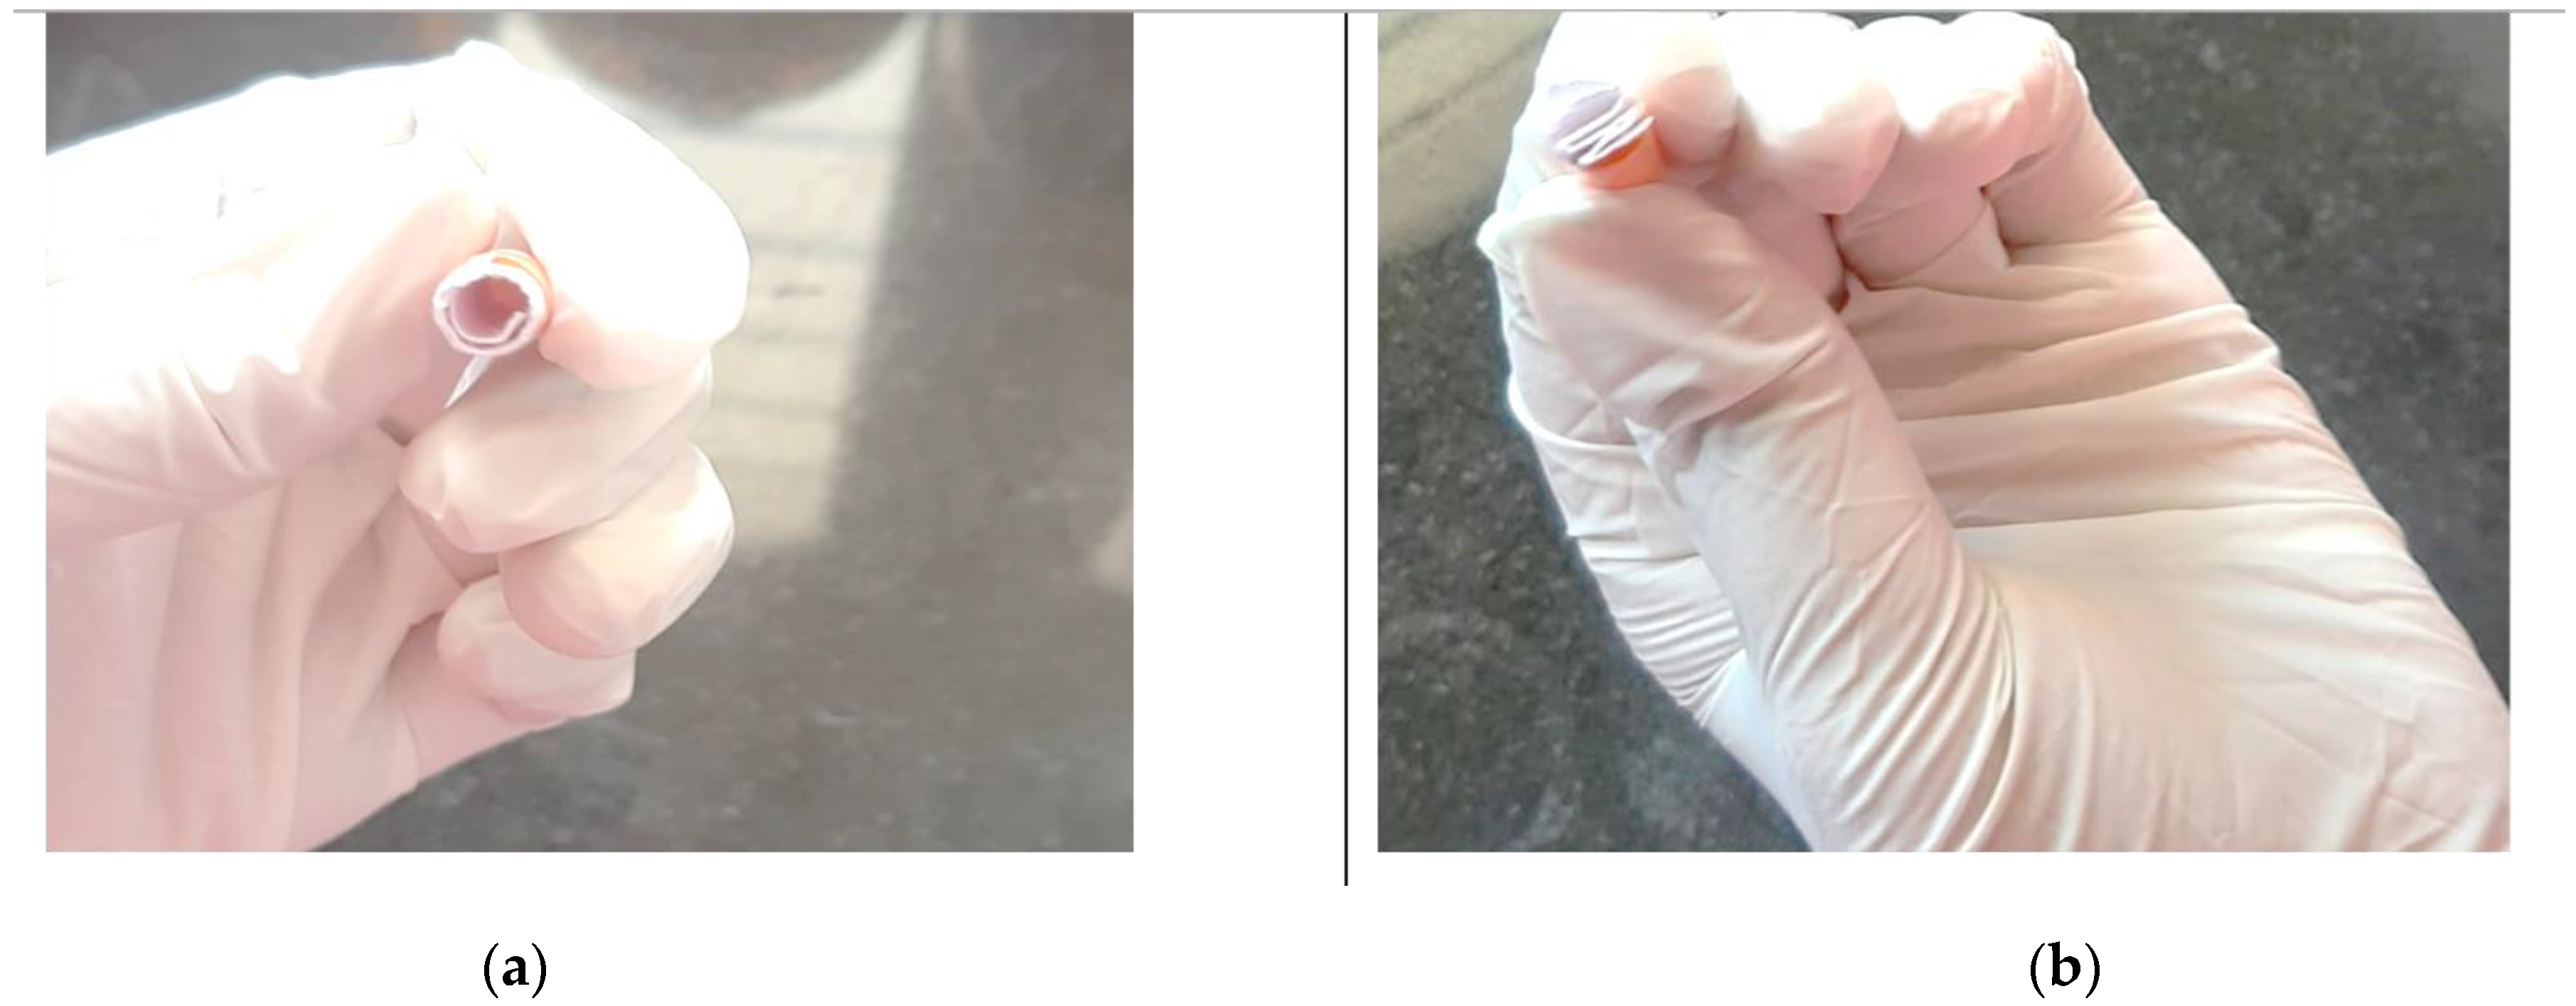
19]. The unfolding nature of the film’s roll and the accordion pattern (
Figure 2) was not acceptable as they were noted to be sticky with each other. After coating it with anti-adhesive materials, accordion folding unfolds avidly compared to roll folding. The unfolding nature of the film was tested using different anti-adhesive materials, and the results are presented in
Table 2.
The anti-adhesives are used to avoid the stickiness of the prepared layers’ excipients and aid unfolding. Citric acid and sodium bicarbonate were made into fine powders and dispersed on the formerly developed layers, considering the anti-adhesives employed for the unfolding test. The test was completed in a USP II apparatus with HCl (pH 1.2) medium. The sample layers were taken out after 10 and 15 min, and length was measured. Microcrystalline cellulose, magnesium stearate, and talc did not provide any unfolding nature to the film. A good unfolding test is attained when the test layers unfold to a minimum of 18 mm within 15 min.
As required, citric acid and sodium bicarbonate were studied on three other samples that rendered good results with lengths greater than 18 mm. This combination liberates carbon dioxide that drives the folded layers to get away from each other. Hence, this combination is regarded as the best anti-adhesive excipient and is considered one of the variables to optimize the formulation. The desired ratio between sodium bicarbonate and citric acid needs to have superior unfolding nature. Increased citric acid ratio results in aggregates when blending with sodium bicarbonate, ultimately reducing the stickiness of the resultant powder towards the developed layers.
The Box-Behnken design of RSM was used to estimate the standard level of the chosen factors and their interactivity in obtaining the preferable folding endurance and LTL. Overall, 17 experimental runs were completed, and the obtained responses are shown in
Table 3. The folding endurance of all study preparations was between 69 and 114, while the length (LTL) was in the range of 9 to 25 mm. All the developed patches had a folding endurance greater than 69, denoting good integrity and flexibility. It was noted that PEG 400 is crucial for this delivery system, without which the dosage form becomes fragile. The obtained results were scrutinized for individual responses and the effect of parameters through statistical analysis by using fx and ANOVA. A quadratic model was adopted for both responses based on the sum of squares, model summary, and fit summary (
Table 4 and
Table 5). A high-degree quadratic polynomial was selected, where the auxiliary terms can be noted, and the model is not aliased.
For both responses, the Predicted R
2 values of 0.8997 and 0.8762 were in rapport with the Adjusted R
2 of 0.9821 and 0.9756 correspondingly, as the disparity is below 0.2. Apart from this fit, summary data were used to confirm the fitness and effectiveness of the selected model. The reproducibility of the model can be ensured with the value of the coefficient of variation. The CV value of below 10% confirms the model repeatability. Comparatively fewer CV values (1.87 folding endurance and 4.37 LTL) were observed during the test, indicating the accuracy and reliability of the selected model. Adequate precision quantifies the quotient of signal to noise. Usually, a fraction > 4 is considerable. Folding endurance and LTL showed this ratio of 34.9242 and 28.5860, indicating a suitable signal. Hence, ensuring the model efficiency in operating the design space. Lack of fit can give an ineffective model that interprets actual data. Thus, lack of fit is essential to confirm that the equations generated by the model are reasonable in predicting the responses. The responses’
p-values corresponding to lack of fit were not significant, so the selected model was suitable for the study [
39]. The F-values of both responses were 98.74 and 72.17, interpreting the model applicability. There was only a 0.01% likelihood that a high F-value was due to noise, and the
p-value of the model was found to be significant (<0.0001).
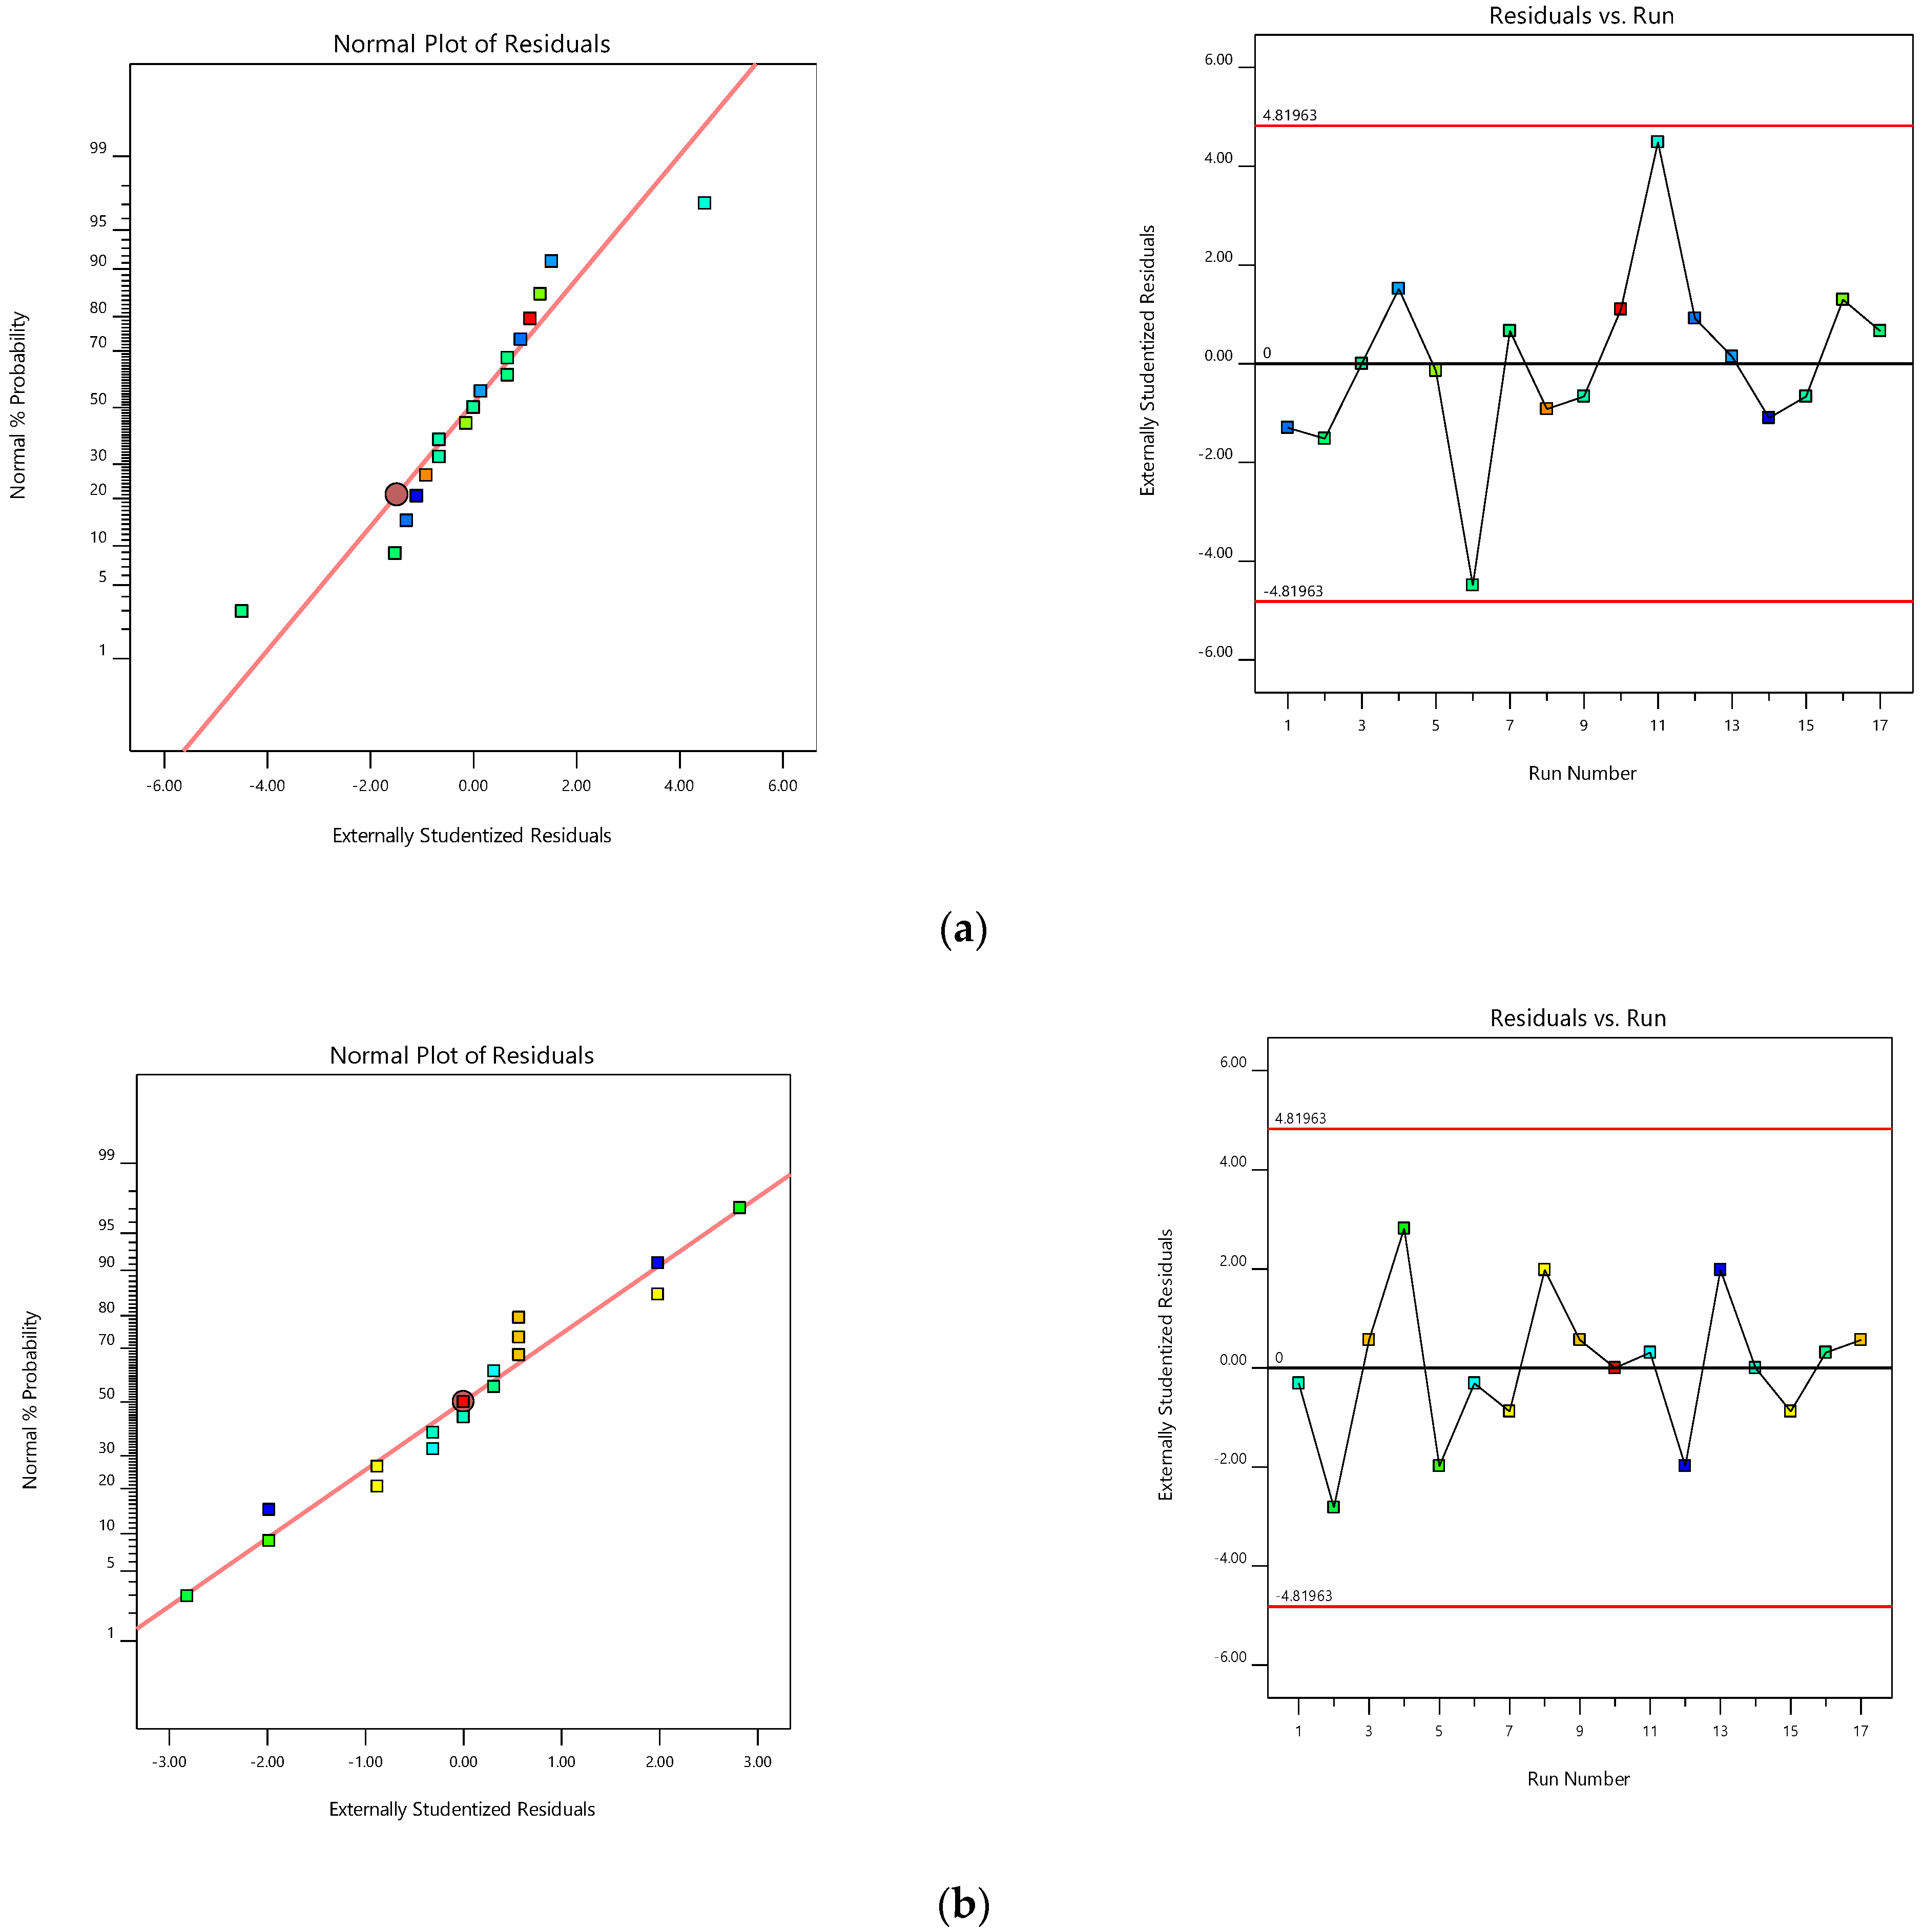
A huge interrelationship was observed between the experimental and predicted values while indicating the chosen responses. The probability distribution reveals that residuals are below the normal distribution (straight linearity). The standard statistical tools are not used, while inspection of the visible plot is suitable. Furthermore, a usual residual graph (external studentized residuals vs. usual probability percent) was plotted to quantify and assure model accuracy [
40] (
Figure 3a). Furthermore, the influence of test orders on the model was demonstrated by the residuals against test order [
41]. In the current study, a slight deviation was noted in the linear distribution of the external studentized residuals inferring that the chosen model was statistically acceptable [
42].
Figure 3b represents the experimental run operated against the residuals, which is a working process to identify the slinking variables that can modify the test results. A random distribution fashion was observed in the chart, indicating the lurking of time-dependent parameters in the framework.
The root effect interconnection of the chosen variables and the individual responses can be exemplified by the suggested quadratic polynomials and the respective statistical significance estimated by using ANOVA. ANOVA was carried out to test the interference of measurable effects of the factors. Polynomial equations were obtained by applying multiple regression to the data. The equations generated from the output of the possible standard model are described below:
Final equation in terms of coded factors:
For both responses, ANOVA coefficients, together with
p-values, are presented in
Table 6. The results attained were used to determine the significance of model coefficients. ANOVA results outranged the significance level produced by the quadratic polynomials. Further, the
p-value was <0.0500, indicating the significance of model terms. The test method specified that folding endurance was significantly affected by synergic effects of A, B, C, AB, BC, and polynomial terms of B with a
p-value of <0.0001, <0.0001, 0.0004, 0.0004, 0.0113, and 0.0306 likewise. Response 2 was affected by, (i) adversary consequences of the polynomial term of A, B, and C with
p-values 0.0002, 0.0241, and <0.0001 and (ii) synergistic output of A, B, C, AB (
p-value < 0.0001) and AB (
p-value of 0.0052), and among the critical parameters, term B affected both responses with great enormity, followed by factor A.
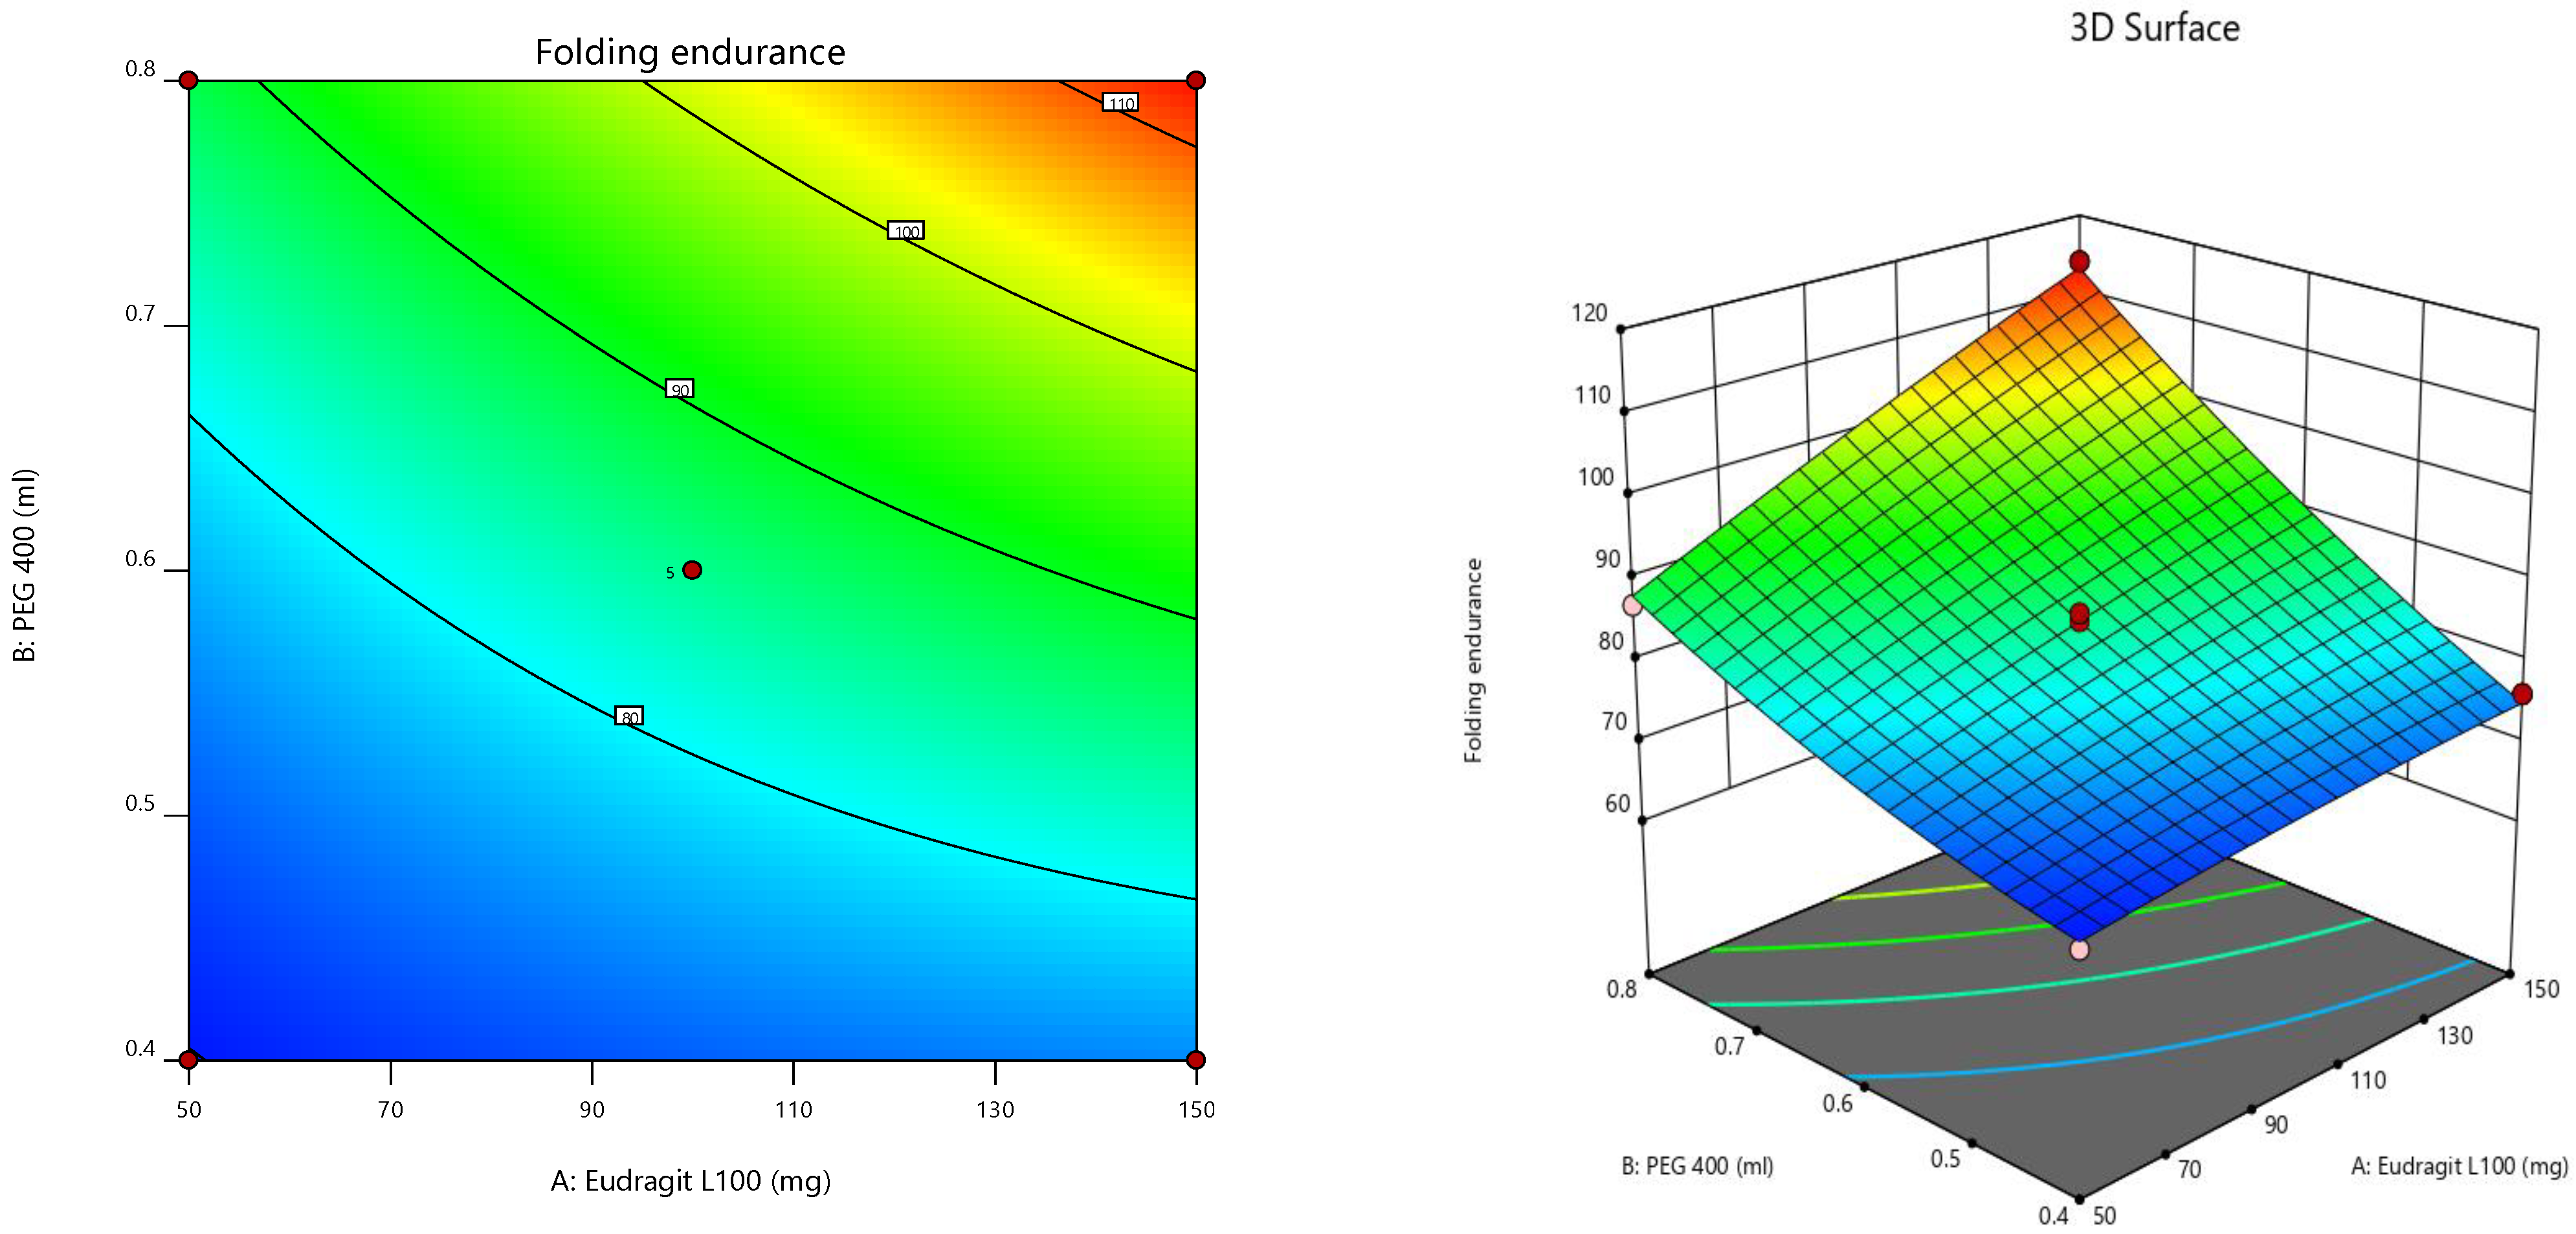
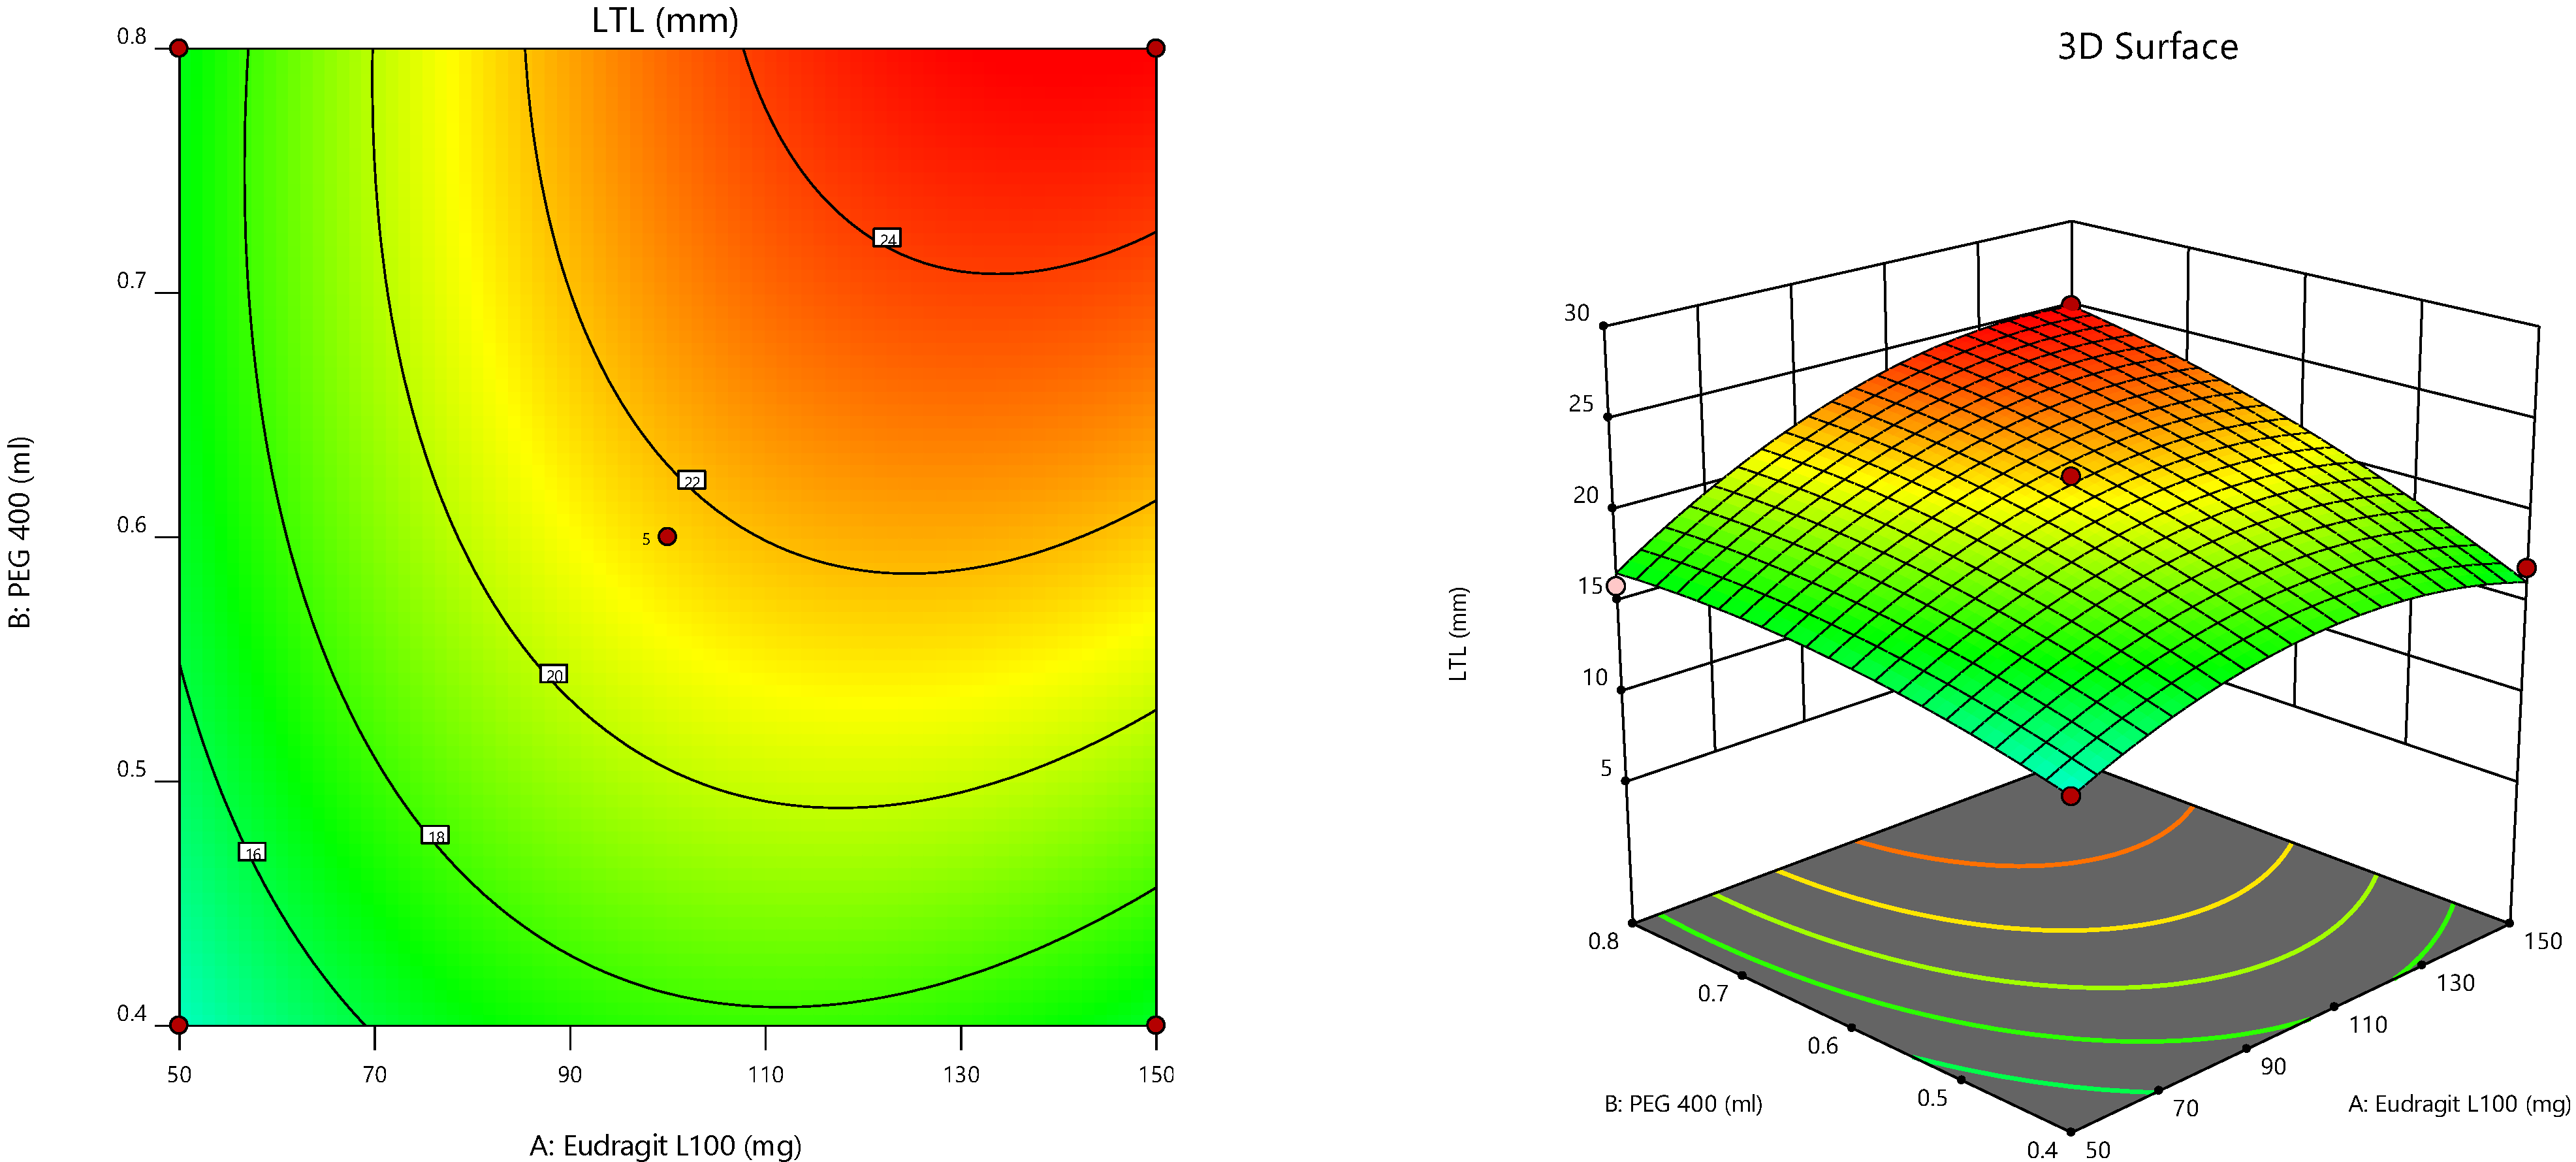
Furthermore, the consequences of independent parameters on responses were analyzed using RSM (
Figure 4) [
43,
44,
45]. The contour plot representing the relation of selected responses with the variables gives the variance effects. RSM was used to determine and elucidate the response of individual parameters over the different responses attained [
46,
47]. Three-dimensional surface graphs are essential to demonstrate the interactions and main effects. The responses attained are interpreted using contour/level plots [
48].
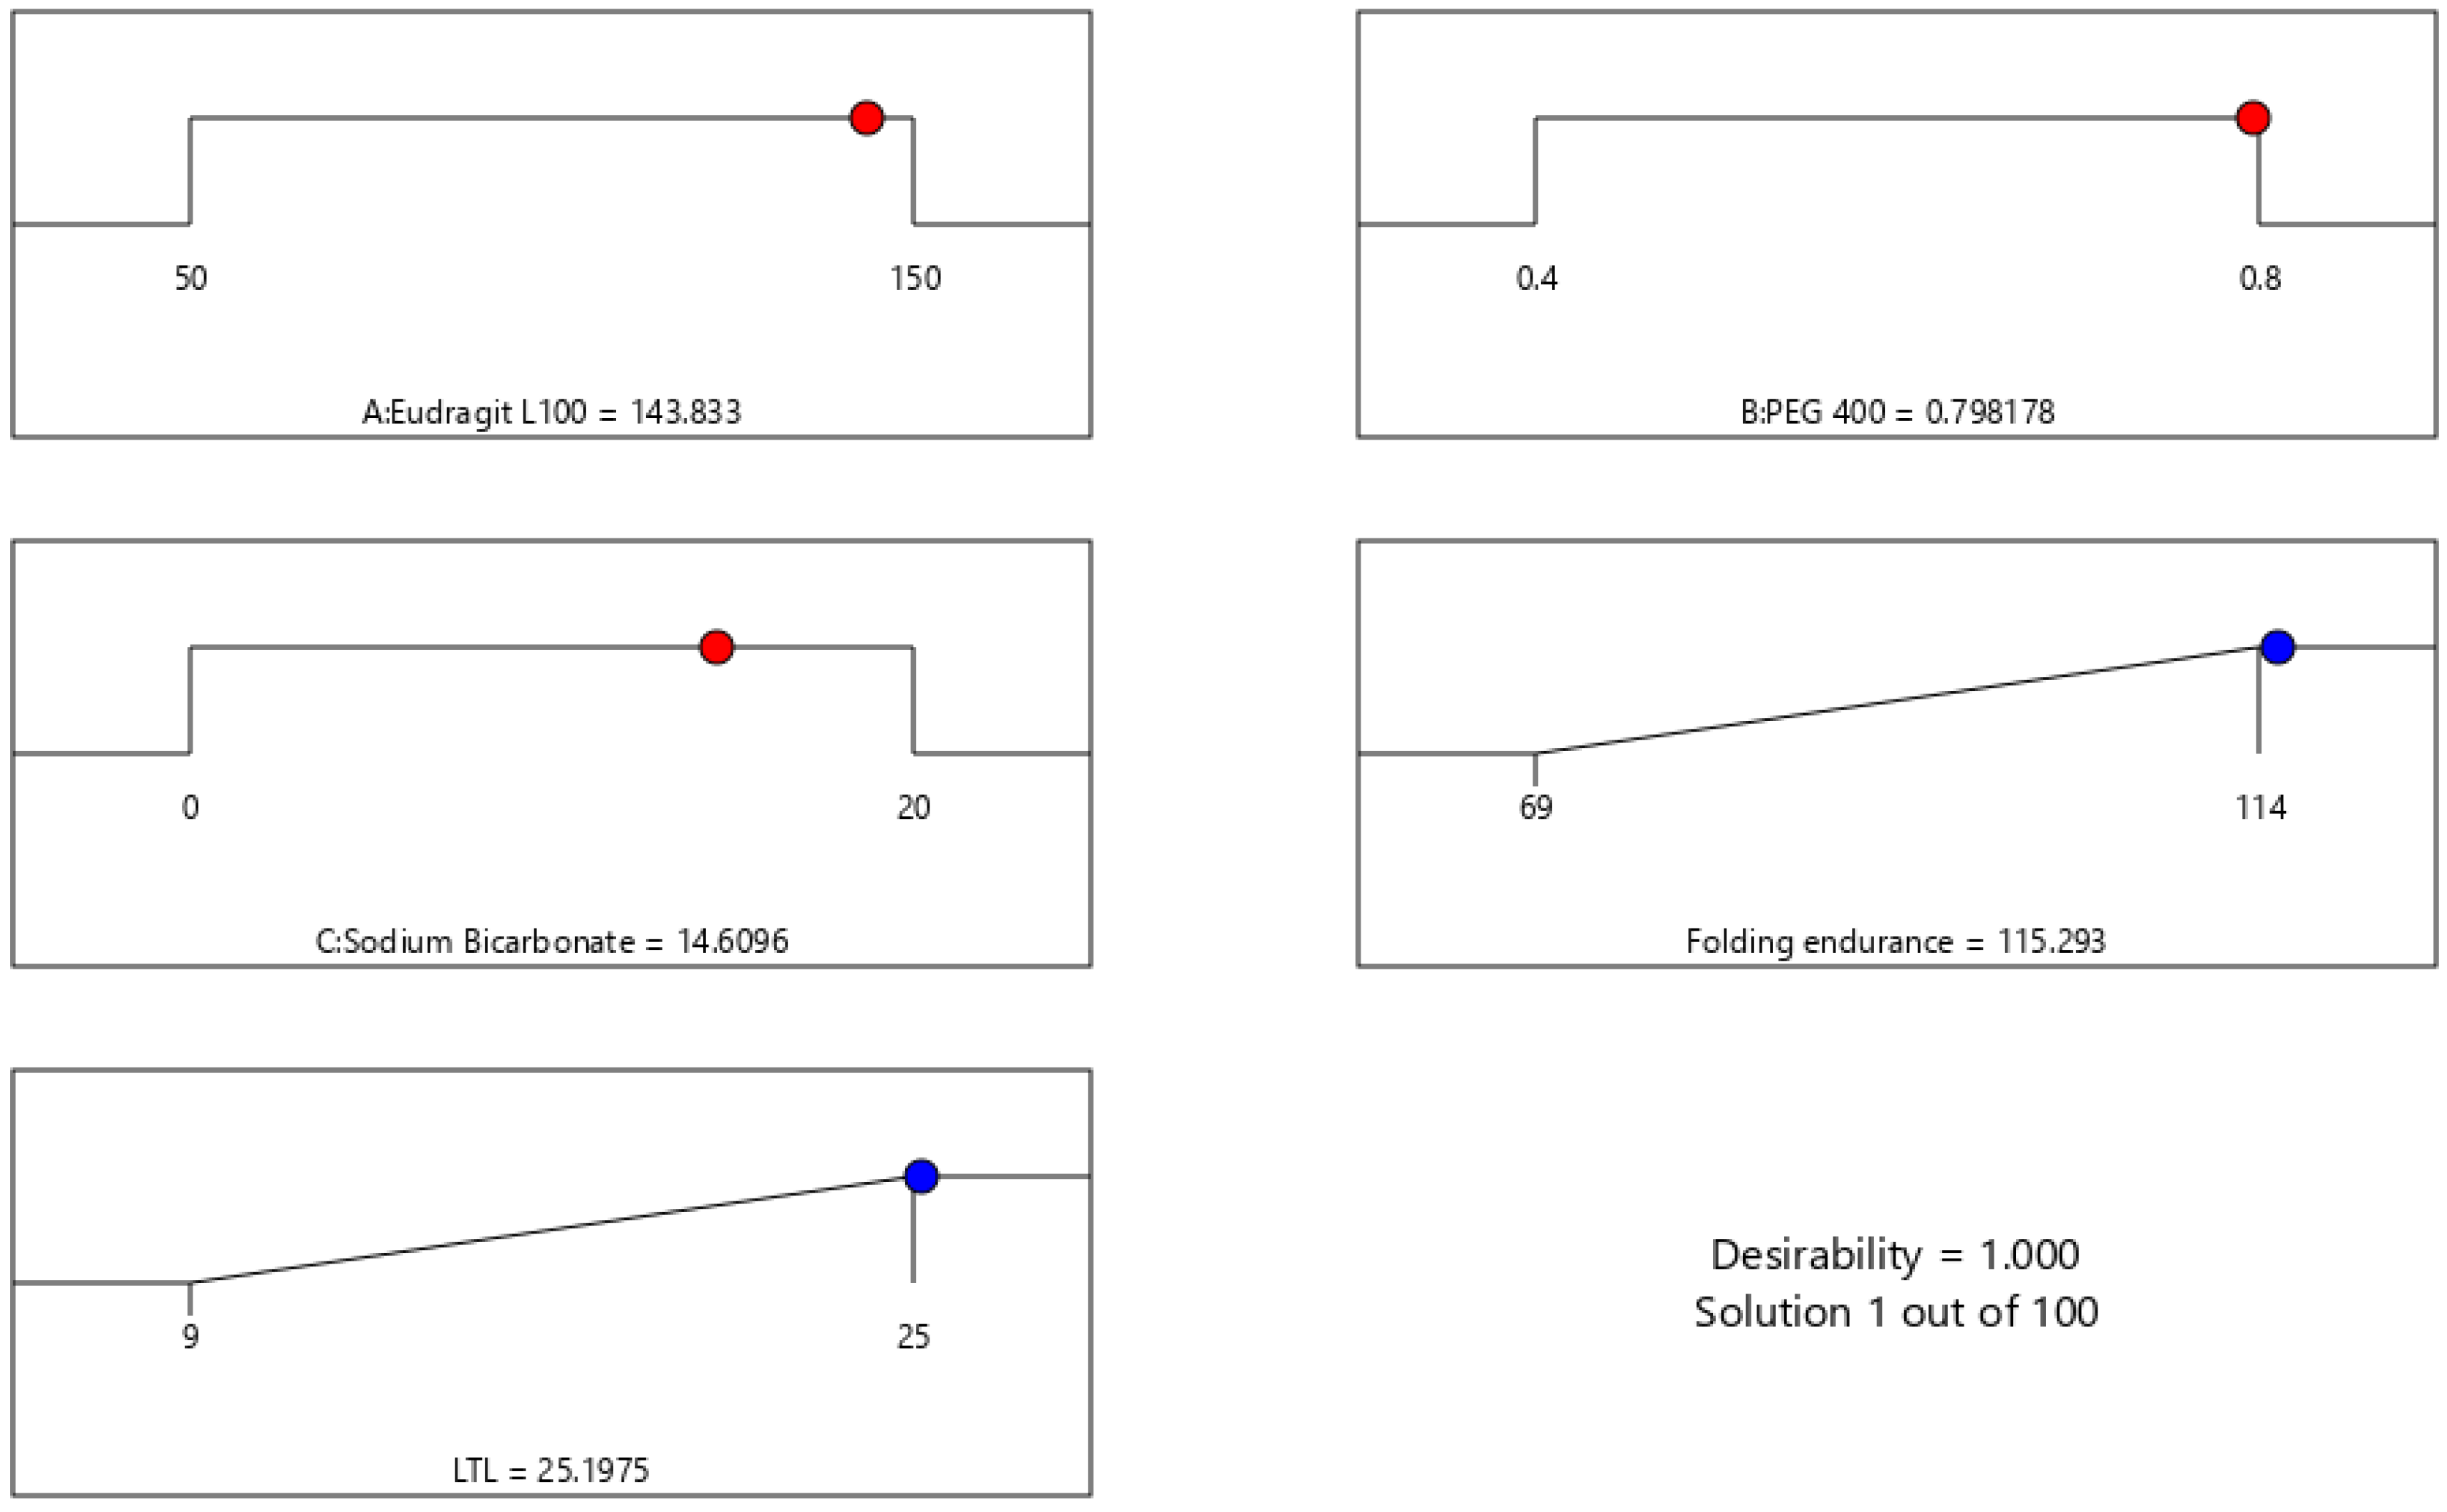
The global desirability function (D) was used to optimize the model’s order attained by statistical methods. Both responses were laid a maximum limit to acquire an inlay graph to strengthen the independent variables. All possible independent variables were considered in the method for optimization. In the desirability function plot, the individual parameters (optimal level) signified a maximum of 1.00 D value for both responses. The optimized concentrations of Eudragit L100, PEG, and sodium bicarbonate were 143.83, 0.7982, and 14.6096 (
Figure 5). Hence, implementation of this system aids in obtaining a folding endurance of 115.29 and 25 of LTL. A standardized preparation [O-IH-UF] was formulated and evaluated to check the study design. The relative error was less than 5%, ensuring the accuracy of the design (
Table 7). The same preparation was employed to determine other parameters.
3.3. Evaluation of Optimized Formulation
O-IH-UF was evaluated for various physicochemical properties, and the result is summarized in
Table 8. The uniformity of weight of the patches was observed in the range of 0.253 ± 0.023 g. The patches had a thickness of 0.93 ± 0.02 mm. For all the patches folding endurance was more than 100, denoting good flexibility and integrity.
Mechanical strength is the tangential force exerted on the ball through a uniform area in the film. A bursting machine was used for the test. Positive results were obtained, inferring that O-IH-UF has an adequate mechanical strength, which can be credited to the standardized concentrations of PEG 400 and Eudragit L 100.
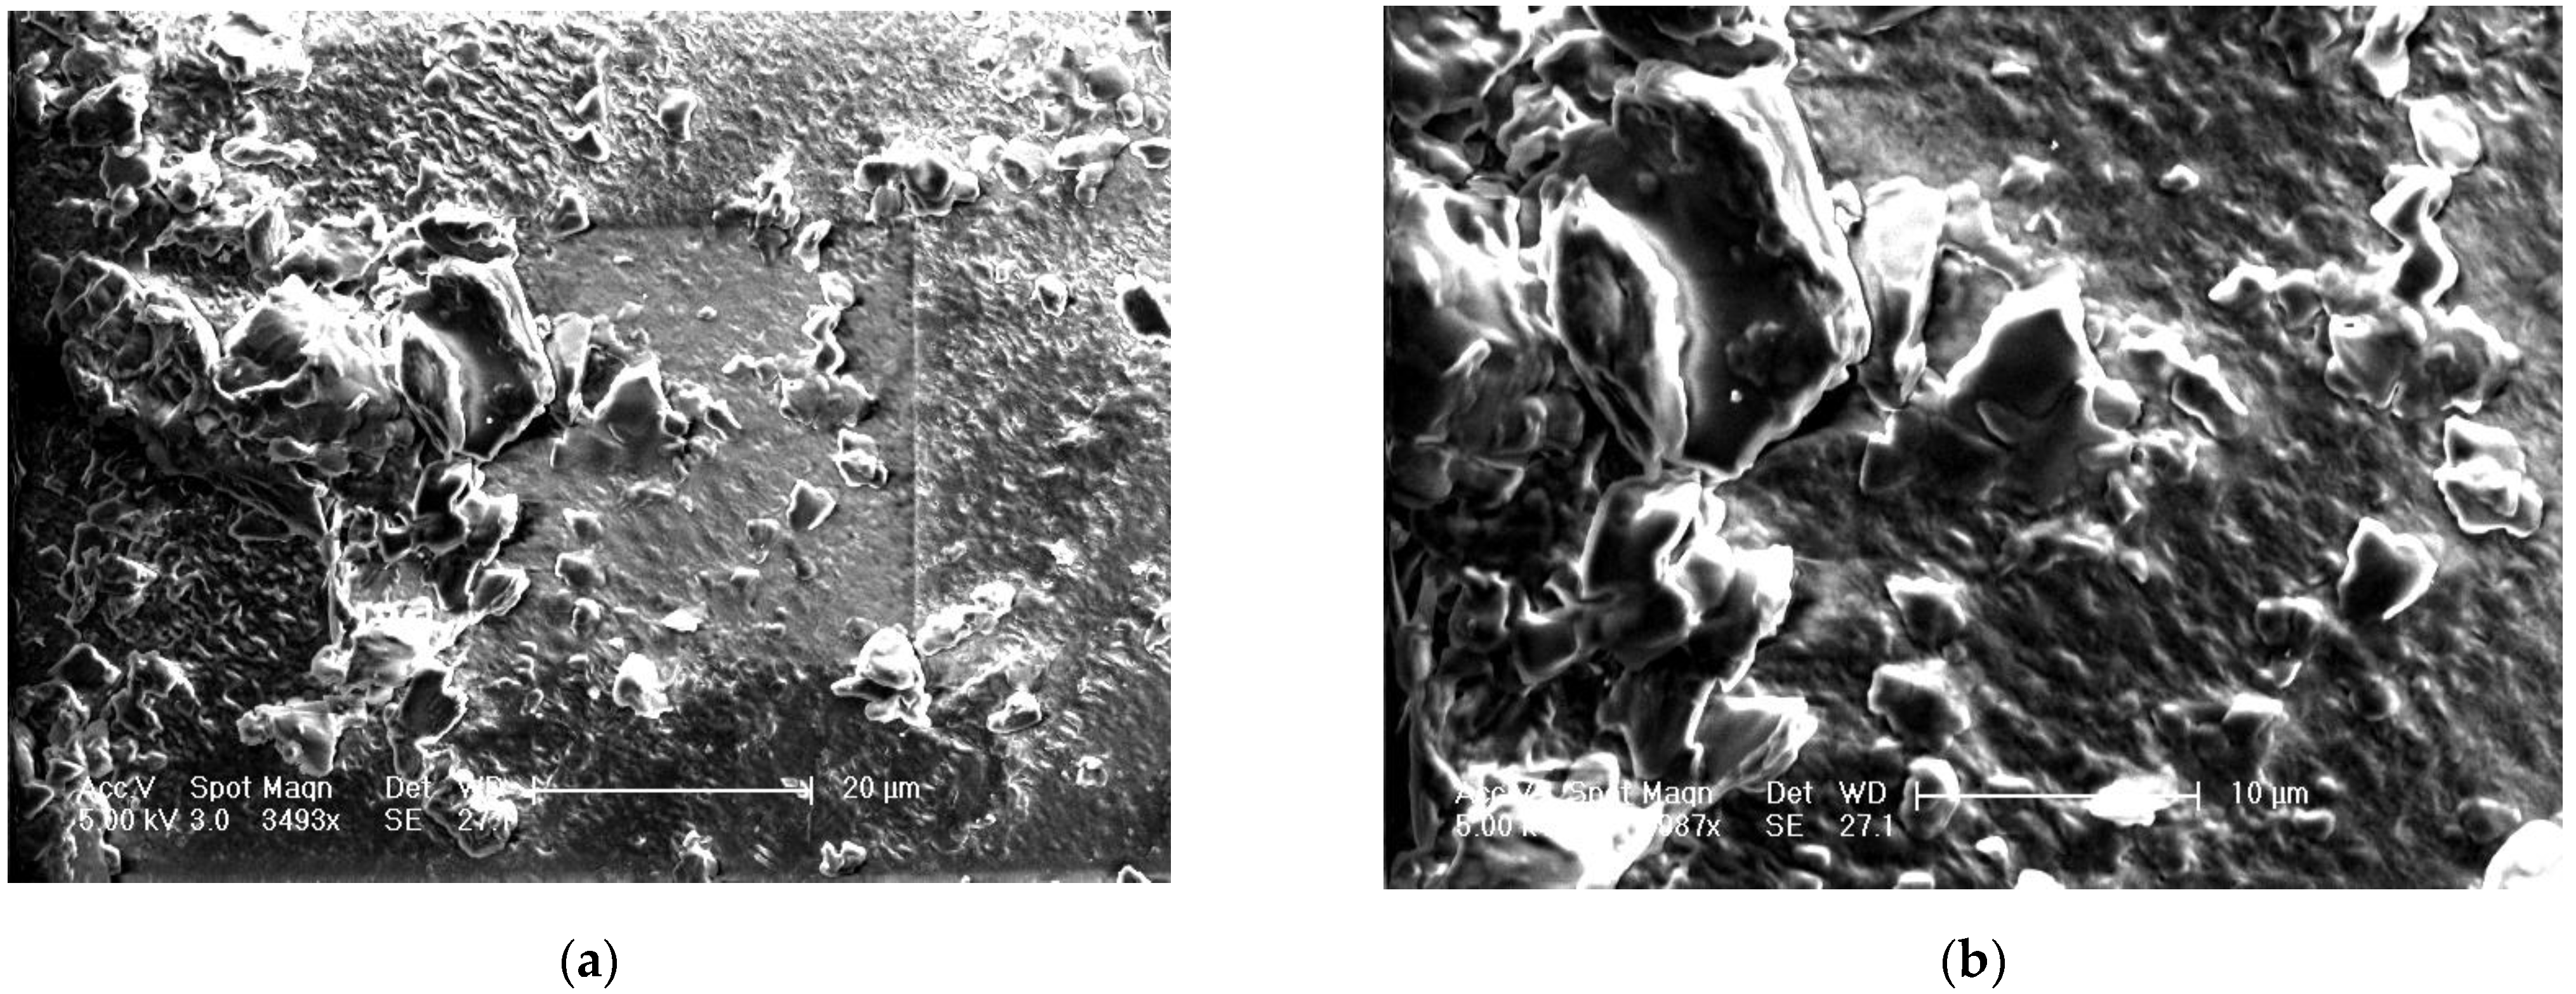
The surface morphology of the optimized film is shown in
Figure 6a at 3493x and
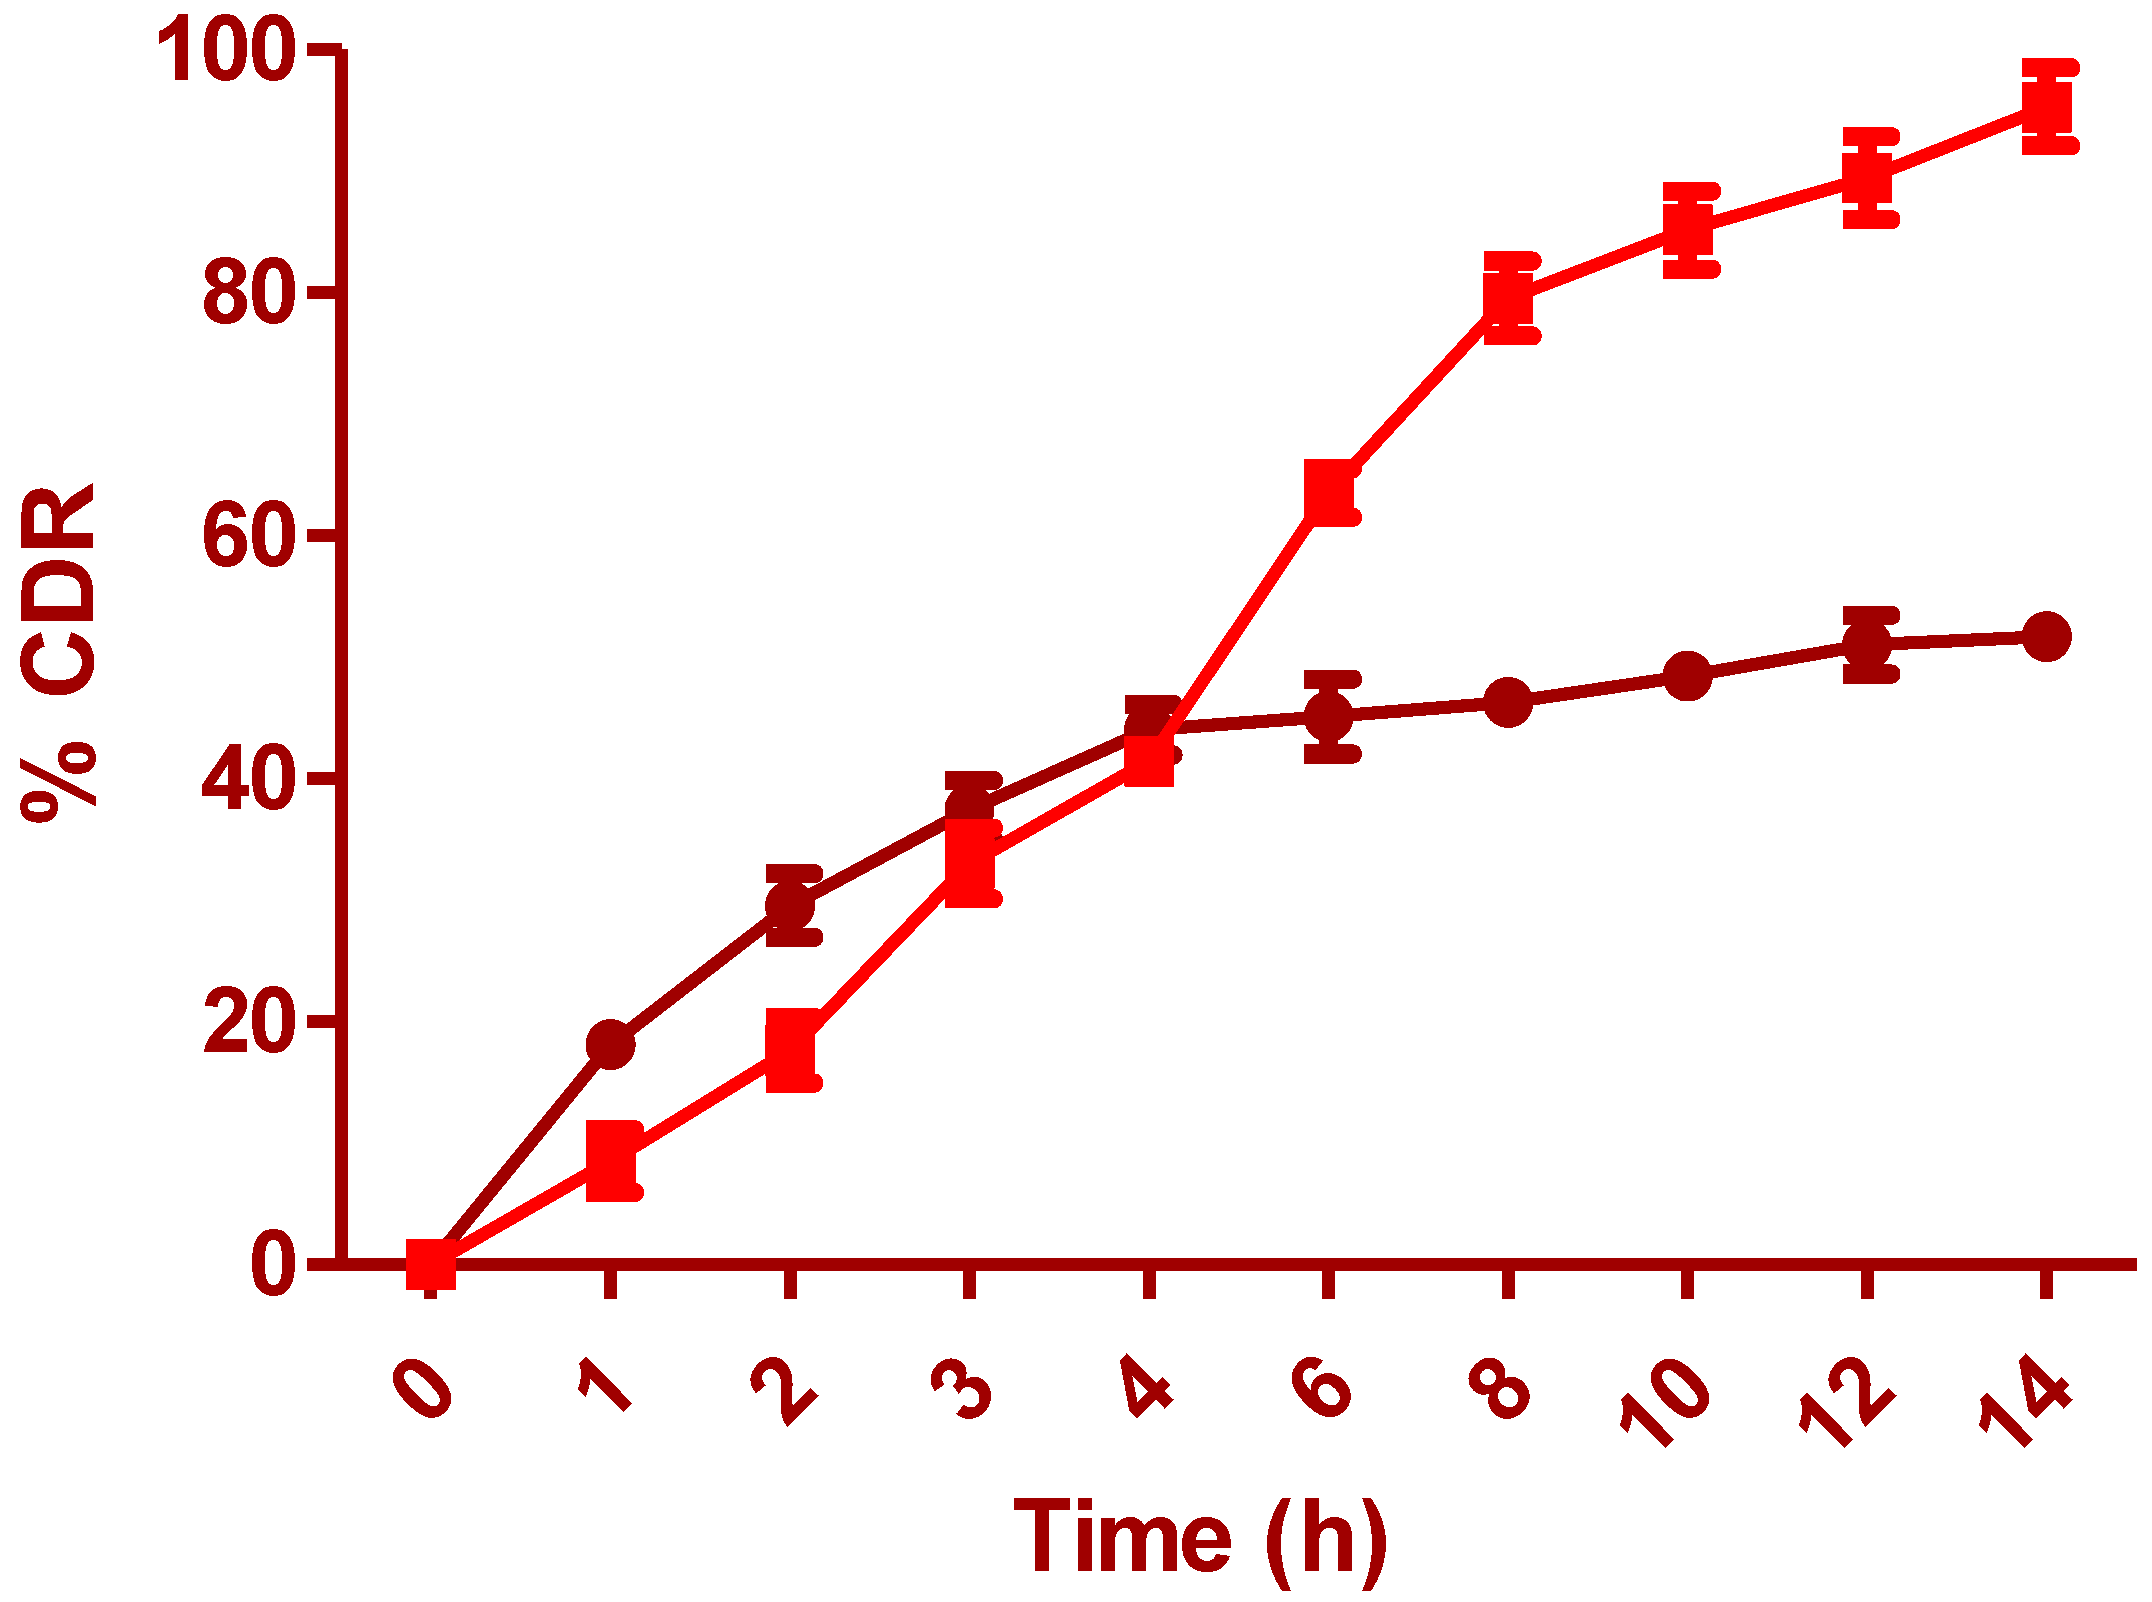
Figure 6b at 6987x. The surface morphology of the polymer film has shown particulate matter scattered on the surface with several depressions, which can be due to the effervescent nature of anti-adhesives used for the unfolding of the film. This can further make a channel for leaching of IH at the initial periods, which accounts for rapid drug release. The degradability test (pH 6.5) of the prepared layers illustrates improved rigidity and thickness in wet than dry conditions. Samples from standardized formula F.T were tested at pH 1.2 and 6.5 with type II apparatus. The Young’s modulus for the wet samples tested at pH 6.5 was 0.110 N/mm
2 after 5 h, while samples tested at pH 1.2 were 0.302 N/mm
2 after 6 h. The layers examined at pH 6.5 and 1.2 had a thickness of 1.24 mm and 2.02 mm, respectively. The results showed that the alteration in gastric pH due to food intake, disease, and drugs would not modify the drug release or enlarge the prepared drug system. It was noted that both rigidity and thickness were reduced significantly at intestinal pH (6.5) than at the stomach pH (1.2) [
7]. These results denote that the formulated system disintegrated quickly, was more elastic at intestinal pH, and will not remain in the intestines for longer, leading to side effects if preterm eviction occurs.
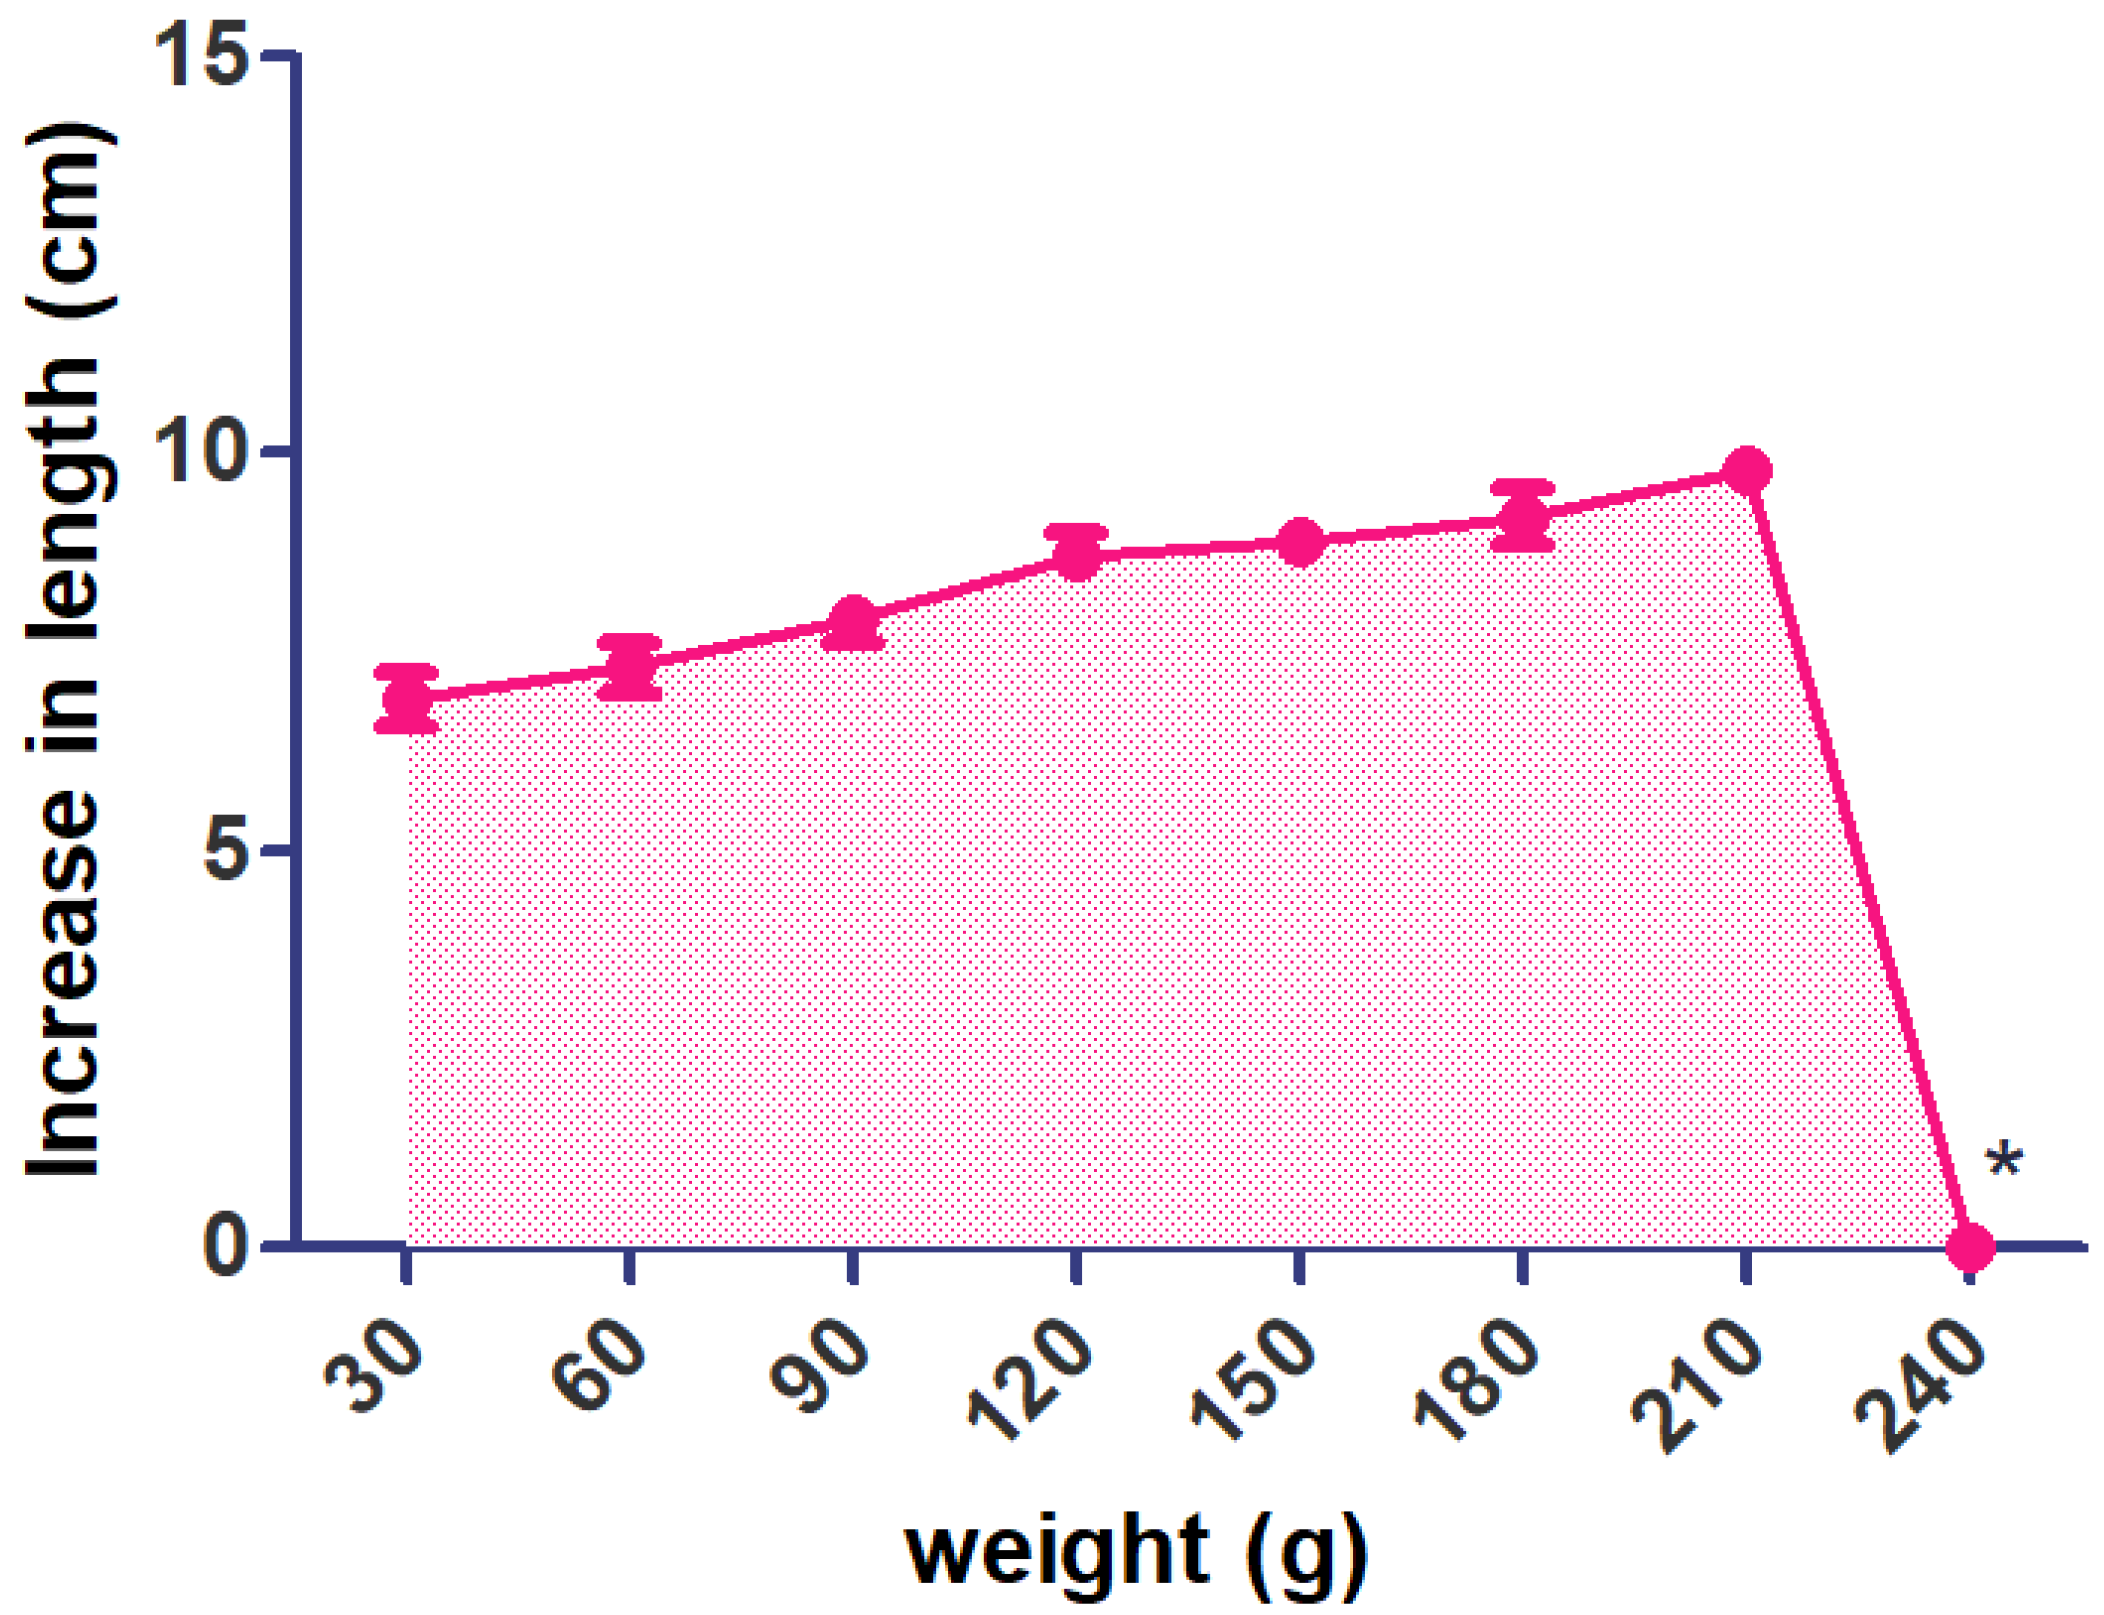
A notable change was seen in the length of the optimized preparation by using 30–210 g of weight. These results indicate that PEG offers a good plasticizing effect for the polymeric film yet increases the penetrability of water vapor in the film. I-IH-UF have a maximum tensile strength of 240 g (breaking of the film was observed) (
Figure 7).
