
Factors Influencing the Intracellular Concentrations of the Sofosbuvir Metabolite GS-331007 (in PBMCs) at 30 Days of Therapy

 ,
,  ,
,  , , , , , ,
Abstract
1. Introduction
2. Results
3. Discussion
4. Materials and Methods
4.1. Characteristics of Enrolled Patients
4.2. Pharmacogenetic Analyses
4.3. Pharmacokinetic Analyses
4.4. Statistical Analyses
5. Conclusions
Author Contributions
Funding
Institutional Review Board Statement
Informed Consent Statement
Data Availability Statement
Acknowledgments
Conflicts of Interest
References
- Hepatitis C (HCV) Agents. Available online: https://www.ncbi.nlm.nih.gov/books/NBK548885/ (accessed on 7 February 2022).
- Pawlotsky, J.M.; Feld, J.J.; Zeuzem, S.; Hoofnagle, J.H. From non-A, non-B hepatitis to hepatitis C virus cure. J. Hepatol. 2015, 62, S87–S99. [Google Scholar] [CrossRef] [PubMed]
- Schinazi, R.; Halfon, P.; Marcellin, P.; Asselah, T. HCV direct-acting antiviral agents: The best interferon-free combinations. Liver Int. 2014, 34 (Suppl. 1), 69–78. [Google Scholar] [CrossRef] [PubMed]
- Gonzalez-Grande, R.; Jimenez-Perez, M.; Gonzalez Arjona, C.; Mostazo Torres, J. New approaches in the treatment of hepatitis C. World J. Gastroenterol. 2016, 22, 1421–1432. [Google Scholar] [CrossRef] [PubMed]
- Lawitz, E.; Gane, E.J. Sofosbuvir for previously untreated chronic hepatitis C infection. N. Engl. J. Med. 2013, 369, 678–679. [Google Scholar] [CrossRef] [PubMed]
- Cuenca-Lopez, F.; Rivero, A.; Rivero-Juarez, A. Pharmacokinetics and pharmacodynamics of sofosbuvir and ledipasvir for the treatment of hepatitis C. Expert Opin. Drug Metab. Toxicol. 2016, 13, 105–112. [Google Scholar] [CrossRef] [PubMed]
- Poordad, F.; Schiff, E.R.; Vierling, J.M.; Landis, C.; Fontana, R.J.; Yang, R.; McPhee, F.; Hughes, E.A.; Noviello, S.; Swenson, E.S. Daclatasvir with sofosbuvir and ribavirin for hepatitis C virus infection with advanced cirrhosis or post-liver transplantation recurrence. Hepatology 2016, 63, 1493–1505. [Google Scholar] [CrossRef] [PubMed]
- Gutierrez, J.A.; Carrion, A.F.; Avalos, D.; O’Brien, C.; Martin, P.; Bhamidimarri, K.R.; Peyton, A. Sofosbuvir and simeprevir for treatment of hepatitis C virus infection in liver transplant recipients. Liver Transplant. 2015, 21, 823–830. [Google Scholar] [CrossRef] [PubMed]
- (FDA), F.A.D.A. Pharmacology Review. NDA:205834. Available online: http://www.accessdata.fda.gov/drugsatfda_docs/nda/2014/205834Orig1s000PharmR.pdf (accessed on 1 February 2022).
- (FDA), F.A.D.A. Chemistry Review. NDA:205834. Available online: http:www.acessdata.fda.gov/drugsatfda_docs/nda/2014/205834Orig1s000Approv.pdf (accessed on 1 February 2022).
- (FDA), F.A.D.A. Clinical Pharmacology and Biopharmaceutics Review. NDA:203854. 2013. Available online: https://www.accessdata.fda.gov/drugsatfda_docs/nda/2013/205552orig1s000clinpharmr.pdf (accessed on 1 February 2022).
- (EMA), E.M.A. Sovaldi Summary of Product Characteristics. Available online: http://www.ema.europa.eu/docs/en_GB/document_library/EPAR_-_Product_Information/human/002798/WC500160597.pdf (accessed on 29 September 2015).
- Babusis, D.; Curry, M.P.; Kirby, B.; Park, Y.; Murakami, E.; Wang, T.; Mathias, A.; Afdhal, N.; McHutchison, J.G.; Ray, A.S. Sofosbuvir and Ribavirin Liver Pharmacokinetics in Patients Infected with Hepatitis C Virus. Antimicrob. Agents Chemother. 2018, 62, e02587-17. [Google Scholar] [CrossRef] [PubMed]
- Rivero-Juarez, A.; Brieva, T.; Frias, M.; Rivero, A. Pharmacodynamic and pharmacokinetic evaluation of the combination of daclatasvir/sofosbuvir/ribavirin in the treatment of chronic hepatitis C. Expert Opin. Drug Metab. Toxicol. 2018, 14, 901–910. [Google Scholar] [CrossRef] [PubMed]
- Murakawa, M.; Asahina, Y.; Nagata, H.; Nakagawa, M.; Kakinuma, S.; Nitta, S.; Kawai-Kitahata, F.; Otani, S.; Kaneko, S.; Miyoshi, M.; et al. ITPA gene variation and ribavirin-induced anemia in patients with genotype 2 chronic hepatitis C treated with sofosbuvir plus ribavirin. Hepatol. Res. 2017, 47, 1212–1218. [Google Scholar] [CrossRef] [PubMed]
- Stattermayer, A.F.; Ferenci, P. Effect of IL28B genotype on hepatitis B and C virus infection. Curr. Opin. Virol. 2015, 14, 50–55. [Google Scholar] [CrossRef]
- Cusato, J.; De Nicolo, A.; Boglione, L.; Favata, F.; Ariaudo, A.; Mornese Pinna, S.; Carcieri, C.; Guido, F.; Avataneo, V.; Cariti, G.; et al. Pharmacogenetics of the anti-HCV drug sofosbuvir: A preliminary study. J. Antimicrob. Chemother. 2018, 73, 1659–1664. [Google Scholar] [CrossRef]
- Cusato, J.; De Nicolo, A.; Boglione, L.; Favata, F.; Ariaudo, A.; Mornese Pinna, S.; Carcieri, C.; Guido, F.; Avataneo, V.; Cariti, G.; et al. Vitamin D pathway genetic variants are able to influence sofosbuvir and its main metabolite pharmacokinetics in HCV mono-infected patients. Infect. Genet. Evol. 2018, 60, 42–47. [Google Scholar] [CrossRef]
- Cusato, J.; Boglione, L.; De Nicolo, A.; Favata, F.; Ariaudo, A.; Mornese Pinna, S.; Guido, F.; Avataneo, V.; Cantu, M.; Carcieri, C.; et al. Vitamin D pathway gene polymorphisms and hepatocellular carcinoma in chronic hepatitis C-affected patients treated with new drugs. Cancer Chemother. Pharmacol. 2018, 81, 615–620. [Google Scholar] [CrossRef]
- Cusato, J.; Allegra, S.; De Nicolo, A.; Boglione, L.; Fatiguso, G.; Mohamed Abdi, A.; Cariti, G.; Di Perri, G.; D’Avolio, A. Intracellular and Plasma Trough Concentration and Pharmacogenetics of Telaprevir. J. Pharm. Pharm. Sci. 2015, 18, 171–176. [Google Scholar] [CrossRef]
- Cusato, J.; Allegra, S.; De Nicolo, A.; Boglione, L.; Fatiguso, G.; Abdi, A.M.; Cariti, G.; Di Perri, G.; D’Avolio, A. Intracellular accumulation of boceprevir according to plasma concentrations and pharmacogenetics. Int. J. Antimicrob. Agents 2015, 45, 657–661. [Google Scholar] [CrossRef]
- Ahmed, B.; Munir, B.; Ghaffar, A.; Yameen, M.; Jalal, F.; Farooq, M.U.; Shehzadi, S.; Ashraf, S.; Liaqat, A. Pharmacokinetics profile of serum and cellular Sofosbuvir along with its concentration effect analysis in HCV patients receiving Sofosbuvir and Ribavirin. Pak. J. Pharm. Sci. 2019, 32, 1269–1274. [Google Scholar]
- De Nicolo, A.; Abdi, A.M.; Boglione, L.; Baiett, L.; Allegra, S.; Di Perri, G.; D’Avolio, A. UPLC-MS/MS method with automated on-line SPE for the isomer-specific quantification of the first-generation anti-HCV protease inhibitors in peripheral blood mononuclear cells. J. Pharm. Biomed. Anal. 2015, 115, 443–449. [Google Scholar] [CrossRef]
- Matsushita, K.; van der Velde, M.; Astor, B.C.; Woodward, M.; Levey, A.S.; de Jong, P.E.; Coresh, J.; Gansevoort, R.T. Association of estimated glomerular filtration rate and albuminuria with all-cause and cardiovascular mortality in general population cohorts: A collaborative meta-analysis. Lancet 2010, 375, 2073–2081. [Google Scholar] [CrossRef]
- Bazzoli, C.; Jullien, V.; Le Tiec, C.; Rey, E.; Mentre, F.; Taburet, A.M. Intracellular Pharmacokinetics of Antiretroviral Drugs in HIV-Infected Patients, and their Correlation with Drug Action. Clin. Pharmacokinet. 2009, 49, 17–45. [Google Scholar] [CrossRef]
- Dollery, C.T. Intracellular drug concentrations. Clin. Pharmacol. Ther. 2013, 93, 263–266. [Google Scholar] [CrossRef]
- D’Avolio, A.; Pensi, D.; Baietto, L.; Di Perri, G. Therapeutic drug monitoring of intracellular anti-infective agents. J. Pharm. Biomed. Anal. 2014, 101, 183–193. [Google Scholar] [CrossRef]
- Ascoli, G.A.; Domenici, E.; Bertucci, C. Drug binding to human serum albumin: Abridged review of results obtained with high-performance liquid chromatography and circular dichroism. Chirality 2006, 18, 667–679. [Google Scholar] [CrossRef]
- Rodriguez Gil, F.J.; Perez Garrido, I. Sofosbuvir antiviral therapy in HCV patients with severe renal failure. Gastroenterol. Hepatol. 2017, 40, 85–86. [Google Scholar] [CrossRef]
- Ivanyuk, A.; Livio, F.; Biollaz, J.; Buclin, T. Renal Drug Transporters and Drug Interactions. Clin. Pharmacokinet. 2017, 56, 825–892. [Google Scholar] [CrossRef]
- King, J.R.; Dutta, S.; Cohen, D.; Podsadecki, T.J.; Ding, B.; Awni, W.M.; Menon, R.M. Drug-Drug Interactions between Sofosbuvir and Ombitasvir-Paritaprevir-Ritonavir with or without Dasabuvir. Antimicrob. Agents Chemother. 2015, 60, 855–861. [Google Scholar] [CrossRef]
- German, P.; Mathias, A.; Brainard, D.; Kearney, B.P. Clinical Pharmacokinetics and Pharmacodynamics of Ledipasvir/Sofosbuvir, a Fixed-Dose Combination Tablet for the Treatment of Hepatitis C. Clin. Pharmacokinet. 2016, 55, 1337–1351. [Google Scholar] [CrossRef]
- Esposito, I.; Labarga, P.; Barreiro, P.; Fernandez-Montero, J.V.; de Mendoza, C.; Benitez-Gutierrez, L.; Pena, J.M.; Soriano, V. Dual antiviral therapy for HIV and hepatitis C—drug interactions and side effects. Expert Opin. Drug Saf. 2015, 14, 1421–1434. [Google Scholar] [CrossRef]
- Cropp, C.D.; Yee, S.W.; Giacomini, K.M. Genetic variation in drug transporters in ethnic populations. Clin. Pharmacol. Ther. 2008, 84, 412–416. [Google Scholar] [CrossRef]
- Feld, J.J.; Maan, R.; Zeuzem, S.; Kuo, A.; Nelson, D.R.; Di Bisceglie, A.M.; Manns, M.P.; Sherman, K.; Frazier, L.M.; Sterling, R.; et al. Effectiveness and Safety of Sofosbuvir-Based Regimens for Chronic HCV Genotype 3 Infection: Results of the HCV-TARGET Study. Clin. Infect. Dis. 2016, 63, 776–783. [Google Scholar] [CrossRef]
- EMA, Riassunto Delle Caratteristiche del Prodotto: Sovaldi. Available online: https://www.ema.europa.eu/en/documents/referral/direct-acting-antivirals-hepatitis-c-article-20-procedure-sovaldi-annex-i-iii_it.pdf (accessed on 1 February 2022).
- EMA, Riassunto Delle Caratteristiche del Prodotto: Daklinza. Available online: https://www.ema.europa.eu/en/documents/product-information/daklinza-epar-product-information_it.pdf (accessed on 1 February 2022).
- EMA, Riassunto Delle Caratteristiche del Prodotto: Harvoni. Available online: https://www.ema.europa.eu/en/documents/product-information/harvoni-epar-product-information_it.pdf (accessed on 1 February 2022).
- Ariaudo, A.; Favata, F.; De Nicolo, A.; Simiele, M.; Paglietti, L.; Boglione, L.; Cardellino, C.S.; Carcieri, C.; Di Perri, G.; D’Avolio, A. A UHPLC-MS/MS method for the quantification of direct antiviral agents simeprevir, daclatasvir, ledipasvir, sofosbuvir/GS-331007, dasabuvir, ombitasvir and paritaprevir, together with ritonavir, in human plasma. J. Pharm. Biomed. Anal. 2016, 125, 369–375. [Google Scholar] [CrossRef]
- De Nicolo, A.; Agnesod, D.; Simiele, M.; Rigano, D.; Adriani, A.; Canaparo, R.; Astegiano, M.; Rizzetto, M.; Di Perri, G.; D’Avolio, A. UPLC-MS/MS method for quantification of the azathioprine metabolites 6-mercaptoguanosine and 6-methylmercaptopurine riboside in peripheral blood mononuclear cells. J. Pharm. Biomed. Anal. 2014, 98, 271–278. [Google Scholar] [CrossRef][Green Version]


| Characteristics | All Cases | Genotypes 1 and 3 | No Ecographic Cirrhosis Diagnosis | Ecographic Cirrhosis Diagnosis | Statistical Significance (p-Value) | ||||
|---|---|---|---|---|---|---|---|---|---|
| n | 245 | 201 | 183 | 62 | / | ||||
| Age (year), median (IQR) | 51 (48–60) | 53 (48–62) | 54 (48–63) | 51.5 (41.9–60.2) | 0.125 | ||||
| Male sex, n (%) | 188 (76.7) | 156 (77.6) | 135 (73.8) | 53 (85.5) | 0.081 | ||||
| BMI (Kg/m2), median (IQR) | 26 (24–30) | 25.7 (23.5–28.5) | 26.8 (23.8–30) | 25.9 (24.4–32.8) | 0.297 | ||||
| HCV-RNA (Log IU/mL), median (IQR) | 6.5 (5.7–6.9) | 6.3 (5.8–6.7) | 3.38 (3.07–4.07) | 3.64 (3.3–4.5) | 0.033 | ||||
| Cryoglobulinemia, n (%) | 86 (35.1) | 67 (33.3) | 56 (30.6) | 30 (48.4) | 0.014 | ||||
| Insulin resistance, n (%) | 28 (11.4) | 21 (10.4) | 15 (8.2) | 13 (21) | 0.010 | ||||
| Metavir score, n (%) | F0–F3 F4 | 114 (46.5) 131 (53.5) | F0–F3 F4 | 88 (43.8) 113 (56.2) | F0–F3 F4 | 108 (59) 75 (41) | F0–F3 F4 | 6 (9.7) 56 (90.3) | <0.001 <0.001 |
| Alanine-aminotransferase (IU/mL), median (IQR) | 78.5 (58.7–95.7) | 80 (47–119) | 86 (71.5–213) | 91.5 (51–128.) | 0.295 | ||||
| Albumin (g/L), median (IQR) | 39.5 (31.7–43) | 40 (36–43) | 41 (39.5–45) | 37.5 (32–43) | <0.001 | ||||
| Hemoglobin (g/dL), median (IQR) | 14.7 (13.6–16.4) | 15.1 (14.3–16.0) | 15.2 (14.2–16.1) | 14.6 (13.2–15.7) | <0.004 | ||||
| Hematocrit (%), median (IQR) | 43.5 (40–46.8) | 44 (41.3–46.1) | 44.3 (41.7–46.6) | 41.9 (38.8–45.2) | <0.004 | ||||
| Mean corpuscular volume (fL), median (IQR) | 88.7 (84.3–93.5) | 89 (86.4–92.6) | 89.6 (86.3–92) | 88.2 (87–93) | 0.038 | ||||
| Estimated glomerular filtration rate (mL/min), median (IQR) | 104.8 (82.5–121.2) | 101 (84.4–116.1) | 99.3 (88.1–108) | 100.2 (66.9–124) | 0.638 | ||||
| Hepatocarcinoma n (%) | 4 (1.6) | 4 (2) | 0 | 4 (6.5) | NC | ||||
| Patients treated with ribavirin, n (%) | 85 (34.7) | 61 (30.3) | 67 (36.6) | 18 (29) | 0.281 | ||||
| Patients treated with daclatasvir, n (%) | 62 (25.3) | 55 (24.7) | 39 (21.3) | 23 (37.1) | 0.018 | ||||
| Patients treated with ledipasvir, n (%) | 66 (26.9) | 63 (31.3) | 42 (23) | 24 (38.7) | 0.020 | ||||
| Median GS-331007 plasma concentrations at 1 month of therapy (ng/mL), median (IQR) | 274 (198–367) | 335 (239.3–490.8) | 298.5 (198.7–459.5) | 243 (184–356) | 0.273 | ||||
| Median GS-331007 intracellular concentrations at 1 month of therapy (ng/mL), median (IQR) | 1118.8 (355.9–2794.5) | 1126.1 (416.2–2937.9) | 799.5 (10.5–2293.7) | 1126.5 (690.3–5155.8) | 0.086 | ||||
| Median GS-331007 plasma/intracellular concentrations at 1 month of therapy, median (IQR) | 0.1 (0.07–0.2) | 0.21 (0.08–0.57) | 0.22 (0.1–0.6) | 0.14 (0.05–0.2) | 0.048 | ||||
| Median daclatasvir concentrations at 1 month of therapy (ng/mL), median (IQR) | 182 (104–294) | 176.5 (93.8–277.0) | 177 (88.2v314.7) | 203 (149.5v294) | 0.475 | ||||
| Median ledipasvir concentrations at 1 month of therapy (ng/mL), median (IQR) | 232 (172–329) | 235.5 (158.5–332.3) | 227.5 (157.5–328.2) | 232 (187.5–412) | 0.560 | ||||
| Genotype, n (%) | 1 | 158 (64.5) | 1 | 158 (78.6) | 1 | 119 (65) | 1 | 39 (62.9) | 0.048 |
| 2 | 12 (4.9) | 2 | 10 (5.5) | 2 | 2 (3.2) | ||||
| 3 | 43 (17.6) | 3 | 43 (21.4) | 3 | 26 (14.2) | 3 | 17 (27.4) | ||
| 4 | 32 (13.1) | 4 | 28 (15.3) | 4 | 4 (6.5) | ||||
| Variables in All Patients | GS-331007 Intracellular Concentration at 30 Days (ng/mL) [p-Value; Pearson Coefficient] | GS-331007 Plasma Concentration at 30 Days (ng/mL) [p-Value; Pearson Coefficient] |
|---|---|---|
| Age (year) | <0.001; 0.412 | 0.046; 0.187 |
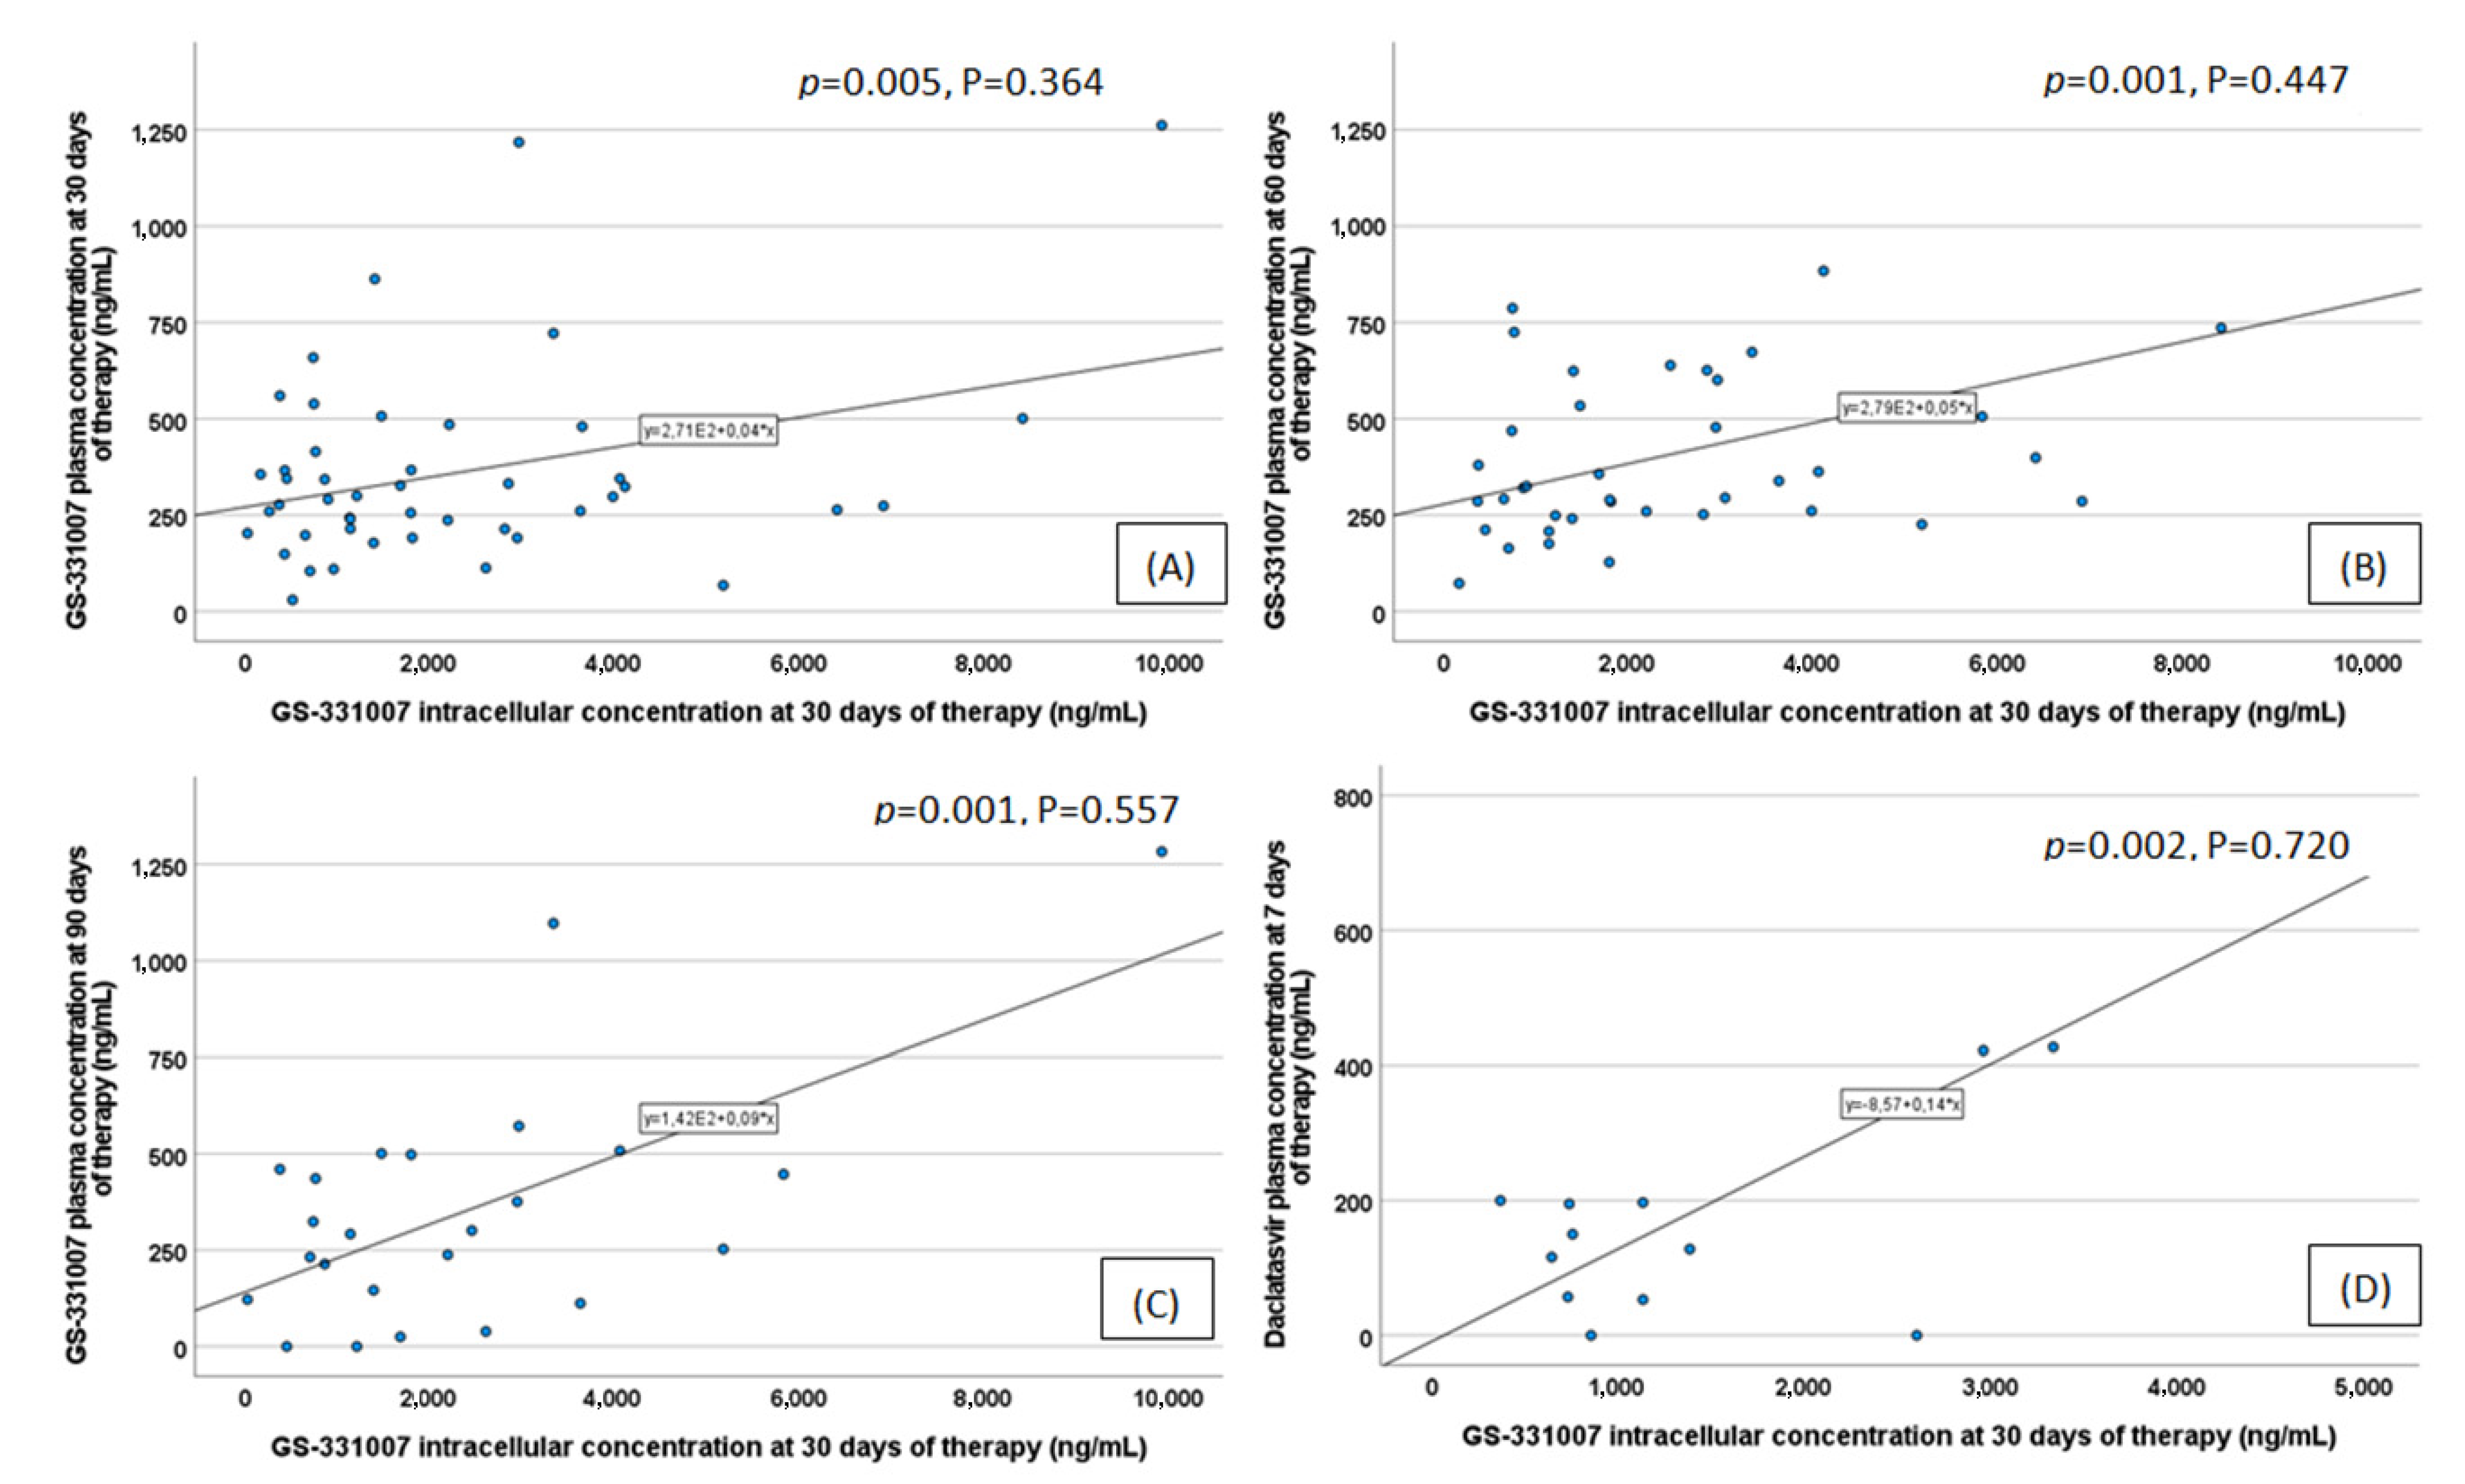
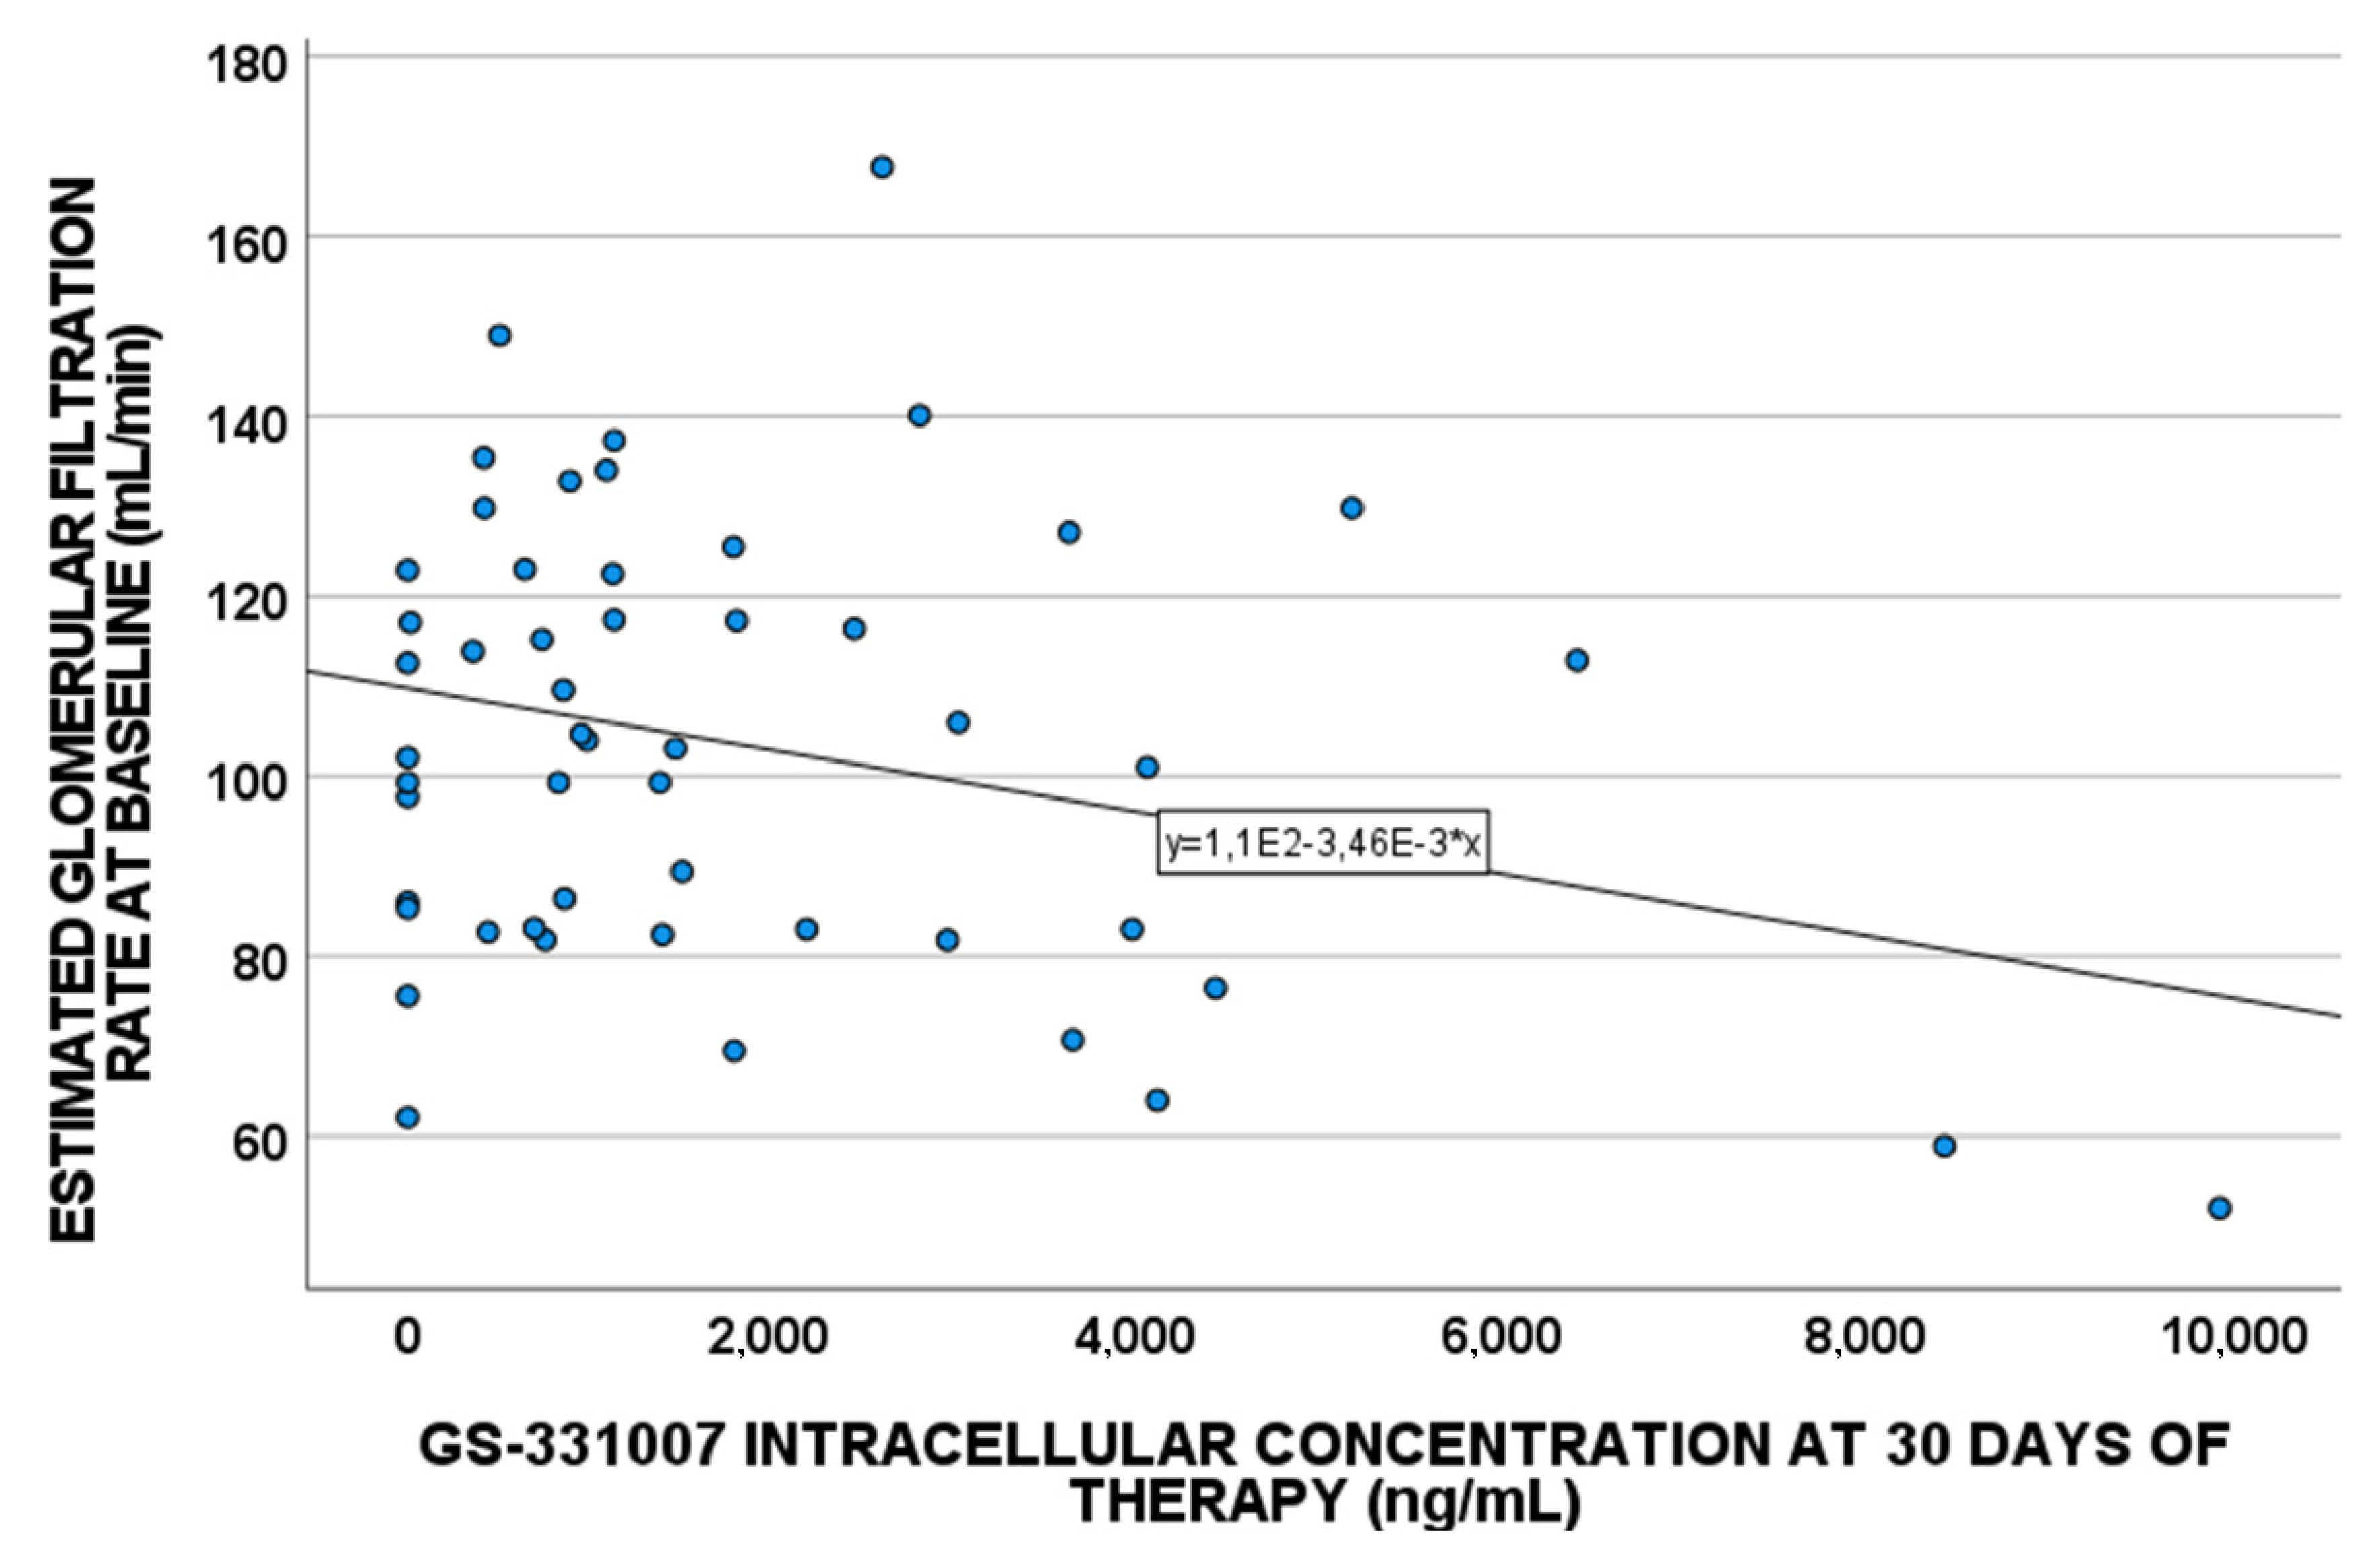
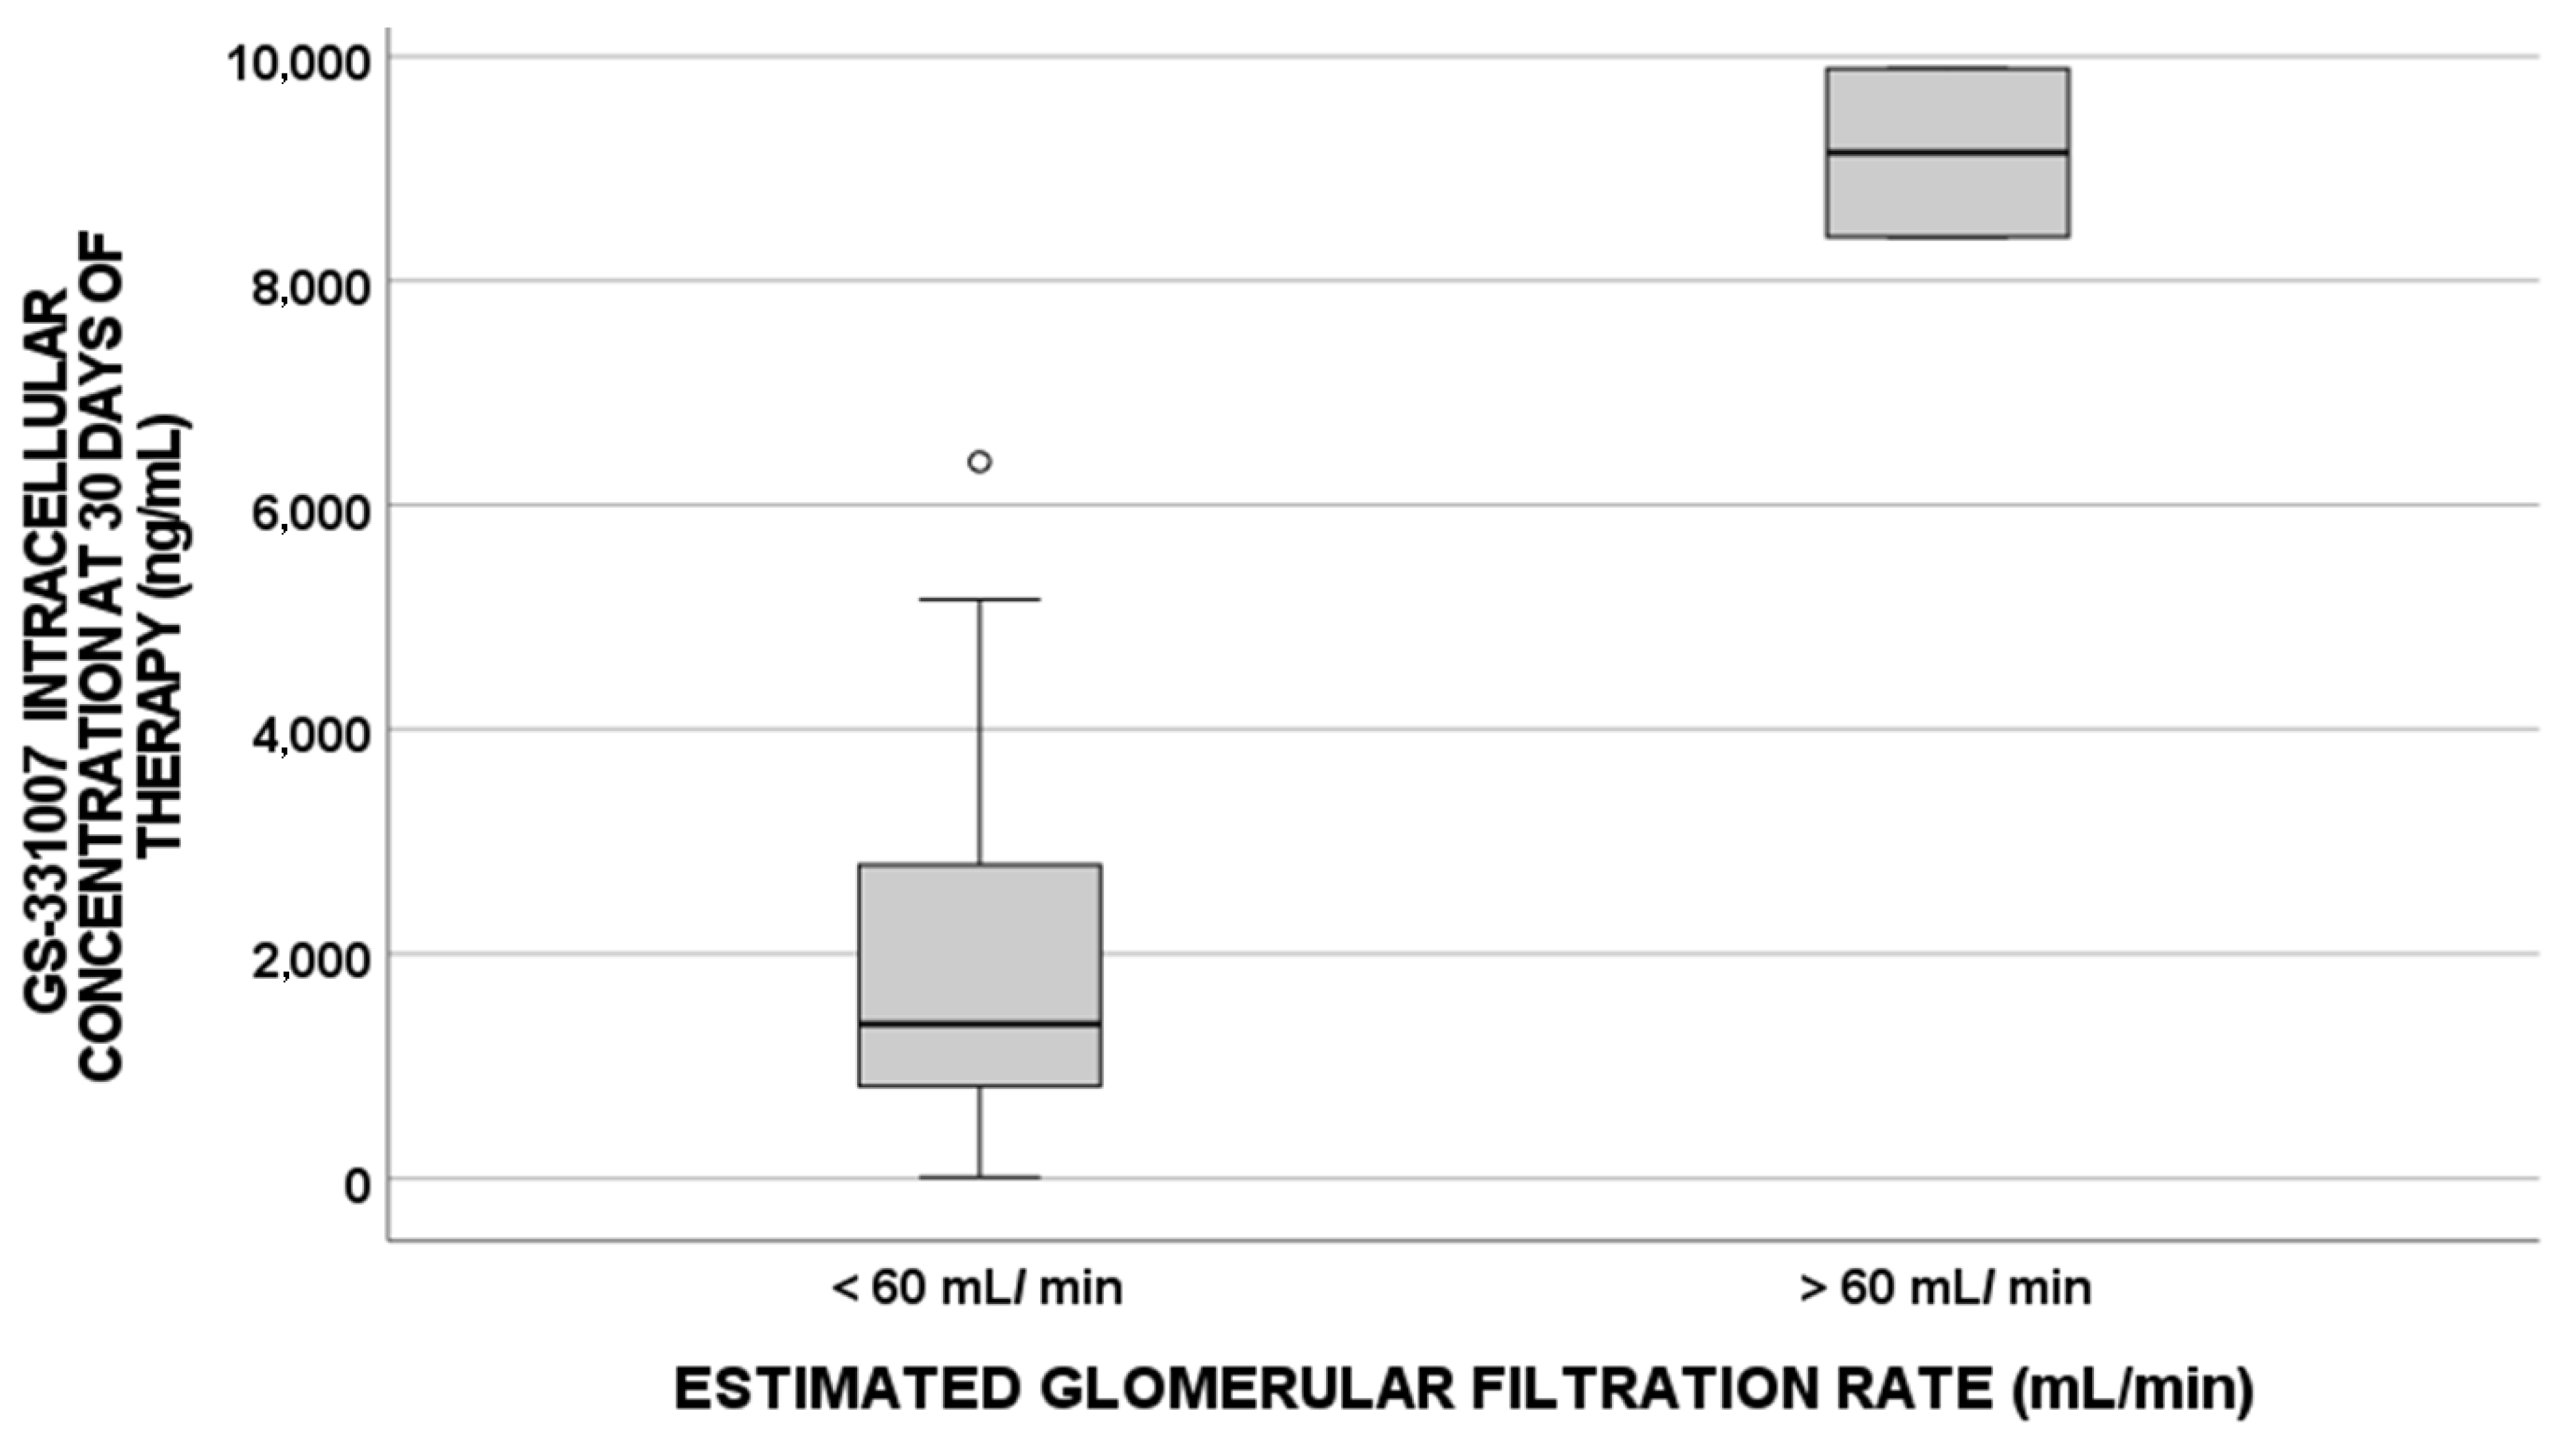
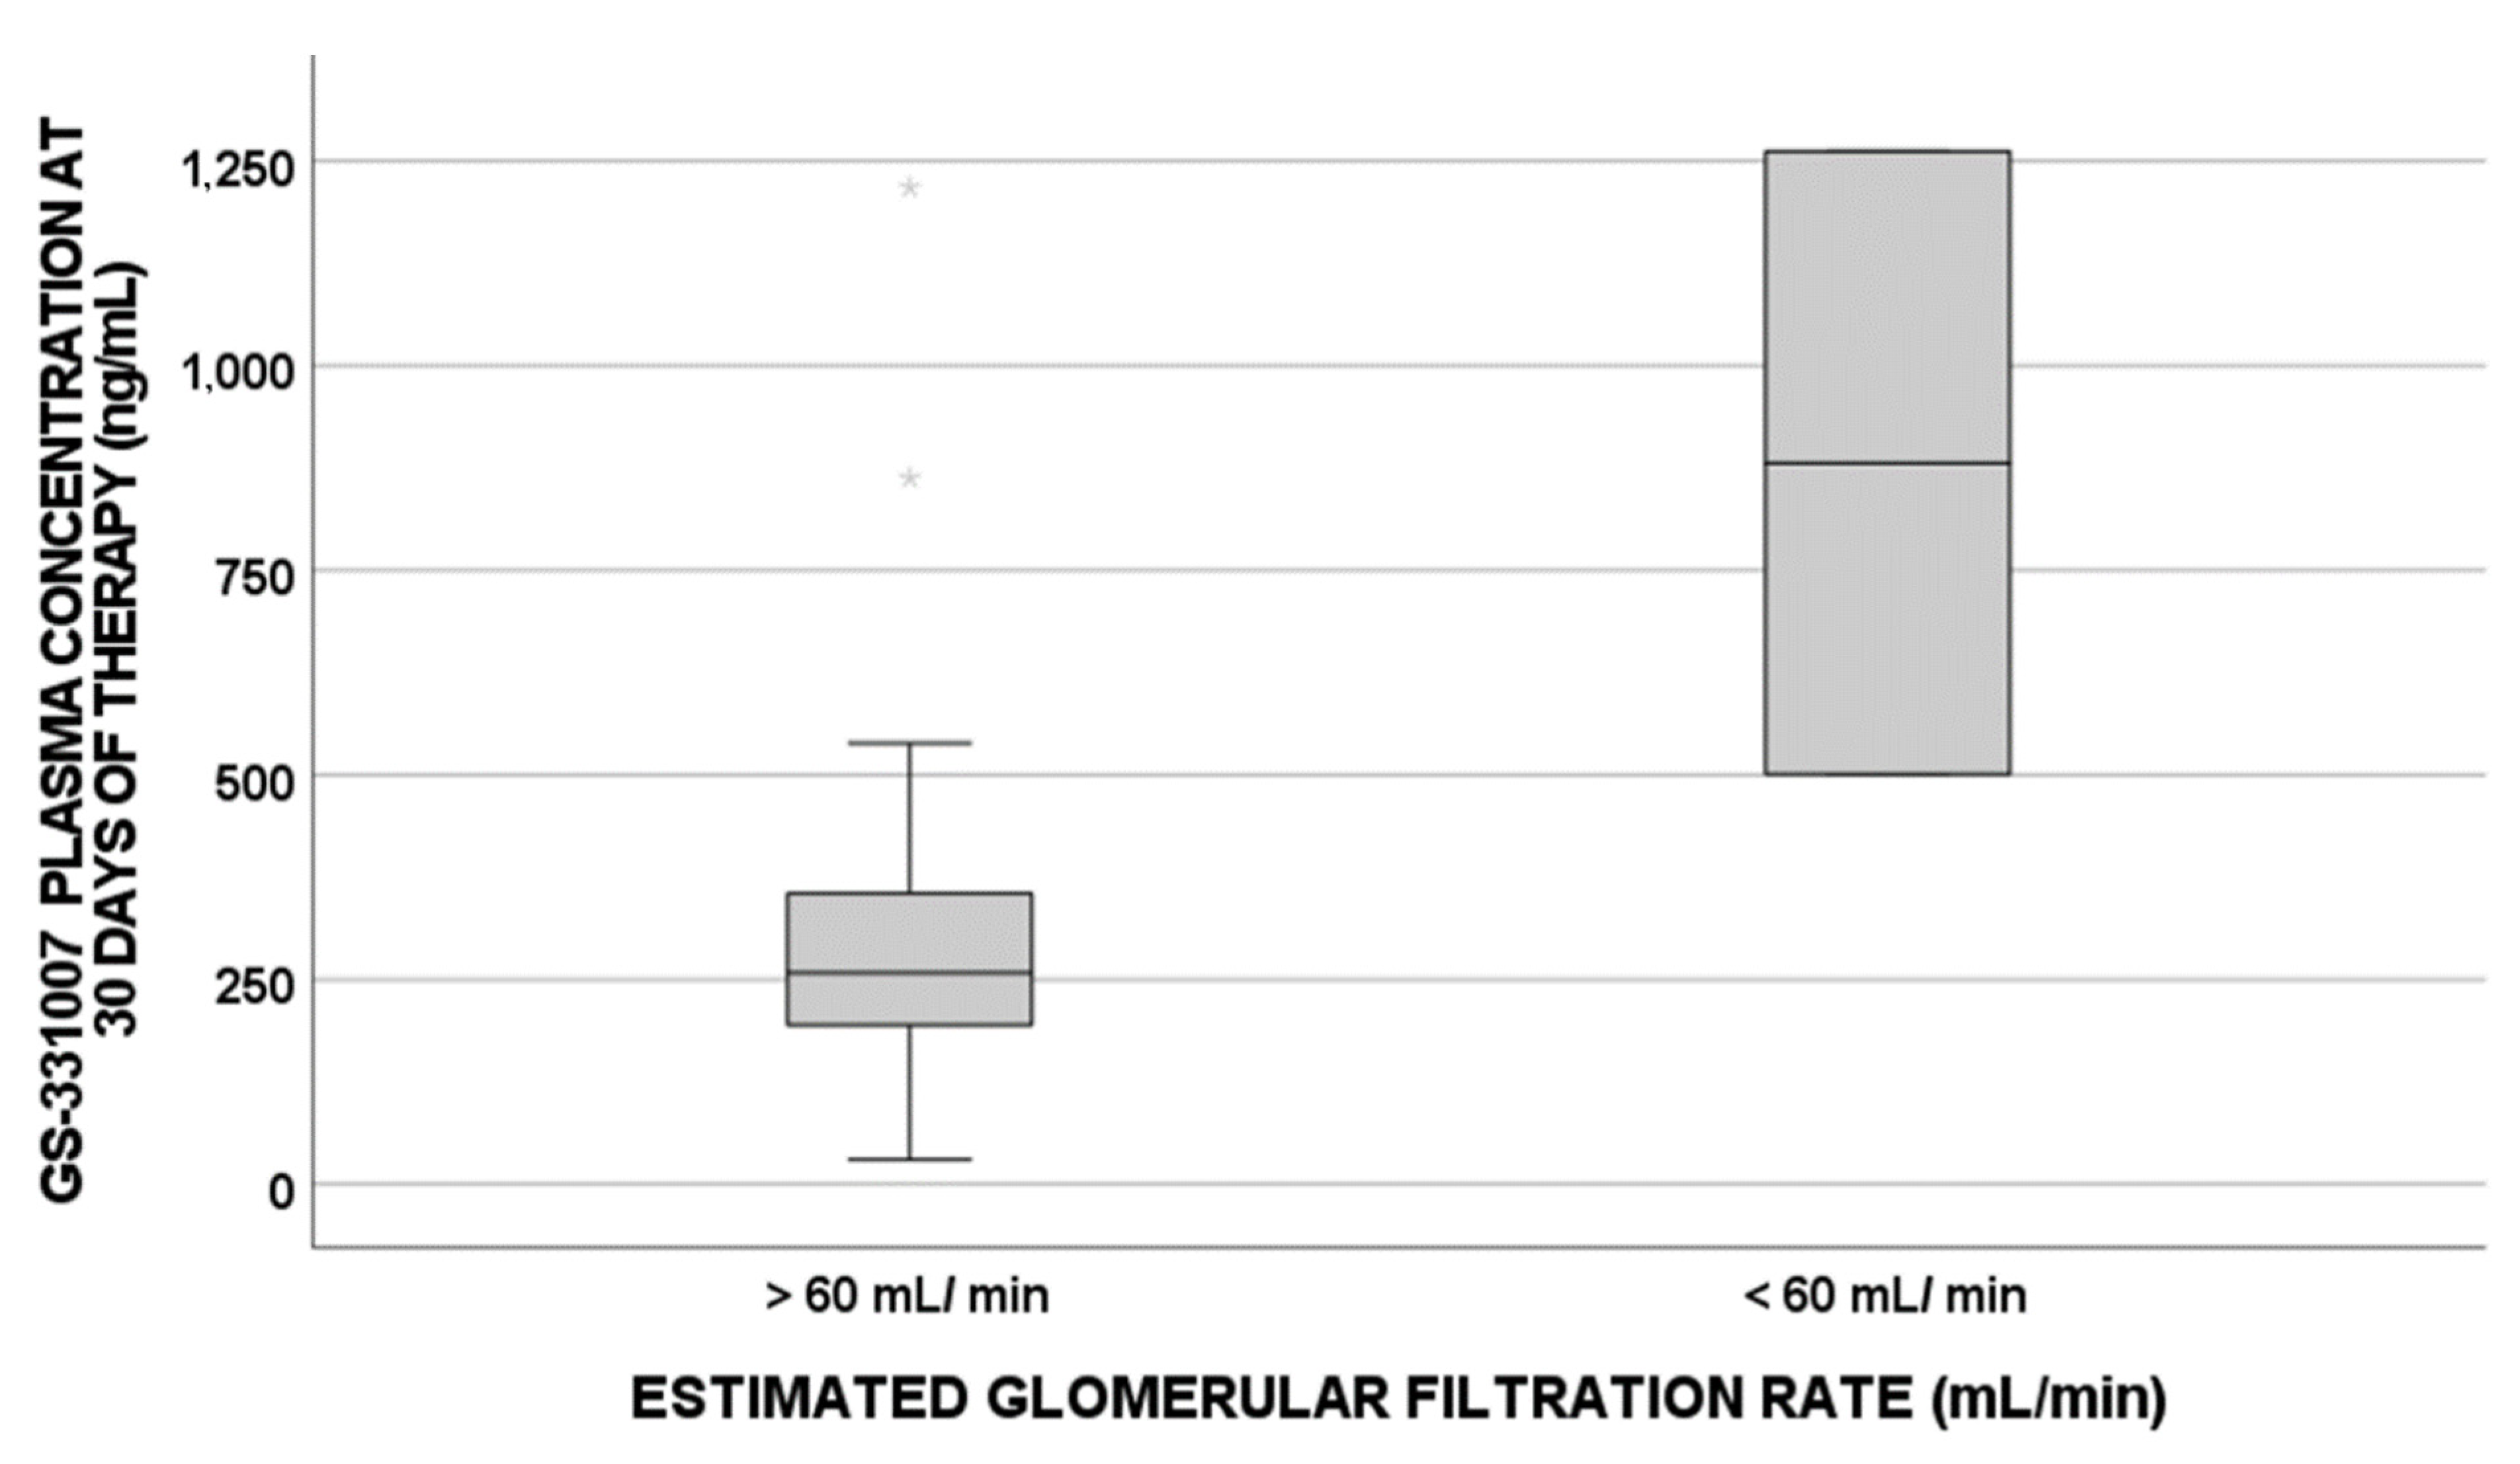
| Estimated glomerular filtration rate (mL/min) | 0.036; −0.291 | <0.001; −0.447 |
| Baseline hemoglobin (g/dL) | <0.001; −0.531 | 0.035; −0.200 |
| Baseline hematocrit (%) | 0.001; −0.465 | / |
| Mean Corpuscular Volume (fL) | / | / |
| Albumin (g/L) | 0.020; −0.313 | / |
| BMI (Kg/m2) | / | / |
| Alanine-aminotransferase (IU/L) | / | / |
| HCV-RNA (Log IU/mL) | / | / |
| Variables in Ecographic Cirrhotic Patients | GS-331007 Intracellular Concentration at 30 Days (ng/mL) [p-Value; Pearson Coefficient] | GS-331007 Plasma Concentration at 30 Days (ng/mL) [p-Value; Pearson Coefficient] |
|---|---|---|
| Age (year) | / | / |
| Estimated glomerular filtration rate (mL/min) | / | 0.001; −0.572 |
| Baseline hemoglobin (g/dL) | 0.001; −0.726 | / |
| Baseline hematocrit (%) | 0.007; −0.667 | / |
| Mean Corpuscular Volume (fL) | / | / |
| Albumin (g/L) | / | / |
| BMI (Kg/m2) | / | / |
| Alanine-aminotransferase (IU/L) | / | / |
| HCV-RNA (Log IU/mL) | / | / |
| Variables in Patients with No Ecographic Cirrhosis | GS-331007 Intracellular Concentration at 30 Days (ng/mL) [p-Value; Pearson Coefficient] | GS-331007 Plasma Concentration at 30 Days (ng/mL) [p-Value; Pearson Coefficient] |
|---|---|---|
| Age (year) | 0.002; 0.426 | 0.006; 0.308 |
| Estimated glomerular filtration rate (mL/min) | / | 0.001; −0.403 |
| Baseline hemoglobin (g/dL) | 0.015; −0.338 | 0.039; −0.238 |
| Baseline hematocrit (%) | / | / |
| Mean Corpuscular Volume (fL) | / | / |
| Albumin (g/L) | / | / |
| BMI (Kg/m2) | / | / |
| Alanine-aminotransferase (IU/L) | / | / |
| HCV-RNA (Log IU/mL) | / | / |
| GS-331007 Metabolite Intracellular Concentrations at 30 Days of Therapy | ||||
|---|---|---|---|---|
| UNIVARIATE | MULTIVARIATE | |||
| p-Value | OR (95% IC) | p-Value | OR (95% IC) | |
| BMI at baseline | 0.320 | 52.476 (−52.346; 157.298) | ||
| Age | <0.001 | 96.995 (52.222; 141.769) | 0.595 | −27.978 (−135.863; 79.906) |
| Gender | 0.010 | 1778.108 (445.416; 3110.801) | 0.248 | 947.016 (−697.439; 2591.471) |
| Cirrhosis | 0.147 | 895.063 (−322.849; 2112.974) | 0.539 | 372.594 (−864.776; 1609.965) |
| Metavir score | 0.482 | 288.911 (−528.453; 1106.274) | ||
| Ribavirin treatment | 0.081 | −977.127 (−2077.495; 123.240) | 0.396 | 552.134 (−769.093; 1873.361) |
| Daclatasvir treatment | 0.165 | −856.788 (−2076.670; 363.095) | 0.293 | 623.597 (−570.200; 1817.394) |
| Ledipasvir treatment | 0.002 | 1685.431 (660.043; 2710.820) | 0.026 | 1412.860 (184.004; 2641.721) |
| Baseline ALT | 0.387 | −2,445 (−8.062; 3.171) | ||
| Baseline eGFR | 0.005 | −34.696 (−58.224; −11.169) | 0.029 | −22.677 (−42.890; −2.464) |
| Baseline albumin | 0.046 | −60.238 (−119.492; −0.985) | 0.010 | −70.093 (−121.996; −18.190) |
| GS-331007 plasma concentrations at 30 days of therapy | 0.022 | 2.936 (0.452; 5.421) | 0.347 | −1.774 (−5.583; 2.035) |
| ABCB1 3435 TT | 0.144 | −901.457 (−2119.030; 316.116) | 0.738 | 289.774 (−1495.686; 2075.233) |
| ABCB1 1236 TT | 0.017 | −1554.498 (−2818.099; −290.898) | 0.465 | −548.368 (−2074.326; 977.591) |
| ABCB1 2677 TT | 0.076 | 1053.002 (−112.565; 2218.569) | 0.139 | 942.688 (−324.899; 2210.275) |
| ABCG2 421 CA | 0.606 | 514.735 (−1472.017; 2501.487) | ||
| ABCG2 1194 + 928 TC/CC | 0.353 | 522,128 (−595,589; 1639,845) | ||
| HNF4α 975 CG/GG | 0.169 | −798.028(−1945.495; 349.440) | 0.552 | −366.867 (−1627.415; 893.680) |
| IL 860 TT | 0.329 | 586.04 (−505;1477) | ||
| IL 917 CC | 0.484 | −345.9 (−1330.9;639.9) | ||
Publisher’s Note: MDPI stays neutral with regard to jurisdictional claims in published maps and institutional affiliations. |
© 2022 by the authors. Licensee MDPI, Basel, Switzerland. This article is an open access article distributed under the terms and conditions of the Creative Commons Attribution (CC BY) license (https://creativecommons.org/licenses/by/4.0/).
Share and Cite
Cusato, J.; Boglione, L.; De Nicolò, A.; Caviglia, G.P.; Mornese Pinna, S.; Ciancio, A.; Troshina, G.; Smedile, A.; Antonucci, M.; Avataneo, V.; et al. Factors Influencing the Intracellular Concentrations of the Sofosbuvir Metabolite GS-331007 (in PBMCs) at 30 Days of Therapy. Pharmaceuticals 2022, 15, 355. https://doi.org/10.3390/ph15030355
Cusato J, Boglione L, De Nicolò A, Caviglia GP, Mornese Pinna S, Ciancio A, Troshina G, Smedile A, Antonucci M, Avataneo V, et al. Factors Influencing the Intracellular Concentrations of the Sofosbuvir Metabolite GS-331007 (in PBMCs) at 30 Days of Therapy. Pharmaceuticals. 2022; 15(3):355. https://doi.org/10.3390/ph15030355
Chicago/Turabian StyleCusato, Jessica, Lucio Boglione, Amedeo De Nicolò, Gian Paolo Caviglia, Simone Mornese Pinna, Alessia Ciancio, Giulia Troshina, Antonina Smedile, Miriam Antonucci, Valeria Avataneo, and et al. 2022. "Factors Influencing the Intracellular Concentrations of the Sofosbuvir Metabolite GS-331007 (in PBMCs) at 30 Days of Therapy" Pharmaceuticals 15, no. 3: 355. https://doi.org/10.3390/ph15030355
APA StyleCusato, J., Boglione, L., De Nicolò, A., Caviglia, G. P., Mornese Pinna, S., Ciancio, A., Troshina, G., Smedile, A., Antonucci, M., Avataneo, V., Palermiti, A., Mula, J., Manca, A., Cariti, G., Cantù, M., Saracco, G. M., Di Perri, G., & D’Avolio, A. (2022). Factors Influencing the Intracellular Concentrations of the Sofosbuvir Metabolite GS-331007 (in PBMCs) at 30 Days of Therapy. Pharmaceuticals, 15(3), 355. https://doi.org/10.3390/ph15030355