
Epilepsy-Induced High Affinity Blockade of the Cardiac Sodium Current INa by Lamotrigine; A Potential for Acquired Arrythmias
 and
and
Abstract
1. Introduction
2. Results
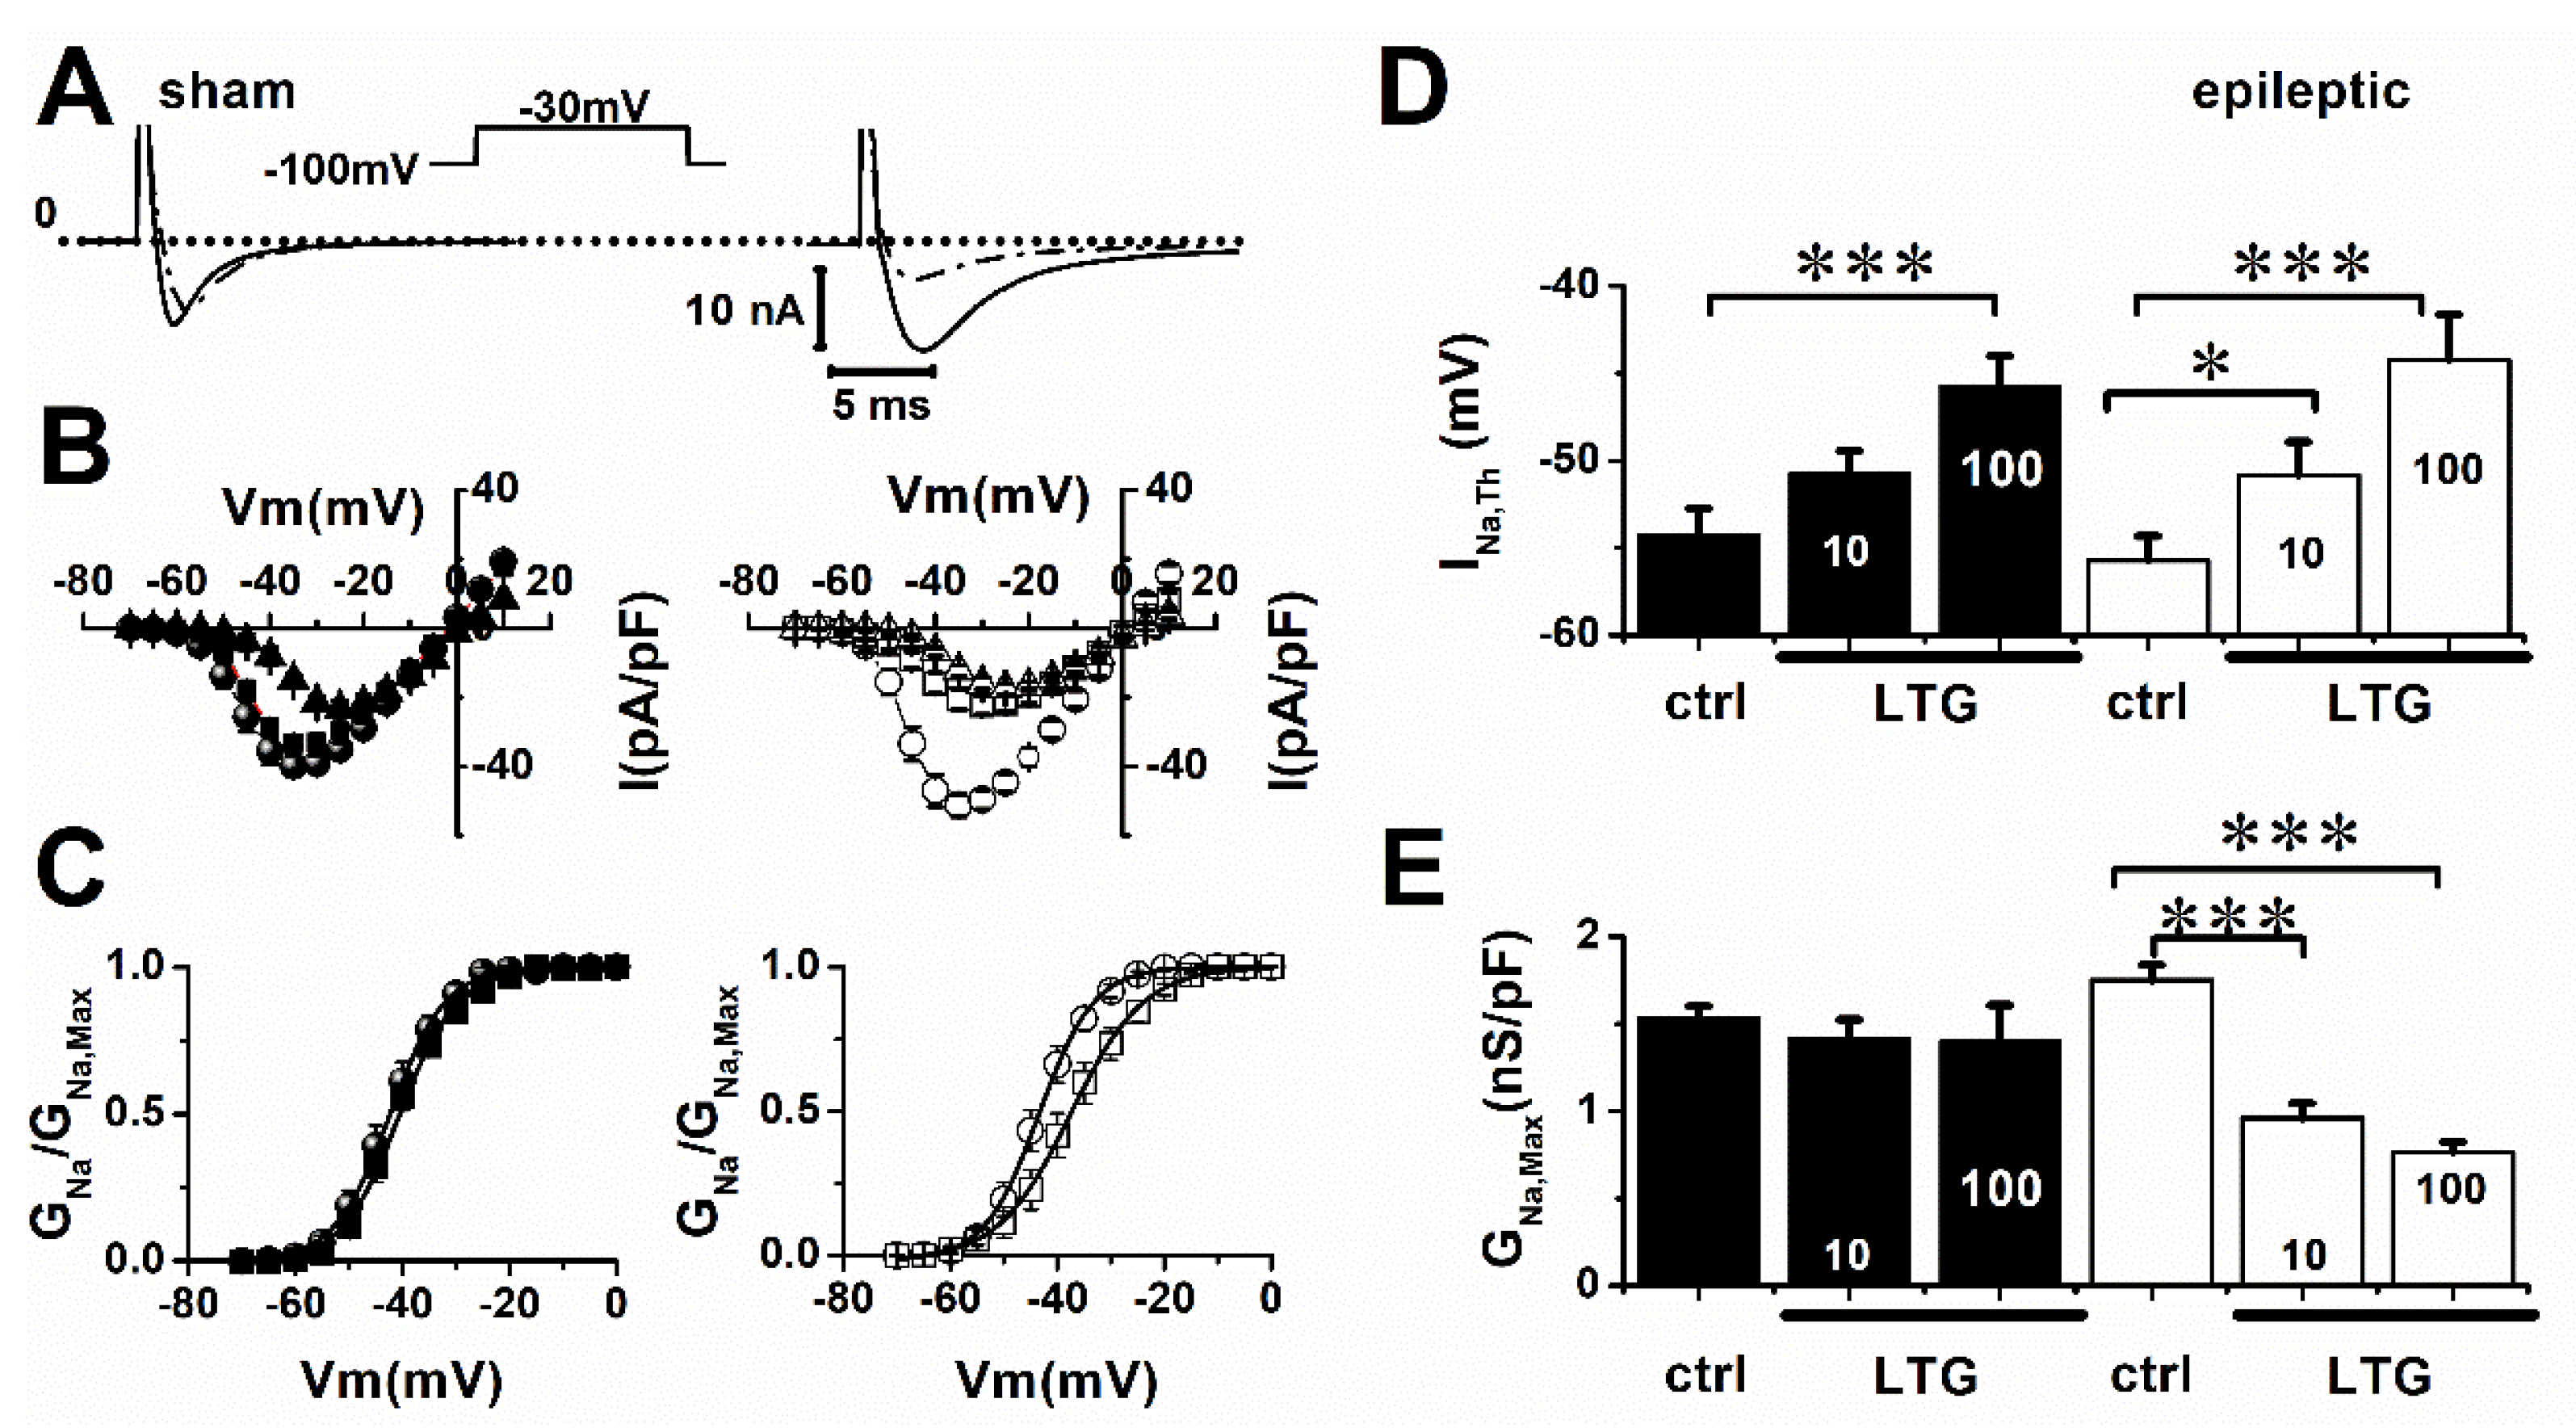
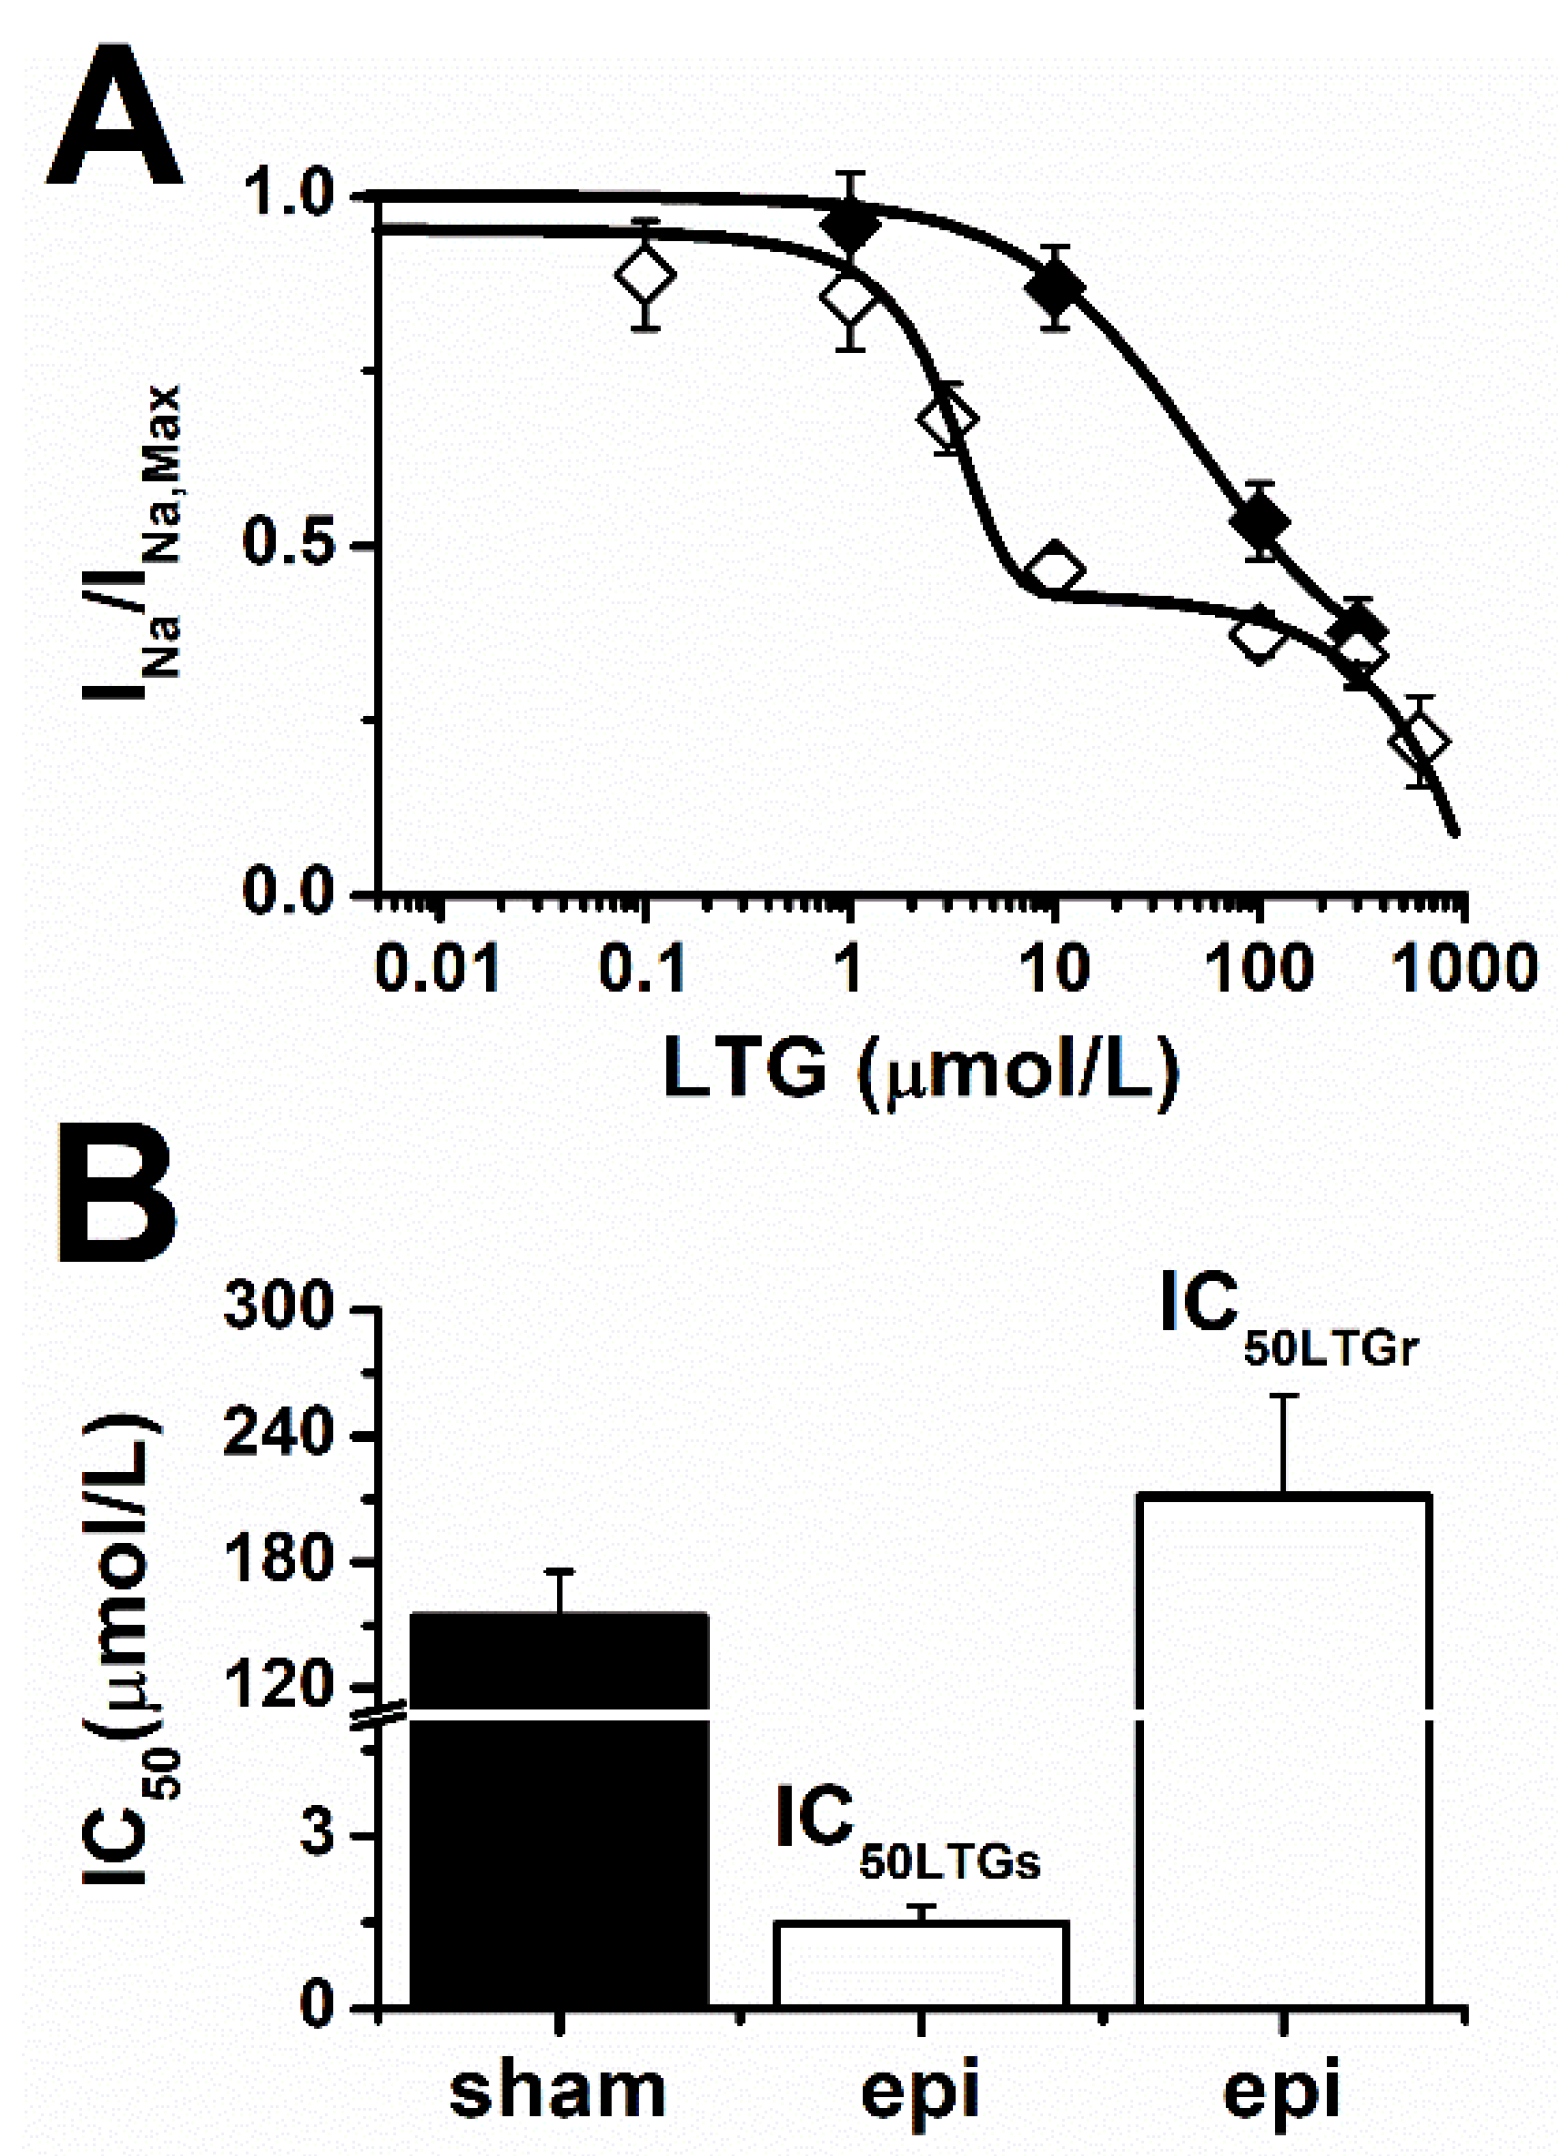
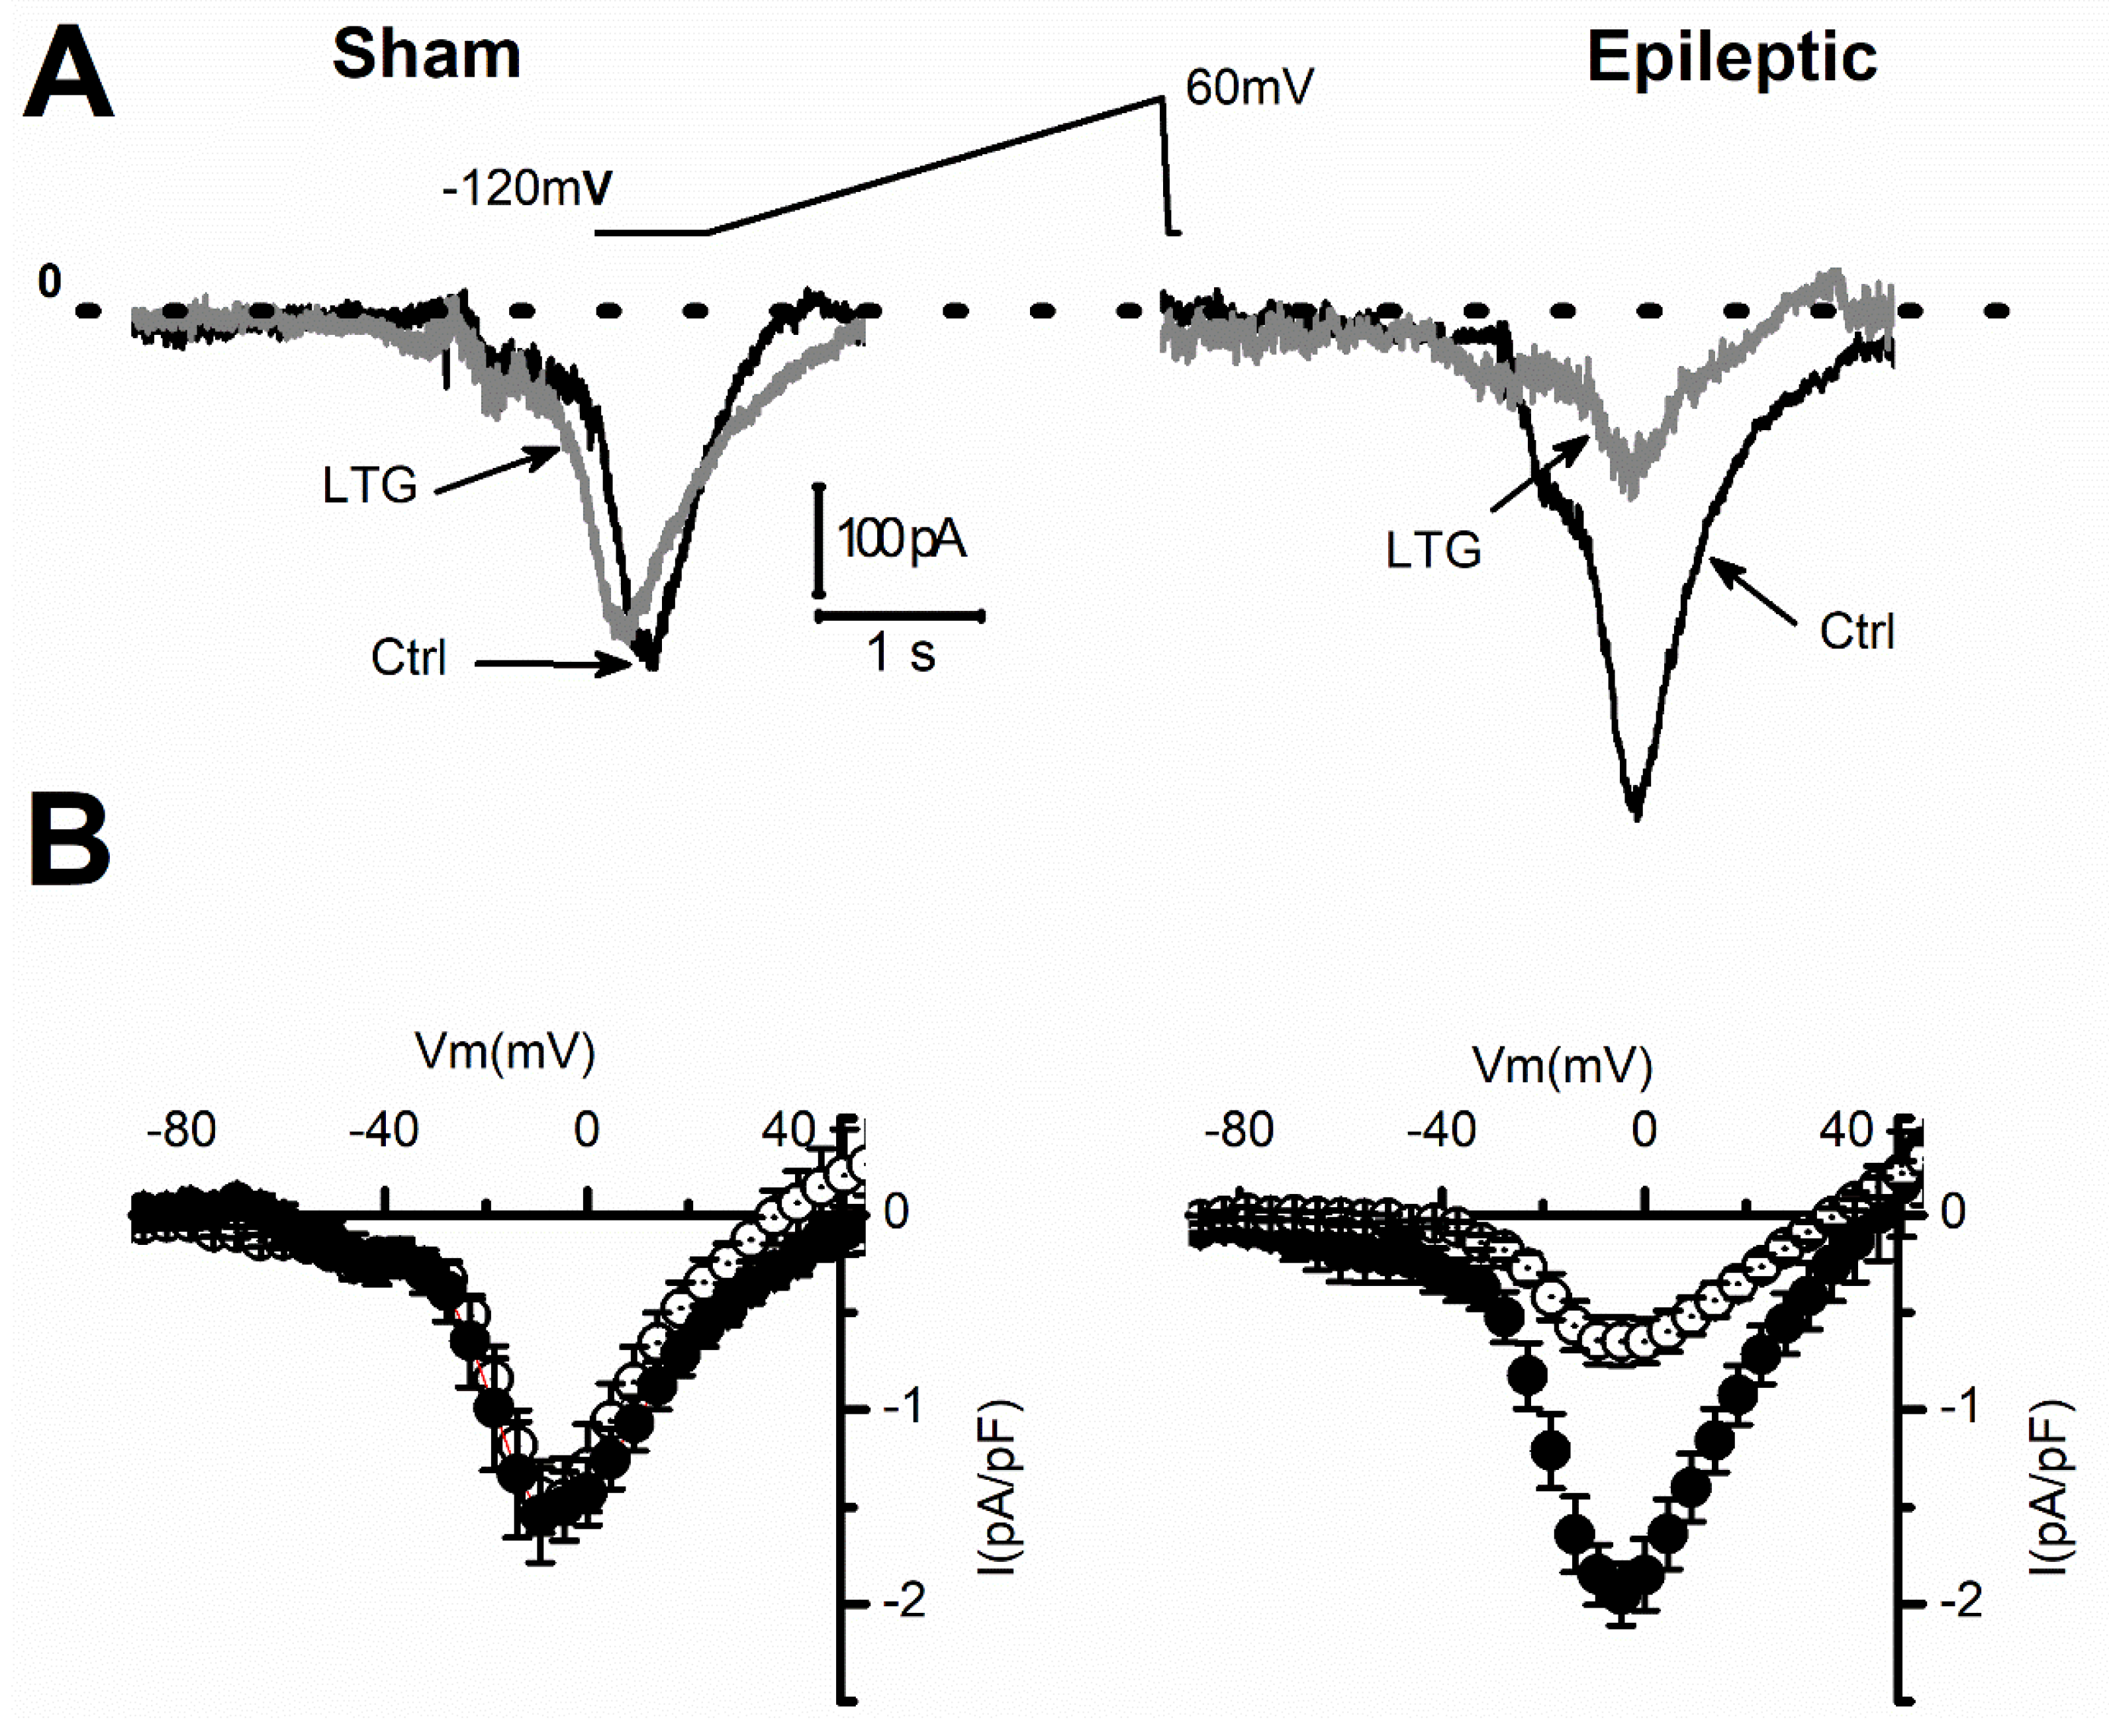
2.1. Lamotrigine Blockade of INa
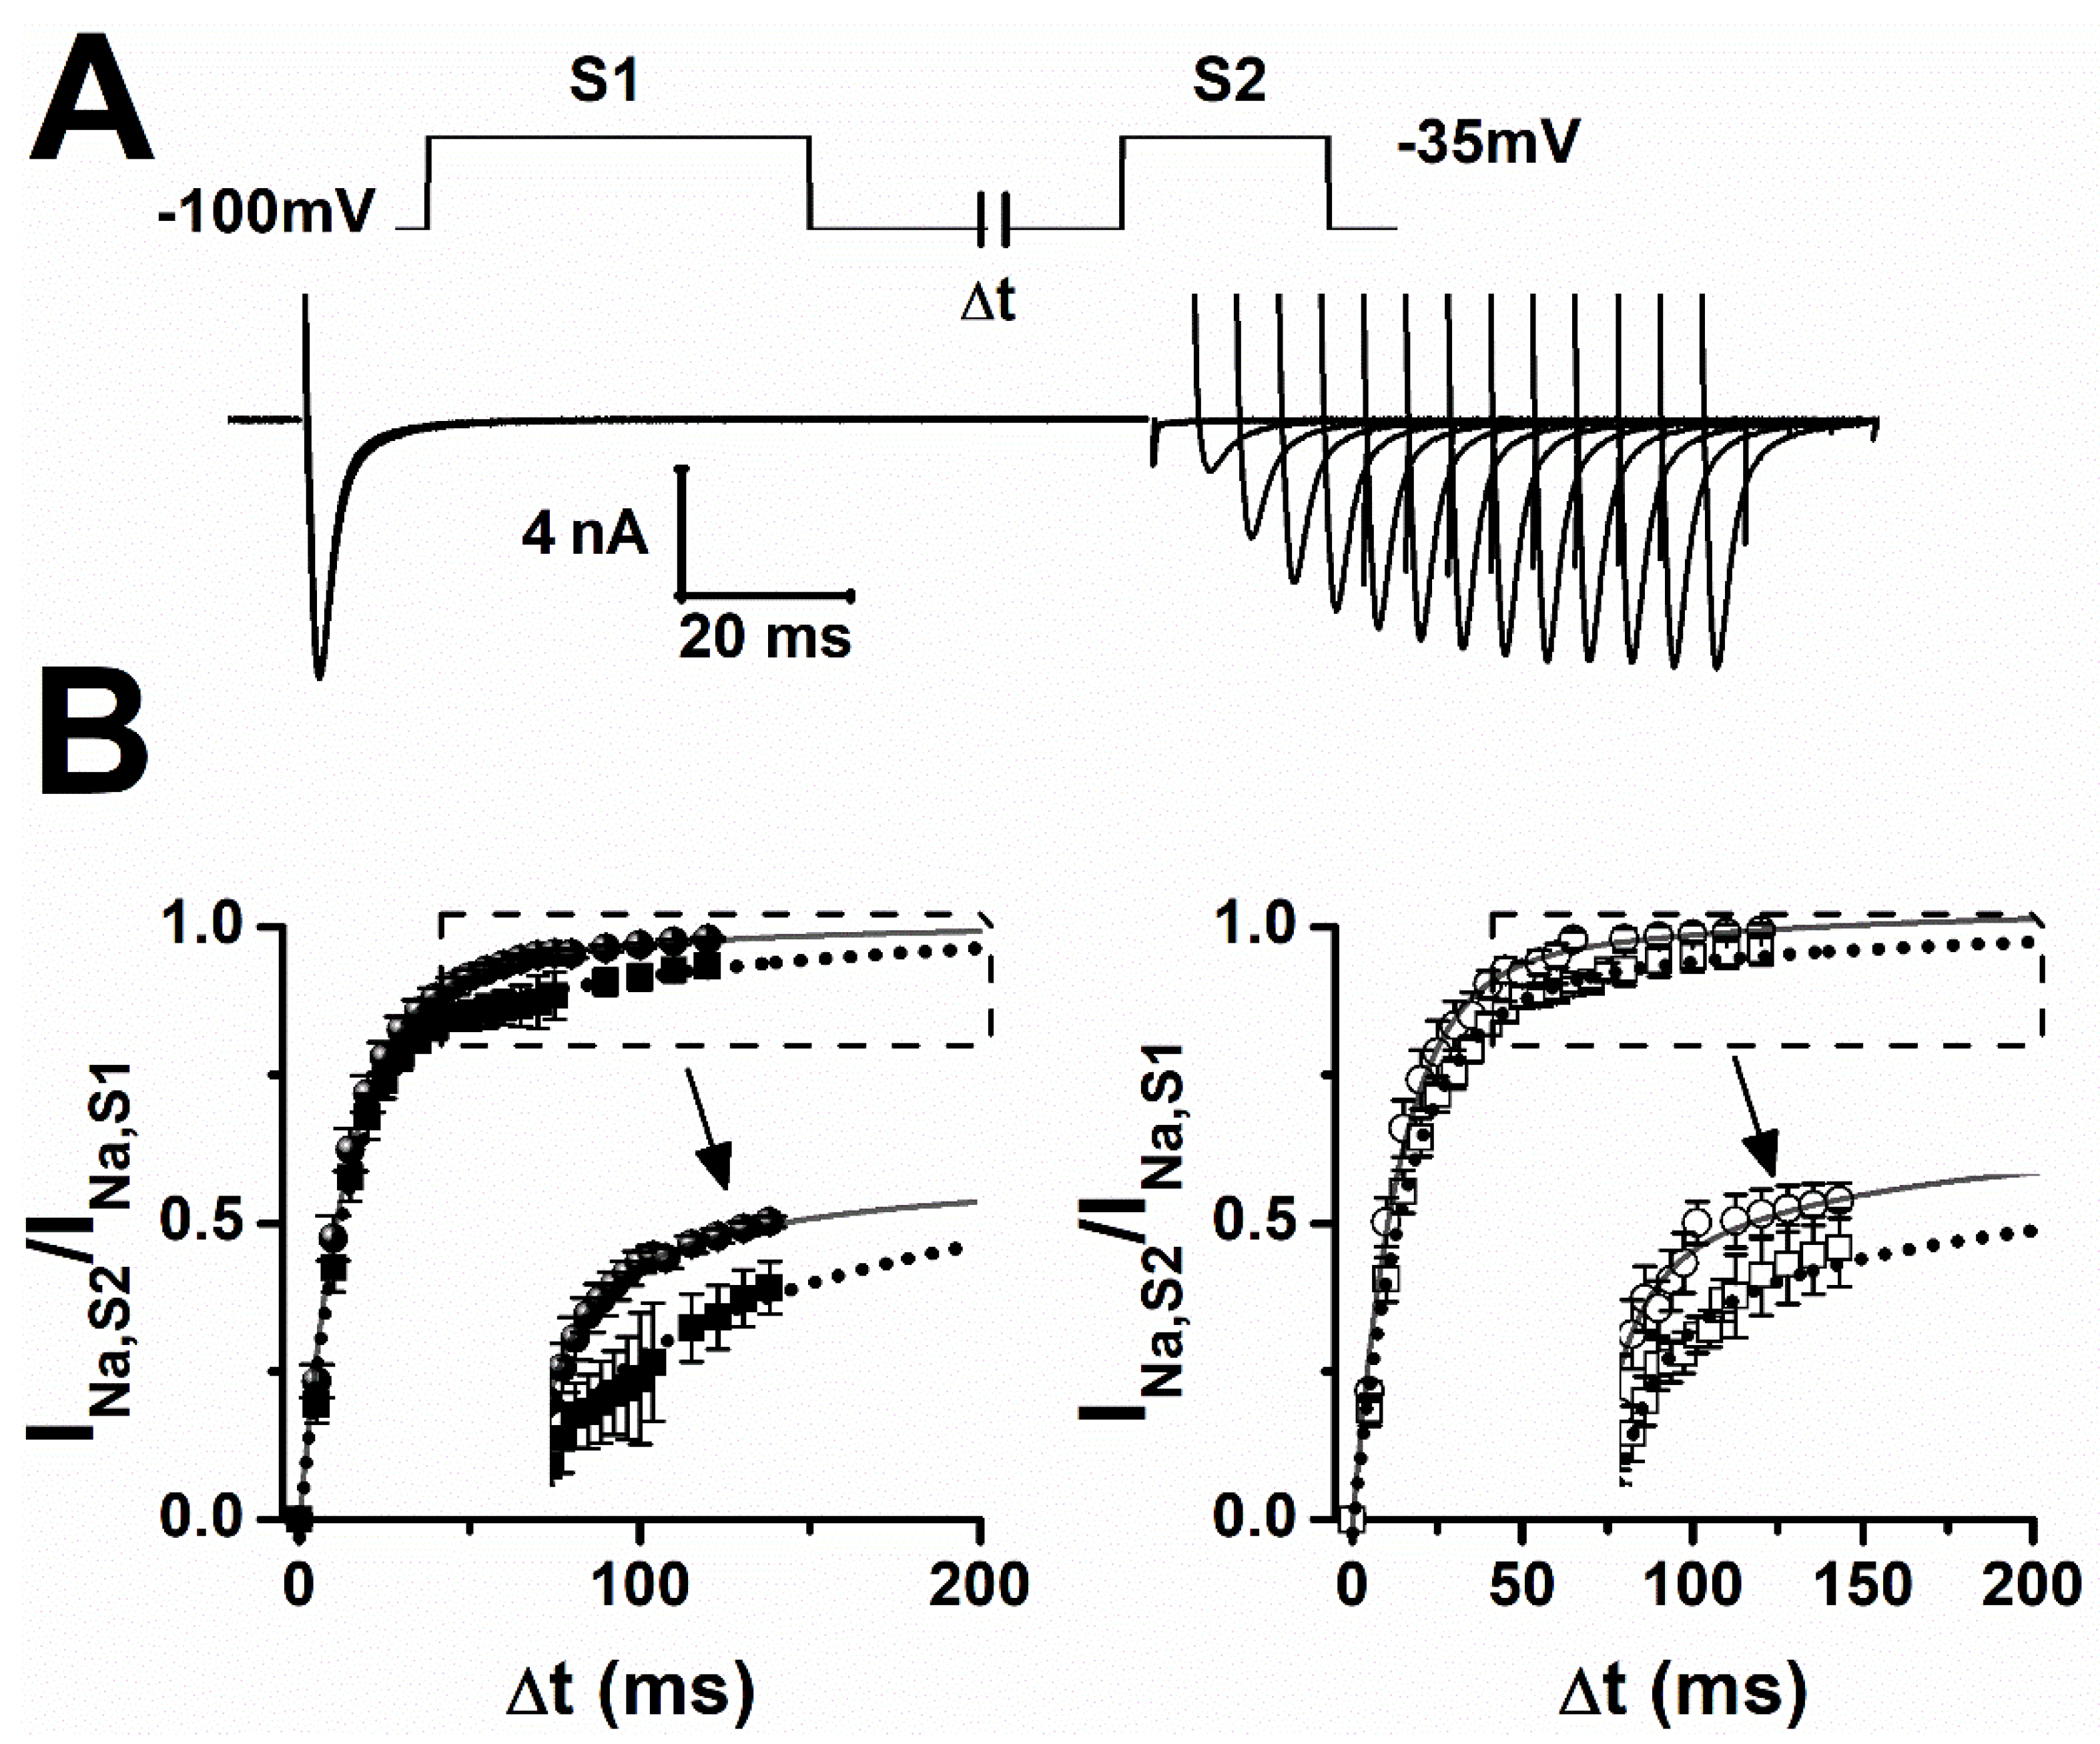
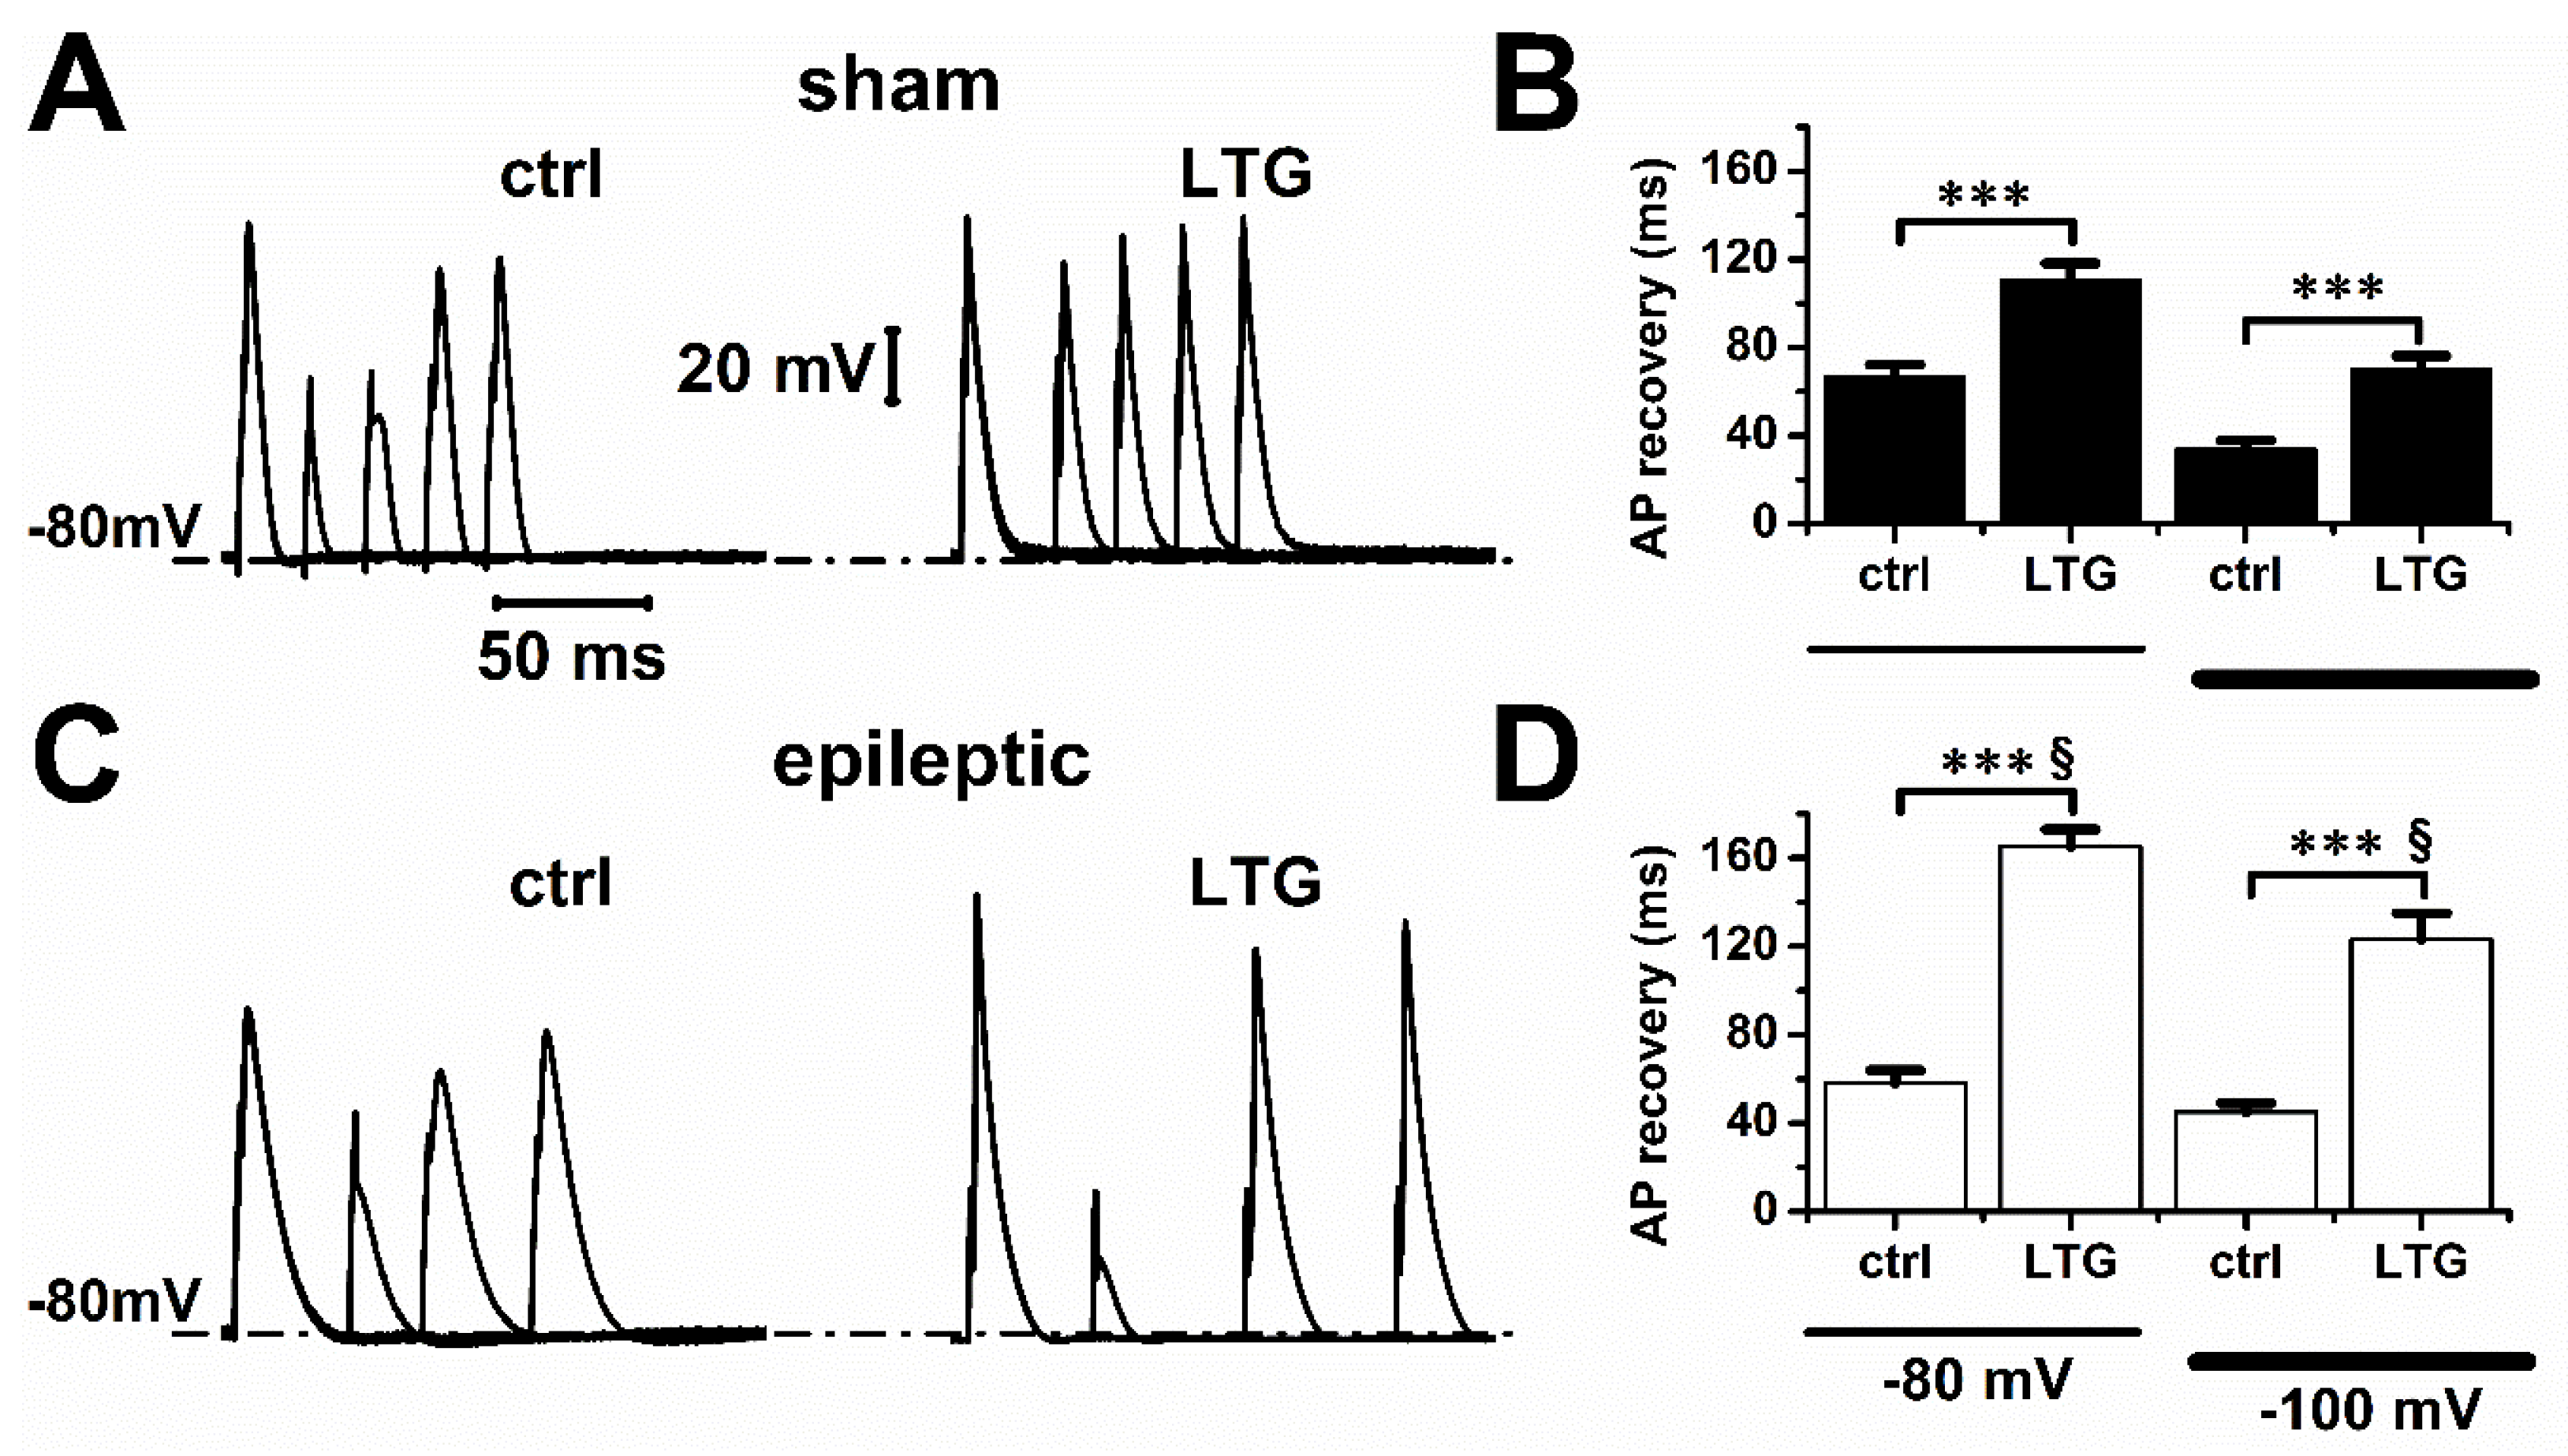
2.2. Lamotrigine Prolonged Refractory Period
3. Discussion
4. Methods
4.1. Animal Model and Cell Dissociation
4.2. Electrophysiology
4.3. Materials
4.4. Data Analysis
4.5. Statistics
Supplementary Materials
Author Contributions
Funding
Institutional Review Board Statement
Informed Consent Statement
Data Availability Statement
Conflicts of Interest
Abbreviations
| Meaning | Abbreviation |
| Lamotrigine | LTG |
| Voltage-gated sodium channels | VGSC |
| US Food and Drug Administration | FDA |
| Brugada syndrome | BrS |
| Cardiac sodium current | INa |
| Late sodium current | INaL |
| Electrocardiogram | ECG |
| Voltage-gated neuronal sodium channels | nNaVs |
| Animal Research: Reporting In-Vivo Experiments | ARRIVE |
| Kainic Acid | KA |
| Intraperitoneal | IP |
| Action Potential | AP |
| Dimethyl Sulfoxide | DMSO |
| Standard Error Mean | SEM |
| Analysis of Variance | ANOVA |
| Tetrodotoxin | TTX |
| Action Potential Duration | APD |
References
- Xie, X.; Lancaster, B.; Peakman, T.; Garthwaite, J. Interaction of the antiepileptic drug lamotrigine with recombinant rat brain type IIA Na+ channels and with native Na+ channels in rat hippocampal neurones. Pfluegers Arch. Eur. J. Physiol. 1995, 430, 437–446. [Google Scholar] [CrossRef] [PubMed]
- Kuo, C.C.; Lu, L. Characterization of lamotrigine inhibition of Na+ channels in rat hippocampal neurones. Br. J. Pharmacol. 1997, 121, 1231–1238. [Google Scholar] [CrossRef] [PubMed]
- Huang, C.-W.; Huang, C.-C.; Liu, Y.-C.; Wu, S.-N. Inhibitory Effect of Lamotrigine on A-type Potassium Current in Hippocampal Neuron-Derived H19-7 Cells. Epilepsia 2004, 45, 729–736. [Google Scholar] [CrossRef] [PubMed]
- Fleurat, M.; Smollin, C. Case Files of the University of California San Francisco Medical Toxicology Fellowship: Lamotrigine Toxicity. J. Med. Toxicol. 2012, 8, 52–58. [Google Scholar] [CrossRef] [PubMed][Green Version]
- Lang, D.G.; Wang, C.M.; Cooper, B.R. Lamotrigine, phenytoin and carbamazepine interactions on the sodium current present in N4TG1 mouse neuroblastoma cells. J. Pharmacol. Exp. Ther. 1993, 266, 829–835. [Google Scholar] [PubMed]
- Cronin, N.B.; O’Reilly, A.; Duclohier, H.; Wallace, B.A. Binding of the Anticonvulsant Drug Lamotrigine and the Neurotoxin Batrachotoxin to Voltage-gated Sodium Channels Induces Conformational Changes Associated with Block and Steady-state Activation. J. Biol. Chem. 2003, 278, 10675–10682. [Google Scholar] [CrossRef]
- Nakatani, Y.; Masuko, H.; Amano, T. The Effect of Lamotrigine on Nav1.4 Voltage-Gated Sodium Channels. J. Pharmacol. Sci. 2013, 123, 203–206. [Google Scholar] [CrossRef]
- Bendtsen, L.; Zakrzewska, J.M.; Abbott, J.; Braschinsky, M.; Di Stefano, G.; Donnet, A.; Eide, P.K.; Leal, P.R.L.; Maarbjerg, S.; May, A.; et al. European Academy of Neurology guideline on trigeminal neuralgia. Eur. J. Neurol. 2019, 26, 831–849. [Google Scholar] [CrossRef]
- Jansen, A.C.; Andermann, E. Progressive Myoclonus Epilepsy, Lafora Type. In GeneReviews®; Adam, M.P., Ardinger, H.H., Pagon, R.A., Wallace, S.E., Bean, L.J., Mirzaa, G., Amemiya, A., Eds.; University of Washington: Seattle, WA, USA, 1993. Available online: http://www.ncbi.nlm.nih.gov/books/NBK1389/ (accessed on 27 September 2021).
- Brigo, F.; Igwe, S.C.; Lattanzi, S. Ethosuximide, Sodium Valproate or Lamotrigine for Absence Seizures in Children and Adolescents. Cochrane Database Syst. Rev. 2021, CD003032. Available online: https://www.cochranelibrary.com/cdsr/doi/10.1002/14651858.CD003032.pub5/epdf/full (accessed on 27 September 2022).
- Strimel, W.J.; Woodruff, A.; Cheung, P.; Kirmani, B.F.; Stephen Huang, S.K. Brugada-like electrocardiographic pattern induced by lamotrigine toxicity. Clin. Neuropharmacol. 2010, 33, 265–267. [Google Scholar] [CrossRef]
- Rodrigues, R.; Amador, P.; Rassi, L.; Seixo, F.; Parreira, L.; Fonseca, N.; Soares, L. Padrão de Brugada em doente medicada com lamotrigina. Rev. Port. Cardiol. 2013, 32, 807–810. [Google Scholar] [CrossRef] [PubMed]
- Leong, K.M.W.; Seligman, H.; Varnava, A.M. Proarrhythmogenic effects of lamotrigine during ajmaline testing for Brugada syndrome. Heart Case Rep. 2017, 3, 167–171. [Google Scholar] [CrossRef] [PubMed][Green Version]
- Banfi, P.; Coll, M.; Oliva, A.; Alcalde, M.; Striano, P.; Mauri, M.; Princiotta, L.; Campuzano, O.; Versino, M.; Brugada, R. Lamotrigine induced Brugada-pattern in a patient with genetic epilepsy associated with a novel variant in SCN9A. Gene 2020, 754, 144847. [Google Scholar] [CrossRef] [PubMed]
- Herold, T.J.S. Lamotrigine as a possible cause of QRS prolongation in a patient with known seizure disorder. CJEM 2006, 8, 361–364. [Google Scholar] [CrossRef]
- Nogar, J.N.; Minns, A.B.; Savaser, D.J.; Ly, B.T. Severe sodium channel blockade and cardiovascular collapse due to a massive Lamotrigine overdose. Clin. Toxicol. 2011, 49, 854–857. [Google Scholar] [CrossRef]
- Lofton, A.L.; Klein-Schwartz, W. Evaluation of Lamotrigine Toxicity Reported to Poison Centers. Ann. Pharmacother. 2004, 38, 1811–1815. [Google Scholar] [CrossRef]
- Moore, P.W.; Donovan, J.W.; Burkhart, K.K.; Haggerty, D. A case series of patients with lamotrigine toxicity at one center from 2003 to 2012. Clin. Toxicol. 2013, 51, 545–549. [Google Scholar] [CrossRef]
- French, J.A.; Perucca, E.; Sander, J.W.; Bergfeldt, L.; Baulac, M.; Auerbach, D.S.; Keezer, M.; Thijs, R.D.; Devinsky, O.; Vossler, D.G.; et al. FDA safety warning on the cardiac effects of lamotrigine: An advisory from the Ad Hoc ILAE/AES Task Force. Epilepsia Open 2021, 6, 45–48. [Google Scholar] [CrossRef] [PubMed]
- Biet, M.; Morin, N.; Lessard-Beaudoin, M.; Graham, R.K.; Duss, S.; Gagne, J.; Sanon, N.T.; Carmant, L.; Dumaine, R. Prolongation of Action Potential Duration and QT Interval during Epilepsy Linked to Increased Contribution of Neuronal Sodium Channels to Cardiac Late Na+ Current: A Potential Mechanism for Sudden Death in Epilepsy. Circ. Arrhythm. Electrophysiol. 2015, 8, 912–920. [Google Scholar] [CrossRef]
- Biet, M.; Barajas-Martinez, H.; Ton, A.T.; Delabre, J.F.; Morin, N.; Dumaine, R. About half of the late sodium current in cardiac myocytes from dog ventricle is due to non-cardiac-type Na(+) channels. J. Mol. Cell Cardiol. 2012, 53, 593–598. [Google Scholar] [CrossRef]
- Catterall, W.A.; Perez-Reyes, E.; Snutch, T.P.; Striessnig, J. International Union of Pharmacology. XLVIII. Nomenclature and structure-function relationships of voltage-gated calcium channels. Pharmacol. Rev. 2005, 57, 411–425. [Google Scholar] [CrossRef] [PubMed]
- Kwong, K.; Carr, M.J. Voltage-gated sodium channels. Curr. Opin. Pharmacol. 2015, 22, 131–139. [Google Scholar] [CrossRef] [PubMed]
- Guo, F.; Xu, X.; Cai, J.; Hu, H.; Sun, W.; He, G.; Shao, D.; Wang, L.; Chen, T.; Shaw, C.; et al. The up-regulation of voltage-gated sodium channels subtypes coincides with an increased sodium current in hippocampal neuronal culture model. Neurochem. Int. 2013, 62, 287–295. [Google Scholar] [CrossRef] [PubMed]
- Guo, F.; Yu, N.; Cai, J.Q.; Quinn, T.; Zong, Z.H.; Zeng, Y.J.; Hao, L.Y. Voltage-gated sodium channel Nav1.1, Nav1.3 and beta1 subunit were up-regulated in the hippocampus of spontaneously epileptic rat. Brain Res. Bull. 2008, 75, 179–187. [Google Scholar] [CrossRef]
- Haufe, V.; Cordeiro, J.; Zimmer, T.; Wu, Y.; Schiccitano, S.; Benndorf, K.; Dumaine, R. Contribution of neuronal sodium channels to the cardiac fast sodium current is greater in dog heart Purkinje fibers than in ventricles. Cardiovasc Res. 2005, 65, 117–127. [Google Scholar] [CrossRef]
- Haufe, V.; Chamberland, C.; Dumaine, R. The promiscuous nature of the cardiac sodium current. J. Mol. Cell Cardiol. 2007, 42, 469–477. [Google Scholar] [CrossRef]
- Hille, B. Local anesthetics: Hydrophilic and hydrophobic pathways for the drug-receptor reaction. J. Gen. Physiol. 1977, 69, 497–515. [Google Scholar] [CrossRef]
- Qiao, X.; Sun, G.; Clare, J.J.; Werkman, T.R.; Wadman, W.J. Properties of human brain sodium channel α-subunits expressed in HEK293 cells and their modulation by carbamazepine, phenytoin and lamotrigine: Properties of brain Na channel α-subunits. Br. J. Pharmacol. 2014, 171, 1054–1067. [Google Scholar] [CrossRef]
- Tikhonov, D.B.; Zhorov, B.S. Mechanism of sodium channel block by local anesthetics, antiarrhythmics, and anticonvulsants. J. Gen. Physiol. 2017, 149, 465–481. [Google Scholar] [CrossRef]
- Liu, G.; Yarov-Yarovoy, V.; Nobbs, M.; Clare, J.J.; Scheuer, T.; Catterall, W.A. Differential interactions of lamotrigine and related drugs with transmembrane segment IVS6 of voltage-gated sodium channels. Neuropharmacology 2003, 44, 413–422. [Google Scholar] [CrossRef]
- Yarov-Yarovoy, V.; Brown, J.; Sharp, E.M.; Clare, J.J.; Scheuer, T.; Catterall, W.A. Molecular determinants of voltage-dependent gating and binding of pore-blocking drugs in transmembrane segment IIIS6 of the Na(+) channel alpha subunit. J. Biol. Chem. 2001, 276, 20–27. [Google Scholar] [CrossRef] [PubMed]
- Bean, B.P.; Cohen, C.J.; Tsien, R.W. Lidocaine block of cardiac sodium channels. J. Gen. Physiol. 1983, 81, 613–642. [Google Scholar] [CrossRef] [PubMed]
- Bean, B.P. The action potential in mammalian central neurons. Nat. Rev. Neurosci. 2007, 8, 451–465. [Google Scholar] [CrossRef]
- Antzelevitch, C.; Dumaine, R. Electrical heterogeneity in the heart: Physiological, pharmacological and clinical implications. In Handbook of Physiology. Section 2 the Cardiovascular System; Page, E., Fozzard, H.A., Solaro, R.J., Eds.; Oxford University Press: New York, NY, USA, 2001; pp. 654–692. Available online: http://www.comprehensivephysiology.com/WileyCDA/CompPhysArticle/refId-cp020117.html (accessed on 27 September 2021).
- Antzelevitch, C.; Brugada, P.; Brugada, J.; Brugada, R. The Brugada Syndrome: From Bench to Bedside; Blackwell Futura: Oxford, UK, 2005. [Google Scholar]
- Chavez, P.; Casso Dominguez, A.; Herzog, E. Evolving Electrocardiographic Changes in Lamotrigine Overdose: A Case Report and Literature Review. Cardiovasc Toxicol. 2015, 15, 394–398. [Google Scholar] [CrossRef] [PubMed]
- Wood, K.E.; Palmer, K.L.; Krasowski, M.D. Correlation of elevated lamotrigine and levetiracetam serum/plasma levels with toxicity: A long-term retrospective review at an academic medical center. Toxicol. Rep. 2021, 8, 1592–1598. [Google Scholar] [CrossRef] [PubMed]
- Alyahya, B.; Friesen, M.; Nauche, B.; Laliberté, M. Acute lamotrigine overdose: A systematic review of published adult and pediatric cases. Clin. Toxicol. 2018, 56, 81–89. [Google Scholar] [CrossRef]
- Hong, K.; Vatta, M.; Poungvarin, N.; Oliva, A.; Berruero, A.; Pinero, C.; Brugada, J.; Towbin, J.A.; Dumaine, R.; Brugada, P.; et al. SUDS and Brugada Syndrome Linked by the Same SCN5A Mutation. Circulation 2002, 106 (Suppl. 19), II-61. [Google Scholar]
- Abdelghani, M.S.; Chapra, A.; Asaad, N.; Hayat, S.A. Epilepsy and Brugada Syndrome: Association or Uncommon Presentation? Heart Views Off. J. Gulf. Heart Assoc. 2020, 21, 114–117. [Google Scholar] [CrossRef]
- Racine, R.J.; Gartner, J.G.; McIntyre Burnham, W. Epileptiform activity and neural plasticity in limbic structures. Brain Res. 1972, 47, 262–268. [Google Scholar] [CrossRef]
- Barajas-Martinez, H.; Haufe, V.; Chamberland, C.; Roy, M.J.; Fecteau, M.H.; Cordeiro, J.M.; Dumaine, R. Larger dispersion of INa in female dog ventricle as a mechanism for gender-specific incidence of cardiac arrhythmias. Cardiovasc. Res. 2009, 81, 82–89. [Google Scholar] [CrossRef]


| Sham | V0.5 (mV) | Slope |
|---|---|---|
| ctrl | −42 ± 1 | 4.5 ± 0.2 |
| LTG | −41 ± 1 | 5 ± 0.2 |
| epileptic | ||
| ctrl | −43 ± 1 | 4 ± 0.3 |
| LTG | −38 ± 2 * | 5.3 ± 0.2 * |
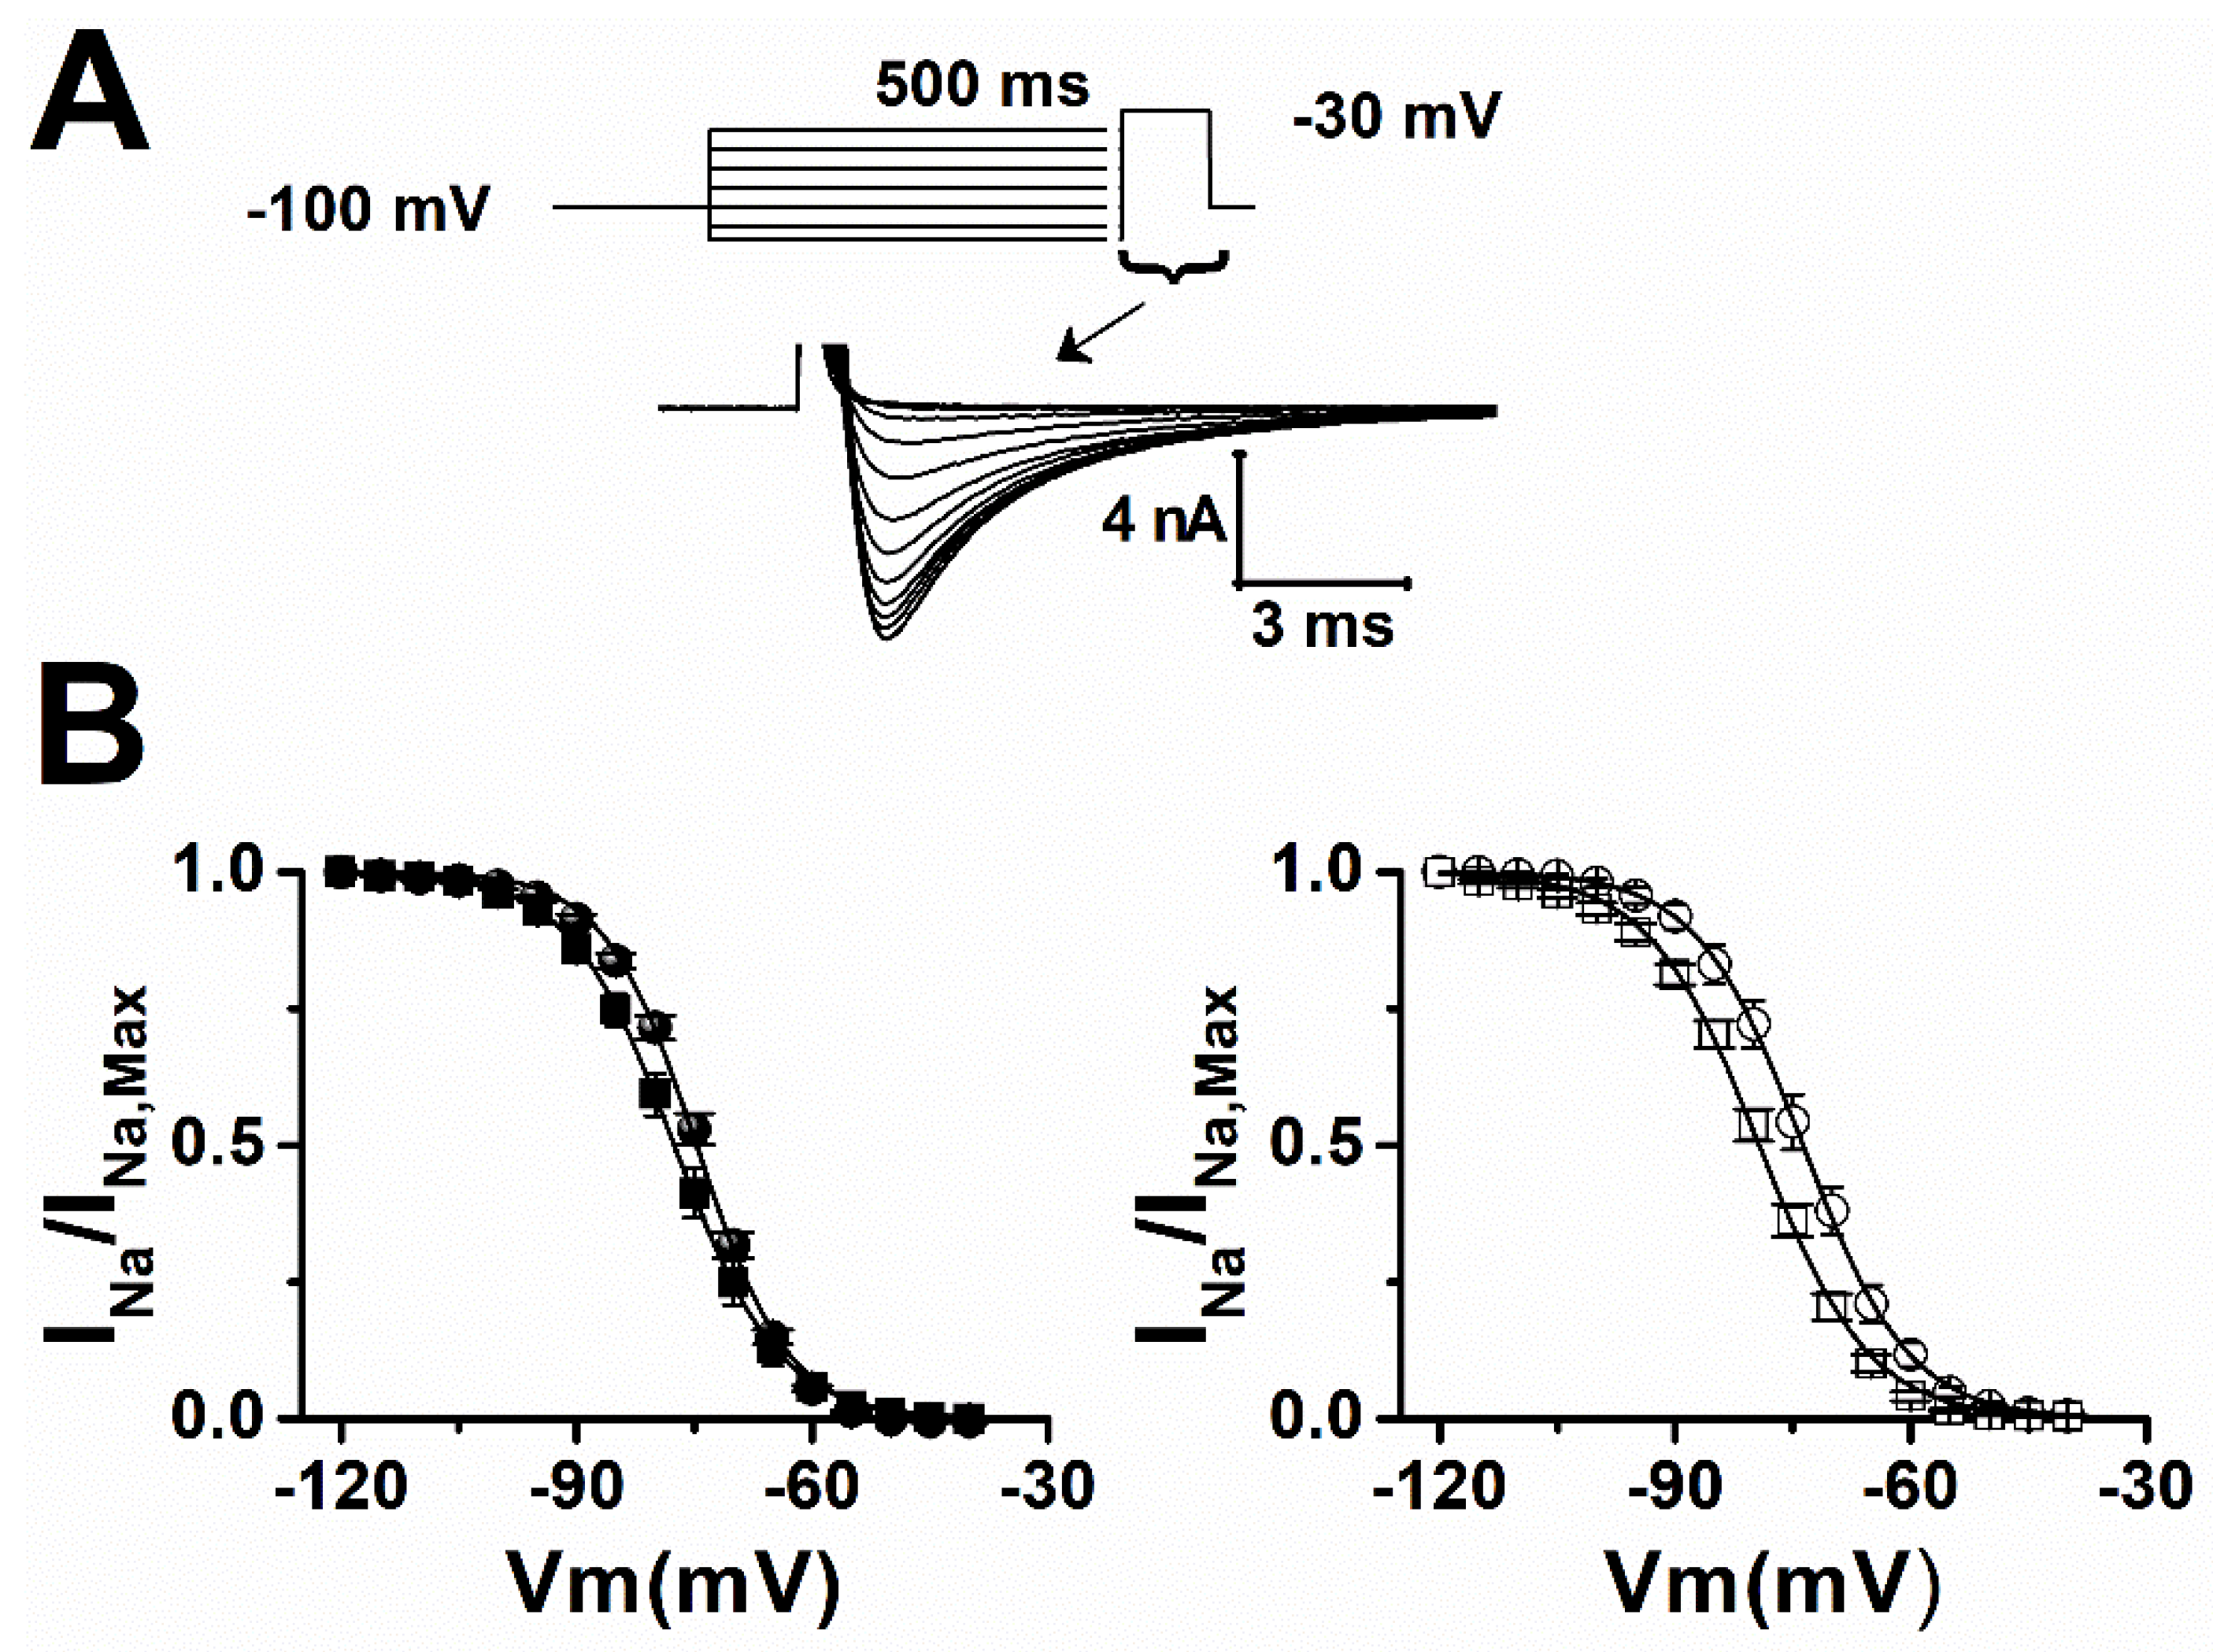
| Sham | Vh (mV) | Slope |
|---|---|---|
| ctrl | −74.5 ± 0.6 | 5.9 ± 0.2 |
| LTG | −77.2 ± 1.2 * | 6.5 ± 0.2 * |
| epileptic | ||
| ctrl | −73.3 ± 1.4 | 6.5 ± 0.3 |
| LTG | −80 ± 1 ** | 7 ± 0.2 |
| Sham | f (ms) | If (%) | s (ms) | Is (%) |
|---|---|---|---|---|
| ctrl | 15 ± 2 | 92 ± 1 | 80 ± 2 | 9 ± 1 |
| LTG | 14 ± 1 | 80 ± 4 ** | 127 ± 3 *** | 20 ± 1 ** |
| epileptic | ||||
| ctrl | 11 ± 1 | 87 ± 4 | 97 ± 8 § | 13 ± 4 § |
| LTG | 17 ± 2 * | 88 ± 1 § | 130 ± 2 *** | 12 ± 1 § |
Publisher’s Note: MDPI stays neutral with regard to jurisdictional claims in published maps and institutional affiliations. |
© 2022 by the authors. Licensee MDPI, Basel, Switzerland. This article is an open access article distributed under the terms and conditions of the Creative Commons Attribution (CC BY) license (https://creativecommons.org/licenses/by/4.0/).
Share and Cite
Contreras Vite, J.A.; Vega Valle, C.; Biekeu Mbem, H.; Boivin, S.-M.; Dumaine, R. Epilepsy-Induced High Affinity Blockade of the Cardiac Sodium Current INa by Lamotrigine; A Potential for Acquired Arrythmias. Pharmaceuticals 2022, 15, 1208. https://doi.org/10.3390/ph15101208
Contreras Vite JA, Vega Valle C, Biekeu Mbem H, Boivin S-M, Dumaine R. Epilepsy-Induced High Affinity Blockade of the Cardiac Sodium Current INa by Lamotrigine; A Potential for Acquired Arrythmias. Pharmaceuticals. 2022; 15(10):1208. https://doi.org/10.3390/ph15101208
Chicago/Turabian StyleContreras Vite, Juan Antonio, Carlos Vega Valle, Happi Biekeu Mbem, Sarah-Maude Boivin, and Robert Dumaine. 2022. "Epilepsy-Induced High Affinity Blockade of the Cardiac Sodium Current INa by Lamotrigine; A Potential for Acquired Arrythmias" Pharmaceuticals 15, no. 10: 1208. https://doi.org/10.3390/ph15101208
APA StyleContreras Vite, J. A., Vega Valle, C., Biekeu Mbem, H., Boivin, S.-M., & Dumaine, R. (2022). Epilepsy-Induced High Affinity Blockade of the Cardiac Sodium Current INa by Lamotrigine; A Potential for Acquired Arrythmias. Pharmaceuticals, 15(10), 1208. https://doi.org/10.3390/ph15101208