Article

Potential and Limits of Kidney Cells for Evaluation of Renal Excretion

1
Institute of Pharmacy and Molecular Biotechnology, Ruprecht-Karls-University, 69120 Heidelberg, Germany
2
Bayer Pharma AG, Research Pharmacokinetics, 13353 Berlin, Germany
*
Author to whom correspondence should be addressed.
Pharmaceuticals 2021, 14(9), 908; https://doi.org/10.3390/ph14090908
Submission received: 25 April 2021 / Revised: 27 August 2021 / Accepted: 31 August 2021 / Published: 7 September 2021

Abstract

:
A large number of therapeutic drugs, herbal components and their metabolites are excreted by the kidneys. Therefore, generally applied models for estimating renal excretion, including freshly isolated rat proximal tubule cells, cultured tubule cells and immortalized kidney cell lines MDCKII, NRK-52E, IHKE-1 and Caki-1, were investigated regarding their predictive potential for active renal transport. Cultured proximal tubule cells showed an epithelial cell-like morphology and formed tight monolayers. However, mRNA expression analyses and immunohistochemical studies revealed patterns of tight junction proteins that were notably different from freshly isolated cells and distinct from those in vivo. High levels of mannitol permeation were found in NRK-52E, IHKE-1 and Caki-1 cells, suggesting that they are not suitable for bidirectional transport studies. Cultured cells and freshly isolated cells also differed in proximal tubule markers and transport proteins, indicating that cultured primary cells were in a state of dedifferentiation. Cell lines MDCKII, NRK-52E, IHKE-1 and Caki-1 did not accurately reflect the characteristics of proximal tubules. The expression patterns of marker and transport proteins differed from freshly isolated primary cells. In summary, each of these models has profound disadvantages to consider when adopting them reliable models for the in vivo situation. Thus, they should not be used alone but only in combination.

1. Introduction

In general, pharmacological activity occurs when the active agents or the active metabolites reach and sustain sufficiently high levels at their site of action. Since a large percentage of therapeutic drugs, herbal components and their metabolites is excreted by the kidneys, a full understanding of the excretion process is necessary for better evaluating the target site concentration and therapeutic response. Thereby, besides glomerular filtration, active secretion from peritubular capillaries across proximal tubular cells into the tubular lumen is of great importance. Proximal tubular cells are characterized by the expression of specific marker genes encoding, e.g., villin 1 (VIL1), γ-glutamyl transferase 1, alanine aminopeptidase and alkaline phosphatase liver/bone/kidney [1,2,3]. The typical barrier function of the proximal tubule epithelium is determined by the formation of adherens junctions and zonulae occludens or tight junctions. These are multiprotein complexes, including occludin (OCLN) and members of the claudin (CLDN) family, mainly claudin-2, claudin-7 and claudin-10 [4,5,6]. An associated protein is tight junction protein 1 (TJP1), also known as ZO-1, connecting the tight junctions with the actin cytoskeleton of the cell [7].
In addition, proximal tubule cells express a variety of transport systems mediating the active uptake and excretion of organic cations and anions (Figure 1) across the basolateral and apical membranes. Uptake transporters belong to the superfamily of solute carrier transporters (SLC) mediating facilitated transport along an electrochemical gradient or a secondary active transport against a gradient. The efflux transporters are mainly members of the ABC transporter superfamily.
Important transporters for the basolateral uptake of organic cations include organic cation transporters (OCTs) belonging to the SLC22 subfamily. In humans, OCT2 (SLC22A2) plays an important role in the excretion of cationic drugs; in rats, Oct1 (Slc22a1) is also important. The basolateral uptake of organic anionic drugs is mediated by organic anion transporters (OATs), OAT1 (SLC22A6) and OAT3 (SLC22A8) from the SLC22 subfamily, and organic anion transporting polypeptide (OATP), OATP4C1 (SLCO4C1). OAT2 (SLC22A7), which is also expressed in the apical membrane, appears to be of minor importance for the uptake of anionic drugs [8]. In the proximal tubule cells of rats, Oatp1a1 (Slco1a1) is also involved in anion uptake [9,10].
Efflux across the apical membrane is primarily mediated by primary active ATP-binding cassette (ABC) transporters. In humans, p-glycoprotein (MDR1, ABCB1), breast cancer resistance protein (BCRP, ABCG2) and multidrug resistance-related proteins (MRPs) MRP2 (ABCC2) and MRP4 (ABCC4) are of particular importance. In addition, multidrug and toxin extrusion (MATE) transporters MATE1 (SLC47A1) and MATE2-K (SLC47A2) of the SLC47 subfamily play a role in the extrusion of cationic drugs [11]. Reabsorption in the tubular membrane is mediated by the organic cation transporter/novel (OCTN) transporters OCTN1 (SLC22A4) and OCTN2 (SLC22A5), urate transporter (URAT) URAT1 (SLC22A12), the peptide transporters (PEPT) PEPT1 (SLC15A1) and PEPT2 (SLC15A2) and human OAT4 (SLC22A9), as well as the rat-specific Oatp1a3 (Slco1a3).
For investigation of such transport processes, several cell-based in vitro models are available, which allow high throughput at relatively low costs [12]. In order to study the function of distinct proteins, very often, cells overexpressing a single, two or even more transporters are used. Popular host cells are Madin-Darby canine kidney (MDCK), human embryonic kidney 293 (HEK293) or Chinese hamster ovary (CHO) cells. A potential drawback of such overexpression systems is the presence of endogenous transporters with similar substrate specificity or alterations in the expression patterns after transfection [13,14,15]. In addition, many compounds are transported by different transporters in parallel, making an in vitro/in vivo comparison difficult.
Therefore, the aim of the present work was an investigation of several renal cell-based in vitro systems with respect to their suitability to study renal drug transport (Table 1). The focus of this effort was on the comparison of different cell lines as well as primary rat proximal tubule cells (PRPTCs) with respect to monolayer formation, expression of marker proteins, tight junction proteins and transport proteins.

2. Results

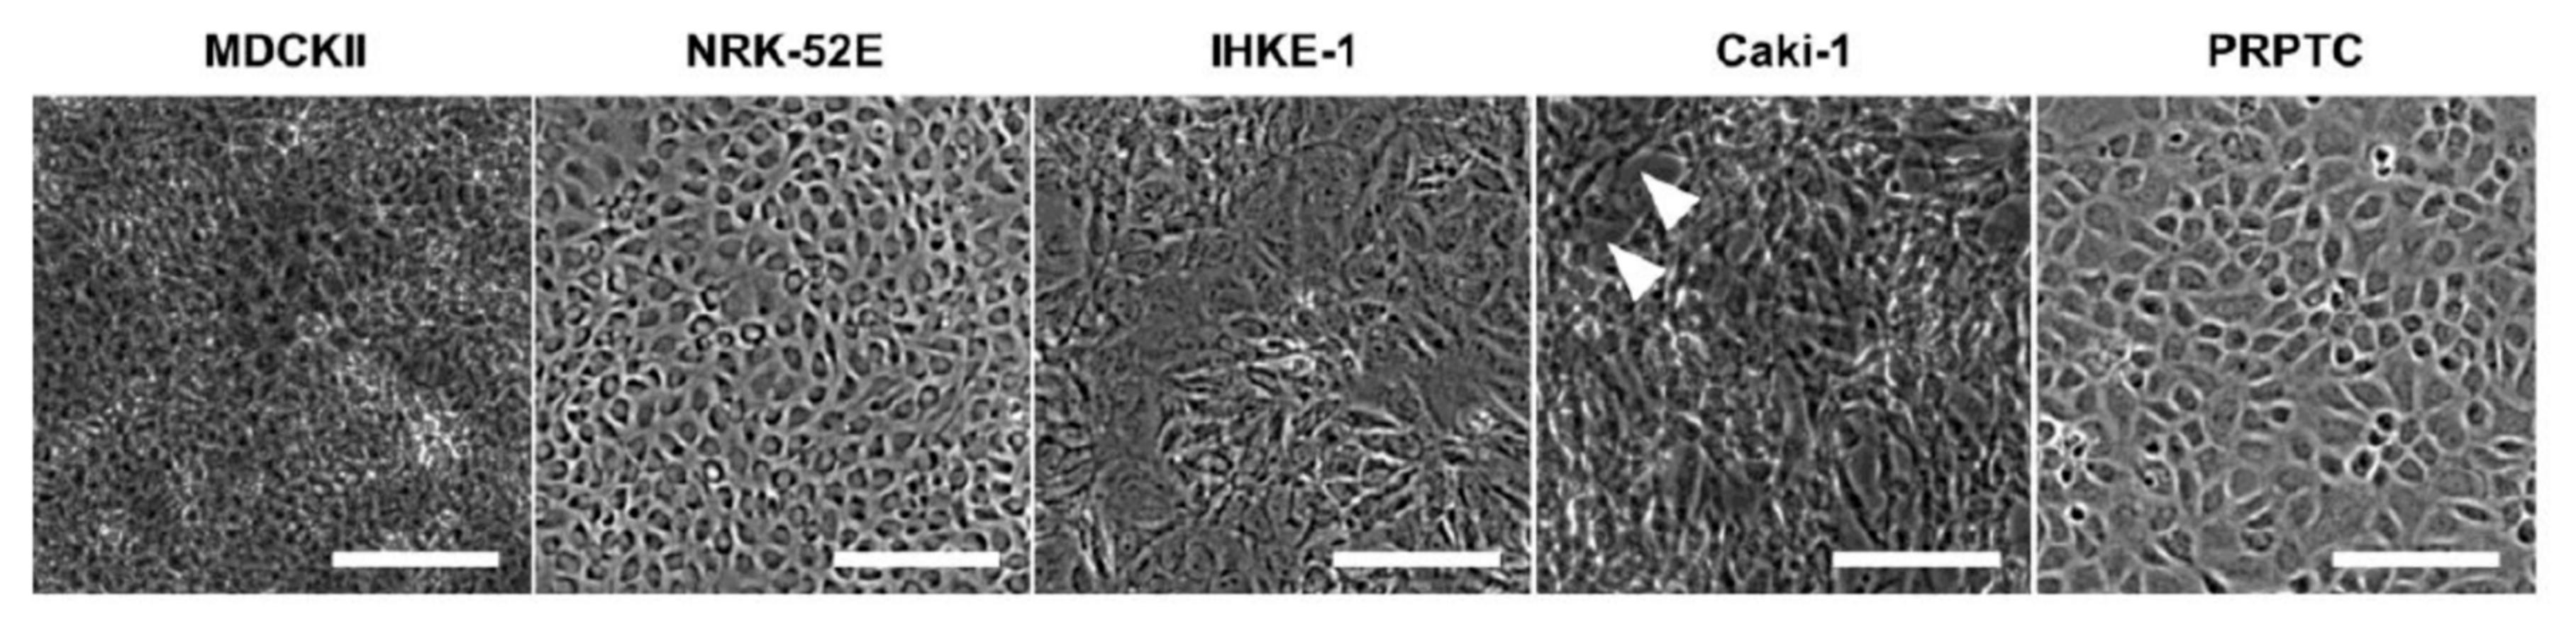
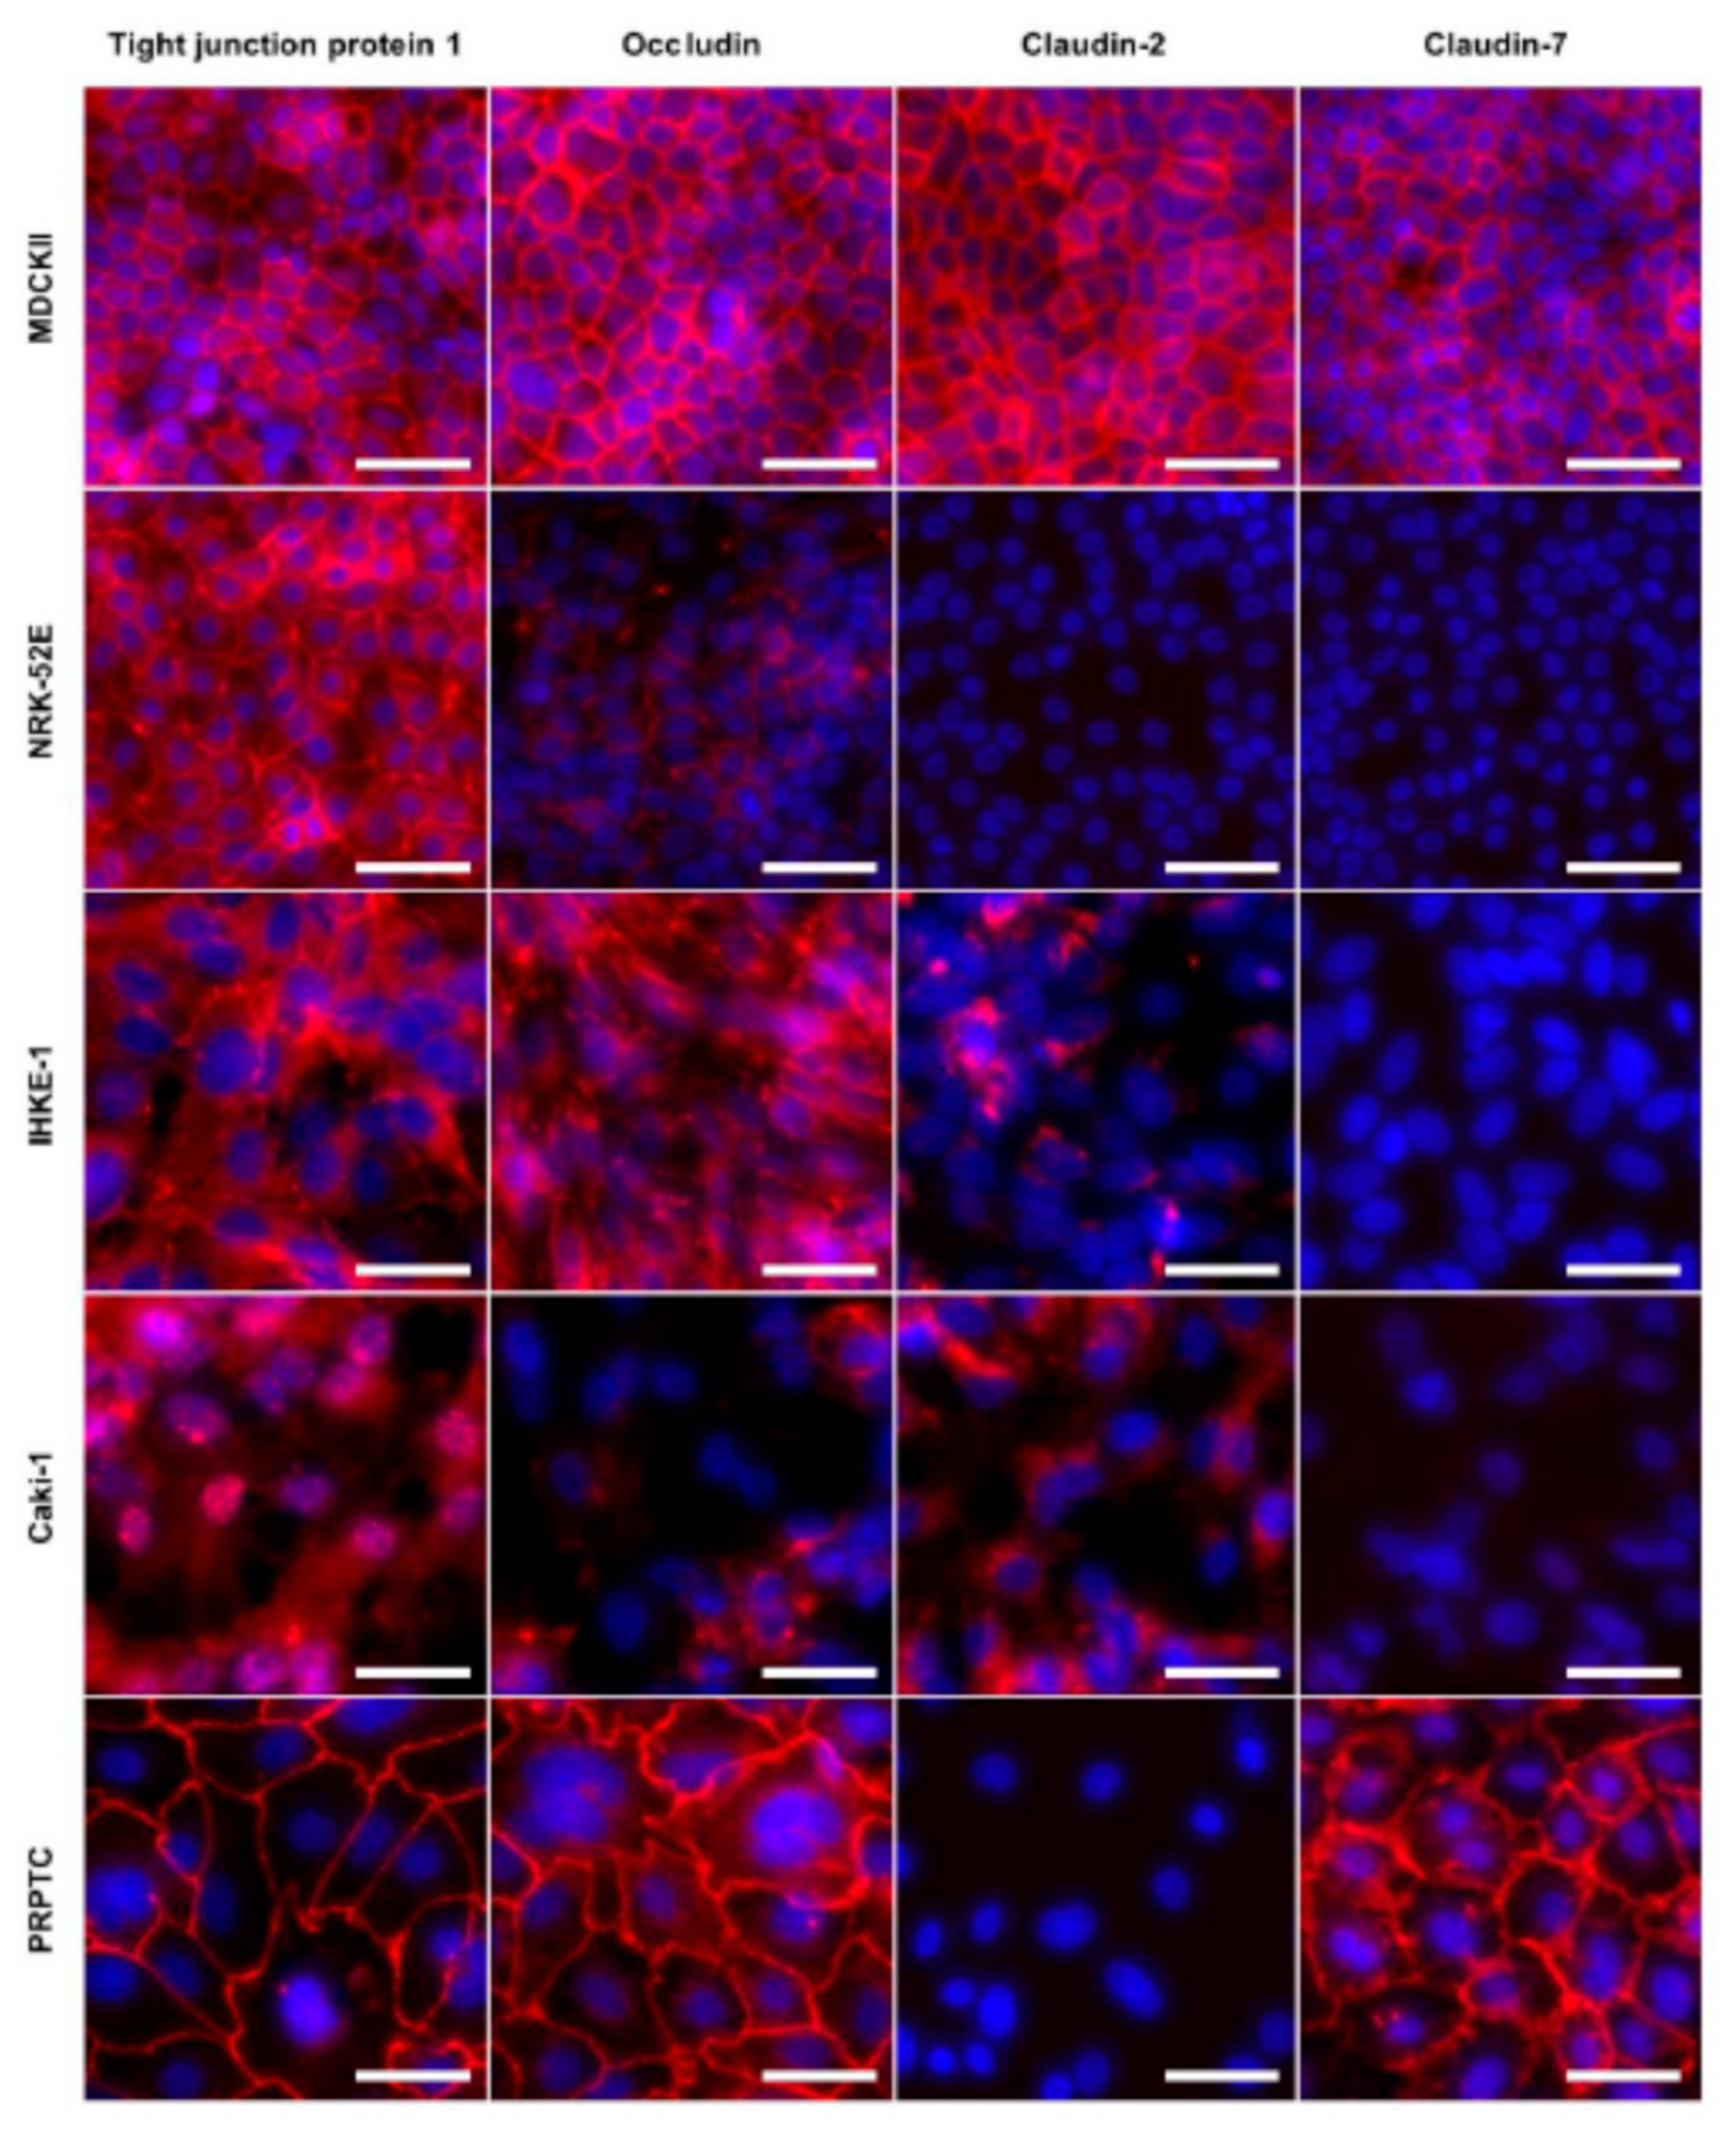
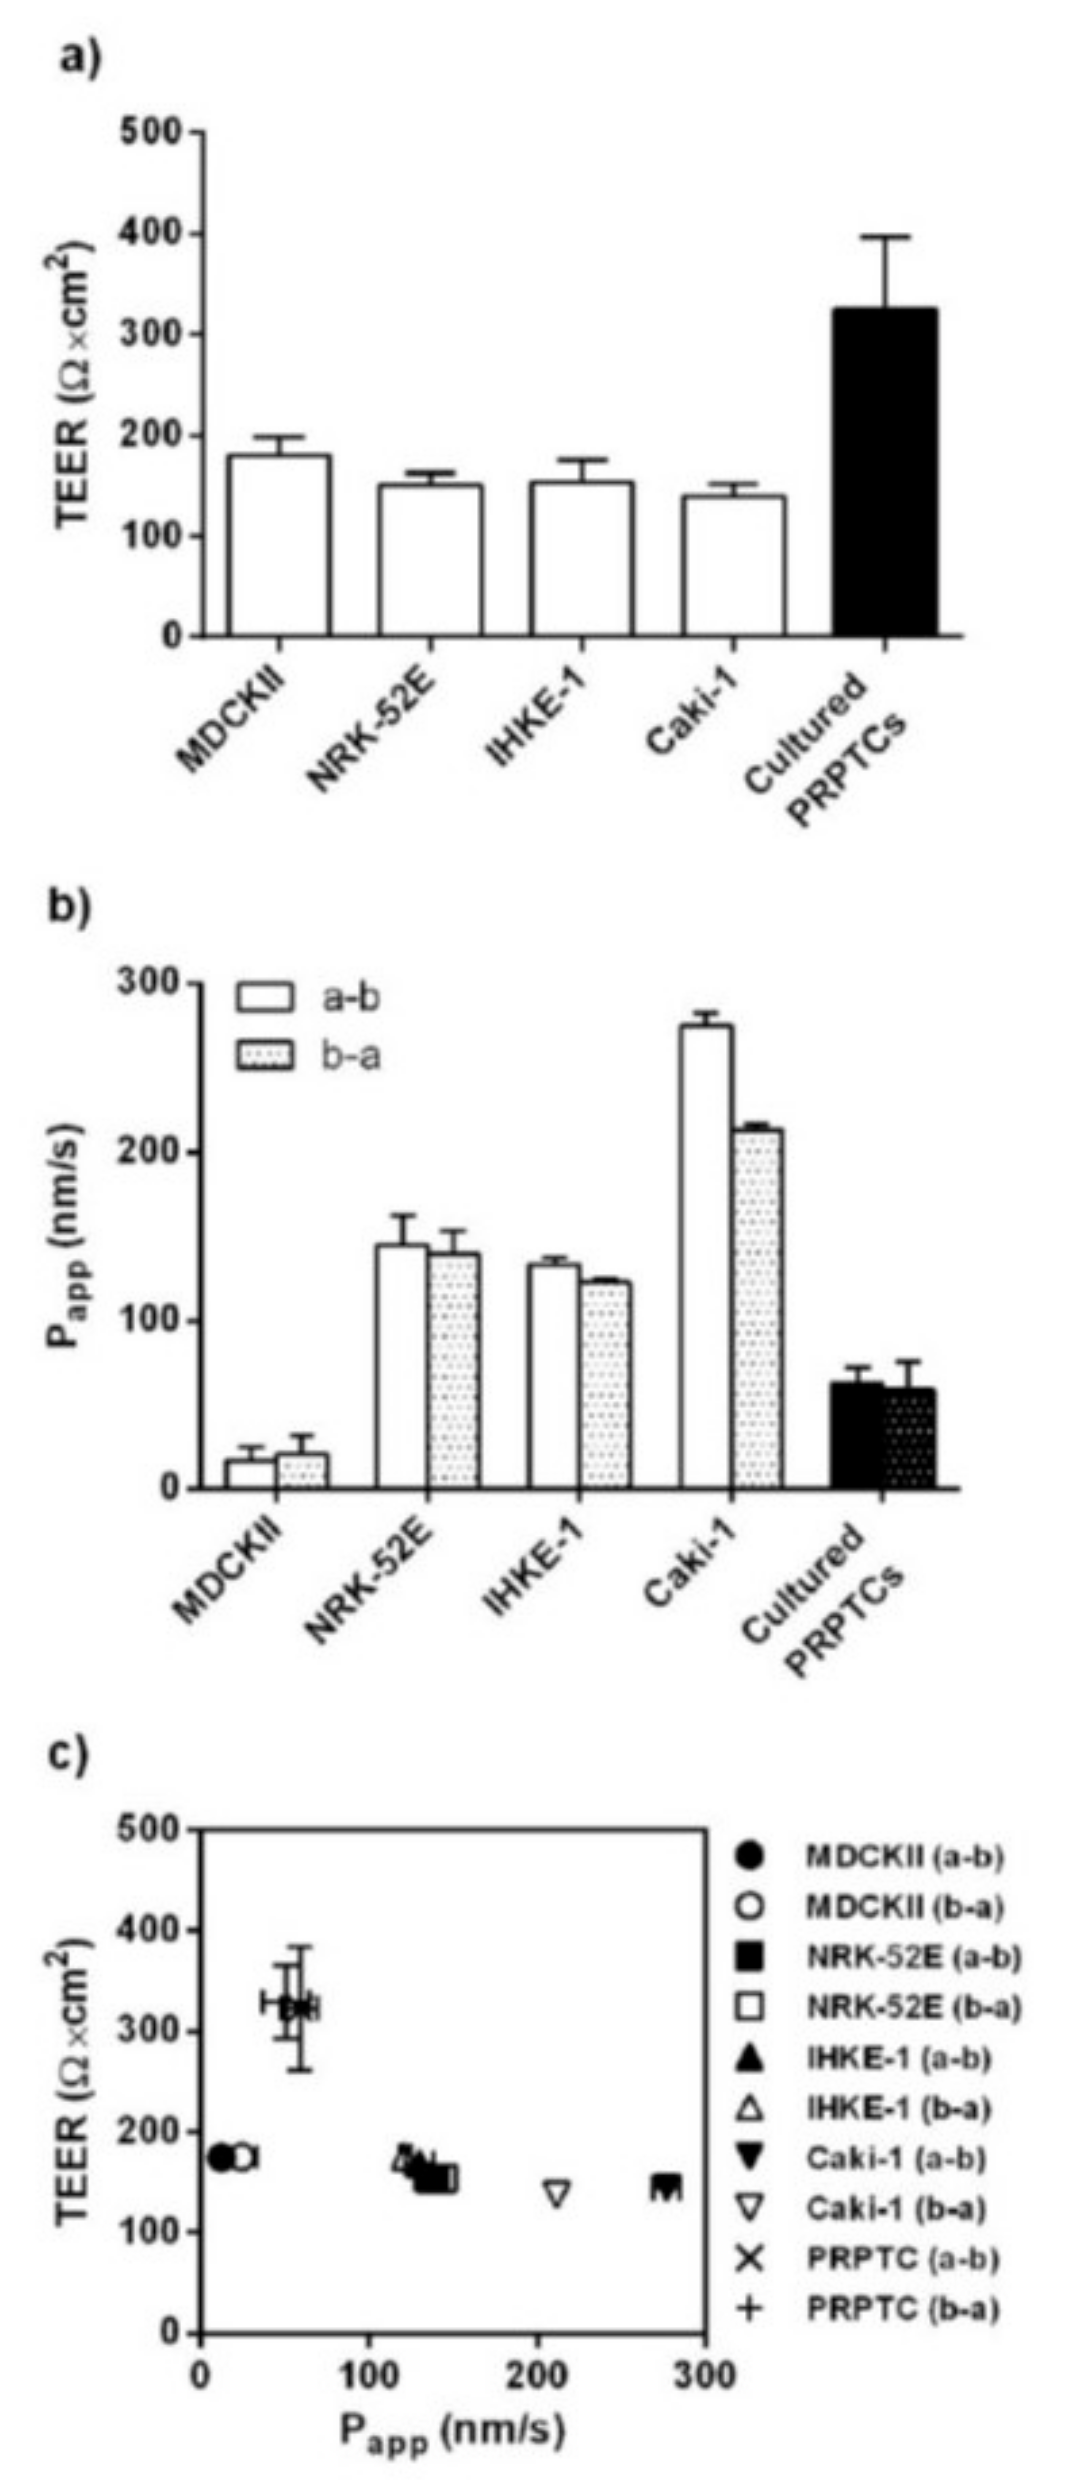
2.1. Phenotypic Characterization, Cell Morphology and Monolayer Integrity

Figure 2 shows the light microscopic characterization of the cultured cells. All cells formed monolayers within 5 days of culture. In particular, PRPTCs as well as NRK-52E-cells developed a cuboidal structure, whereas the human cell lines IHKE-1 and Caki-1 were rather irregular and more elongated. With the exception of Caki-1 cells, all cell lines as well as PRPTCs formed uniform monolayers, reaching confluency within 5 days in culture. Even at longer culture periods (up to 8 days), confluency was not reached by Caki-1 cells. In addition, Caki-1 cells did not show contact inhibition and started to form multilayers.

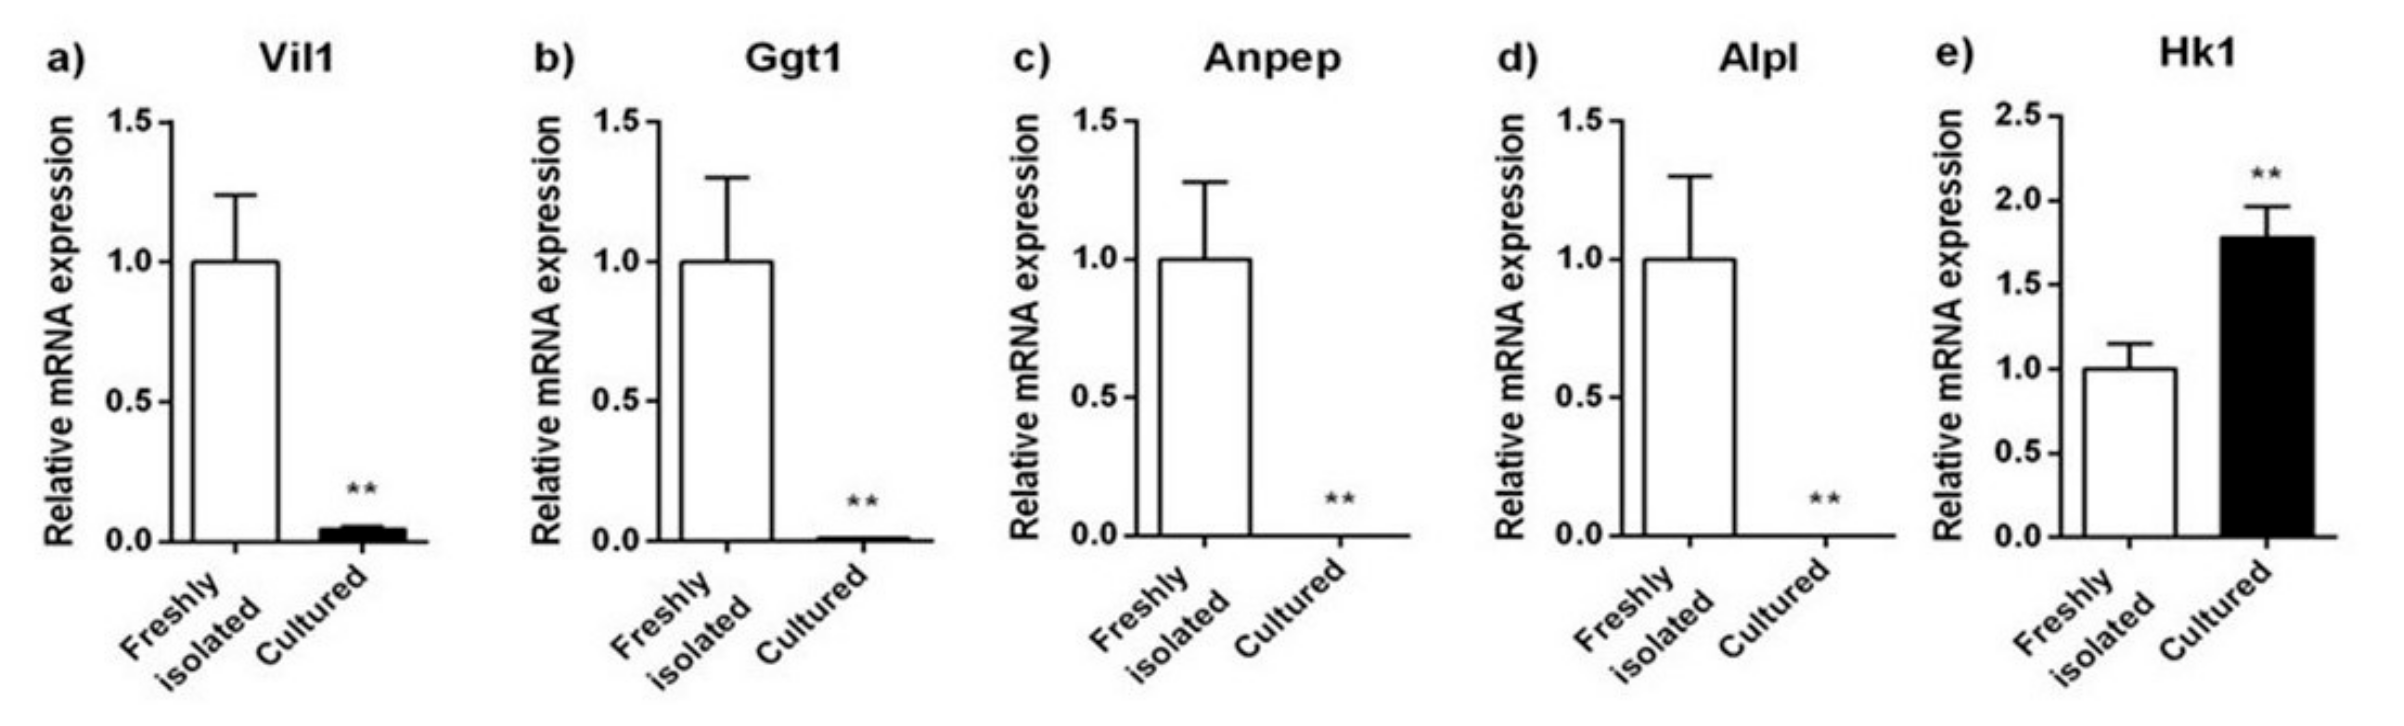
2.2. Expression Analyses of Proximal and Distal Tubule Markers

In order to clarify the identity of the isolated PRPTCs, mRNA expression of differentiation markers was determined by qPCR. Villin 1 (VIL1/Vil1), γ-glutamyl transferase 1 (GGT1/Ggt1), alanine aminopeptidase (ANPEP/Anpep) and alkaline phosphatase (ALPL/Alpl) were determined as markers for proximal tubules, and hexokinase 1 (HK1/Hk1) was determined as a marker for distal tubules. The mRNA expression analysis is summarized in Figure 3. Generally, considerable amounts of mRNA of all proximal markers could only be detected in freshly isolated cells, whereas NRK-52E, IHKE-1 and Caki-1 cells showed only very low expression levels for at least one of the markers. In all cell lines, the brush border membrane enzyme alanine aminopeptidase showed the highest expression levels (Caki-1 > NRK-52E > IHKE-1). However, compared to the cell lines, the expression level of alanine aminopeptidase was 10–29-fold higher in freshly isolated PRPTCs. This difference was even more pronounced for alkaline phosphatase and γ-glutamyl transferase 1, with ca. 86–3000-fold and 21–800-fold higher mRNA expression levels in freshly isolated PRPTCs, respectively. Considerable amounts of villin 1 mRNA were only detected in the PRPTCs. Additionally, the two human cell lines, IHKE-1 and Caki-1, had relatively high expression of the distal tubule enzyme hexokinase 1, suggesting potential redifferentiation to a distal cell type. Compared with this, hexokinase 1 expression was only very low in freshly isolated cells. In addition to freshly isolated PRPTCs, the expression of the tubule markers was also determined in PRPTCs kept in culture for 5 days (Figure 4). A drastic reduction in mRNA could be observed (e.g., alkaline phosphatase ca. 900-fold or villin 1 ca. 25-fold). In contrast, expression of the distal marker hexokinase 1 was 1.8-fold increased.

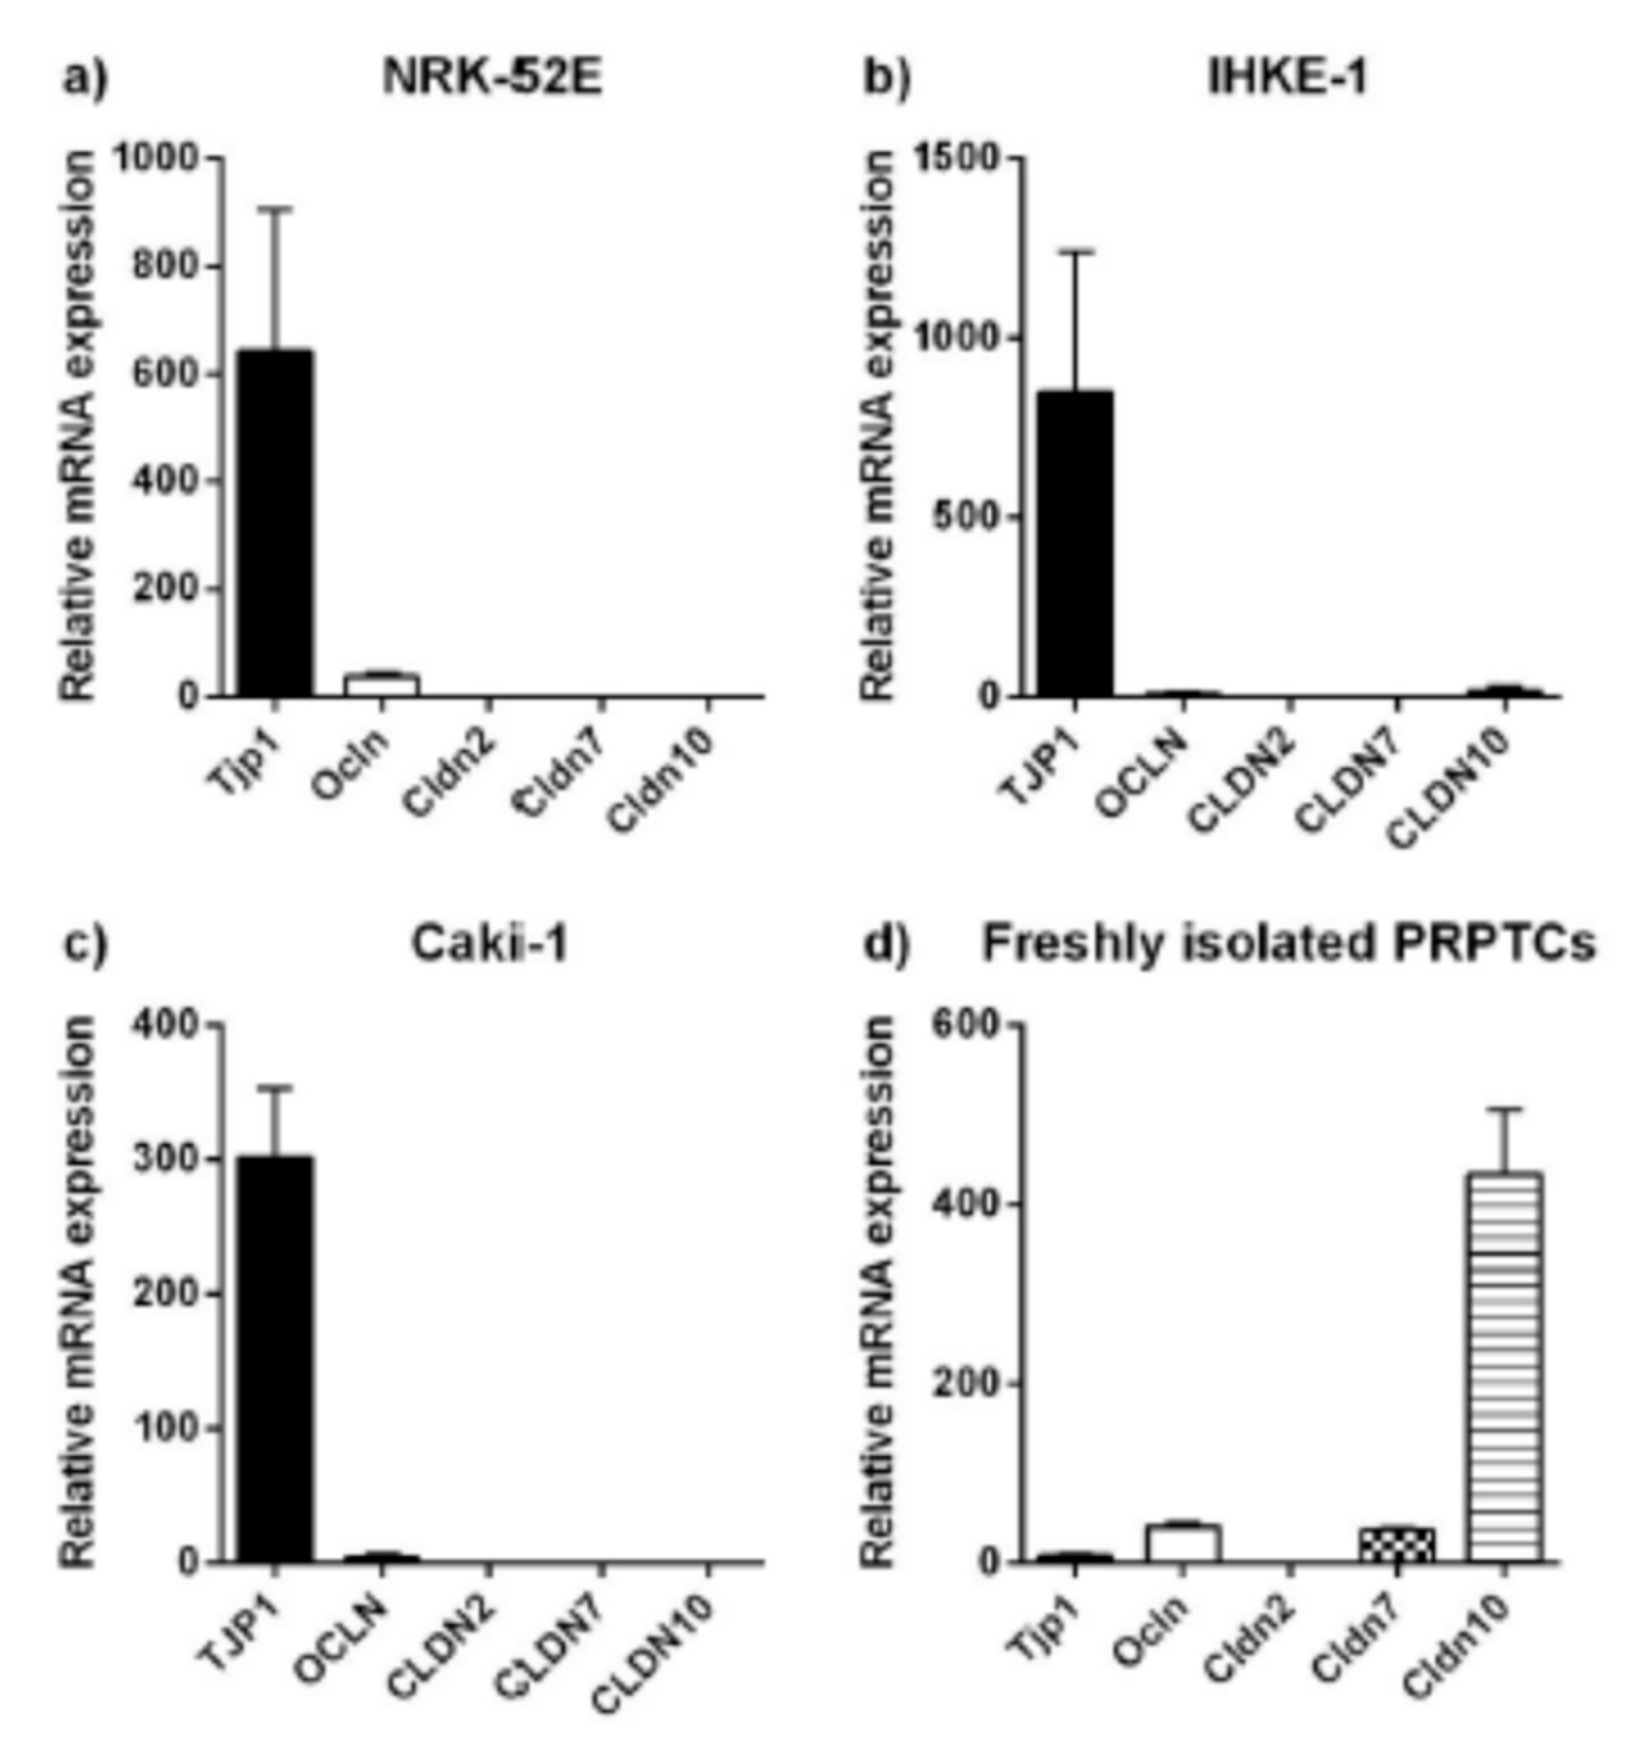
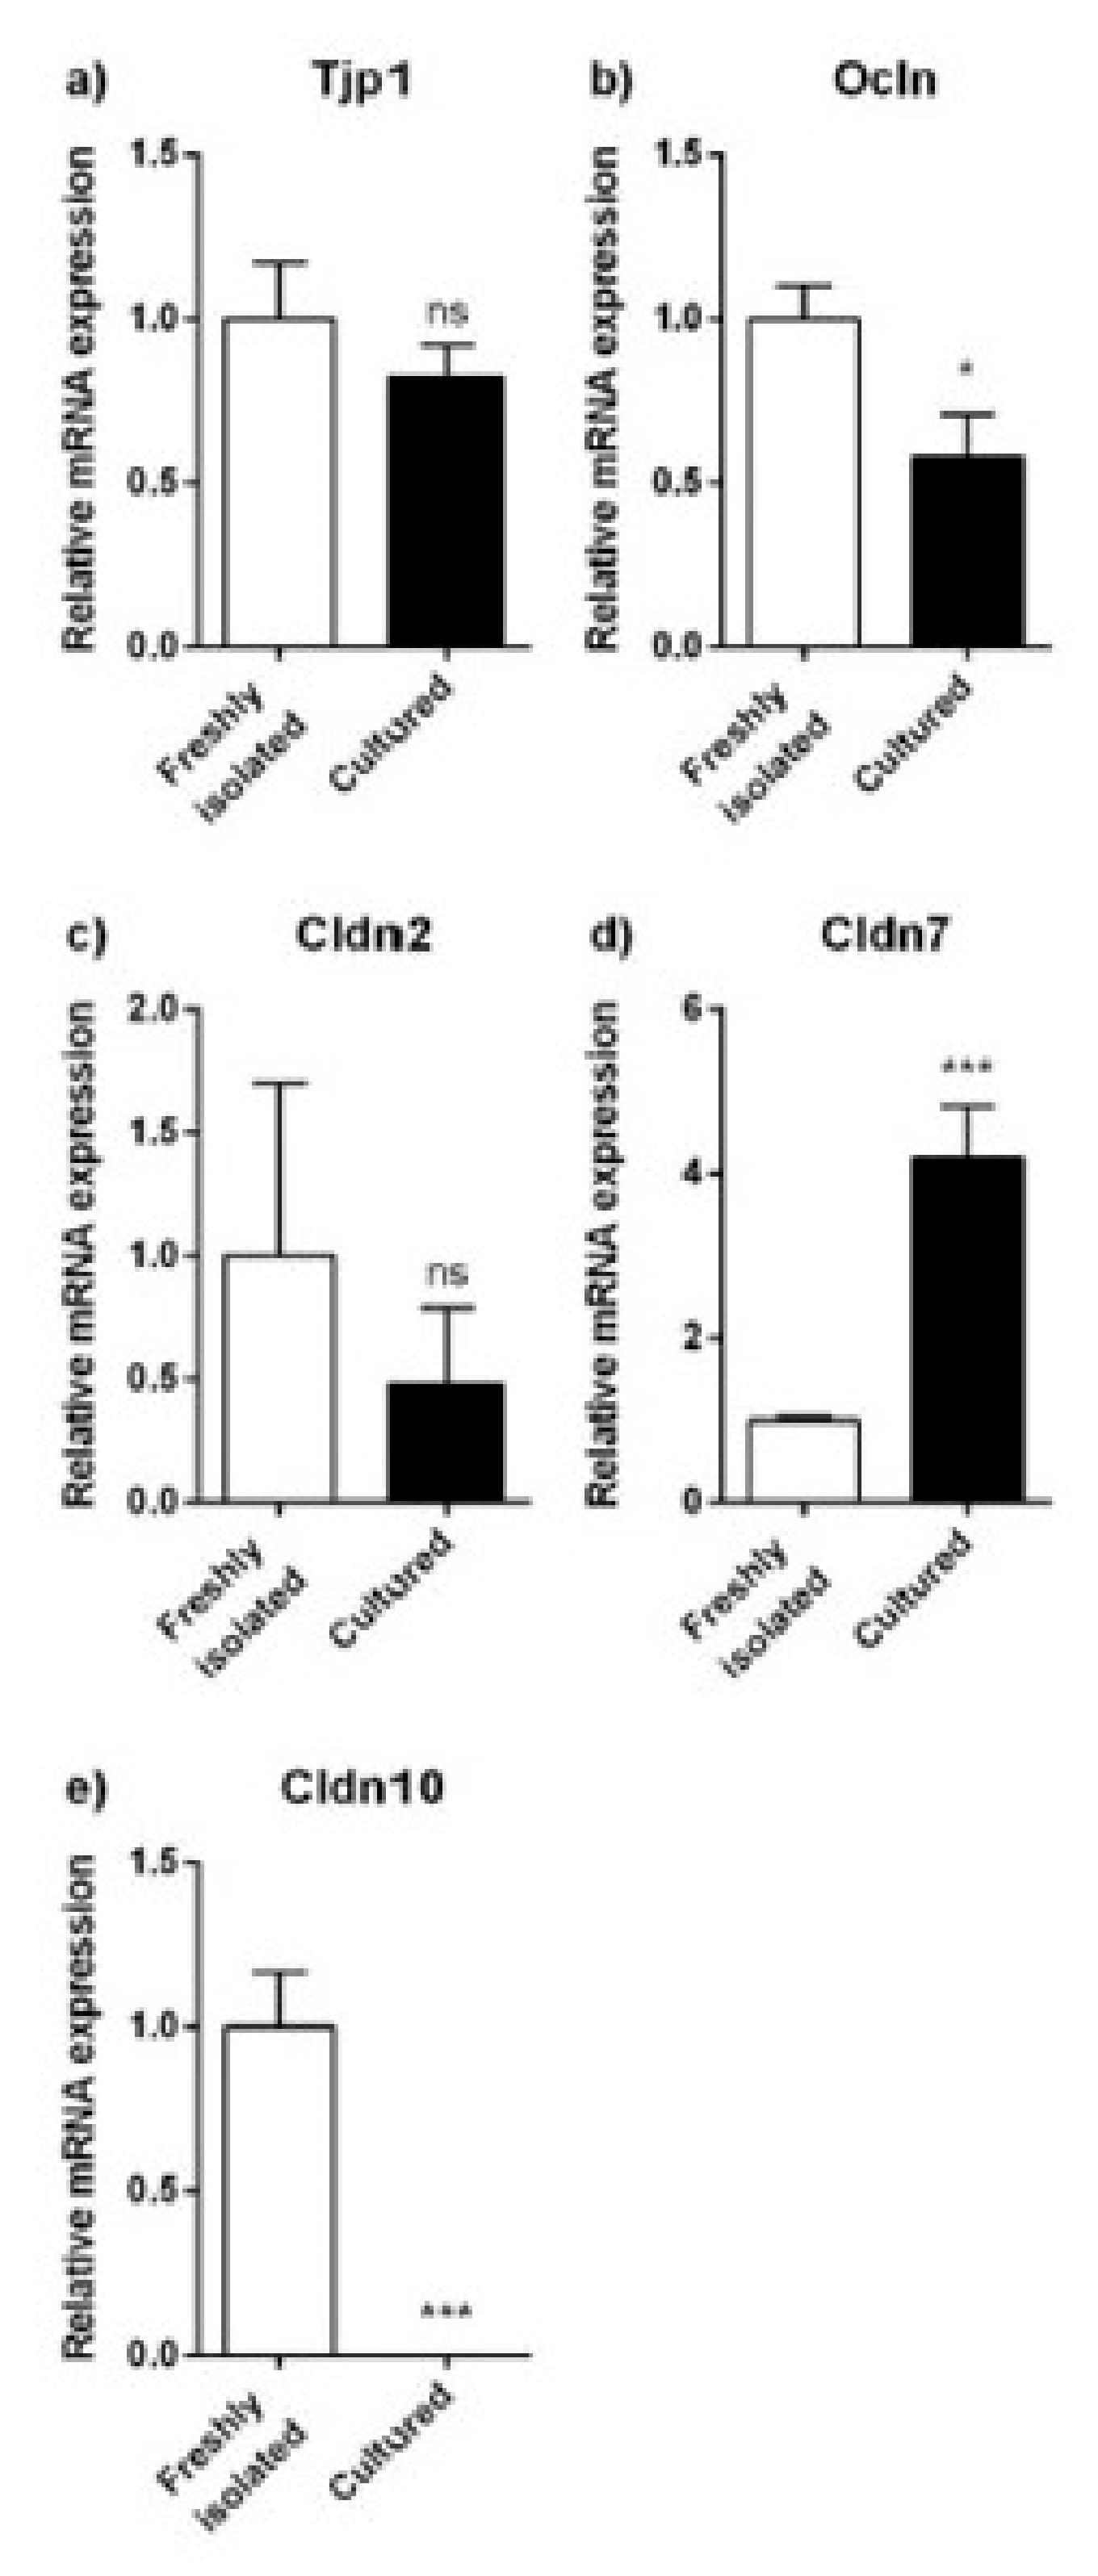
2.3. Expression Analyses of Tight Junction Proteins and Paracellular Transport

The mRNA levels of tight junction proteins in the renal cell lines NRK-52E, IHKE-1 and Caki-1 as well as in freshly isolated PRPTCs are shown in Figure 5. Similar expression profiles were found in the three cell lines. The highest expression in NRK-52E, IHKE-1 and Caki-1 cells was detected for tight junction protein 1, while no or only very low levels of expression were found for claudin-2, -7 and -10. Freshly isolated PRPTCs showed a markedly different expression pattern. In these cells, claudin-10 had the highest expression and moderate levels of claudin-2 mRNA were detected as well. Moreover, the expression level of tight junction protein 1 was much lower than in the cell lines (ca. 35–100-fold).
The mRNA expression of the tight junction proteins was also studied in PRPTCs cultured for 5 days (Figure 6). Whereas the expression levels of tight junction protein 1, occludin and claudin-2 were not statistically different (p > 0.05) or only slightly decreased, a 4-fold increase in claudin-7 mRNA was observed. In contrast, the expression of claudin-10 was almost completely reduced in cultured PRPTCs (ca. 700-fold).
In parallel to mRNA expression analysis, tight junction proteins were also visualized by immunofluorescent staining of the cell monolayers (Figure 7). A summary of the expression patterns of tight junction proteins in the cell lines and cultured PRPTCs is shown in Table 2. Distinct signals of tight junction protein 1, occludin, claudin-2 and claudin-7 at the cell–cell borders were detected throughout the monolayers of these cells, as shown in Figure 7. In comparison, the renal cell lines NRK-52E, IHKE-1 and Caki-1 showed diverging expression patterns. While tight junction protein 1 and occludin could be detected in all three cell lines, at least one of the claudins was absent. A claudin-2 signal could be detected in monolayers of IHKE-1 and Caki-1 cells but it was mainly found in the cytosol and not predominantly located at the cell–cell borders. In Caki-1 cells, this was also true for the expression of tight junction protein 1 and occludin, indicating non-functional tight junctions. In contrast to the cell lines NRK-52E, IHKE-1 and Caki-1, cultured PRPTCs and the MDCKII cell line did express claudin-7 in addition to tight junction protein 1 and occludin. The signal of all three detected tight junction proteins was strongest at the cell–cell borders. No signal was found for claudin-10 in any of the tested cells.
In order to place the expression data of tight junction proteins into a functional context, the transepithelial electrical resistance (TEER) of the cell monolayers was determined (Figure 8a). The highest TEER value was measured with PRPTCs (326 Ω × cm2). TEER values of the cell lines MDCKII, NRK-52E, IHKE-1 and Caki-1 were slightly lower and ranged from 135 to 180 Ω × cm2.
In addition to TEER measurements, the permeability of the cell monolayers was determined by measuring the bi-directional migration of [14C]-mannitol, a non-cell-permeable marker compound (Figure 8b). The lowest [14C]-mannitol flux was found in MDCKII cells, with Papp values of 16.5 nm/s and 20.7 nm/s for a–b and b–a transport, respectively. In comparison, [14C]-mannitol flux in NRK-52E and IHKE-1 cells was considerably higher, with Papp values ranging from 123 nm/s to 145 nm/s in both directions. With Papp values of 275 nm/s for a–b and 213 nm/s for b–a transport, Caki-1 cells showed the highest permeability for [14C]-mannitol. Moderate permeability was observed with monolayers of cultured PRPTCs; [14C]-mannitol flux was slightly higher than in MDCKII cells and lower than in the other cell lines. The efflux ratios were approximately 1 in all cells, indicating a passive transport process.
When the paracellular movement of [14C]-mannitol was plotted versus TEER values, no clear correlation could be seen (Figure 8c). In theory, low Papp values are associated with high TEER values, indicating tight monolayers (13,14). However, MDCKII cells showed the lowest Papp values, i.e., the lowest [14C]-mannitol flux, while, at the same time, TEER values were lower than in PRPTCs. Moreover, although varying Papp values were measured with NRK-52E, IHKE 1 and Caki-1 cells, the TEER values did not differ considerably and were similar in all three cell lines.

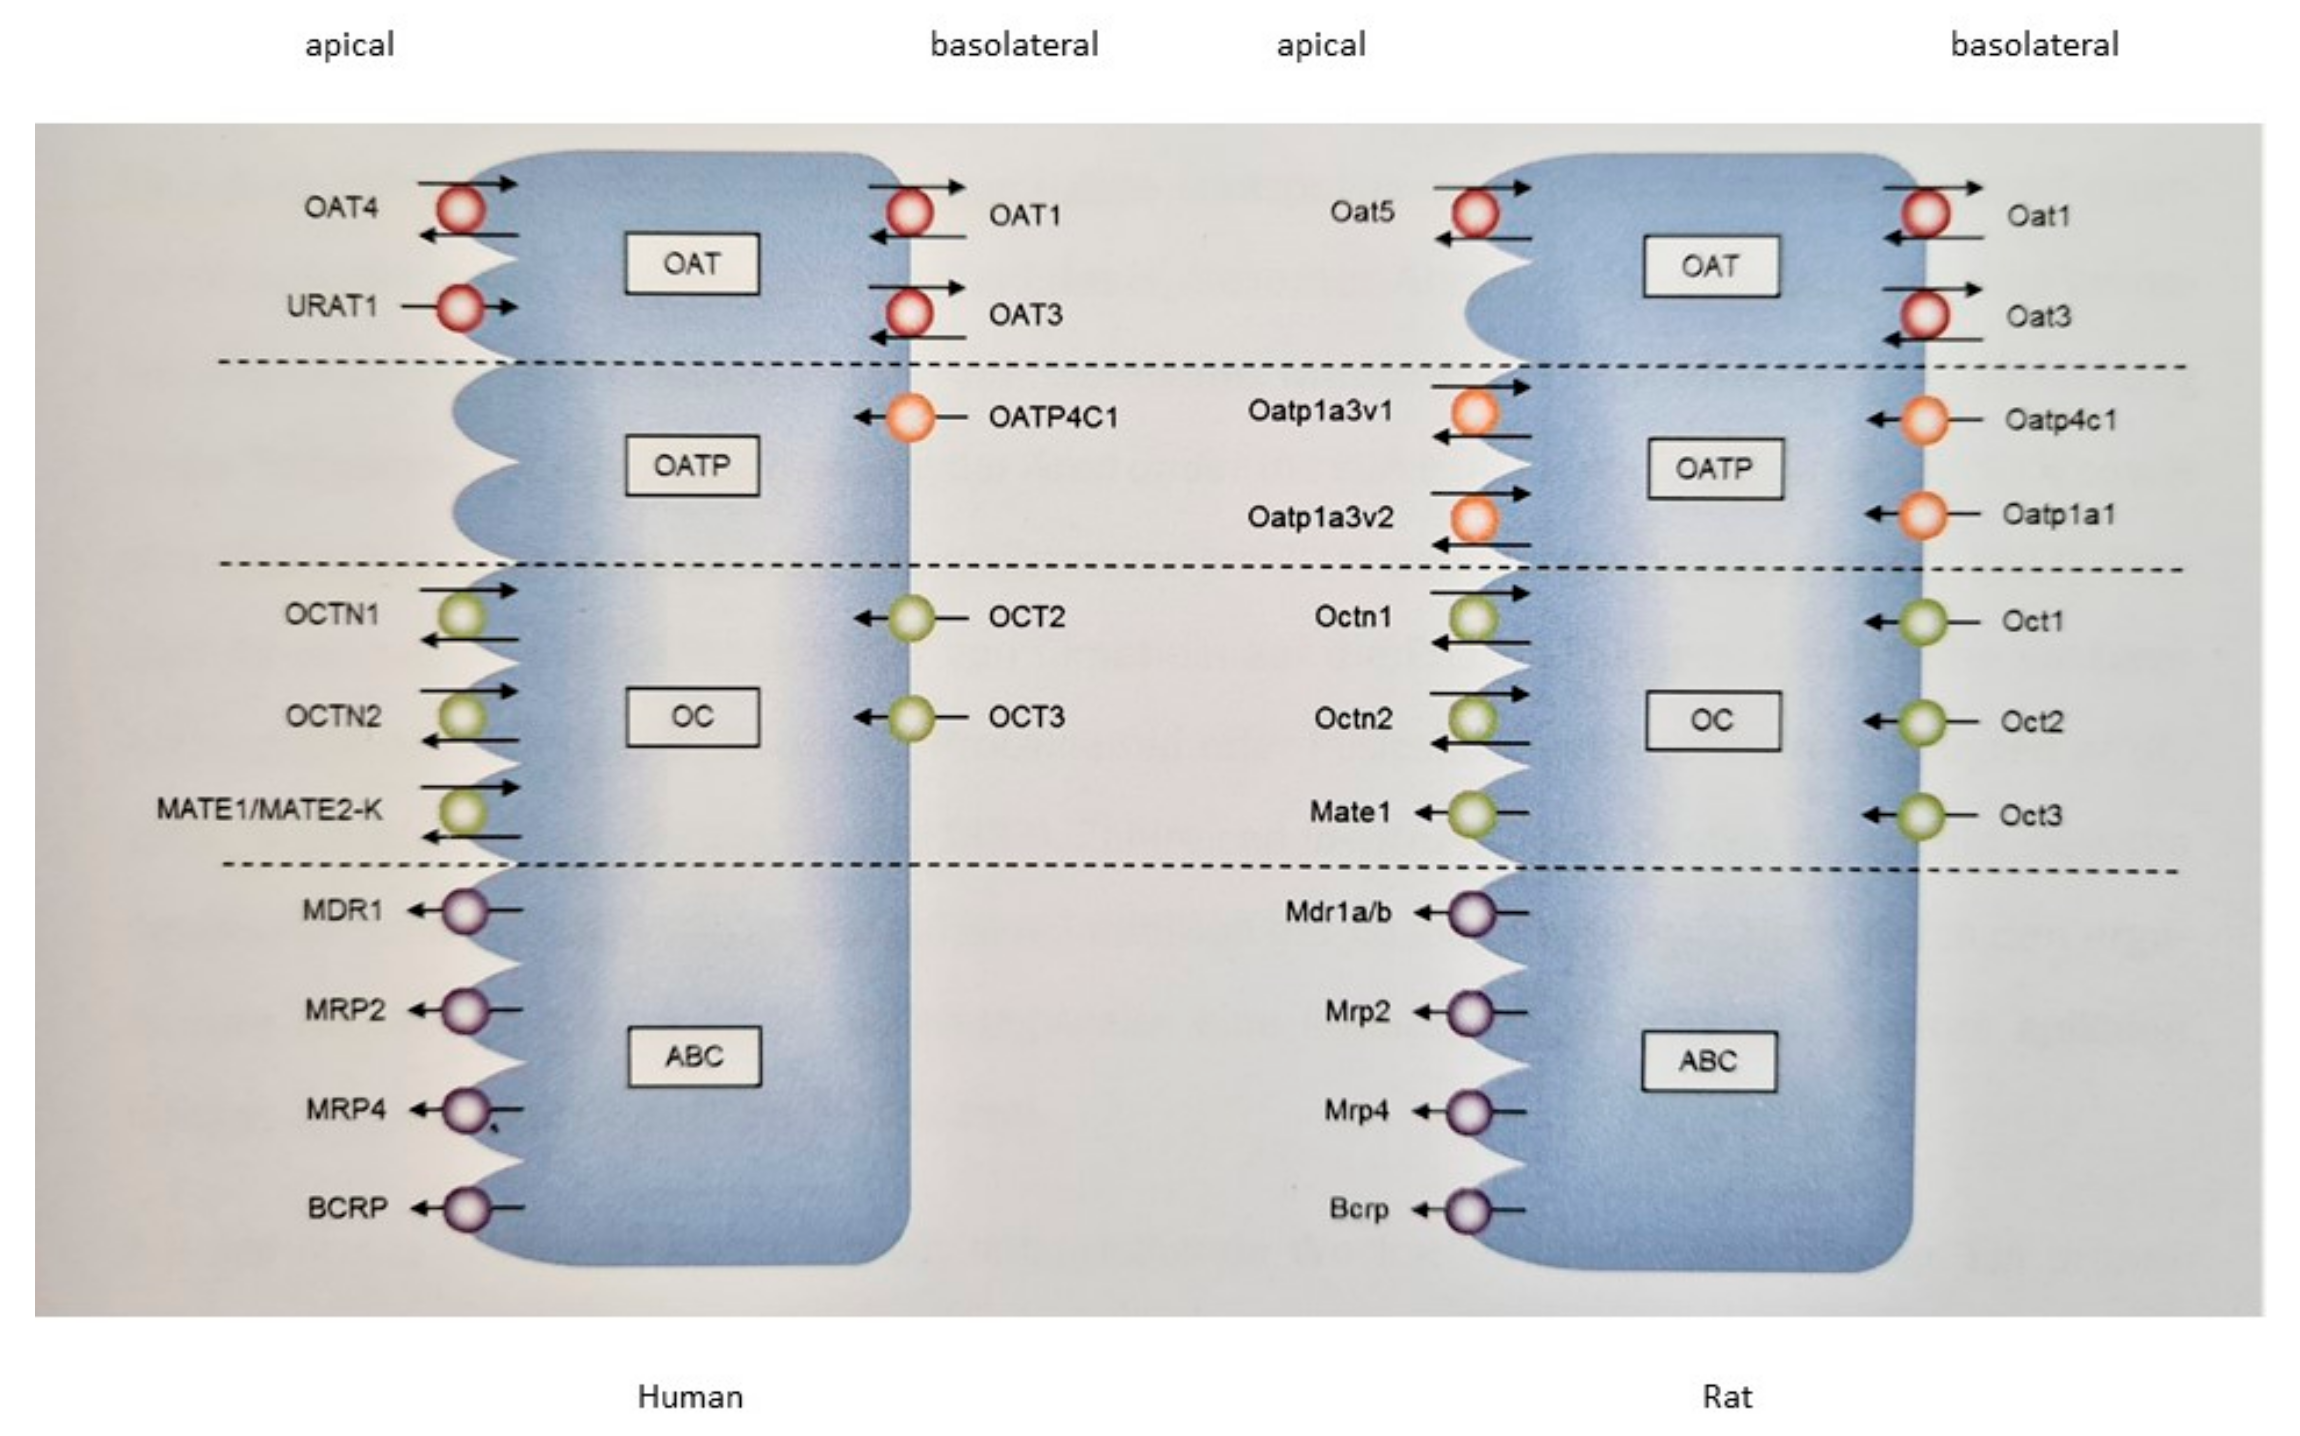
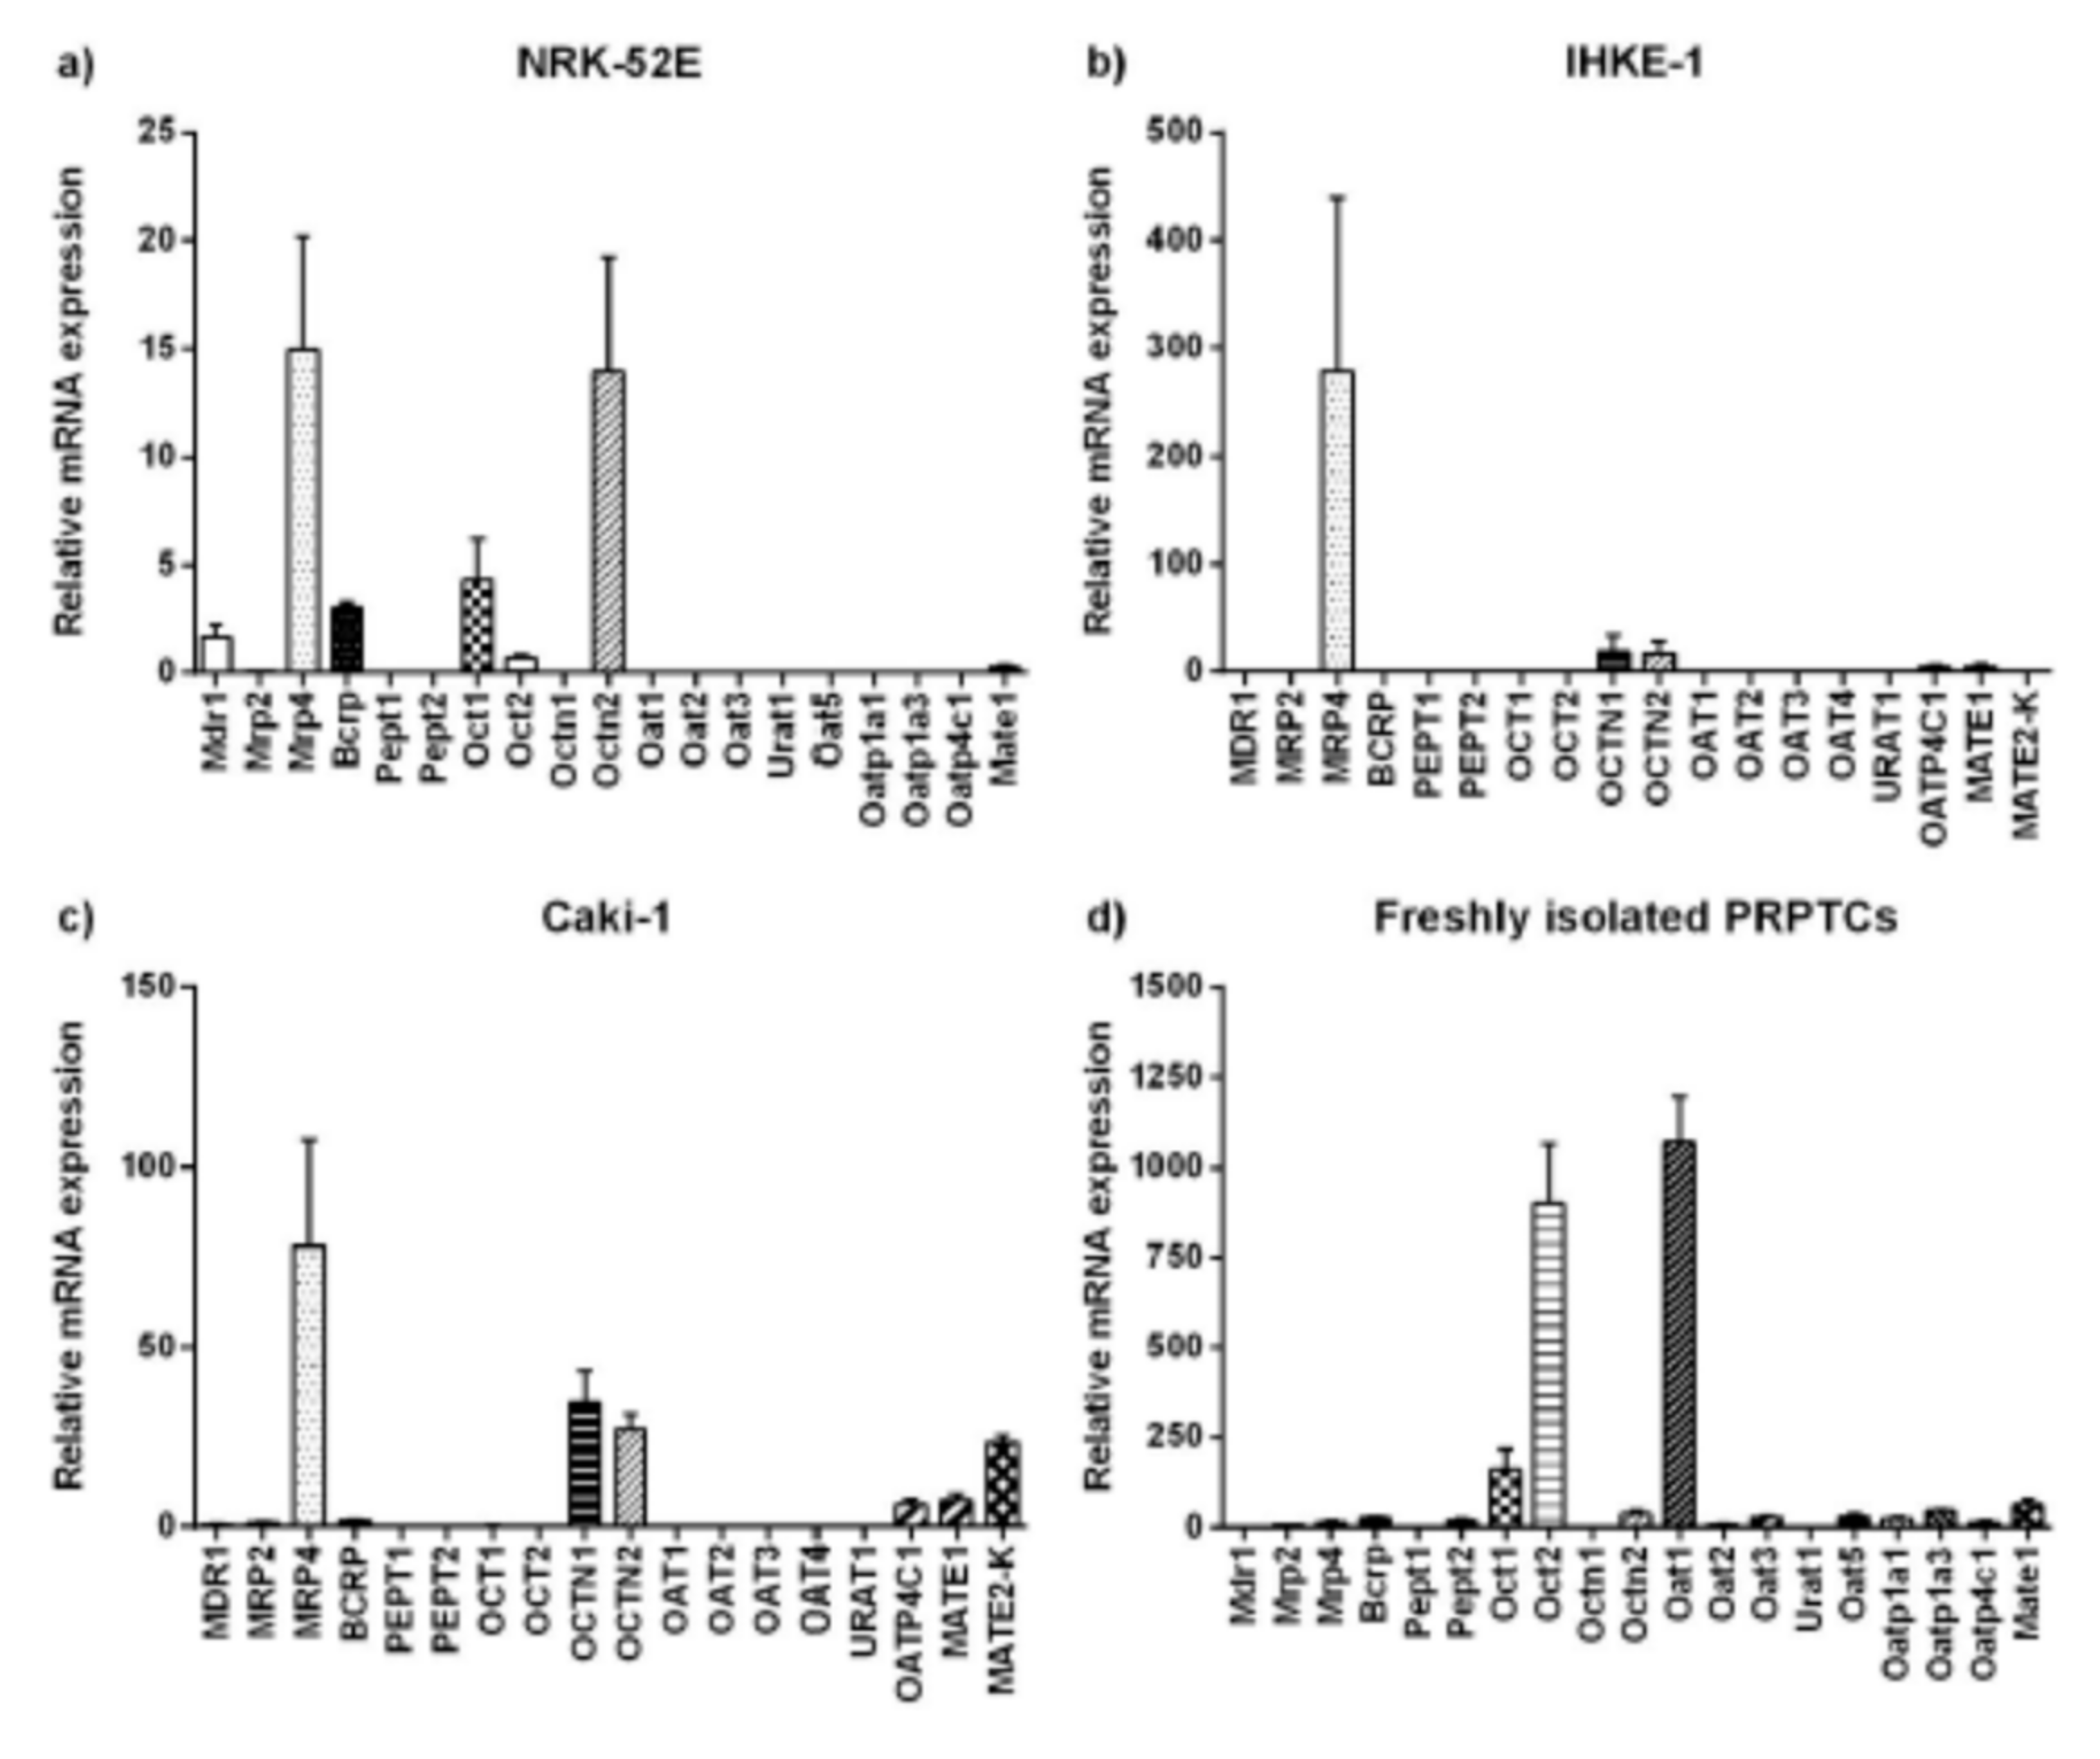
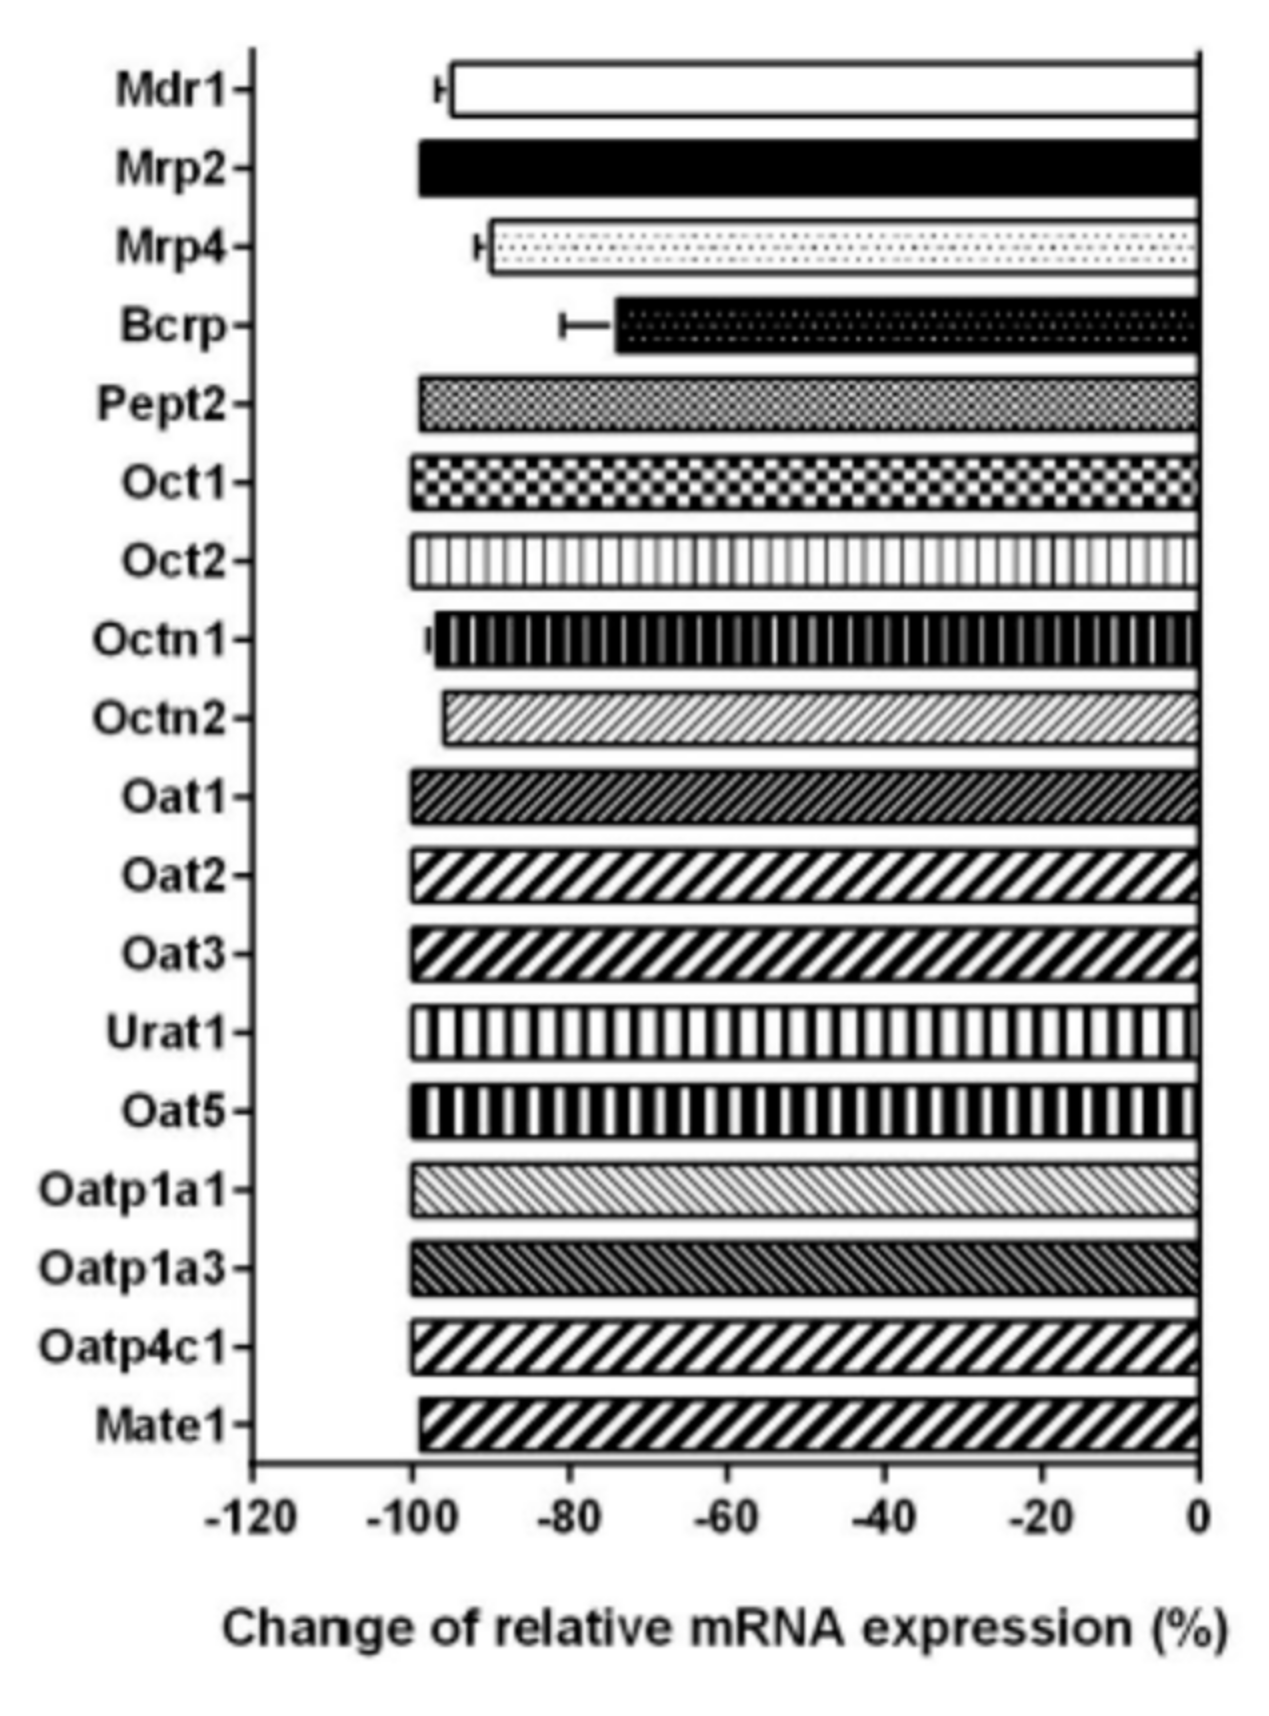
2.4. Expression of Transport Proteins

Several transport proteins play an essential role in the active uptake and excretion of drugs. They include the ABC transporters MDR1/Mdr1 (ABCB1/Abcb1), MRP2/Mrp2 (ABCC2/Abcc2), MRP4/Mrp4 (ABCC4/Abcc4) and BCRP/Bcrp (ABCG2/Abcg2), as well as uptake transport proteins belonging to the SLC22 and the SLCO families. In addition, the MATE transporters MATE1/Mate1 (SLC47A1/Slc47a1) and MATE2-K (SLC47A2) and PEPT1/Pept1 (SLC15A21/Slc15a1) and PEPT2/Pept2 (SLC15A2/Slc15a2) are relevant as well. Since these transporters show species differences, not all of them were studied in all cells. The expression of MATE2-K (SLC47A2) and OAT4 (SLC22A9) is limited to proximal tubules in humans and was therefore only studied in the cell lines IHKE-1 and Caki-1. The expression of Oat5 (Slc22a24), Oatp1a1 (Slco1a1) and Oatp1a3 (Slco1a3) is limited to rats and was only studied in the NRK-52E-cell line as well as in PRPTCs.
As demonstrated in Figure 9, the expression of transporters varied significantly between the renal cell lines. In NRK-52E cells, the expression of all transporters was comparatively low. The highest relative expression was found for Mrp4 and Octn2. Furthermore, low amounts of mRNA of Mdr1, Bcrp and the organic cation transporters Oct1 and Oct2, as well as Mate1, were detected (Figure 9a). While IHKE-1 cells showed high expression levels of MRP4, mRNA of the other ABC transporters was absent or only minimal amounts could be detected. Moderate expression levels were also found for the SLC transporters OCTN1, OCTN2 and MATE1, as well as for the organic anion transporter OATP4C1 (Figure 9b). Similar to NRK-52E and IHKE-1 cells, the highest relative expression in Caki-1 cells was found for MRP4. In contrast to the other human cell line, IHKE-1, low levels of the other ABC transporters, MDR1, MRP2 and BCRP, could also be detected. With the exception of OCT2, mRNA of all organic cation transporters was found, with OCTN1 and OCTN2 having the highest expression level among them. Moderate levels of MATE1 and MATE2-K could also be detected. The only organic anion transporter found in this cell line was OATP4C1 (Figure 9c). Generally, the renal cell lines NRK-52E, IHKE-1 and Caki-1 did not express the whole set of transporters found in vivo. In particular, organic anion transporters of the SLC22 and SLCO families were almost completely absent. The only exception was OATP4C1, which was found in moderate amounts in the human cell lines IHKE-1 and Caki-1. In marked contrast to this, mRNA of all investigated transporters except for Pept1 was detected in freshly isolated PRPTCs (Figure 9d). The highest expression levels were found for the typical renal organic anion and cation transporters Oat1 and Oct2. Moreover, the freshly isolated PRPTCs expressed several other organic anion transporters, which could not be detected in the cell lines, such as Oat2, Oat3, Oat5, Oatp1a1 and Oatp1a3.
The relative expression levels of the 18 transporters were also determined in PRPTCs after 5 days in culture. Compared to the freshly isolated PRPTCs, the expression pattern differed notably. Figure 10 shows that the mRNA amount of all transporters was considerably lower after culturing the cells. The lowest reduction was observed as 74% in the case of Bcrp, while the mRNA expression of all other transporters was downregulated by 90–100% compared to the freshly isolated cells. Figure 11 summarizes all transporter expression data.

3. Discussion

In vitro cell culture models (e.g., continuous and primary renal cell lines, polarized cell monolayers) of the kidney are attracting increasing interest in the replacement of animal studies. However, the human proximal tubule is a complex, metabolically active epithelial system, and the availability of in vitro cell culture model systems of the human proximal tubular epithelia is very limited. Although they are mostly reductive and lack the complexity of the intact organ, immortalized cell lines and primary cultures of isolated defined segments of the nephron may provide valuable systems for investigating the regulation of a variety of glomerular and renal tubule epithelial cell functions. In this present analysis, we performed a comparative investigation on freshly isolated primary rat proximal tubule cells, primary rat proximal tubule cells cultured for 5 days and the immortalized cell lines MDCKII, NRK-52E, IHKE-1 and Caki-1. From all studies, striking differences between primary cells, cultured primary cells and cell lines became obvious, starting with cell morphology at cell culture (Figure 2), the expression of tight junction proteins (Figure 5, Figure 6 and Figure 7) or completely different patterns of expression of transport proteins (Figure 9). Distinct cell types are certainly suitable to answer specific questions. For example, MCDKII cells, originally derived from the kidney of a cocker spaniel in 1958, belong to the best characterized cell lines with respect to transport studies. They have often been used to overexpress proteins such as p-glycoprotein or breast cancer resistance protein to specifically study excretory transport. However, our own previous studies and those of others [14,15,16,17] demonstrated the rather diverse expression of transport proteins dependent on the subtype of MDCK cells. NRK-52 cells have also widely been used mainly for toxicological studies [18,19,20]; however, to date, detailed cell characteristics have not been published. The same is the case for IHKE-1 cells. Caki-1 cells are well characterized to be of proximal tubule nature due to the presence of γ-glutamyl transferase and E-cadherin, specific proximal tubule and epithelial markers, respectively. In addition, they have been shown to be the first human proximal tubule cell line to express OCTN2 and OCT3 [21,22]. For another human cell line, HK-2, it was reported that it is only of very limited suitability for the in vivo situation; although it expresses MDR1 and at least one MRP transporter, it lacks members of the SLC22 family, such as OAT1, OAT3 or OCT2 [23]. Therefore, this cell line was not investigated in the present study.
Looking at the cell morphology, all investigated cells developed confluent monolayers with a typical cuboidal cell morphology, except for the Caki-1 cell line, which developed a fibroblast-like morphology without confluent monolayers. A similar observation was made by [24].
The expression analysis revealed that freshly isolated kidney cells expressed all investigated proximal tubule markers. The distal glycolysis marker Hexokinase-1 was not detected. The renal cell lines were clearly different. In particular, the NRK-52E cells were in a state of dedifferentiation compared to freshly isolated cells. The two human cell lines, IHKE-1 and Caki-1, showed a similar expression pattern. In addition, Hexokinase-1 was expressed, indicating a more distal tubular cell type. The expression and activity of alanine-aminopeptidase-mRNA and γ-glutamyltransferase-1, respectively, were at least 10-times lower than in freshly isolated cells.
The expression pattern of primary cells changed significantly within 5 days of culture. The expression of all investigated markers decreased by around 96–99%. The simultaneous decrease in γ-glutamyltransferase and the increase in hexokinase can be interpreted as a change from gluconeogenetic (proximal) to glycolytic (distal) activity. However, this change might also be a result of adaptation to the culture conditions [25].
An important quality element of tubular cell cultures is the barrier formation of tight monolayers, which is dependent on the expression and function of claudins and other tight junction proteins. The different cell lines showed remarkable differences, and in the primary cells, the expression of all marker proteins decreased significantly with time. Obviously, the primary cells started to dedifferentiate during culture. However, in accordance with the observed mRNA expression pattern, the only claudin detected in cultured cells by immunofluorescence was claudin-7. Thereby, a clear co-localization with ZO-1 and Occludin was seen, being indicative of the formation of tight junction structures. Indeed, the highest TEER values could be measured for the cultured primary cells. In addition, the paracellular permeation of mannitol across layers of primary cells was lower compared to the permeation across NRK-52E, IHKE-1 and Caci-1 cell layers.
A look at the expression profile of the investigated transport proteins in freshly isolated primary cells reveals a good correlation with previously published data [26]. However, the expression levels decreased significantly with the culture time, which was paralleled by a decrease in alkaline phosphatase, alanine-aminopeptidase, Villin-1 and γ-glutamyl transferase, all being typical for proximal tubule cells. The kidney cells lines exhibited a quite different expression pattern of the transport proteins. Noticeable was the lack of the organic anion transporters of the SLC22 and SLCO families, which is in accordance with observations by Las et al. [27]. In summary, the expression profiles of the transport proteins in the immortalized cell lines NRK-52E, IHKE-1 and CaKi-1 differed significantly from those in freshly isolated tubule cells.
Taken together, the results of this study reveal a striking heterogeneity between the investigated cell types with respect to marker enzymes, tight junction proteins and transporters. Obviously, a single cell line cannot be used to predict the in vivo situation and we, therefore, suggest the use of more than one cell line in parallel to address a certain transporter-related scientific question. The use of other in vitro technologies may also be considered, e.g., a hanging drop technology, as suggested by [28], when a type of microorganism is formed in vitro. However, since the focus of our work is on transepithelial transport across a confluent monolayer, the transwell technology, being routinely used in the pharma industry, may be advantageous. Independent of the model that will be used, it has to be taken into account that cell lines might significantly differ from the originating primary cell type, which may be of particular importance when scientific questions with pharmacological questions are addressed. In this present study, the focus was towards the expression of the investigated proteins. Further experiments have now been started to investigate the functional properties of the transporters and to reveal the impact of hormones and growth factors on their expression and function.

4. Materials and Methods

4.1. Cell Lines

The following renal cell lines were used: MDCKII (Madin-Darby canine kidney II; Netherlands Cancer Institute, Amsterdam, Netherlands), NRK-52E (Normal rat kidney-52E; Deutsche Sammlung von Mikroorganismen und Zellkulturen, Braunschweig, Germany), IHKE-1 (Immortalized human kidney epithelial-1; Bayer Pharma AG, Wuppertal, Germany) and Caki-1 (Carcinoma kidney-1; American Type Culture Collection, Manassas, VA, USA). MDCKII and NRK-52E cells were cultured in DMEM supplemented with 10% fetal bovine serum, 2 mM glutamine, 100 U/mL penicillin and 100 μg/mL streptomycin. IHKE-1 cells were cultured in DMEM/F-12 (1:1) supplemented with 1% fetal bovine serum, 4 mM glutamine, 1% insulin–transferrin–selenium (Life Technologies, Darmstadt, Germany), 1 mM sodium pyruvate, 15 mM sodium bicarbonate, 15 mM HEPES 36 µg/L hydrocortisone 10 µg/L epidermal growth factor, 100 U/mL penicillin and 100 μg/mL streptomycin. Caki-1 cells were cultured in McCoy’s 5A medium supplemented with 10% fetal bovine serum, 100 U/mL penicillin and 100 μg/mL streptomycin. All cells were cultured at 37 °C in an atmosphere of 5% CO2 and 95% relative humidity.

4.2. Animals

Male Wistar rats (RccHan:WIST, Harlan Laboratories, Rossdorf, Germany) with a mean body weight of 270 ± 35 g were used. Animals were kept under controlled conditions at constant room temperature of 22 °C and a light/dark cycle of 12 h. They had free access to standard chow (V1534-000 R/M-H, ssniff Spezialitaeten, Soest, Germany) and tap water. All animal experiments were performed according to the guidelines for animal protection of the local authorities.

4.3. Isolation of Proximal Tubular Cells from Rats

In order to isolate primary proximal tubular cells from rats (PRPTCs) a slightly modified collagenase perfusion as described was used [15]. Briefly, kidneys were in situ perfused with 150 mL EGTA solution (500 µM) followed by perfusion with 30 mL Hank’s–HEPES buffer (137 mM NaCl, 5 mM KCl, 0.8 mM MgSO4, 0.33 mM Na2HPO4, 0.44 mM KH2PO4, 26 mM NaHCO3, 25 mM HEPES, pH 7.4) in order to remove Ca2+ ions. Subsequently, the kidneys were removed and perfused in a recirculating system for 20 min with collagenase solution (4 mM CaCl2, 1.3 mg/mL collagenase type 2 in Hank’s–HEPES buffer). The cortex was mechanically separated and homogenized and the resulting suspension was filtered through cell strainers with 100 µm and 70 µM mesh size. Following this, the suspension was centrifuged for 3 min at 200× g and 4 °C and the pellet was resuspended in PRPTC culture medium (DMEM/F-12 (1:1) supplemented with 10% fetal bovine serum, 2 mM glutamine, 1% insulin–transferrin–selenium (Life Technologies, Darmstadt, Germany), 100 U/mL penicillin and 100 μg/mL streptomycin). For experiments with cultivated PRPTCs, the cells were standardly seeded on rat tail type 1 collagen-coated cell culture vessels at a density of 4.0 × 10⁴ cell/cm2 and cultured at 37 °C in an atmosphere of 5% CO2 and 95% relative humidity for 5 days.

4.4. RNA Expression Analyses

Renal cell lines and PRPTCs were seeded on cell culture flasks and cultured for 5 days under standard conditions. Initially, the cells were removed from the culture vessels by rinsing of the monolayers with PBS and incubation with trypsin–EDTA solution (0.25%) for 5 min. Isolation of total RNA was done with QIAshredder columns and the RNeasy® Mini Kit (Qiagen, Hilden, Germany) according to the manufacturer’s protocols. RNA quantity and quality were determined by measuring absorbance at 260 nm and 280 nm with a spectrophotometer (NanoDrop 2000c, peqlab, Erlangen, Germany). Additionally, RNA integrity was assessed by checking 28S and 18S rRNA bands on a denaturing agarose gel stained with ethidium bromide. Isolated RNA was then reverse-transcribed using the QuantiTect® Reverse Transcription Kit (Qiagen, Hilden, Germany) according to the manufacturer’s instructions. For quantification, quantitative real-time PCR (qPCR) was performed using the QuantiTect® SYBR® Green Kit (Qiagen, Hilden, Germany) and a Step One Plus Real-Time PCR Cycler (Applied Biosystems, Foster City, USA). The utilized primers are shown in Table 3 and Table 4. The PCR condition was 95 °C for 15 min for initial activation, followed by 40 cycles of 94 °C for 15 s, 55 °C for 30 s and 72 °C for 30 s, and a final cycle of 95 °C for 15 s, 60 °C for 60 s and 96 °C for 15 s for melting curve analysis. Relative mRNA expression of each gene was determined by normalization to the expression level of the reference gene glyceraldehyde 3-phosphate dehydrogenase (GAPDH).

4.5. Immunofluorescent Staining

Renal cell lines and PRPTCs were seeded on 8-well chambered glass slides (Lab-Tek® Chamber Slides, Thermo Fisher Scientific, Ulm, Germany) and cultured for 5 days under standard conditions. On the day of the experiment, cell monolayers were washed three times with PBS before incubation with methanol at −20 °C for 10 min for fixation and permeabilization. After rinsing again with PBS, the monolayers were incubated with blocking buffer (150 mM NaCl, 16 mM Tris-HCl, 84 mM Tris-base, 0.1% Triton-X, 3% donkey serum) for 90 min to reduce non-specific binding. The blocking buffer was removed and the monolayers were incubated for 90 min at 4 °C with the following primary antibodies: TJP1: rabbit anti-TJP1 (Z-R1), occludin: rabbit anti-OCLN (Z-T22), claudin-2: mouse anti-CLDN2 (12H12), claudin-7: rabbit anti-CLDN7 (ZMD.241) and claudin-10: mouse anti-CLDN10 (4B8A12), all from Life Technologies (Darmstadt, Germany). Subsequently, the monolayers were briefly rinsed with PBS and incubated for another 90 min at 4 °C with Cyanin 3 (Cy3)-conjugated secondary antibodies (anti-rabbit-IgG-Cy3 for the visualization of TJP1, occludin and claudin-7, and anti-mouse-IgG-Cy3 for the visualization of claudin-2 and claudin-10, both from Jackson Immuno Research, Suffolk, UK). After rinsing 3 times with PBS, nuclei were counterstained by incubation with 4′,6-diamidino-2-phenylindole (DAPI) for 5 min at room temperature, and monolayers were rinsed in deionized H2O and mounted on the slides with Aqua-Poly/Mount (Polysciences, Eppelheim, Germany). Negative control samples that were incubated without primary antibodies were included in order to check for background labeling. After completion of the immunofluorescent staining, samples were viewed with an Axiovert 200 fluorescence microscope and a LD Plan-NEOFLUAR 20×/0.4 lens. Digital images were taken with an AxioCam MRm CCD camera and processed using the AxioVision software (all from Carl Zeiss, Jena, Germany). All images were taken with an exposure time of 1000 ms for the Cy3 signal and 65 ms for the DAPI signal.

4.6. Transepithelial Electrical Resistance and Bidirectional Transport Studies with [14C]-Mannitol

Renal cell lines and PRPTCs were seeded on 12-well Transwell® inserts (polyester membrane, 0.4 µM pore size, Corning, Wiesbaden, Germany) at a density of 0.15 × 10⁶ cell/cm2 and cultured for 5 days under standard conditions. Transepithelial electrical resistance (TEER) was measured for each well with a volt-ohm meter (Millicell®-ERS, Millipore, Billerica, MA, USA) at 37 °C. For the determination of the transcellular flux of [14C]-mannitol, bidirectional transport studies from both apical-to-basal (a–b) and basal-to-apical (b–a) directions were conducted at 37 °C. Initially, monolayers were briefly rinsed and equilibrated with transport buffer (128 mM NaCl, 5.4 mM KCl, 1 mM MgSO4, 1.8 mM CaCl2, 1.2 mM Na2HPO4, 0.4 mM NaH2PO4, 4.2 mM NaHCO3, 15 mM HEPES, 20 mM glucose, pH 7.2) for 10 min. Next, transport buffer containing 600 µM [14C]-mannitol (12.5 KBq/mL) was added to the donor compartment (0.6 mL in the apical (a) or 1.6 mL in the basal (b) compartment for a–b or b–a experiments, respectively). After pre-incubation for 10 min, fresh transport buffer was added to the acceptor compartment to start the assay. Samples were taken from the donor compartment after 0 min and 120 min and from the acceptor compartment after 120 min. All samples were transferred to scintillation vials containing 3.5 mL scintillation cocktail (Biofluor Plus, PerkinElmer, Rodgau, Germany) and radioactivity was measured with a liquid scintillation counter (Tri-Carb® 2900TR, PerkinElmer, Waltham, MA, USA).
The apparent permeability coefficient (Papp) was calculated by the following equation:
P a p p = V a c c A × c d o n , t 0 × C a c c t
where Vacc is the buffer volume in the acceptor compartment (mL), A is the membrane area (cm2), Cdon,t0 is the substrate concentration in the donor compartment at t = 0 (dpm/mL), and ΔCacc/Δt is the change in the substrate concentration over time in the acceptor compartment (dpm/mL/s).
The efflux ratio was calculated by the following equation:
E f f l u x   r a t i o = P a p p , b a P a p p , a b
where Papp,b-a is the apparent permeability coefficient from basal to apical (nm/s) and Papp,a-b is the apparent permeability coefficient from apical to basal (nm/s).

4.7. Statistics

Data are presented as mean ± SD. Comparisons between two groups were performed with the use of the two-tailed unpaired Student’s t test. Differences were considered statistically significant when the calculated p value was < 0.05.

Author Contributions

Experiments, methodology, writing—original draft preparation: C.L. Conceptualization, methodology, writing—review and editing: U.M., A.R., G.F. All authors have read and agreed to the published version of the manuscript.

Funding

This research received no external funding.

Institutional Review Board Statement

The study was conducted according to the guidelines of the Declaration of Helsinki, and approved by Landesamt für Gesundheit und Soziales Berlin.( protocol code Nr.: O 0101/08).

Informed Consent Statement

Not applicable.

Data Availability Statement

Data is contained within the article.

Conflicts of Interest

All authors declare no conflict of interest.

Abbreviations

ABCATP-binding cassette
ALPLAlkaline phosphatase liver/bone/kidney
ANPEPAlanine aminopeptidase
BCRPBreast cancer resistance protein
Caki-1Carcinoma kidney-1
CLDNClaudin
Cy3Cyanin 3
DAPI4′,6-diamidino-2-phenylindole
GAPDHGlyceraldehyde 3-phosphate dehydrogenase
GGT1γ-glutamyl transferase 1
HK1Hexokinase 1
IHKE-1Immortalized human kidney epithelial-1
MATEMultidrug and toxin extrusion
MDCKMadin-Darby canine kidney
MDR1Multidrug resistance 1
MRPMultidrug resistance
NRK-52ENormal rat kidney-52E
OATOrganic anion transporter
OATP Organic anion transporting polypeptide
OCLNOccludin
OCTOrganic cation transporter
OCTNOrganic cation transporter, novel
PappApparent permeability coefficient
PEPTPeptide transporter
PRPTCPrimary rat proximal tubule cell
qPCRQuantitative real-time PCR
SLCSolute carrier
SLCOSolute carrier organic anion
TEERTransepithelial electrical resistance
TJP1Tight junction protein 1
URATUrate transporter
VIL1Villin 1

References

  1. Courjault-Gautier, J.C. Consecutive use of hormonally defined serum-free media to establish highly differentiated human renal proximal tubule cells in primary culture. J. Am. Soc. Nephrol. JASN 1995, 5, 1949–1963. [Google Scholar] [CrossRef]
  2. Gildea, J.J.; Shah, I.; Weiss, R.; Casscells, N.D.; McGrath, H.E.; Zhang, J.; Jones, J.E.; Felder, R.A. HK-2 Human Renal Proximal Tubule Cells as a Model for G Protein–Coupled Receptor Kinase Type 4–Mediated Dopamine 1 Receptor Uncoupling. Hypertension 2010, 56, 505–511. [Google Scholar] [CrossRef] [Green Version]
  3. Van der Hauwaert, C.; Savary, G.; Gnemmi, V.; Glowacki, F.; Pottier, N.; Bouillez, A.; Maboudou, P.; Zini, L.; Leroy, X.; Cauffiez, C.; et al. Isolation and Characterization of a Primary Proximal Tubular Epithelial Cell Model from Human Kidney by CD10/CD13 Double Labeling. PLoS ONE 2013, 8, e66750. [Google Scholar] [CrossRef] [Green Version]
  4. Kiuchi-Saishin, Y.; Gotoh, S.; Furuse, M.; Takasuga, A.; Tano, Y.; Tsukita, S. Differential expression patterns of claudins, tight junction membrane proteins, in mouse nephron segments. J. Am. Soc. Nephrol. 2002, 13, 875–886. [Google Scholar] [CrossRef] [PubMed]
  5. Prozialeck, W.C.; Edwards, J.R.; Lamar, P.C.; Smith, C.S. Epithelial barrier characteristics and expression of cell adhesion molecules in proximal tubule-derived cell lines commonly used for in vitro toxicity studies. Toxicol. In Vitro 2006, 20, 942–953. [Google Scholar] [CrossRef]
  6. Reyes, J.L.; Lamas, M.; Martin, D.; Namorado, M.D.C.; Islas, S.; Luna, J.; Tauc, M.; González-Mariscal, L. The renal segmental distribution of claudins changes with development. Kidney Int. 2002, 62, 476–487. [Google Scholar] [CrossRef] [PubMed]
  7. Gonzalez-Mariscal, L.; Namorado, M.C.; Martin, D.; Luna, J.; Alarcon, L.; Islas, S.; Valencia, L.; Muriel, P.; Ponce, L.; Reyes, J.L. Tight junction proteins ZO-1, ZO-2, and occludin along isolated renal tubules11See Editorial by Brown, p. 2652. Kidney Int. 2000, 57, 2386–2402. [Google Scholar] [CrossRef] [PubMed] [Green Version]
  8. Cheng, Y.; Vapurcuyan, A.; Shahidullah, M.; Aleksunes, L.; Pelis, R.M. Expression of Organic Anion Transporter 2 in the Human Kidney and Its Potential Role in the Tubular Secretion of Guanine-Containing Antiviral Drugs. Drug Metab. Dispos. 2012, 40, 617–624. [Google Scholar] [CrossRef] [Green Version]
  9. Kuo, K.-L.; Zhu, H.; McNamara, P.J.; Leggas, M. Localization and Functional Characterization of the Rat Oatp4c1 Transporter in an In Vitro Cell System and Rat Tissues. PLoS ONE 2012, 7, e39641. [Google Scholar] [CrossRef] [PubMed] [Green Version]
  10. Lee, W.; Kim, R.B. Transporters and renal drug elimination. Annu. Rev. Pharmacol. Toxicol. 2004, 44, 137–166. [Google Scholar] [CrossRef]
  11. Giacomini, K.M.; Huang, S.-M.; Tweedie, D.J.; Benet, L.Z.; Brouwer, K.L.R.; Chu, X.; Dahlin, A.; Evers, R.; Fischer, V.; Hillgren, K.M.; et al. Membrane transporters in drug development. Nat. Rev. Drug Discov. 2010, 9, 215–236. [Google Scholar]
  12. Jennings, P.; Koppelstätter, C.; Lechner, J.; Pfaller, W. Renal cell culture models: Contribution to the understanding of nephrotoxic mechanisms. In Clinical Nephrotoxins; Springer: Berlin/Heidelberg, Germany, 2008; pp. 223–249. [Google Scholar]
  13. Markowska, M.; Oberle, R.; Juzwin, S.; Hsu, C.-P.; Gryszkiewicz, M.; Streeter, A.J. Optimizing Caco-2 cell monolayers to increase throughput in drug intestinal absorption analysis. J. Pharmacol. Toxicol. Methods 2001, 46, 51–55. [Google Scholar] [CrossRef]
  14. Anderberg, E.K.; Artursson, P. Epithelial Transport of Drugs in Cell Culture. VIII: Effects of Sodium Dodecyl Sulfate on Cell Membrane and Tight Junction Permeability in Human Intestinal Epithelial (Caco-2) Cells. J. Pharm. Sci. 1993, 82, 392–398. [Google Scholar] [CrossRef] [PubMed]
  15. Gartzke, D.; Delzer, J.; Laplanche, L.; Uchida, Y.; Hoshi, Y.; Tachikawa, M.; Terasaki, T.; Sydor, J.; Fricker, G. Genomic Knockout of Endogenous Canine P-Glycoprotein in Wild-Type, Human P-Glycoprotein and Human BCRP Transfected MDCKII Cell Lines by Zinc Finger Nucleases. Pharm. Res. 2015, 32, 2060–2071. [Google Scholar] [CrossRef] [PubMed]
  16. Gartzke, D.; Fricker, G. Establishment of Optimized MDCK Cell Lines for Reliable Efflux Transport Studies. J. Pharm. Sci. 2014, 103, 1298–1304. [Google Scholar] [CrossRef]
  17. Di, L.; Whitney-Pickett, C.; Umland, J.P.; Zhang, H.; Zhang, X.; Gebhard, D.F.; Lai, Y.; Federico, J.J., 3rd; Davidson, R.E.; Smith, R.; et al. Development of a new permeability assay using low-efflux MDCKII cells. J. Pharm. Sci. 2011, 100, 4974–4985. [Google Scholar] [CrossRef] [PubMed]
  18. Madden, E.F.; Akkerman, M.; Fowler, B.A. A comparison of 60, 70, and 90 kDa stress protein expression in normal rat NRK-52 and human HK-2 kidney cell lines following in vitro exposure to arsenite and cadmium alone or in combination. J. Biochem. Mol. Toxicol. 2002, 16, 24–32. [Google Scholar] [CrossRef] [PubMed]
  19. Yi, J.; Yuan, Y.; Zheng, J.; Hu, N. Hydrogen sulfide alleviates uranium-induced kidney cell apoptosis mediated by ER stress via 20S proteasome involving in Akt/GSK-3β/Fyn-Nrf2 signaling. Free Radic. Res. 2018, 52, 1020–1029. [Google Scholar] [CrossRef]
  20. Jensen, H.; Doughty, R.W.; Grant, D.; Myhre, O. The Effects of the Iodinated X-Ray Contrast Media Iodixanol, Iohexol, Iopromide, and Ioversol on the Rat Kidney Epithelial Cell Line NRK 52-E. Ren. Fail. 2011, 33, 426–433. [Google Scholar] [CrossRef] [Green Version]
  21. Glube, N.; Langguth, P. Caki-1 Cells as a Model System for the Interaction of Renally Secreted Drugs with OCT3. Nephron Physiol. 2008, 108, 18–28. [Google Scholar] [CrossRef]
  22. Glube, N.; Closs, E.; Langguth, P. OCTN2-Mediated Carnitine Uptake in a Newly Discovered Human Proximal Tubule Cell Line (Caki-1). Mol. Pharm. 2007, 4, 160–168. [Google Scholar] [CrossRef] [PubMed]
  23. Jenkinson, S.E.; Chung, G.W.; Van Loon, E.; Bakar, N.S.; Dalzell, A.M.; Brown, C.D.A. The limitations of renal epithelial cell line HK-2 as a model of drug transporter expression and function in the proximal tubule. Pflügers Arch. Eur. J. Physiol. 2012, 464, 601–611. [Google Scholar] [CrossRef] [PubMed]
  24. Charlton, J.; Simmons, N. Established human renal cell lines: Phenotypic characteristics define suitability for use in in vitro models for predictive toxicology. Toxicol. In Vitro 1993, 7, 129–136. [Google Scholar] [CrossRef]
  25. Toutain, H.; Courjault, F.; Vauclin-Jacques, N.; Morin, J.P. Adenylate Cyclase Responses and Biochemical Characterization of Primary Rabbit Proximal Tubular Cell Cultures and Llc-Pk1 Cells. Ren. Fail. 1990, 12, 177–182. [Google Scholar] [CrossRef] [PubMed]
  26. Augustine, L.M.; Markelewicz, R.J., Jr.; Boekelheide, K.; Cherrington, N.J. Xenobiotic and endobiotic transporter mRNA expression in the blood-testis barrier. Drug Metab. Dispos. 2005, 33, 182–189. [Google Scholar] [CrossRef] [Green Version]
  27. Lash, L.H.; Putt, D.A.; Xu, F.; Matherly, L.H. Role of rat organic anion transporter 3 (Oat3) in the renal basolateral transport of glutathione. Chem. Interact. 2007, 170, 124–134. [Google Scholar] [CrossRef] [Green Version]
  28. Prange, J.A.; Bieri, M.; Segerer, S.; Burger, C.; Kaech, A.; Moritz, W.; Devuyst, O. Human proximal tubule cells form functional microtissues. Pflug. Arch. 2016, 468, 739–750. [Google Scholar] [CrossRef]
Figure 1. Proteins relevant for renal drug transport in humans and rats. OAT/Oat: Organic anion transporter; URAT: Urate transporter; OATP/Oatp: Organic anion transporting polypeptide; OC: Organic cation; OCTN/Octn: Organic cation transporter, novel; MATE/Mate: Multidrug and toxin extrusion protein; ABC: ATP-binding cassette; MDR/Mdr: Multidrug resistance; MRP/Mrp: Multidrug resistance-related protein; BCRP/Bcrp: Breast cancer resistance protein.
Pharmaceuticals 14 00908 g001
Figure 2. Phase contrast images of the renal cell lines MDCKII, NRK-52E, IHKE-1 and Caki-1, and of cultured PRPTCs. All cells were cultured on chambered glass slides for 5 days under standard conditions. Under these conditions, MDCKII, NRK-52E, IHKE-1 and PRPTC cells formed a confluent monolayer. In contrast, Caki-1 cells did not form a confluent monolayer and cell-free gaps (white triangles) remained even after extended culture periods. Scale bars = 200 µm.
Pharmaceuticals 14 00908 g002
Figure 3. Relative mRNA expression of tubule marker proteins in the renal cell lines NRK-52E (a), IHKE-1 (b) and Caki-1 (c), and in freshly isolated PRPTCs (d). The mRNA expression of each gene was normalized to GAPDH/Gapdh expression. Each bar represents the mean ± SD (n = 3).
Pharmaceuticals 14 00908 g003
Figure 4. Relative mRNA expression of the tubule marker proteins Vil1 (a), Ggt1 (b), Anpep (c), Alpl (d) and Hk1 (e) in freshly isolated and cultured PRPTCs. The mRNA expression of each gene was normalized to Gapdh expression and is shown in reference to the expression level of each gene in freshly isolated PRPTCs, which was set to 1. Each bar represents the mean ± SD (n = 3), ** p < 0.01.
Pharmaceuticals 14 00908 g004
Figure 5. Relative mRNA expression of tight junction proteins in the renal cell lines NRK-52E (a), IHKE-1 (b) and Caki-1 (c), and in freshly isolated PRPTCs (d). The mRNA expression of each gene was normalized to GAPDH/Gapdh expression. Each bar represents the mean ± SD (n = 3).
Pharmaceuticals 14 00908 g005
Figure 6. Relative mRNA expression of the tight junction proteins Tjp1 (a), Ocln (b), Cldn2 (c), Cldn7 (d) and Cldn10 (e) in freshly isolated and cultured PRPTCs. The mRNA expression of each gene was normalized to Gapdh expression and is shown in reference to the expression level of each gene in freshly isolated PRPTCs, which was set to 1. Each bar represents the mean ± SD (n = 3), * p < 0.05, *** p < 0.001, ns = not statistically different (p > 0.05).
Pharmaceuticals 14 00908 g006
Figure 7. Expression of the tight junction proteins tight junction protein 1, occludin, claudin-2 and claudin-7 in the renal cell lines MDCKII, NRK-52E, IHKE-1 and Caki-1, and in cultured PRPTCs. All cells were cultured on chambered glass slides for 5 days under standard conditions. For immunofluorescent staining, cells were incubated with primary and Cy3-conjugated secondary antibodies (red) and DAPI (blue). Negative controls incubated only with secondary antibodies showed no staining (not shown). Scale bars = 100 µm.
Pharmaceuticals 14 00908 g007
Figure 8. TEER values (a) and apparent permeability coefficients (Papp) of [14C]-mannitol (b) in the renal cell lines MDCKII, NRK-52E, IHKE-1 and Caki-1 and in cultured PRPTCs. All cells were cultured on filter inserts for 5 days under standard conditions. For determination of Papp values, cell monolayers were incubated with 600 µM [14C]-mannitol (12.5 KBq/mL) for 120 min. Each bar represents the mean ± SD of 3 different sets of experiments. A correlation plot of TEER and Papp values is shown in (c).
Pharmaceuticals 14 00908 g008
Figure 9. Relative mRNA expression of transport proteins in the renal cell lines NRK-52E (a), IHKE-1 (b) and Caki-1 (c), and in freshly isolated PRPTCs (d). The mRNA expression of each gene was normalized to GAPDH/Gapdh expression. Each bar represents the mean ± SD (n = 3).
Pharmaceuticals 14 00908 g009
Figure 10. Change in relative mRNA expression of transport proteins in PRPTCs after 5 days in culture. The mRNA expression of each gene was normalized to Gapdh expression and is shown in reference to the expression level of each gene in freshly isolated PRPTCs, which was set to 1. Each bar represents the mean ± SD (n = 3).
Pharmaceuticals 14 00908 g010
Figure 11. mRNA expression levels of transporters in cell lines normalized to GAPDH/Gapdh expression (n = 3). < DL = below detection level, red= low expression intensity, green = high expression intensity.
Pharmaceuticals 14 00908 g011
Table 1. List of cell lines used.
NameSpeciesOriginType
MDCKIIMadin-Darby
canine kidney II
dogKidney
epithelium
immortalized
NRK-52ENormal rat kidney-52EratKidney
epithelium
immortalized
IHKE-1Immortalized human kidney epithelial-1humanFetal kidney corteximmortalized
Caki-1Carcinoma kidneyhumanKidney carcinomaimmortalized
PRPTCPrimary rat proximal tubule cellsratProximal tubuleprimary
Table 2. Summary of expression levels of the investigated tight junction proteins in the renal cell lines MDCKII, NRK-52E, IHKE-1 and Caki-1, and in PRPTCs. Rating of the immunostainings was as follows: +, distinct signal at the cell–cell borders; (+), diffuse signal or signal predominantly in cytoplasm; −, no signal detected.
ProteinCell LinesPrimary Cells
MDCKIINRK-52EIHKE-1Caki-1Cultured
PRPTCs
TJP1+++(+)+
Occludin+++(+)+
Claudin-2+(+)(+)
Claudin-7++
Claudin-10
Table 3. List of primers used for qPCR (Rattus norvegicus).
GeneAccession Number (RefSeq)For/RevSequence (5′-3′)Amplicon Length (bp)
Abcb1aNM_133401.1forCATCTTGGCGGACCTTACGGAGG183
revACCTGCATAGCGAAACATTGTGAGC
Abcc2NM_012833.1forGCGCCCTGGGTGACTGACAAG166
revCAGTCCTGCCCACTACGCCG
Abcc4NM_133411.1forACAGCTTACGGCTACGCGGC181
revGGCCCGTGGTTGTCTTCCCC
Abcg2NM_181381.2forAGGCGGAGGCAAGTCTTCGTTG103
revATTGGCAGGTTGAGGTGCCC
AlplNM_013059.1forGTGGAAGGAGGCAGGATTGACCAC116
revTTCTGGGAAGTCATGGTGCCCG
AnpepNM_031012.1forTCTGCCGCTGAGCAACACCC135
revAGATAGCGCTTCATGGGGCCG
Cldn10NM_001106058.1forTGTTCCATGACGGGCTGTTCCC96
revGGCAGCCCCCAATTCATACTTTTGC
Cldn11NM_053457.2forTTCTCCCCTGTATCCGAATG157
revAAGCTCACGATGGTGATCTC
Cldn2NM_001106846.2forAGAACAGCTCCGTTTTCTAGATGCC160
revTGTTCGCTTGTCTTTTGGCTGCG
Cldn7NM_031702.1forTGGCCATGTTTGTCGCCACGATG126
revCCAAAGCAGCAAGACCTGCCACG
GapdhNM_017008.3forATCTTCTTGTGCAGTGCCAGCCTCG115
revACTTTGTCACAAGAGAAGGCAGCCC
Ggt1NM_053840.2forTGAGCTGGCACACCAACGGC169
revCCGGCAGAACACCTCGCACA
Hk1NM_012734.1forACACCTGCTTTTCCGCATCCCC124
revAGCCGCATGGCGTACAGATAC
OclnNM_031329.2forCGCCTCTGGTACCTGAAGTAGCCC159
revGGTCTGGGTCTGTCCTCTTCGCC
Slc15a1NM_001079838.1forTCTCTGCCTCTCTCTCACTTGCC166
revTGTGACAGAGAAGACCACCTCGCC
Slc15a2NM_031672.1forAAGAGGAACATGCAGAGGCACGG81
revACGTGGAAATCAAGCTCCCCGC
Slc22a1NM_012697.1forGCTGATGGAAGTTTGGCAAGCCC158
revTGGCCTTTGATTTCCTCCTCCCC
Slc22a12NM_001034943.1forAGGAACCGAACGGGAACCAAGC107
revGCCAAAGGCAAACCAGCACAGC
Slc22a2NM_031584.1forACTGGTTGTATTTGCTGTGGTTGGC120
revCTTGGCCTCTGCATATTCTCGGC
Slc22a24NM_173302.1forTACATGGGCCGCAGAACAACCC99
revACGCGGGATCTGCATTTCTTGAGTC
Slc22a4NM_022270.1forAGGCGGGAAGCATGAGGGACTATG195
revACGCGCTGCTCAAGTTCACG
Slc22a5NM_019269.1forTCCTGTGGCTGACCATATCAGTGGG132
revACAGCCAGGCCAACACATAGGC
Slc22a6NM_017224.2forCCACAGTGATTCGGCAGACAGGC148
revGCACTGGCGACCACAGGGAC
Slc22a7NM_053537.2forGGCTGTTGCTGCCCAAAGTTGC135
revCCTCCTGGGTACTCTTCCTCTCCAC
Slc22a8NM_031332.1forTTCCCAATGACACCCAGAGGGC101
revGCTGCACACCAAGTCCCACTCTATC
Slc47a1NM_001014118.2forCAGCTTCCTGAGTGGTATCCTTGGC139
revTGCACCCAACGCATTTCCCACC
Slco1a1NM_017111.1forGATGTGTGATTATGGGCCTGGGG157
revTGCGTTGGCTTTAAGGTCTGTGTTC
Slco1a3NM_030837.1forCACTACCTCATTTCCTCATGGGCCG139
revACACACTCTGCTGGGTCTTGCG
Slco4c1NM_001002024.1forCCACGGGATTTGCCACGTTTTTACC89
revAACAGCCCCTCCAAGTGTTGCC
Tjp1NM_001106266.1forTTCAGTTCGCTCCCATGACAGGC132
revTCCTCTCTGCTCCGGAGACTGCC
Vil1NM_001108224.2forTGCCCAATCGGACCTCAGGC161
revGCGCCACACCTGCACTTCCC
Table 4. List of primers used for qPCR (Homo sapiens).
GeneAccession Number (RefSeq)for/revSequence (5′-3′)Amplicon Length (bp)
ABCB1NM_000927.4forCTCTTTGCCACAGGAAGCCTGAGC175
revCTTCAAGATCCATTCCGACCTCGC
ABCC2NM_000392.3forAACGCACATGAAGAGAGAGCTGC151
revTTCAACATCTTCCAGGACAAGGGC
ABCC4NM_001105515.1forACTTCAGAGCTGGTGCTCACTGG111
revTGTTTGCCCAGTATGAAAGCCACC
ABCG2NM_001257386.1forCGATATGGATTTACGGCTTTGCAGC191
revACAATCATACAAGCCAAGGCCACG
ALPLNM_000478.4forCAGGGATAAAGCAGGTCTTGGG102
revCTTTCTCTTTCTCTGGCACTAAGG
ANPEPNM_001150.2forACAGCCAGTATGAGATGGACAGC104
revCACCACCTTTCTGACATTGCCC
CLDN10NM_182848.3forTATTCATACTGTCAGGGCTGTGC135
revCTGCCCATCCAATAAACAGAGCG
CLDN11NM_005602.5forCTGACTGTTCTTCCCTGCATCC101
revCAGAGAGCCAGCAGAATGAGC
CLDN2NM_001171092.1forTGGGAAGGCTAGGGAGTCAAAGGG197
revTAGAAGACCTGAATGGCCTGTGAGC
CLDN7NM_001185022.1forGGACAGTGGGTCGCCGAGAGC182
revAAGGGTTTGGGCCAGGTGAATGC
GAPDHNM_001256799unknown a95
NM_002046unknown a95
GGT1NM_001032364.2forCCCAGAAGTGAGAGCAGTTGG95
revCTGCACCCGCTATGATGTCC
HK1NM_000188.2forCAGATCGAGAGTGACCGATTAGC170
revATCTTATCCACAACCGCAGCC
OCLNNM_001205254.1forAGTTGCGGCGAGCGGATTGG113
revAGGTGGACTTTCAAGAGGCCTGG
SLC15A1NM_005073.3forATGAAGTCGGTGCTTCAGGCAGG111
revAATGTACTCGGCCCACTGTTTGC
SLC15A2NM_001145998.1forAGCCATCTCCGACAATCTGTGGC186
revAACAGAGGCTGCTGAAGGCATGG
SLC22A1NM_003057.2forCCACATTCGTCAGGAACCTCGG170
revTGGAAGAAGTAGCGTCACTCCCG
SLC22A12NM_144585.2forATCTCCACGTTGTGCTGGTTCGC129
revCATCTTGGCTGGGATGTCCACG
SLC22A2NM_003058.3forTAGCAGACAGGTTTGGCCGTAAGC144
revAGCCTGCTTTGCTGACCAGTCC
SLC22A4NM_003059.2forTCCATTGGTCTGGTCATGCTGGG188
revAGCATTCTGTTGTAAGCACCGAGG
SLC22A5NM_003060.3forGCCAATGGGATTGTTGTGCCTTCC165
revGCCCACTGATATGGTCATCCACAGC
SLC22A6NM_004790.4forCATCTACGGTGCTGTTCCTGTGGC158
revGCGTCTGTTTCCCTTTCCTGGG
SLC22A7NM_006672.3forTAGCTGTCACCCTGCCTTGTGC181
revACTTTGCTCACAGCCTCCTGGC
SLC22A8NM_001184732.1forAGAAAGGCTCAGCTTGGAGGAGC128
revGGGAAAGACAGAAGGTCATGCGGC
SLC22A9NM_080866.2forCCGAGTGGGCAACACACAGATTCC183
revCAGACTCTAGCAGCCAACTTGAGG
SLC47A1NM_018242.2forAGCTTCCTCAGTGGCATCCTCG138
revAGCACCCAGAGCGTTTCCTACC
SLC47A2NM_001099646.1forCGGTGGCCTTTGTCAATGTCTGC190
revATGTGCTGGGTGTTGAGGAAGAGC
SLCO4C1NM_180991.4forACTGTCGCTGTCCGAGTTTGAGG135
revACTACAATACCTTGCGTGACGGC
TJP1NM_003257.3forTGCCATTACACGGTCCTCTGAGC155
revCTGCTTTCTGTTGAGAGGCTGGC
VIL1NM_007127.2forCATTGTGGTGAAGCAGGGACACG154
revTGTGACCTCAGCAGTGATCTGGC
a QuantiTect® Primer Assay Hs_GAPDH_1_SG (Qiagen, Hilden, Germany) was used.
Publisher’s Note: MDPI stays neutral with regard to jurisdictional claims in published maps and institutional affiliations.

