Article

Broad-Spectrum Anticancer Activity and Pharmacokinetic Properties of a Prenyloxy-Substituted Indeno[1,2-b]indole Derivative, Discovered as CK2 Inhibitor

1
Institut für Pharmazeutische und Medizinische Chemie, PharmaCampus, Westfälische Wilhelms-Universität Münster, Corrensstr. 48, 48149 Münster, Germany
2
Department of Pharmacology, Faculty of Medicine, Assiut University, Assiut 71515, Egypt
3
Small Molecules for Biological Targets Team, Centre de Recherche en Cancérologie de Lyon, Centre Léon Bérard, CNRS 5286, INSERM 1052, Université Claude Bernard Lyon 1, Univ Lyon, 69373 Lyon, France
4
EA 4446 Bioactive Molecules and Medicinal Chemistry, Université Claude Bernard Lyon 1, Univ Lyon, 69373 Lyon, France
*
Authors to whom correspondence should be addressed.
They contributed equally to this work.
Pharmaceuticals 2021, 14(6), 542; https://doi.org/10.3390/ph14060542
Submission received: 29 April 2021 / Revised: 28 May 2021 / Accepted: 2 June 2021 / Published: 5 June 2021
(This article belongs to the Section Medicinal Chemistry)

Abstract

:
Protein kinase CK2 is involved in regulating cellular processes, such as cell cycle, proliferation, migration, and apoptosis, making it an attractive anticancer target. We previously described a prenyloxy-substituted indeno[1,2-b]indole (5-isopropyl-4-(3-methylbut-2-enyloxy)-5,6,7,8-tetrahydroindeno[1,2-b]indole-9,10-dione (4p)) as a very potent inhibitor of CK2 holoenzyme (IC50 = 25 nM). Here, we report the broad-spectrum anticancer activity of 4p and provide substantial progress on its pharmacokinetic properties. Using a cell-based CK2 activity assay and live-cell imaging of cultured A431, A549, and LNCaP cancer cell lines, cellular CK2 target engagement was shown as well as strong antiproliferative, anti-migratory and apoptosis-inducing effects of 4p. Furthermore, evidence was found for the ability of 4p to disrupt A549 spheroid cohesion. A series of LC-MS/MS experiments revealed high and rapid cellular uptake (intracellular concentration is approximately 5 µM after 1 h incubation) and low metabolic stability of 4p. These results point to the value of 4p as a potent CK2 inhibitor with promising anticancer activities and should trigger future medicinal chemistry efforts to improve the drug-like properties of this compound.

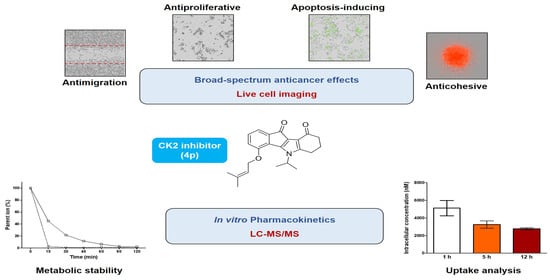
Graphical Abstract

1. Introduction

Human protein kinase CK2, originally named “Casein Kinase II” [1], is a ubiquitously expressed serine/threonine kinase that phosphorylates several hundreds of substrates in eukaryotic cells [2,3,4]. This highly pleiotropic kinase is involved in the regulation of numerous cellular processes, including, among others, cell proliferation, cell survival, as well as gene transcription and translation [5,6,7,8,9,10]. Constitutive CK2 activity is essential to the cell, with knockouts of both the catalytically active CK2α and the regulatory CK2β subunits found lethal during embryonic development [11,12,13]. Besides its studied roles in diseases, such as viral infections [14,15], chronic inflammation [16], and neurodegenerative disorders [17], CK2 is known to be closely associated with cancer.
In cancer cells, upregulation of CK2 expression/activity allows them to proliferate strongly and circumvent apoptosis, and therefore these malignant cells become dependent on high CK2 activity for their survival. Treatment with CK2 inhibitors aims to downregulate CK2 activity in cancer cells to basal constitutive levels leading to antiproliferative and proapoptotic effects in various malignancies [18,19,20,21]. On the other hand, normal cells with constitutive CK2 activity exhibit only a modest apoptosis-inducing effect in response to downregulation of CK2 [21,22]. The continuously growing body of evidence for CK2 oncogenic potential makes this protein kinase one of the most studied targets for cancer therapy in recent decades [23,24,25]. Furthermore, the cellular level of this enzyme can serve as a prognostic biomarker in tumor diagnostics [26].
The indeno[1,2-b]indole scaffold (Figure 1a) is known to be an interesting framework for developing pharmacologically active compounds with anticancer activities [27,28]. Several indeno[1,2-b]indole derivatives have been reported as promising type I inhibitors of CK2 [29,30,31,32]. The compound (5-isopropyl-4-(3-methylbut-2-enyloxy)-5,6,7,8-tetrahydroindeno[1,2-b]indole-9,10-dione) previously described by Gozzi et al. [33] and known as 4p (Figure 1b), was shown to possess remarkably high in vitro inhibitory activity toward CK2 holoenzyme among indeno[1,2-b]indole derivatives. This interesting feature of 4p triggered a follow-up structural study to experimentally determine the prerequisites for the observed high-affinity binding of 4p to CK2 [34]. X-ray structures of 4p with human CK2α or its paralog CK2α’ revealed an unusual “hydrophobic-out/oxygen-in” binding mode mainly mediated by the hydrophobic interactions through the prenyloxy group and the isopropyl substituent of the aromatic four-ring system (Figure 1b) [34]. In contrast, 4p exhibited very weak inhibition of the breast cancer multidrug resistance ABCG2 transporter, an off-target for several protein kinase inhibitors, suggesting that this compound may have a satisfactory CK2 selectivity profile [33,34]. Furthermore, 4p was shown in these studies to exhibit a distinct antiproliferative effect at 20 μM against the breast cancer cell line MCF-7 and to have a favorable intestinal absorption profile as derived from the high apparent permeability coefficient Papp in Caco-2 assay [33,34].
Although 4p seems to be a promising CK2 targeting lead structure, there has been no thorough investigation of the compound’s anticancer activities, its cellular target engagement, or pharmacokinetic properties. In this work, we evaluated the effects of 4p on three different cell lines, namely A431, A549, and LNCaP, which are representative models of skin, lung, and prostate cancers, respectively. These cell lines were found to be dependent on CK2 for their survival as retrieved from the cancer Dependency Map project (DepMap) database (https://depmap.org/portal, accessed on 15 April 2021). The ability of 4p to inhibit cellular CK2 activity in these cell lines and the subsequent effects on cell proliferation, apoptosis, and migration were evaluated. Furthermore, the impact of 4p on the integrity of 3D multicellular spheroids from the A549 cell line was monitored. We also analyzed the cellular uptake of 4p by A431 cells and studied its metabolic stability in vitro to get valuable insight into the pharmacokinetic properties of this compound.

2. Results and Discussion

2.1. Cellular Target Engagement

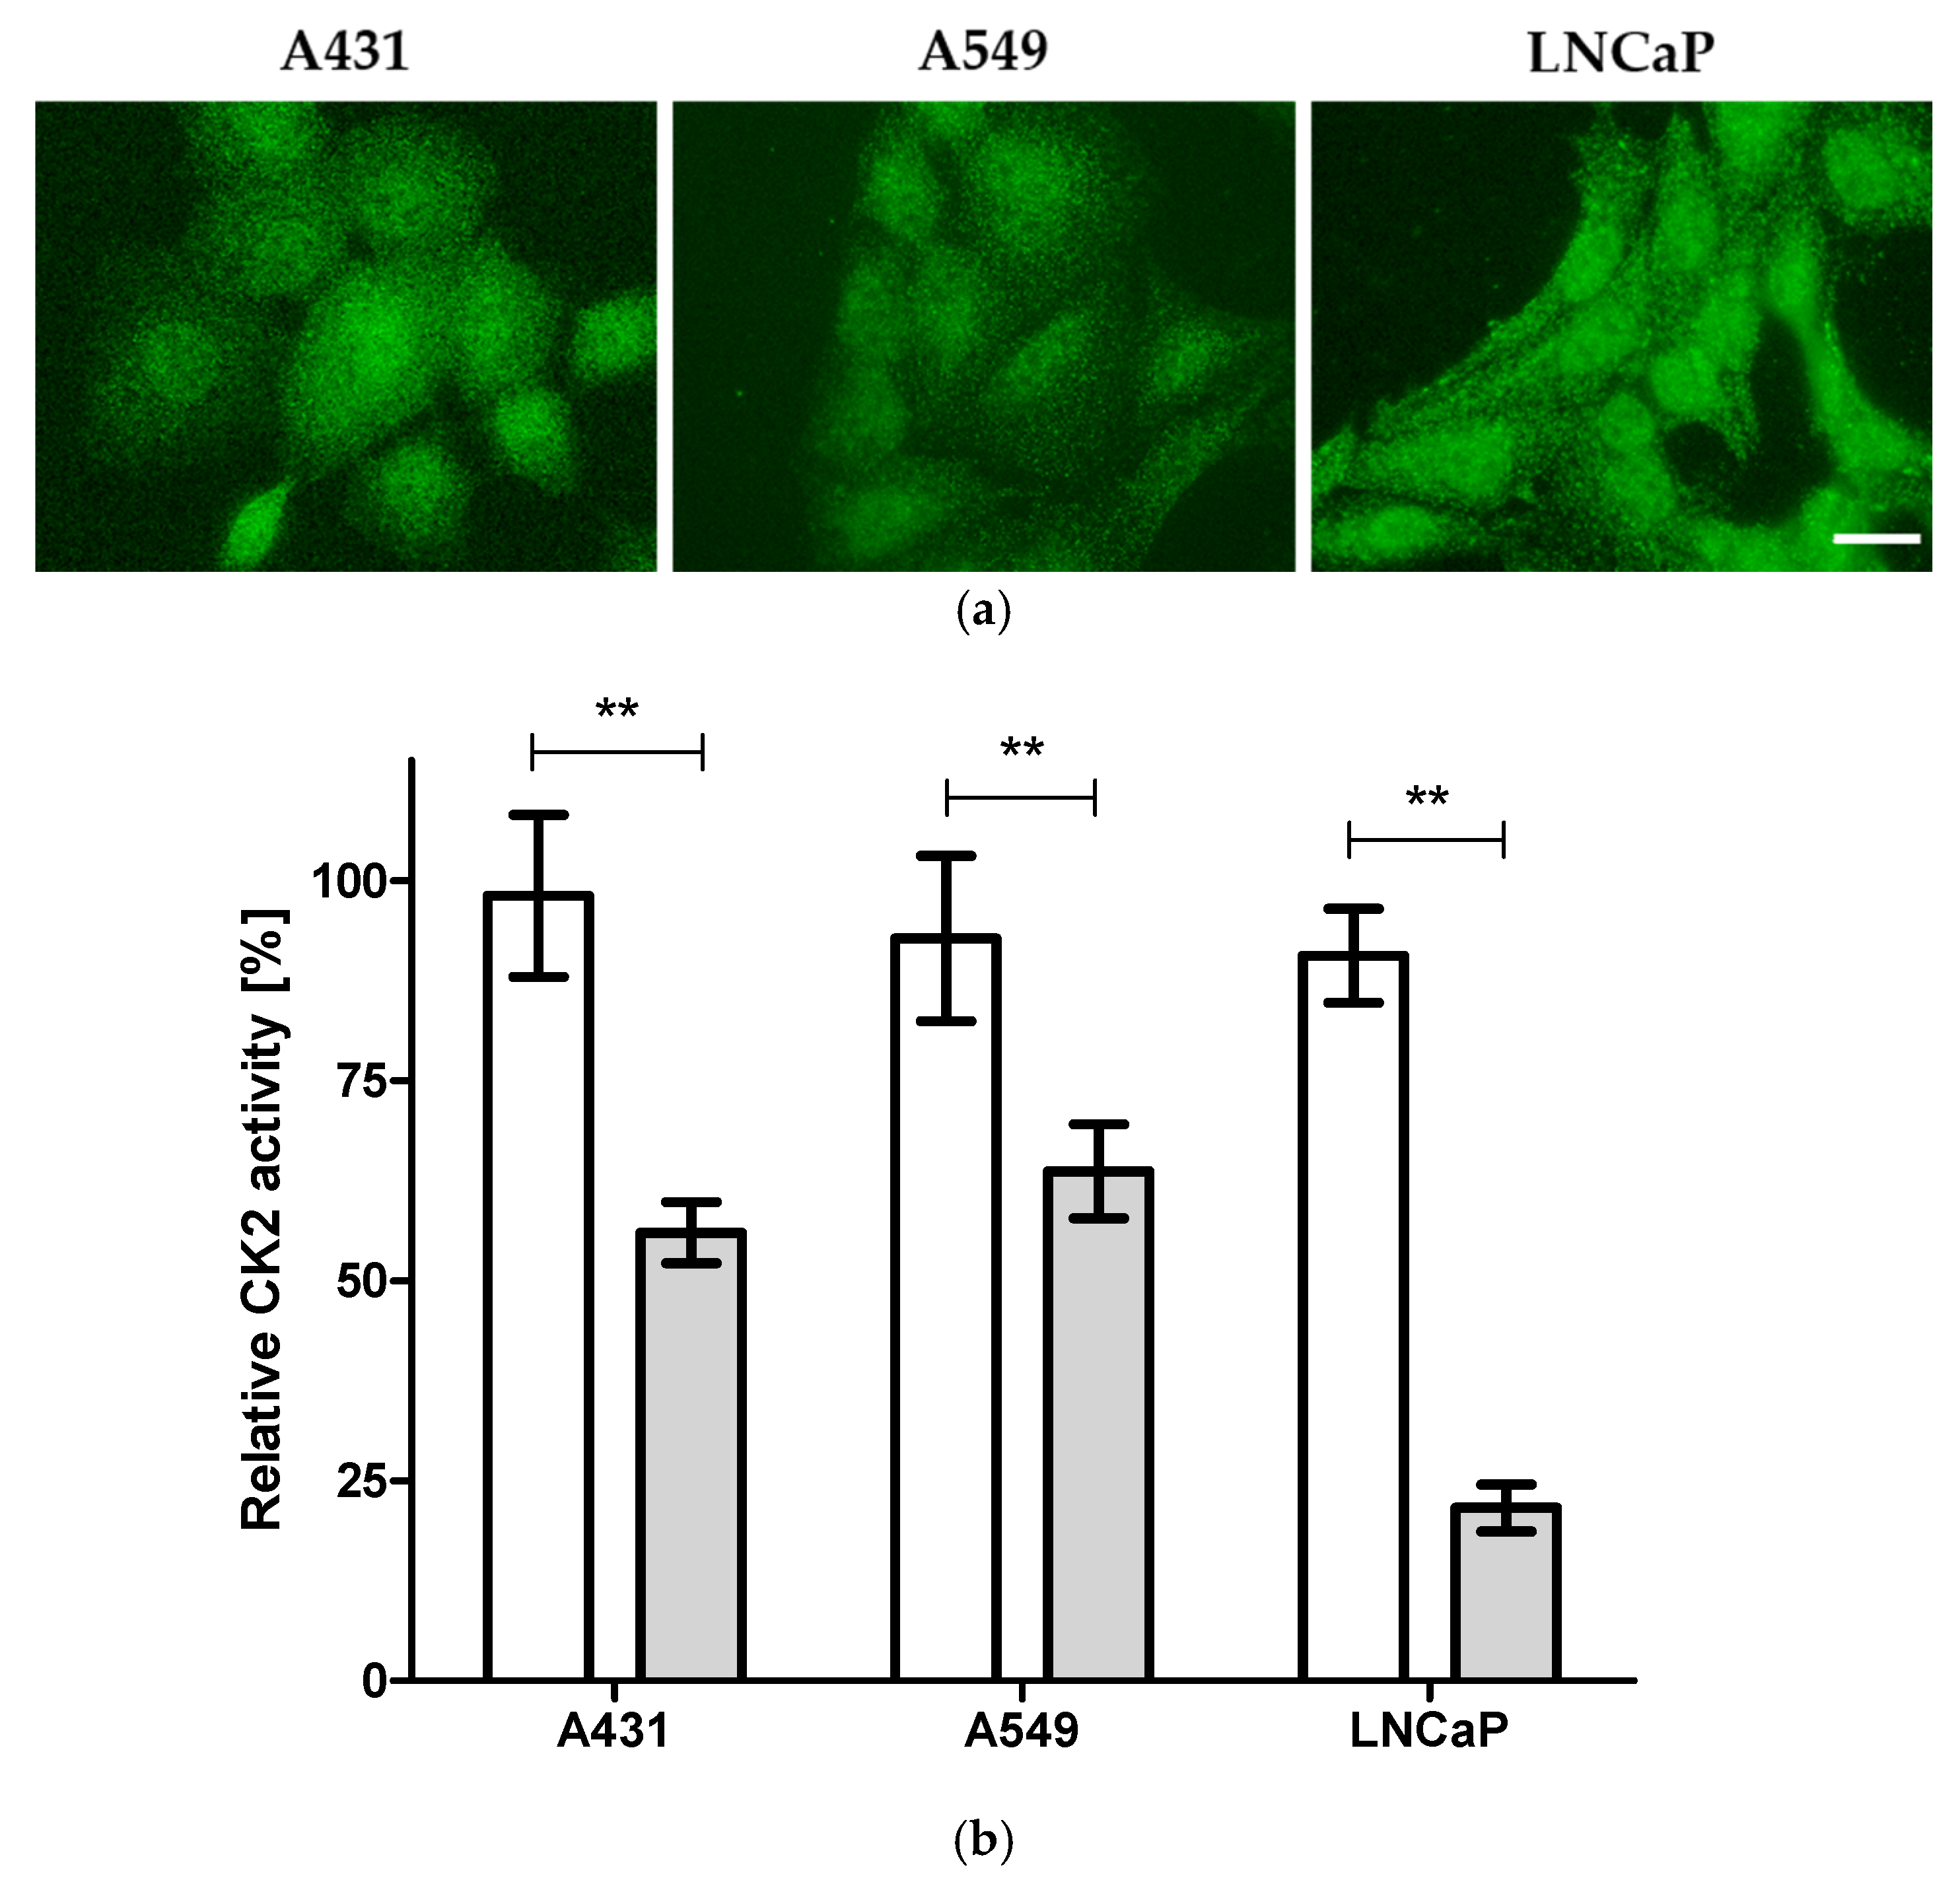
First, the suitability of A431, A549, and LNCaP cell lines to study the cellular effects of CK2 inhibitors was experimentally verified by the examination of the expression of CK2α in these cell lines using immunocytochemistry. The three cell lines demonstrated strong ubiquitous CK2α expression (Figure 2a), supporting the notion that these cell lines are dependent on CK2 for their survival. Next, to determine the cellular target engagement of protein kinase CK2 by 4p, cultured cells from A431, A549, and LNCaP cell lines were treated with 4p at 1 and 20 µM or vehicle (1% DMSO) for 24 h followed by harvesting and lysing the cells. CK2 activity in the soluble fraction of the cell lysates was determined in a capillary electrophoresis-based CK2 activity assay as described before [35] utilizing the fluorescently labeled CK2 substrate FITC-RRRDDDSDD-NH2 (A representative electropherogram is shown in the Supplementary Materials, Figure S1). The ratio of the area under the curve (AUC) values for the peak of the substrate and the corresponding peak of the phosphorylated product was determined for each sample to calculate relative CK2 activity. Ratios for 4p treated samples were then normalized to those of control samples. As shown in Figure 2b, lysates from cells treated with 1 µM 4p demonstrated very weak inhibition of CK2 (<10% for all cell lines), whereas treatment with 20 µM led to statistically significant, but variable, inhibition values (44, 36, and 78% for A431, A549, and LNCaP cells, respectively). These results indicate that the determined intracellular CK2 inhibition by 4p is, at least, partially involved in mediating the biological effect in these cell lines. Nevertheless, there must be other off-target effects for 4p contributing to any observed cellular effects as well.

2.2. Assessment of Broad-Spectrum Anticancer Activities

2.2.1. Inhibition of Cell Proliferation

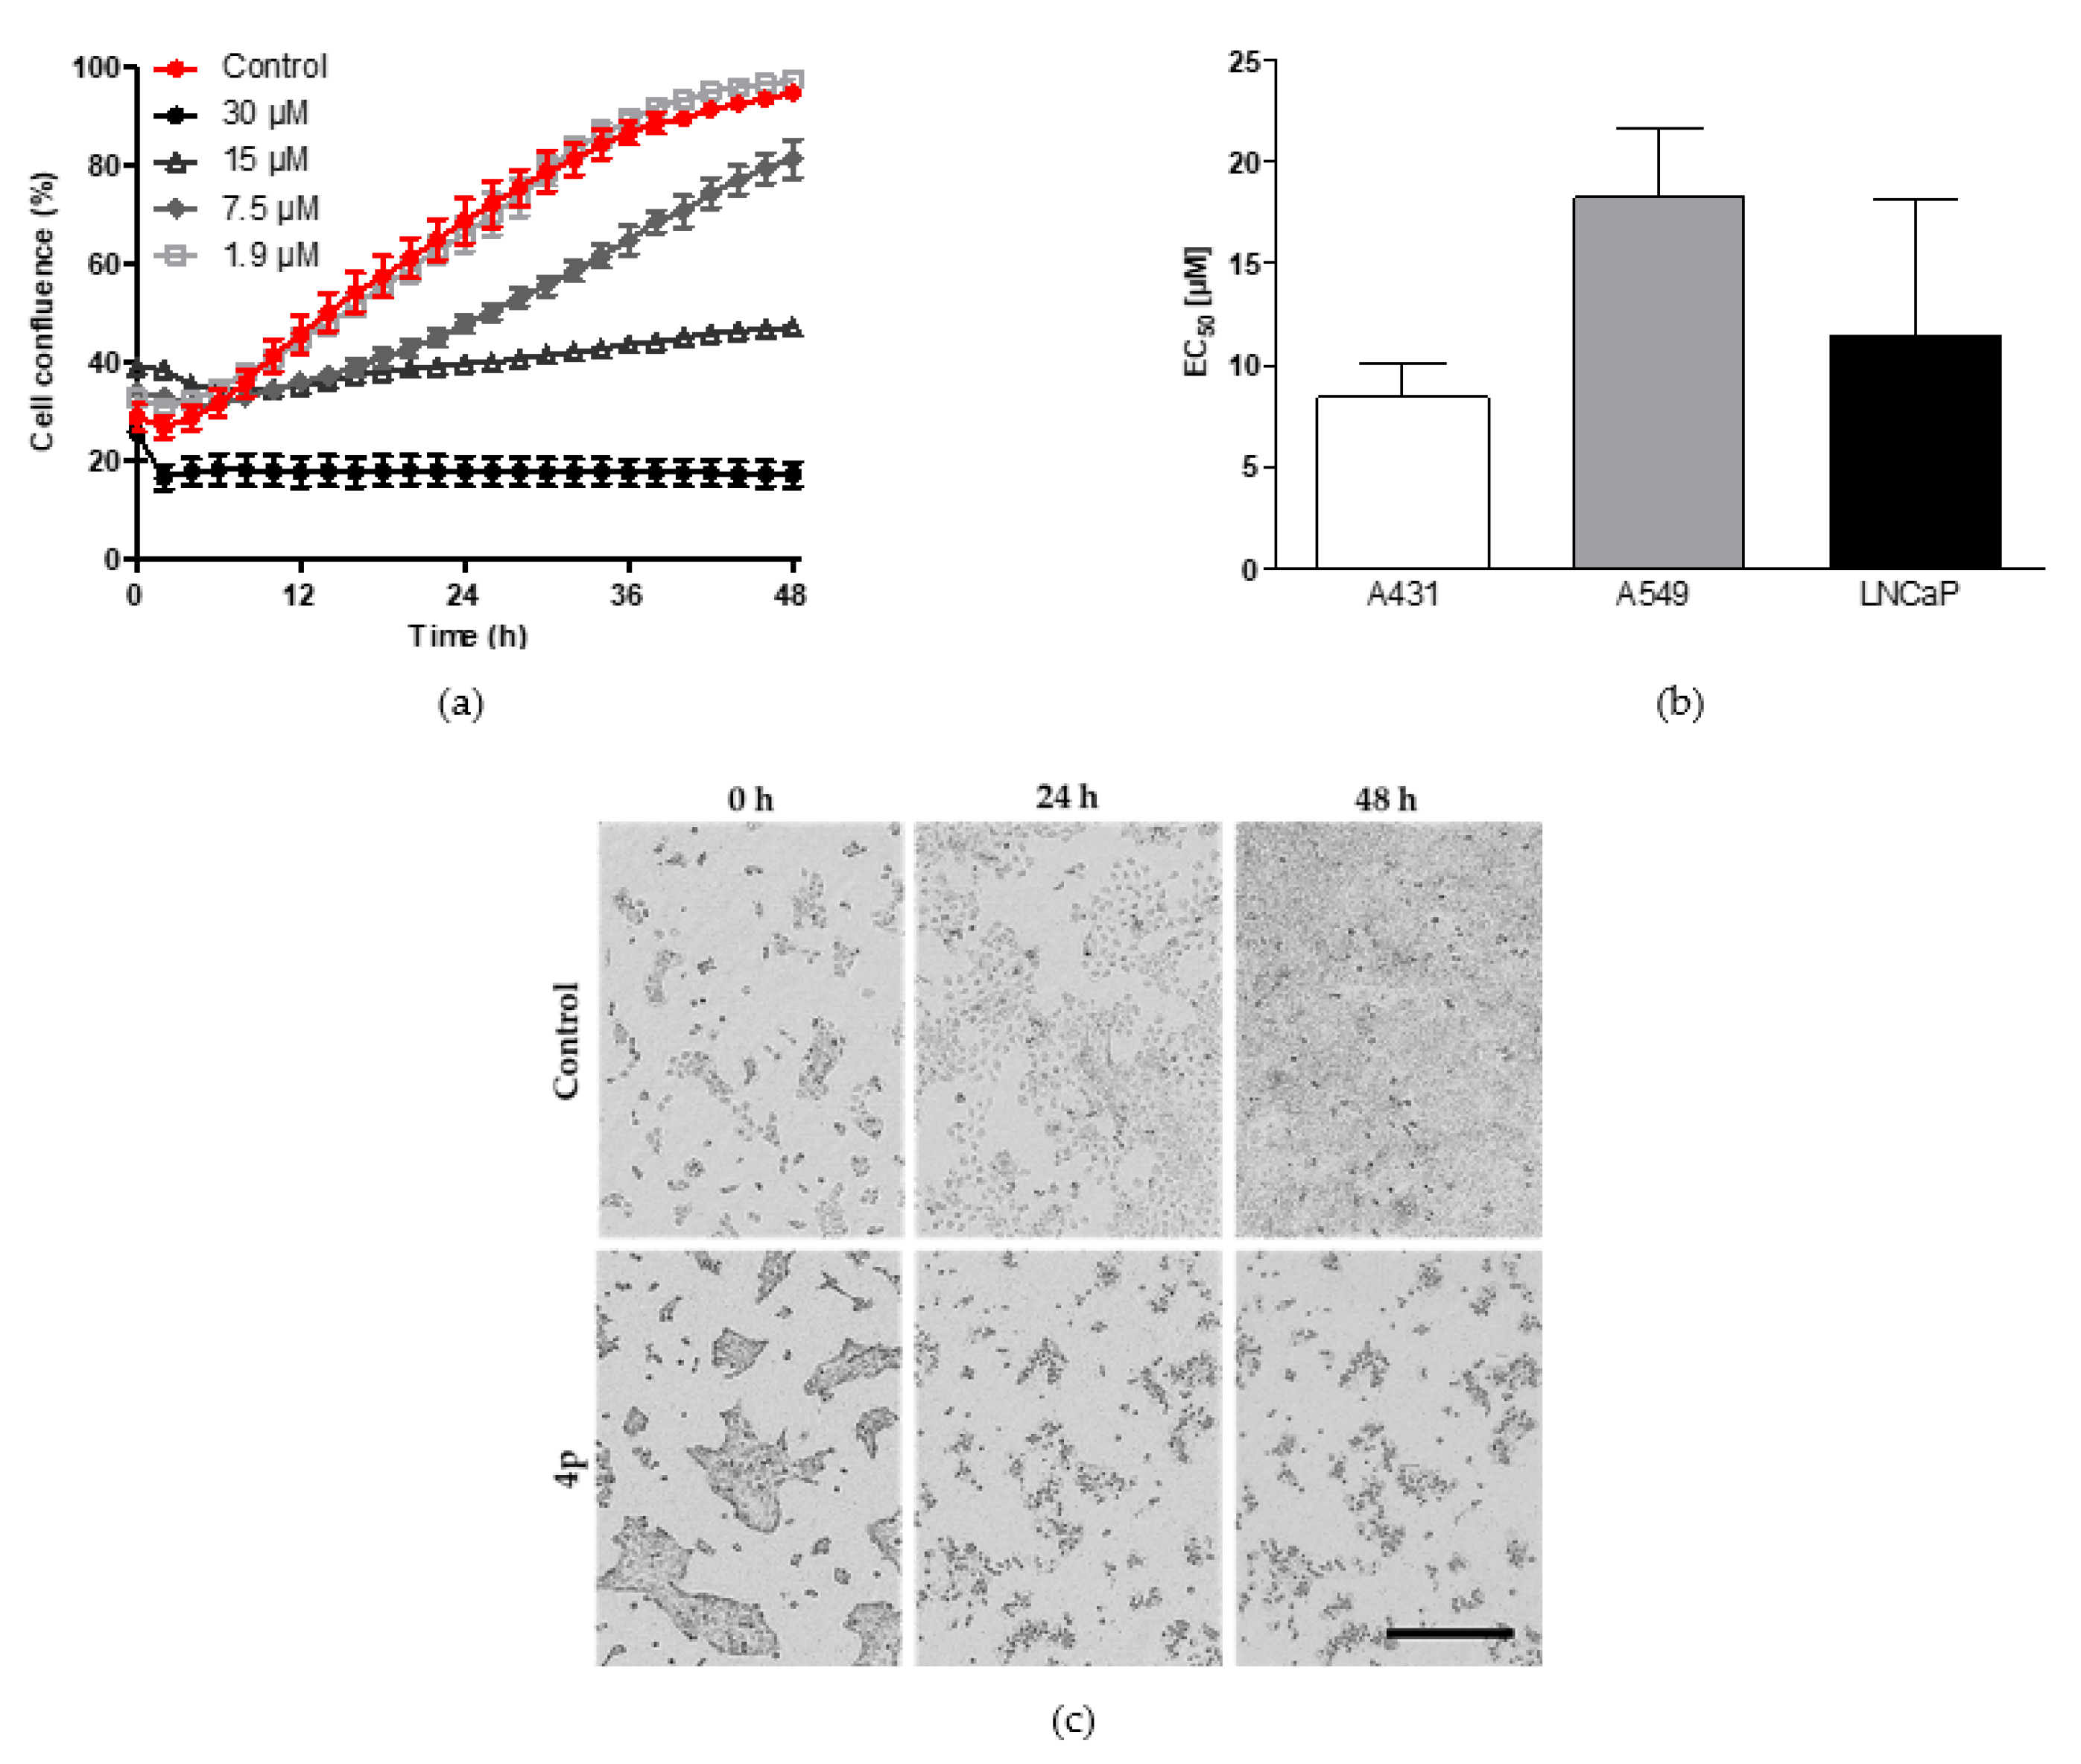
We previously showed the ability of 4p to strongly reduce the proliferation rate of MCF7 breast cancer cell line using EdU-click assay suggesting its potential anticancer activity [33]. To comprehensively investigate the biological effects of 4p on cancer cells, we examined the antiproliferative effects of this compound on cultured A431, A549, and LNCaP cells. Here, the confluence of cultured cells in 96-well plates was monitored for 48 h in a live cell imaging system (IncuCyte®, Sartorius, Michigan, MI, USA) following treatment with increasing concentrations of the compound (0.47–40 µM) and compared to vehicle-treated cells. As shown in Figure 3a, dose-dependent inhibition of the proliferation of A431 cells was observed, with the highest concentration applied (30 µM) leading to complete inhibition. Similar observations were made for treated A549 and LNCaP cells (Supplementary Materials, Figure S2). To determine the half-maximal effective concentration (EC50) values of 4p in the tested cell lines, the area under the curve (AUC) values, determined for the different concentrations and normalized to control value, were plotted against the corresponding concentrations. Nonlinear regression analysis of the resulting dose-response plots was performed from which the EC50 values were obtained. The performed analysis demonstrated EC50 values of 8.4 ± 2.8 µM for A431 cells, 18.2 ± 6.0 µM for A549 cells, and 11.4 ± 6.8 µM for LNCaP cells (Figure 3b). Statistical analysis of the determined EC50 values by one-way ANOVA indicated no significant difference. Furthermore, we observed distinct morphological changes of all treated cells over the course of treatment (Figure 3c, Supplementary Materials, Figure S3).
Notably, we also analyzed the antiproliferative effect of 4p on non-cancerous cells, namely Human Umbilical Vein Endothelial Cells (HUVECs), prepared and provided by the lab of Prof Gerke, Center for Molecular Biology of Inflammation, University of Münster. The antiproliferative EC50 of 4p in HUVECs was determined in an analogous manner to those determined for the cancer cell lines A431, A549, and LNCaP and was found to be 10.6 ± 4.9 µM. This EC50 value of 4p in HUVECs is in the same range as the EC50 values determined for A431, A549, and LNCaP cells. Although the obtained results may suggest high toxicity of 4p, the different origin and sensitivity of HUVECs have to be considered before drawing conclusions on the toxicity of 4p. This is supported by our observation that the reference CK2 inhibitor Silmitasertib [36], which was intensively evaluated for its safety in preclinical studies and has reached clinical trials [37,38], had an EC50 = 10.7 ± 1.5 µM on HUVECs in our experiments.
Taken together, these results indicate the dose-dependent and strong antiproliferative effects induced by 4p in different types of cancer cells known to be overexpressing CK2. Thus, the observed antiproliferative effects of 4p are likely attributed to cellular CK2 inhibition as derived from the cellular target engagement data shown in Figure 2b.

2.2.2. Induction of Apoptosis

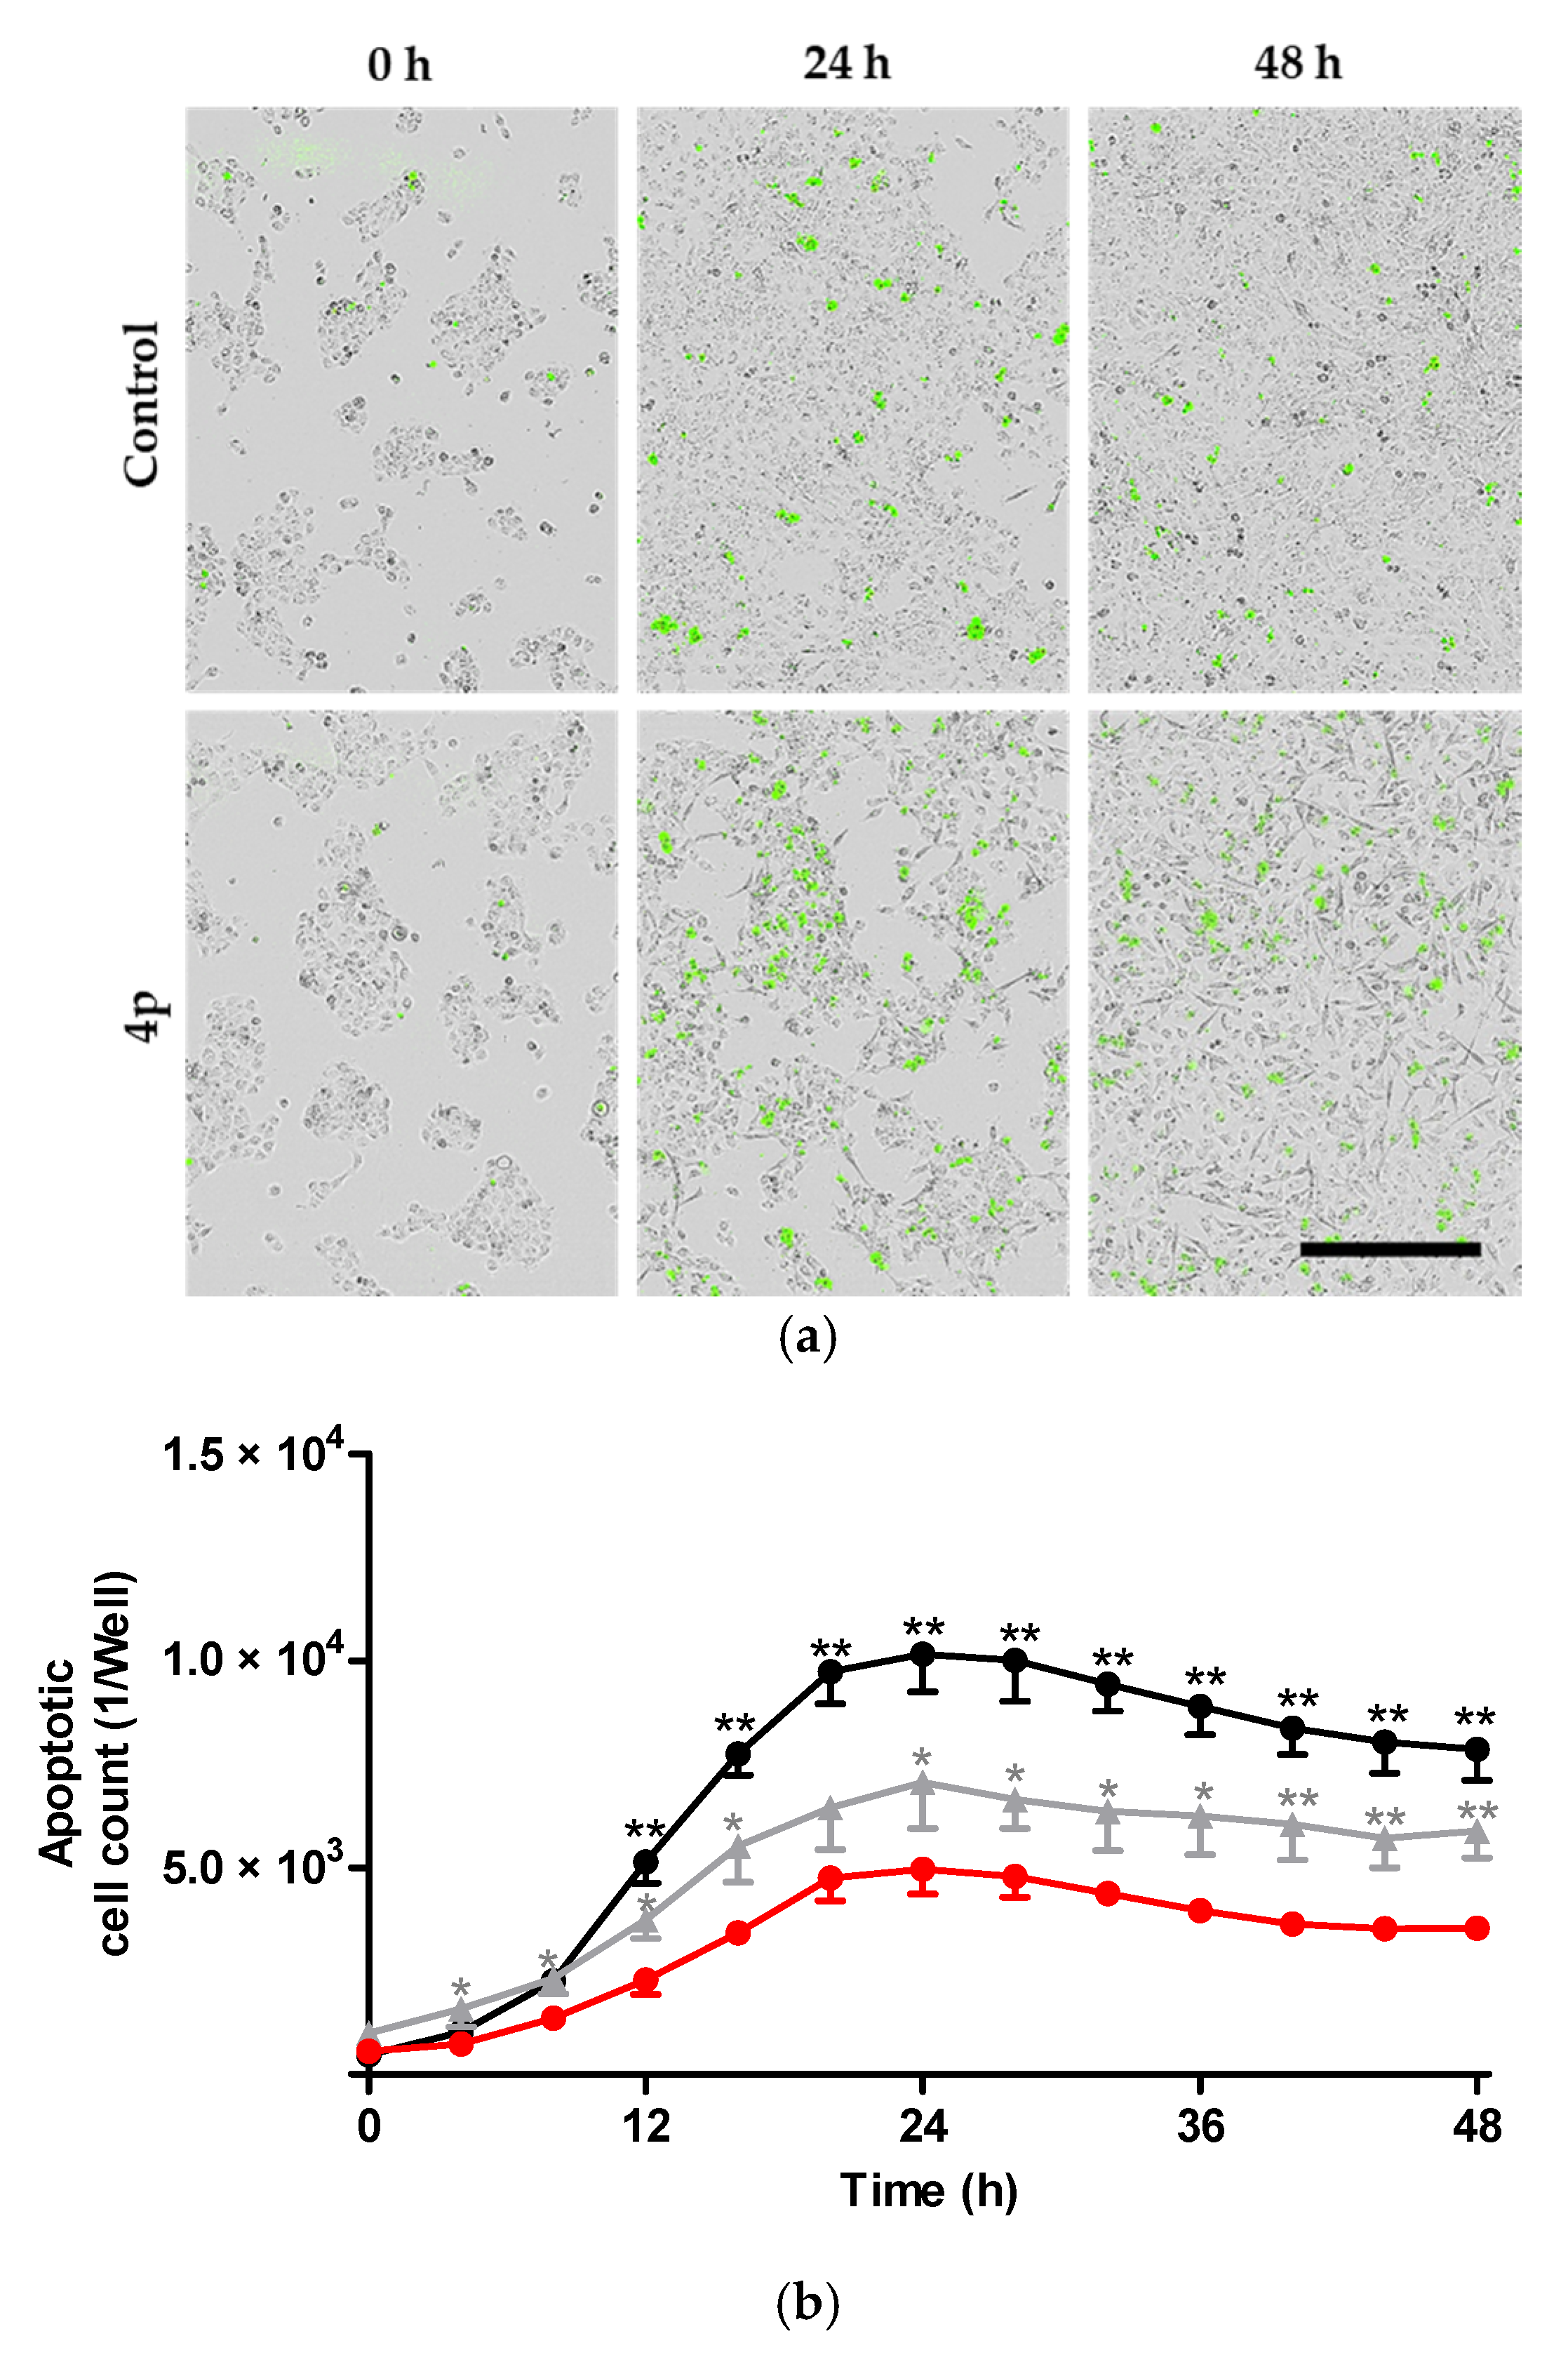
Next, we investigated whether apoptosis represents the main mechanism of A431 cell death following treatment with 4p. For this purpose, an inert non-fluorescent caspase-3/7 substrate that freely crosses the cell membrane was added to the treated cultured cells. Activated caspase-3/7 in apoptotic cells can cleave the added substrate and release a green DNA-binding fluorescent dye (Figure 4a). Cells showing fluorescently-labeled nuclei were counted using IncuCyte® S3 live-cell imaging system reflecting the extent of apoptotic events in wells of the treated cells. Here, the number of apoptotic cells showed a slight but statistically significant increase after treatment with 1 µM of 4p. On the other hand, cells treated with 20 µM showed an almost two-fold increase in apoptotic events within the first 24 h following treatment as compared to vehicle control-treated cells (Figure 4b). These results reflect a high degree of activation of caspase 3/7 in response to cell death signals triggered by treatment of A431 cells with 4p. In contrast, our previous observations in MCF7 cells revealed characteristic morphological features of apoptosis upon treatment with 100 µM, but not with 20 µM, of 4p [33]. This discrepancy might be due to the fact that activated caspase-3/7 measured in the current study can accurately reflect early apoptotic events in cells, unlike the subjective examination of changes in nuclear size/shape.

2.2.3. Inhibition of Cell Migration

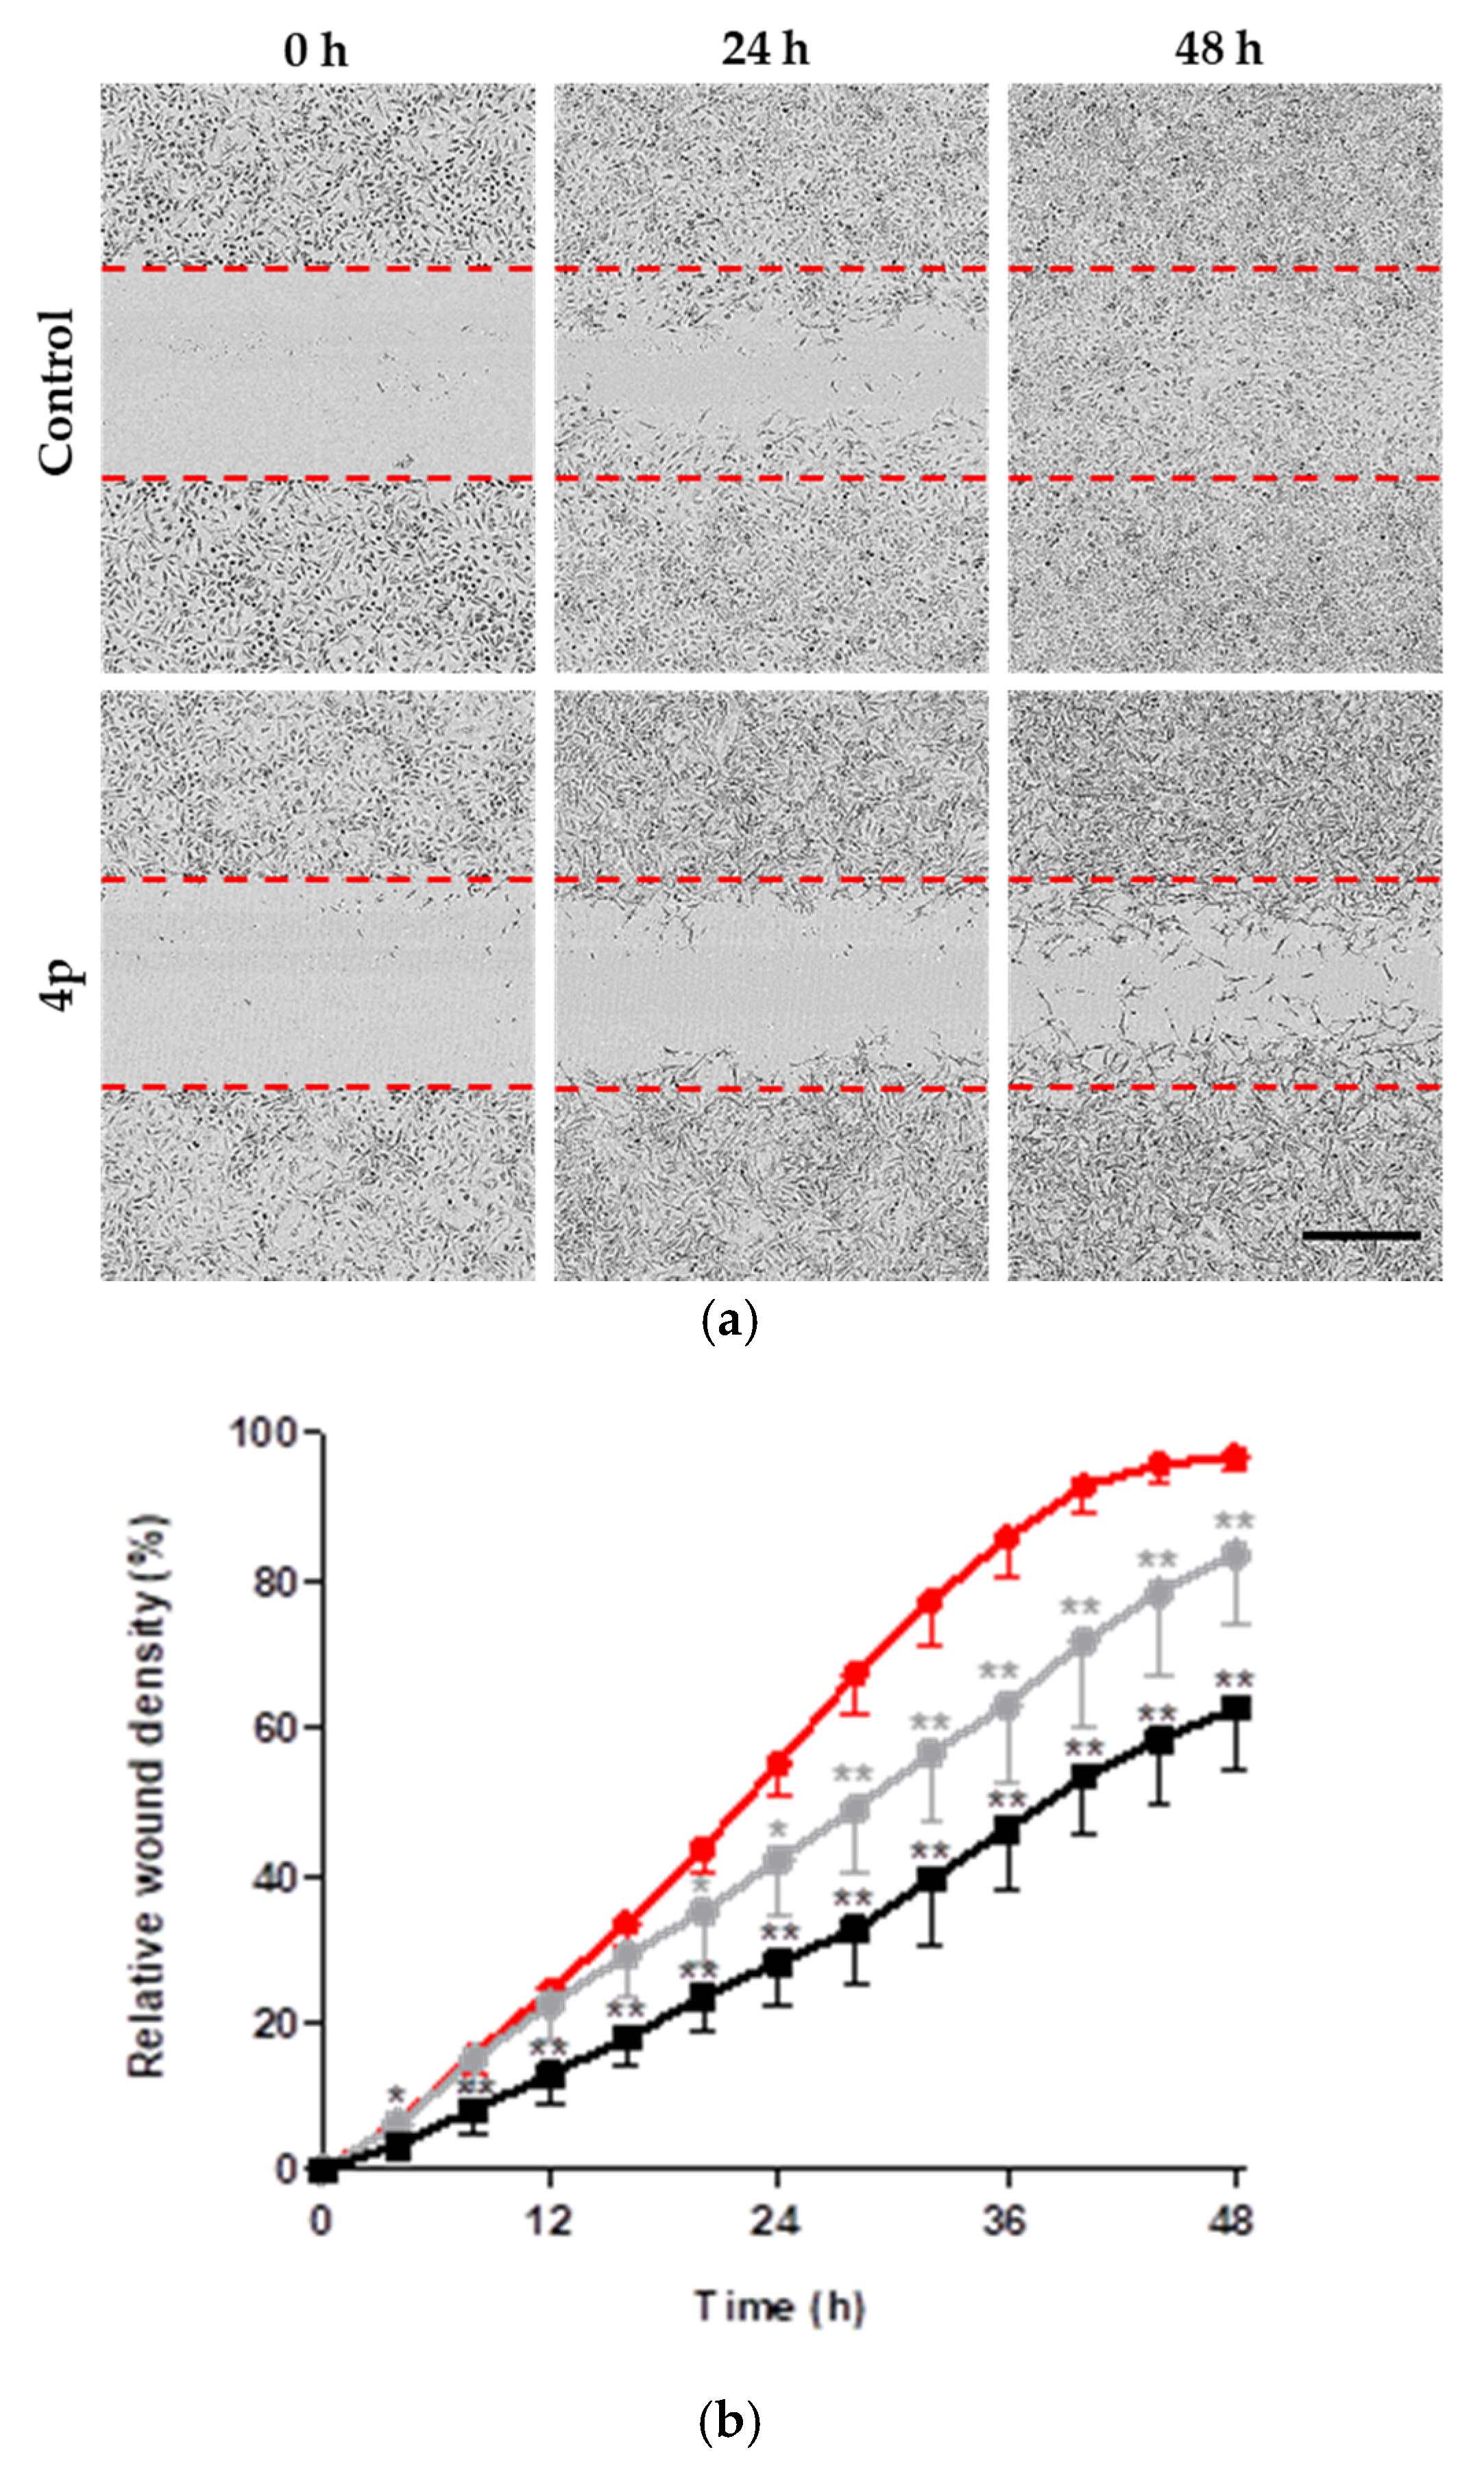
The potential of certain tumors to metastasize is closely associated with the ability of tumor cells to migrate and invade adjacent tissues. Upregulation of CK2 has been associated with the cytoskeletal reorganization and acquiring a migratory phenotype [39,40,41,42,43,44]. To assess the effect of 4p on the migration capacity of A549 lung cancer cells, we examined the rate of cell migration following the induction of homogenous scratch wounds in 96-well plates. Monitoring of the induced scratch wounds for 48 h following treatment with 4p at 10 µM revealed the impaired ability of A549 cells to migrate into the wound area while control cells that received 1% DMSO were able to completely seal the wound after 48 h (Figure 5a). To exclude the possibility that 4p-induced impairment of cell migration at 10 µM is due to antiproliferative effect and not a direct anti-migratory effect, we examined the effect of 4p at a concentration of 1 µM, which exhibits a very weak antiproliferative effect per se. Again, we could observe a statistically significant decrease in the percentage relative wound density (i.e., the ratio of the occupied area to the total area of the initial wound region) in the treated wells, compared to control (Figure 5b). These results suggest that 4p has a direct inhibitory effect on cell migration, most likely due to inhibition of CK2 activity.

2.2.4. Evaluation of Anticancer Effects in 3D Tumor Model

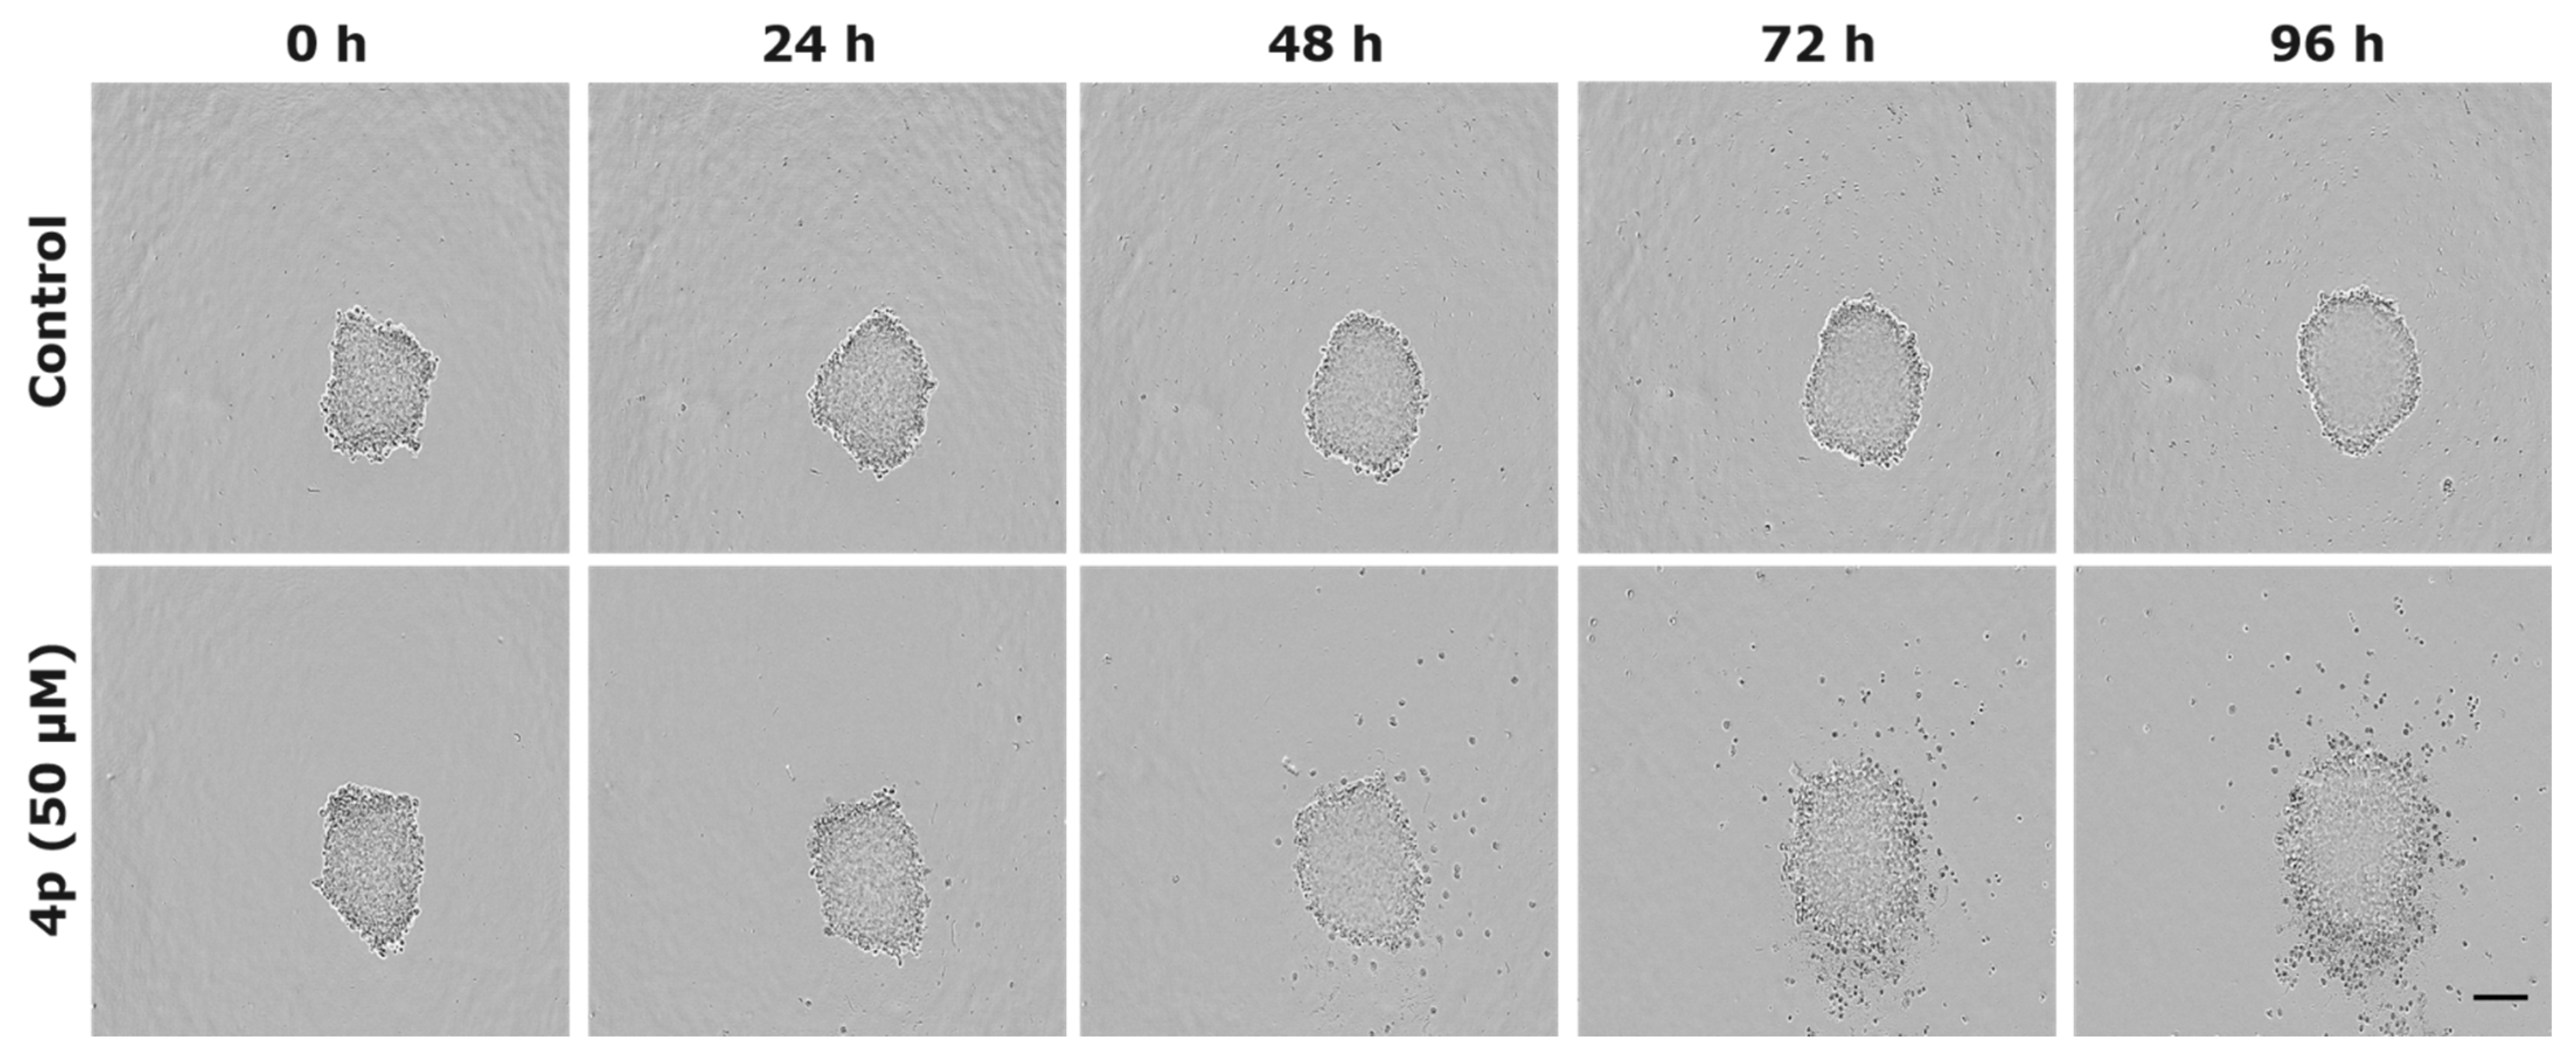
Next, we investigated the effects of 4p on the growth and integrity of multicellular tumor spheroids from A549 cell line. Spheroids have the ability to mimic the 3D structure of tumors and thereby serve as useful models for evaluating responses to anticancer drugs [45,46,47]. Here, spheroids were grown in 96-well plates for 72–96 h before treatment with 50 µM of 4p or vehicle (0.5% DMSO). Monitoring of the treated spheroids revealed the development of a steadily growing diffuse outer layer of cells starting to appear 48 h after treatment with 4p (Figure 6). An accurate estimation of the spheroid growth was not possible since this loosely attached layer to the spheroid core led to an overestimation of spheroid size. Each well received simultaneously 250 nM of IncuCyte® cytotox red fluorescent dye to demonstrate the cytotoxic effect of 4p on the treated spheroids. This dye did not perturb cell growth and yielded little intrinsic fluorescent signal in healthy cells. However, it permeated unhealthy cells with impaired plasma membrane integrity and bound DNA yielding a 100–1000-fold increase in fluorescence signals. Examination of the red fluorescence signals in the cultured A549 spheroids showed higher and uniformly distributed fluorescence signals in 4p treated spheroids indicating a high number of dead cells over the exposed surface of the spheroids (Supplementary Materials, Figure S4). On the other hand, control spheroids demonstrated weak red fluorescence mostly localized to the necrotic core and not to the periphery of the spheroids (Supplementary Materials, Figure S4). Interestingly, a large proportion of the detached cells from the core of treated spheroids did not show red fluorescent signals, indicating that these cells were not dead. Notably, Virgone-Carlotta et al. [48] reported recently similar effects for the chemotherapeutic agent 5-flurouracil (5-FU). In that study, the ability of 5-FU to induce an anti cohesive effect on multicellular spheroids from the colorectal carcinoma cell lines HCT116 and SW48, following treatment with 10 µM of the drug, was described. The impaired spheroid cohesion in response to 5-FU was attributed to the ability of the drug to interfere with cell–cell and cell–matrix interaction in spheroids and was taken as a measure of the sensitivity of these cells to 5-FU. Similar to 5-FU, 4p demonstrated a strong anti cohesive effect and resulted in detaching a mixture of dead and viable cells from the spheroid core. These viable detached cells seem to be resistant to the cytotoxic effects of 4p and thereby simulating the drug-resistant cell subpopulations in tumor entities, which would therefore require multidrug treatment to eradicate them.

2.3. Investigation of In Vitro Pharmacokinetic Properties

2.3.1. Cellular Uptake

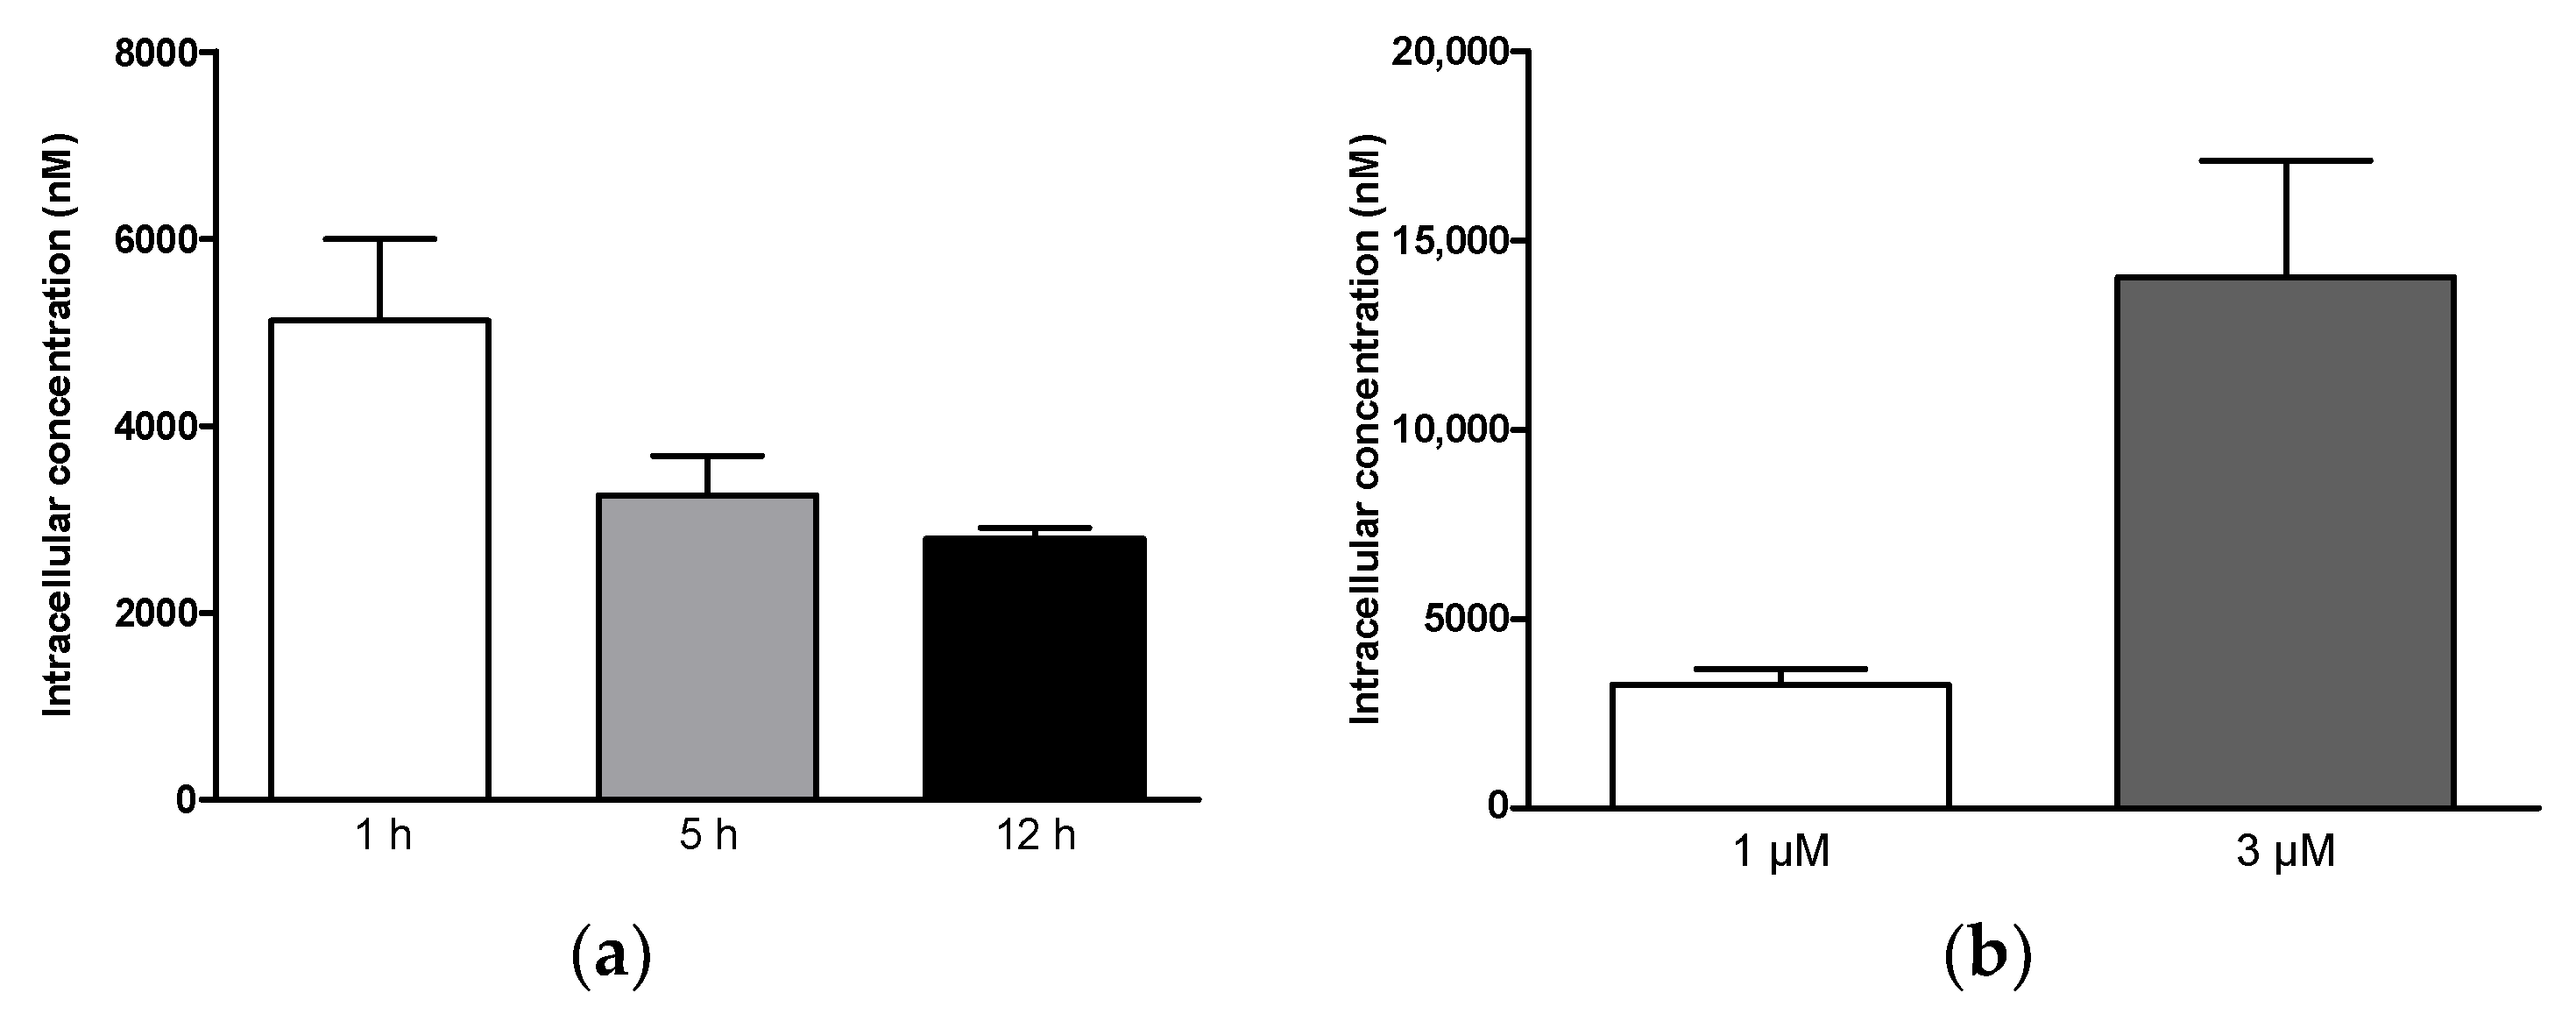
To better assess the suitability of 4p as a potential anticancer drug, we investigated both the uptake in cancer cells and the metabolic stability of the compound. The changes in the intracellular concentration of 4p in cultured A431 cancer cells were studied in both time- and concentration-dependent manners. First, the concentration of 4p was determined in lysates from A431 cells using LC-MS/MS following preincubation of cells with 1 µM of the compound for 1, 5, and 12 h. Here, an intracellular concentration of approximately 5 µM was reached at 1 h post-treatment and continued to decline over the later time points to reach a value of 2.8 µM at 12 h post-treatment (Figure 7a). Furthermore, we observed approximately a four-fold increase in the intracellular concentration of 4p (14 µM) upon increasing the extracellular concentration of the compound to 3 µM (Figure 7b). These results indicate the rapid uptake of the compound by A431 cells and suggest that the observed uptake was not due to a saturable transport process.
The observed higher intracellular concentration of 4p as compared to the concentration of the compound in the cell culture medium indicates intracellular accumulation of the compound following its cellular uptake. Cellular retention of drugs has been previously described for kinase inhibitors, for example, imatinib, and is considered beneficial from a pharmacokinetic perspective [49]. A possible reason for this observed accumulation of 4p might be the binding of the compound to cellular structures, e.g., plasma membrane [50], or inclusion in lipid droplets [51], leading to the retention of the substance in the treated cells. It would be important to investigate the mechanism(s) of cellular uptake as well as the subcellular distribution of 4p to clarify this observation.

2.3.2. In Vitro Metabolism Analysis

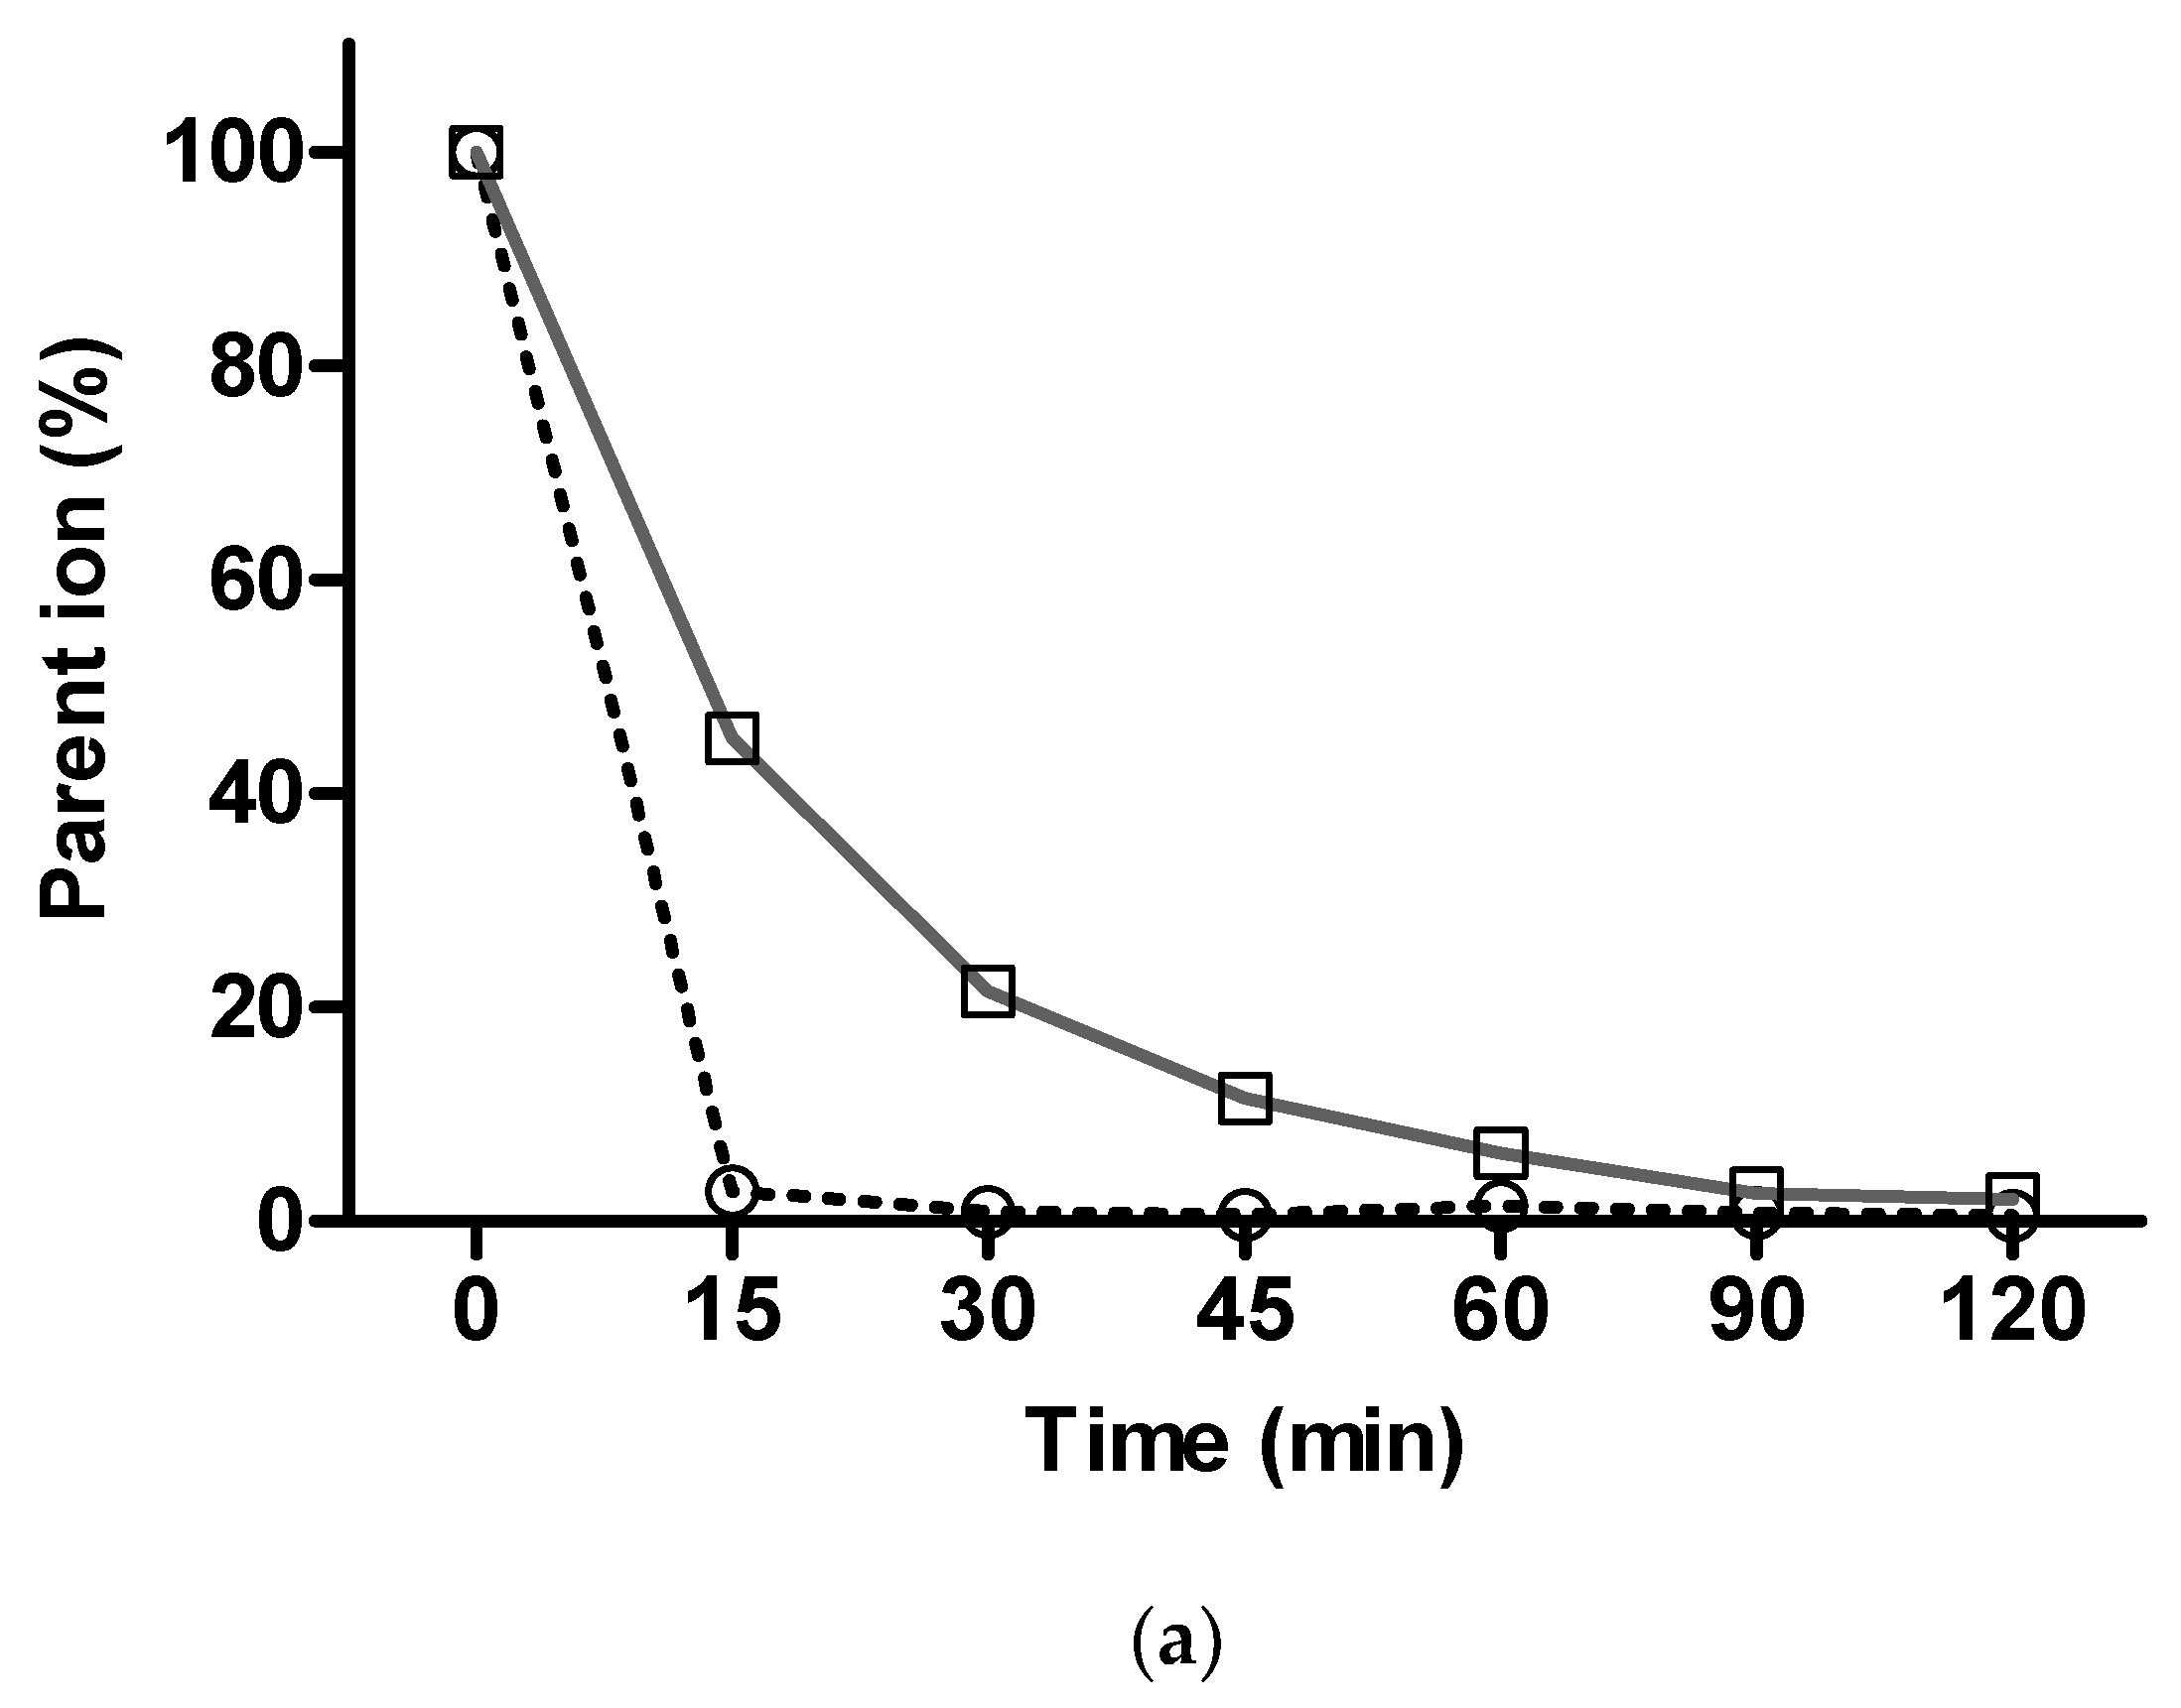
Next, the phase I metabolic stability of 4p was assessed using imipramine, which is known to be metabolically labile per se [52], as a reference compound. Following incubation of 25 µM of each compound with mouse liver microsomal homogenate in the presence of cofactors, essential for phase I metabolic reactions, the percent parent ion was determined in LC-MS/MS at different time points, relative to the initial level of parent ion (t = 0). Here, the parent ion of 4p almost completely disappeared after 15 min of incubation, while imipramine demonstrated a gradual decrease in the parent ion level up to the complete disappearance of its corresponding parent ion after 120 min (Figure 8a). These results indicate that 4p was extensively metabolized in phase I reactions. Therefore, attempts were made to identify the major phase I as well as phase II metabolites of 4p, whereby glucuronidation was analyzed as a representative for phase II metabolic reactions. Several mono- and dihydroxylated metabolites of 4p (Figure 8(b1,2)) and its deprenylated derivative (Figure 8(b3–6)) could be identified, with the hydroxyl groups being added to ring A and/or ring D of the indeno[1,2-b]indole backbone. Furthermore, some of the hydroxylated metabolites were found to be glucuronidated in our experiments (Figure 8(b7,8)), suggesting that hydroxylation and glucuronidation may represent the major metabolic pathways for 4p. These metabolites were not observed in control samples that did not contain NADPH as a cofactor for phase I metabolic enzymes and UDPGA as a cofactor for phase II metabolic enzymes in our study. This indicates the stability of 4p in the absence of active metabolic processes.
Importantly, the approach taken to study the metabolism of 4p in this study allowed the determination of the masses of the metabolites, but not the exact position of identical substituent as, for example, hydroxyl groups. In this analysis, it was also not possible to quantify the amount of the different metabolites obtained. Preliminary HPLC separation allowed, however, a distinction between the individual metabolites with similar masses, and thereby, we were able to determine the number of obtained 4p metabolites (Supplementary Materials, Table S1, Figures S5–S11). It would be interesting in future studies to structurally characterize and test the CK2 inhibitory activity and cellular effects of these metabolites, particularly 1 and 2, which were still bearing both the prenyloxy and isopropyl substitutions required for high CK2 inhibitory activity. Taken together, these results indicate the metabolic instability of 4p and hints at the presence of active hydroxylated metabolites of the compound.

3. Materials and Methods

3.1. Chemicals

All chemicals were purchased in the highest available purity. 4p, synthesized as described before in Gozzi et al. [33], was solved in dimethyl sulfoxide (DMSO) at a concentration of 10 mM and stored at −20 °C.

3.2. Cell Culture

Human epidermoid carcinoma cell line A431 and human lung carcinoma cell line A549 were cultured in DMEM high glucose medium (Life Technologies, Waltham, MA, USA) supplemented with 10% fetal calf serum (FCS). Both cell lines were kindly provided by Prof. Dr. Angelika Barnekow (Institute for Neuro- and Behavioural Biology, Westfälische Wilhelms-Universität, D-48149 Münster, Germany). Human prostate carcinoma cell line LNCaP, kindly provided by Prof. Dr. Claudia Götz (Department of Medical Biochemistry and Molecular Biology, Saarland University, D-66424 Homburg, Germany), was cultured in RPMI 1640 GlutaMax (Life Technologies, Waltham, MA, USA) supplemented with 10% FCS. All three cell lines were cultured at 37 °C in a humidified atmosphere of 5% CO2. Cells were cultured in 100 µL cell culture medium in 96-well plates and 2 mL in 6-well plates (Cellstar, Greiner, Darmstadt, Germany).

3.3. Determination of Intracellular CK2 Activity

The effect of 4p on CK2 activity in cancer cells was determined using a modified protocol from the one described before by Schneider et al. [53]. Briefly, cells were cultured in 6-well plates for 48 h. Afterward, the medium was replaced with a 2 mL fresh cell culture medium containing 1 or 20 µM 4p or vehicle control (1% DMSO) followed by 24 h incubation at 37 °C in a humidified atmosphere of 5% CO2. Subsequently, cells were harvested and suspended in lysis buffer (50 mM Tris/HCl (pH 7.5), 0.5% sodium desoxycholate, 0.15 mM NaCl, 1 mM Na3VO4, 0.5 mM NaF, 0.8 µM aprotinin, 10 µM pepstatin A, 20 µM leupeptin, 0.1 mM PMSF, 1 mM benzamidine, 1% Triton X-100). The protein concentration of the soluble fractions of the lysates was determined using a Bradford method (Roti-Quant, Roth, Karlsruhe, Germany). For each sample, 90 µg of protein was diluted in 80 µL kinase buffer (50 mM Tris/HCl pH 7.5, 100 mM NaCl, 10 mM MgCl2) and preincubated at 37 °C for 10 min. The reaction was started by mixing samples with 120 µL assay buffer (25 mM Tris/HCl (pH 8.5), 150 mM NaCl, 5 mM MgCl2, 190 µM FITC-RRRDDDSDDD, 100 µM ATP). Samples were incubated for 15 min at 37 °C before the kinase reaction was terminated by adding 5 mM EDTA and incubating samples on ice. Samples were analyzed via capillary electrophoresis (CE) as described in Gratz et al. 2010 [35] and detected using a laser-induced fluorescence (LIF) detector. Relative CK2 activity was calculated in each sample using the ratio of AUC values of detected product and substrate peaks and normalized to that of vehicle control (1% DMSO). The latter was set as 100% activity.

3.4. IncuCyte® Cell Proliferation Assay

A431, A549, and LNCaP cells were cultured in 96-well plates to a confluence of approximately 30%. Then, the culture medium in each well was removed and replaced with 100 µL fresh medium containing vehicle control (1% DMSO) or 4p in at least eight different concentrations. Afterward, cells were placed in an IncuCyte® S3 live-cell imaging system (Sartorius, Ann Arbor, MI, USA) at 37 °C in a humidified atmosphere of 5% CO2 for a total period of 48 h. Microscopic phase contrast images of all wells were taken at 2 h intervals with a ten-fold lens (four images per well). The percent cell confluence in each well was determined for all time points using the IncuCyte S3 2017A software. GraphPad Prism 5 software (GraphPad software, La Jolla, CA, USA) was used to determine the area under the obtained growth curves (AUC). The percent confluence at the beginning of each growth curve was set as the baseline, respectively. The AUC values of the obtained curves were normalized to the corresponding AUC of the vehicle control and plotted against the logarithmic values of the applied 4p concentrations. A nonlinear regression analysis was performed to determine an EC50 value for each cell line using GraphPad Prims 5 software.

3.5. IncuCyte® Cell Apoptosis Assay

A431 cells were seeded into 96-well plates and cultured until a confluence of 30–40% was reached. Subsequently, the culture medium in the wells was removed and replaced with 100 µL fresh medium containing either 1 or 20 µM of 4p while control wells received 1% DMSO. The added solution to each well contained 5 µM of a green caspase 3/7 apoptosis reagent (Sartorius, Ann Arbor, MI, USA). This fluorescent dye is bound to a quencher via a peptide chain. The enzymes caspase 3 and 7, which are only active during the induction of apoptosis in eukaryotic cells, are able to cleave this peptide chain. Subsequently, the dye intercalates into the DNA in the nucleus of the apoptotic cells and its fluorescence signal is detectable. After treatment, cells were stored in an IncuCyte® S3 live-cell imaging system for 48 h at 37 °C and 5% CO2. Fluorescence microscopy images of the wells were taken every 2 h with a ten-fold lens (four images per well) using the green fluorescence channel of the IncuCyte® S3 live-cell imaging system (excitation 440–480 nm, emission 504–544 nm). The number of apoptotic cells was derived from the number of green fluorescent events determined with the IncuCyte® 2017A Rev2 software.

3.6. IncuCyte® Scratch Wound Migration Assay

Image-lock plates with 96-wells (Sartorius, Ann Arbor, MI, USA) were coated with a collagen-I solution (300 µg/mL) in 0.02 M acetic acid to study the migration of A549 lung carcinoma cells. Subsequently, 2.5 × 10⁴ A549 cells per well were seeded into the prepared image-lock plates. The cells were cultured at 37 °C and 5% CO2 until 100% confluence was achieved. Next, a wound was created in the center of each well using a WoundMakerTM (Sartorius, Ann Arbor, MI, USA) followed by washing the wells twice with 120 µL of the pre-warmed medium. Wells then received 100 µL of fresh medium containing either vehicle (1% DMSO) or 4p at two different concentrations (1 and 10 µM). Microscopic phase contrast images were then taken at 2 h intervals over a 48-h period in IncuCyte® S3 live cell imaging system and analyzed using the IncuCyte® 2017A Rev2 software to calculate the relative wound density in each well at the corresponding time points.

3.7. IncuCyte® 3D Spheroid Imaging

Multicellular spheroids from the A549 cell line were initiated and cultured according to the protocol of Friedrich et al. [54] to evaluate the effects of 4p on a 3D tumor model. Briefly, 96-well plates were coated with 45 µL of sterile 1% agarose solution, left to solidify for 10 min followed by seeding of 2.0 × 10³ cells/well in 200 µL of culture medium. Cells were then incubated at 37 °C in a humidified atmosphere of 5% CO2 to allow spheroid initiation and left to grow for 72–96 h. On the day of treatment, 125 µL of culture medium were carefully removed from each well followed by the addition of 75 µL of fresh medium containing 2× of the desired final concentrations of 4p (50 µM) or vehicle (0.5% DMSO) and IncuCyte® cytotox red fluorescent dye (250 nM) (Sartorius, Ann Arbor, MI, USA). Cultured spheroids were monitored for 96 h using IncuCyte® S3 live-cell imaging system maintained at 37 °C and 5% CO2 using both phase contrast and red fluorescence channels.

3.8. Uptake Analysis

Cells were seeded in 6-well plates at a density of 5.0 × 10⁵ per well and cultured for 48 h at 37 °C and 5% CO2. Subsequently, the complete medium in each well was removed and replaced with a 2 mL fresh medium containing 1 or 3 µM 4p. Cells were incubated with 4p for 1, 5, or 12 h. Then, cells were washed with PBS and detached from the wells using trypsin/EDTA. The obtained suspensions of cells were then centrifuged for 5 min at 700× g and 4 °C. The number of cells in the resulting pellet of each sample was determined using an automated cell counter (Scepter®, Merck, Darmstadt, Germany). After washing with PBS, cells were lysed in 100 µL homogenization buffer (50 mM Tris/HCl (pH 7.5), 1 mM EDTA, 1 mM Na3VO4, 0.5 mM NaF, 0.1 mM PMSF, 1 mM benzamidine, 1% Triton X-100). Proteins were precipitated by adding 500 µL of ice-cold acetonitrile/methanol 1/1 (v/v) and separated by centrifugation for 30 min at 4 °C and 20,000× g. Five hundred microliters of the supernatants were evaporated to dryness using a vacuum centrifuge (Christ) for 1.5 h at 50 °C under full vacuum and suspended in 100 µL acetonitrile/H2O 1/1 (v/v). Samples were then transferred to micro inlets for HPLC vials (BGB, Rheinfelden, Germany) and analyzed by high-performance liquid chromatography coupled with detection via triple quadrupole mass spectrometry (HPLC-MS/MS, QTrap® 6500+, AB Sciex, Darmstadt, Germany).
External matrix calibration was performed for the quantitative determination of the intracellular concentration of 4p. Intracellular concentrations were calculated as described in Rahnel et al. [55] with the following equation.
c x = A x -   b a   ×   V final   × 1 N cells   ×   4 3   π   ×   ( d cells 2   ×   1000 ) 3   ×   1 . 01
where cx is the intracellular concentration of 4p, Ax is the area of the analyte signal in the respective chromatogram, b is the ordinate, and a is the slope of the calibration line, Vfinal is the final sample volume, Ncells is the cell number of the sample and dcells is the mean diameter of the cells in the sample. The factor 1.01 takes into account the sample volume taken for cell count determination.

3.9. In Vitro Metabolism Analysis

The metabolic stability determination and the identification of metabolites of 4p were performed using a method previously described by Börgel et al. [56]. For the analysis of the metabolic stability of 4p, 25 µM of the substance were dissolved in PBS supplemented with 12.5 mM MgCl2 and 0.5 mg/mL NADPH. Next, mouse liver microsomes were added to the reaction (0.5 mg/mL protein). Samples were incubated 15–120 min at 37 °C and 900 rpm in a thermomixer (Eppendorf, Hamburg, Germany). The reaction was terminated by adding 400 µL ice-cold acetonitrile/H2O 1/1 (v/v) to each sample. Samples were centrifuged for 10 min at 4 °C and 20,000× g. Supernatants were analyzed via HPLC-MS/MS.
Metabolites of 4p were identified as described above. In contrast to the metabolic stability analysis, 0.5 mg/mL UDPGA was used beside NADPH to analyze glucuronidation representative for phase II metabolism. Samples were analyzed with a high-resolution LC-qToF-MS system (Bruker Daltonics, Billerica, MA, USA). The identification of metabolites of 4p was performed by determining molecular formulas from the exact masses of each metabolite using Data Analysis software (Bruker Daltonics, Billerica, MA, USA).

3.10. HPLC Analysis

For the cellular uptake and metabolism analysis, samples were investigated using a Nexera X2 high-performance liquid chromatography (HPLC) system (Shimadzu, Kyoto, Japan) coupled with a triple quadrupole mass spectrometer (QTrap® 6500+, AB Sciex, Darmstadt, Germany). A RP18 column (XSelect HSS T3, 100 mm × 2.10 mm, 2.5 µm, Waters, Milford, MA, USA) was used as the stationary phase here, which was tempered to 40 °C. A solvent gradient of acetonitrile/H2O 10/90 (v/v) + 0.1% (v/v) formic acid (A) and acetonitrile/H2O 90/10 (v/v) + 0.1% (v/v) formic acid (B) served as the mobile phase. The flow rate was set to 0.3 mL/min. The gradient was run as follows: 0% B to 100% B: 0–7 min; 100% B 7–9 min; 100% B to 0% B: 9–9.5 min; 0% B: 9.5–15 min. The injection volume of the samples was 5 µL. Analytes were ionized via electrospray ionization (ESI) and detected in multiple reaction monitoring (MRM) mode. MS parameters were optimized on a compound-specific basis.
The metabolite identification was performed using an Ultimate 3000 RS HPLC system (Dionex, Sunnyvale, CA, USA) in combination with a high-resolution micrOTOF-Q II mass spectrometer (Bruker Daltonics, Billerica, MA, USA). The stationary phase and the solvent composition were as described above. The solvent gradient was run as follows: 0% B: 0–1 min; 0% B to 100% B 1–12 min; 100% B: 12–14.5 min; 100% B to 0% B: 14.5–15 min; 0% B: 15–18 min. The flow rate was set at 0.4 mL/min. The injection volume was 10 µL. Analyte ionization was performed via ESI. For metabolite identification, exact masses of ions with m/z 70–700 were determined.

3.11. Statistical Analysis

Levels of significance for comparison of two treatment groups in Figure 2b or control and each treatment group in Figure 4b and Figure 5b were determined using an unpaired Student’s t-test. Comparison of the EC50 values determined in the three cell lines studied (Figure 3b) was performed by one-way ANOVA. The p-values are indicated in the corresponding figures as follows: * p < 0.05, ** p <0.01. All statistical analyses were performed using GraphPad Prism 5 Software.

4. Conclusions

In previous work, we identified the prenyloxy-substituted indeno[1,2-b]indole, known as 4p, as a very potent inhibitor of CK2 holoenzyme using in vitro kinase activity assay. In the present work, we provide evidence for the intracellular inhibition of CK2 in three different in vitro cancer models indicating the cellular target engagement of 4p. Using live-cell imaging, we thoroughly investigated the biological effects of 4p on several CK2-mediated cellular processes associated with cancer in 2D and 3D cell cultures. 4p shows convincing antiproliferative, anti-migratory, and apoptosis-inducing effects and seems to disrupt cell/cell and cell/matrix interactions as indicated by the impaired cohesion of tumor spheroids. The strong anticancer effects of 4p suggest high intracellular concentrations of the compound, which was confirmed in the present study. We further show that 4p is extensively metabolized, giving rise to several hydroxylated and/or deprenylated metabolites, which can be glucuronidated, posing a challenge to improve the drug-like properties of the compound. The evaluation of the CK2 inhibitory potential and cellular activities of these metabolites should be considered for future work.

Supplementary Materials

The following are available online https://www.mdpi.com/article/10.3390/ph14060542/s1, Figure S1: Representative electropherogram of capillary electrophoresis-based measurements of cellular CK2 kinase activity, Figure S2: Representative time-course of the percent confluence changes of (a) A549 and (b) LNCaP cells following treatment with 4p, Figure S3: Representative phase contrast images of (a) A549 and (b) LNCaP cells treated with 4p, Figure S4: Representative red fluorescence channel images (a) and overlay with phase contrast images (b) of A549 spheroids showing the cytotoxic effect of 4p, Table S1 and Figures S5–S11: Identification of 4p metabolites.

Author Contributions

Designed the spheroid experiments, participated in the migration experiments and prepared the manuscript, E.E.-A.; Designed and performed cellular assays and metabolic stability experiments and helped in preparation the manuscript, R.B.; Participated in the uptake and metabolic stability experiments, L.B.; Participated in the design of cellular assays, D.A.; Resynthesized and purified 4p, C.M. and Z.B.; Supervised and coordinated the chemistry part of the project, M.L.B.; Supervised and coordinated the project and wrote parts of the manuscript, J.J. All authors have read and agreed to the published version of the manuscript.

Funding

This research received no external funding.

Institutional Review Board Statement

Not applicable.

Informed Consent Statement

Not applicable.

Data Availability Statement

The data presented in this study are available in the article and Supplementary Materials.

Acknowledgments

We would like to thank K. Vieth for his support with spheroid experiments. We also deeply thank Joerg Fabian for his help in the LC-MS/MS experiments.

Conflicts of Interest

The authors declare no conflict of interest.

References

  1. Burnett, G.; Kennedy, E.P. The enzymatic phosphorylation of proteins. J. Biol. Chem. 1954, 211, 969–980. [Google Scholar] [CrossRef]
  2. Litchfield, D.W. Protein kinase CK2: Structure, regulation and role in cellular decisions of life and death. Biochem. J. 2003, 369, 1–15. [Google Scholar] [CrossRef] [PubMed]
  3. Salvi, M.; Sarno, S.; Cesaro, L.; Nakamura, H.; Pinna, L.A. Extraordinary pleiotropy of protein kinase CK2 revealed by weblogo phosphoproteome analysis. BBA Mol. Cell Res. 2009, 1793, 847–859. [Google Scholar] [CrossRef]
  4. Montenarh, M.; Götz, C. Protein kinase CK2 and ion channels (Review). Biomed. Rep. 2020, 13, 55. [Google Scholar] [CrossRef]
  5. de Villavicencio-Diaz, T.N.; Rabalski, A.J.; Litchfield, D.W. Protein kinase CK2: Intricate relationships within regulatory cellular networks. Pharmaceuticals 2017, 10, 27. [Google Scholar] [CrossRef] [Green Version]
  6. St-Denis, N.A.; Litchfield, D.W. From birth to death: The role of protein kinase CK2 in the regulation of cell proliferation and survival. Cell Mol. Life Sci. 2009, 66, 1817–1829. [Google Scholar] [CrossRef]
  7. Ahmed, K.; Gerber, D.A.; Cochet, C. Joining the cell survival squad: An emerging role for protein kinase CK2. Trends Cell Biol. 2002, 12, 226–230. [Google Scholar] [CrossRef]
  8. Ahmad, K.A.; Wang, G.; Unger, G.; Slaton, J.; Ahmed, K. Protein kinase CK2--a key suppressor of apoptosis. Adv. Enzym. Regul. 2008, 48, 179–187. [Google Scholar] [CrossRef] [Green Version]
  9. Cabrejos, M.E.; Allende, C.C.; Maldonado, E. Effects of phosphorylation by protein kinase CK2 on the human basal components of the RNA polymerase II transcription machinery. J. Cell BioChem. 2004, 93, 2–10. [Google Scholar] [CrossRef]
  10. Borgo, C.; Franchin, C.; Salizzato, V.; Cesaro, L.; Arrigoni, G.; Matricardi, L.; Pinna, L.A.; Donella-Deana, A. Protein kinase CK2 potentiates translation efficiency by phosphorylating eIF3j at Ser127. BBA Mol. Cell Res. 2015, 1853, 1693–1701. [Google Scholar] [CrossRef] [PubMed]
  11. Dominguez, I.; Degano, I.R.; Chea, K.; Cha, J.; Toselli, P.; Seldin, D.C. CK2α is essential for embryonic morphogenesis. Mol. Cell BioChem. 2011, 356, 209–216. [Google Scholar] [CrossRef] [PubMed] [Green Version]
  12. Buchou, T.; Vernet, M.; Blond, O.; Jensen, H.H.; Pointu, H.; Olsen, B.B.; Cochet, C.; Issinger, O.G.; Boldyreff, B. Disruption of the regulatory beta subunit of protein kinase CK2 in mice leads to a cell-autonomous defect and early embryonic lethality. Mol. Cell Biol. 2003, 23, 908–915. [Google Scholar] [CrossRef] [Green Version]
  13. Götz, C.; Montenarh, M. Protein kinase CK2 in development and differentiation (Review). Biomed. Rep. 2017, 6, 127–133. [Google Scholar] [CrossRef]
  14. Souquere-Besse, S.; Pichard, E.; Filhol, O.; Legrand, V.; Rosa-Calatrava, M.; Hovanessian, A.G.; Cochet, C.; Puvion-Dutilleul, F. Adenovirus infection targets the cellular protein kinase CK2 and RNA-activated protein kinase (PKR) into viral inclusions of the cell nucleus. Microsc. Res. Tech. 2002, 56, 465–478. [Google Scholar] [CrossRef] [PubMed]
  15. Bouhaddou, M.; Memon, D.; Meyer, B.; White, K.M.; Rezelj, V.V.; Marrero, M.; Polacco, B.J.; Melnyk, J.E.; Ulferts, S.; Kaake, R.M.; et al. The global phosphorylation landscape of SARS-CoV-2 infection. Cell 2020, 182, 685–712 e619. [Google Scholar] [CrossRef]
  16. Yang, W.; Gibson, S.A.; Yan, Z.; Wei, H.; Tao, J.; Sha, B.; Qin, H.; Benveniste, E.N. Protein kinase 2 (CK2) controls CD4(+) T cell effector function in the pathogenesis of colitis. Mucosal Immunol. 2020, 13, 788–798. [Google Scholar] [CrossRef] [PubMed]
  17. Guerra, B.; Issinger, O.G. Protein kinase CK2 in human diseases. Curr. Med. Chem. 2008, 15, 1870–1886. [Google Scholar] [CrossRef] [PubMed]
  18. Bliesath, J.; Huser, N.; Omori, M.; Bunag, D.; Proffitt, C.; Streiner, N.; Ho, C.; Siddiqui-Jain, A.; O’Brien, S.E.; Lim, J.K.C.; et al. Combined inhibition of EGFR and CK2 augments the attenuation of PI3K-Akt-mTOR signaling and the killing of cancer cells. Cancer Lett. 2012, 322, 113–118. [Google Scholar] [CrossRef] [PubMed]
  19. Zheng, Y.; McFarland, B.C.; Drygin, D.; Yu, H.; Bellis, S.L.; Kim, H.; Bredel, M.; Benveniste, E.N. Targeting Protein Kinase CK2 Suppresses Prosurvival Signaling Pathways and Growth of Glioblastoma. Clin. Cancer Res. 2013, 19, 6484. [Google Scholar] [CrossRef] [PubMed] [Green Version]
  20. Richter, A.; Roolf, C.; Hamed, M.; Gladbach, Y.S.; Sender, S.; Konkolefski, C.; Knübel, G.; Sekora, A.; Fuellen, G.; Vollmar, B.; et al. Combined Casein Kinase II inhibition and epigenetic modulation in acute B-lymphoblastic leukemia. BMC Cancer 2019, 19, 202. [Google Scholar] [CrossRef] [PubMed] [Green Version]
  21. Wang, G.; Unger, G.; Ahmad, K.A.; Slaton, J.W.; Ahmed, K. Downregulation of CK2 induces apoptosis in cancer cells--a potential approach to cancer therapy. Mol. Cell Biochem. 2005, 274, 77–84. [Google Scholar] [CrossRef]
  22. Slaton, J.W.; Unger, G.M.; Sloper, D.T.; Davis, A.T.; Ahmed, K. Induction of apoptosis by antisense CK2 in human prostate cancer xenograft model. Mol. Cancer Res. 2004, 2, 712–721. [Google Scholar]
  23. Chua, M.M.J.; Ortega, C.E.; Sheikh, A.; Lee, M.; Abdul-Rassoul, H.; Hartshorn, K.L.; Dominguez, I. CK2 in cancer: Cellular and biochemical mechanisms and potential therapeutic target. Pharmaceuticals 2017, 10, 18. [Google Scholar] [CrossRef]
  24. Unger, G.M.; Davis, A.T.; Slaton, J.W.; Ahmed, K. Protein kinase CK2 as regulator of cell survival: Implications for cancer therapy. Curr. Cancer Drug Tar. 2004, 4, 77–84. [Google Scholar] [CrossRef]
  25. Cozza, G. The development of CK2 inhibitors: From traditional pharmacology to in silico rational drug design. Pharmaceuticals 2017, 10, 26. [Google Scholar] [CrossRef] [Green Version]
  26. Silva-Pavez, E.; Tapia, J.C. Protein Kinase CK2 in Cancer Energetics. Front. Oncol. 2020, 10, 893. [Google Scholar] [CrossRef]
  27. Bal, C.; Baldeyrou, B.; Moz, F.; Lansiaux, A.; Colson, P.; Kraus-Berthier, L.; Léonce, S.; Pierré, A.; Boussard, M.F.; Rousseau, A.; et al. Novel antitumor indenoindole derivatives targeting DNA and topoisomerase II. Biochem. Pharm. 2004, 68, 1911–1922. [Google Scholar] [CrossRef]
  28. Rongved, P.; Kirsch, G.; Bouaziz, Z.; Jose, J.; Le Borgne, M. Indenoindoles and cyclopentacarbazoles as bioactive compounds: Synthesis and biological applications. Eur. J. Med. Chem. 2013, 69, 465–479. [Google Scholar] [CrossRef]
  29. Hundsdörfer, C.; Hemmerling, H.J.; Götz, C.; Totzke, F.; Bednarski, P.; Le Borgne, M.; Jose, J. Indeno[1,2-b]indole derivatives as a novel class of potent human protein kinase CK2 inhibitors. Bioorgan. Med. Chem. 2012, 20, 2282–2289. [Google Scholar] [CrossRef]
  30. Hundsdörfer, C.; Hemmerling, H.J.; Hamberger, J.; Le Borgne, M.; Bednarski, P.; Götz, C.; Totzke, F.; Jose, J. Novel indeno[1,2-b]indoloquinones as inhibitors of the human protein kinase CK2 with antiproliferative activity towards a broad panel of cancer cell lines. Biochem. Biophys. Res. Commun. 2012, 424, 71–75. [Google Scholar] [CrossRef]
  31. Haidar, S.; Marminon, C.; Aichele, D.; Nacereddine, A.; Zeinyeh, W.; Bouzina, A.; Berredjem, M.; Ettouati, L.; Bouaziz, Z.; Le Borgne, M.; et al. QSAR model of indeno[1,2-b]indole derivatives and identification of N-isopentyl-2-methyl-4,9-dioxo-4,9-Dihydronaphtho[2,3-b]furan-3-carboxamide as a potent CK2 inhibitor. Molecules 2019, 25, 97. [Google Scholar] [CrossRef] [PubMed] [Green Version]
  32. Lindenblatt, D.; Nickelsen, A.; Applegate, V.M.; Hochscherf, J.; Witulski, B.; Bouaziz, Z.; Marminon, C.; Bretner, M.; Le Borgne, M.; Jose, J.; et al. Diacritic Binding of an Indenoindole Inhibitor by CK2α Paralogs Explored by a Reliable Path to Atomic Resolution CK2α’ Structures. ACS Omega 2019, 4, 5471–5478. [Google Scholar] [CrossRef]
  33. Gozzi, G.J.; Bouaziz, Z.; Winter, E.; Daflon-Yunes, N.; Aichele, D.; Nacereddine, A.; Marminon, C.; Valdameri, G.; Zeinyeh, W.; Bollacke, A.; et al. Converting potent indeno[1,2-b]indole inhibitors of protein kinase CK2 into selective inhibitors of the breast cancer resistance protein ABCG2. J. Med. Chem. 2015, 58, 265–277. [Google Scholar] [CrossRef] [PubMed]
  34. Hochscherf, J.; Lindenblatt, D.; Witulski, B.; Birus, R.; Aichele, D.; Marminon, C.; Bouaziz, Z.; Le Borgne, M.; Jose, J.; Niefind, K. Unexpected binding mode of a potent indeno[1,2-b]indole-type inhibitor of protein kinase CK2 revealed by complex structures with the catalytic subunit CK2 alpha and its paralog CK2 alpha. Pharmaceuticals 2017, 10, 98. [Google Scholar] [CrossRef] [Green Version]
  35. Gratz, A.; Götz, C.; Jose, J. A CE-based assay for human protein kinase CK2 activity measurement and inhibitor screening. Electrophoresis 2010, 31, 634–640. [Google Scholar] [CrossRef] [PubMed]
  36. Pierre, F.; Chua, P.C.; O’Brien, S.E.; Siddiqui-Jain, A.; Bourbon, P.; Haddach, M.; Michaux, J.; Nagasawa, J.; Schwaebe, M.K.; Stefan, E.; et al. Discovery and SAR of 5-(3-chlorophenylamino)benzo[c][2,6]naphthyridine-8-carboxylic acid (CX-4945), the first clinical stage inhibitor of protein kinase CK2 for the treatment of cancer. J. Med. Chem. 2011, 54, 635–654. [Google Scholar] [CrossRef] [PubMed]
  37. Zakharia, K.; Miyabe, K.; Wang, Y.; Wu, D.; Moser, C.D.; Borad, M.J.; Roberts, L.R. Preclinical In Vitro and In Vivo Evidence of an Antitumor Effect of CX-4945, a Casein Kinase II Inhibitor, in Cholangiocarcinoma. Transl. Oncol. 2019, 12, 143–153. [Google Scholar] [CrossRef]
  38. D’Amore, C.; Borgo, C.; Sarno, S.; Salvi, M. Role of CK2 inhibitor CX-4945 in anti-cancer combination therapy—Potential clinical relevance. Cell Oncol. 2020, 43, 1003–1016. [Google Scholar] [CrossRef]
  39. Zou, J.J.; Luo, H.S.; Zeng, Q.; Dong, Z.Y.; Wu, D.H.; Liu, L. Protein kinase CK2 alpha is overexpressed in colorectal cancer and modulates cell proliferation and invasion via regulating EMT-related genes. J. Transl. Med. 2011, 9, 97. [Google Scholar] [CrossRef] [PubMed] [Green Version]
  40. Wang, D.; Jang, D.-J. Protein Kinase CK2 Regulates Cytoskeletal Reorganization during Ionizing Radiation–Induced Senescence of Human Mesenchymal Stem Cells. Cancer Res. 2009, 69, 8200–8207. [Google Scholar] [CrossRef] [Green Version]
  41. D’Amore, C.; Salizzato, V.; Borgo, C.; Cesaro, L.; Pinna, L.A.; Salvi, M. A Journey through the Cytoskeleton with Protein Kinase CK2. Curr. Protein Pept. Sci. 2019, 20, 547–562. [Google Scholar] [CrossRef]
  42. Kramerov, A.A.; Golub, A.G.; Bdzhola, V.G.; Yarmoluk, S.M.; Ahmed, K.; Bretner, M.; Ljubimov, A.V. Treatment of cultured human astrocytes and vascular endothelial cells with protein kinase CK2 inhibitors induces early changes in cell shape and cytoskeleton. Mol. Cell BioChem. 2011, 349, 125–137. [Google Scholar] [CrossRef] [Green Version]
  43. Ku, M.J.; Park, J.W.; Ryu, B.J.; Son, Y.-J.; Kim, S.H.; Lee, S.Y. CK2 inhibitor CX4945 induces sequential inactivation of proteins in the signaling pathways related with cell migration and suppresses metastasis of A549 human lung cancer cells. Bioorg. Med. Chem. Lett. 2013, 23, 5609–5613. [Google Scholar] [CrossRef]
  44. Xavier, C.-P.; Rastetter, R.H.; Blömacher, M.; Stumpf, M.; Himmel, M.; Morgan, R.O.; Fernandez, M.-P.; Wang, C.; Osman, A.; Miyata, Y.; et al. Phosphorylation of CRN2 by CK2 regulates F-actin and Arp2/3 interaction and inhibits cell migration. Sci. Rep. 2012, 2, 241. [Google Scholar] [CrossRef] [Green Version]
  45. Weiswald, L.-B.; Bellet, D.; Dangles-Marie, V. Spherical Cancer Models in Tumor Biology. Neoplasia 2015, 17, 1–15. [Google Scholar] [CrossRef] [PubMed] [Green Version]
  46. Nunes, A.S.; Barros, A.S.; Costa, E.C.; Moreira, A.F.; Correia, I.J. 3D tumor spheroids as in vitro models to mimic in vivo human solid tumors resistance to therapeutic drugs. Biotechnol. Bioeng. 2019, 116, 206–226. [Google Scholar] [CrossRef] [PubMed] [Green Version]
  47. Pinto, B.; Henriques, A.C.; Silva, P.M.A.; Bousbaa, H. Three-Dimensional Spheroids as In Vitro Preclinical Models for Cancer Research. Pharmaceutics 2020, 12, 1186. [Google Scholar] [CrossRef] [PubMed]
  48. Virgone-Carlotta, A.; Lemasson, M.; Mertani, H.C.; Diaz, J.-J.; Monnier, S.; Dehoux, T.; Delanoë-Ayari, H.; Rivière, C.; Rieu, J.-P. In-depth phenotypic characterization of multicellular tumor spheroids: Effects of 5-Fluorouracil. PLoS ONE 2017, 12, e0188100. [Google Scholar] [CrossRef] [PubMed] [Green Version]
  49. Lipka, D.B.; Wagner, M.C.; Dziadosz, M.; Schnöder, T.; Heidel, F.; Schemionek, M.; Melo, J.V.; Kindler, T.; Müller-Tidow, C.; Koschmieder, S.; et al. Intracellular retention of ABL kinase inhibitors determines commitment to apoptosis in CML cells. PLoS ONE 2012, 7, e40853. [Google Scholar] [CrossRef] [Green Version]
  50. Murakami, T.; Yumoto, R. Role of phosphatidylserine binding in tissue distribution of amine-containing basic compounds. Expert Opin. Drug Metab. Toxicol. 2011, 7, 353–364. [Google Scholar] [CrossRef]
  51. Zhang, I.; Cui, Y.; Amiri, A.; Ding, Y.; Campbell, R.E.; Maysinger, D. Pharmacological inhibition of lipid droplet formation enhances the effectiveness of curcumin in glioblastoma. Eur. J. Pharm. Biopharm. 2016, 100, 66–76. [Google Scholar] [CrossRef] [Green Version]
  52. Klerman, G.L.; Cole, J.O. Clinical pharmacology of imipramine and related antidepressant compounds. Pharm. Rev. 1965, 17, 101–141. [Google Scholar]
  53. Schneider, C.C.; Götz, C.; Hessenauer, A.; Günther, J.; Kartarius, S.; Montenarh, M. Down-regulation of CK2 activity results in a decrease in the level of cdc25C phosphatase in different prostate cancer cell lines. Mol. Cell BioChem. 2011, 356, 177–184. [Google Scholar] [CrossRef] [PubMed]
  54. Friedrich, J.; Seidel, C.; Ebner, R.; Kunz-Schughart, L.A. Spheroid-based drug screen: Considerations and practical approach. Nat. Protoc. 2009, 4, 309–324. [Google Scholar] [CrossRef] [PubMed]
  55. Rahnel, H.; Viht, K.; Lavogina, D.; Mazina, O.; Haljasorg, T.; Enkvist, E.; Uri, A. A selective biligand inhibitor of CK2 increases caspase-3 activity in cancer cells and inhibits platelet aggregation. Chemmed. Chem. 2017, 12, 1723–1736. [Google Scholar] [CrossRef] [PubMed]
  56. Börgel, F.; Galla, F.; Lehmkuhl, K.; Schepmann, D.; Ametamey, S.M.; Wünsch, B. Pharmacokinetic properties of enantiomerically pure GluN2B selective NMDA receptor antagonists with 3-benzazepine scaffold. J. Pharm. Biomed. 2019, 172, 214–222. [Google Scholar] [CrossRef]
Figure 1. Structure of indeno[1,2-b]indole scaffold with the corresponding labels of the aromatic four-ring system (a) and 4p (b) with both substitutions important for strong CK2 inhibition (i.e., prenyloxy and isopropyl groups) shown in red and blue, respectively.
Pharmaceuticals 14 00542 g001
Figure 2. CK2 inhibition by 4p in three different cancer cell lines. (a) Immunostained A431, A549, and LNCaP cells with anti-CK2α antibody (1AD9, Santa Cruz Biotechnology, Santa Cruz, CA, USA) and corresponding fluorescently labeled secondary antibody. Scale bar = 20 µM. (b) CK2 activity in lysates from cultured A431, A549, or LNCaP cells that were treated for 24 h with vehicle (1% DMSO) or 4p at 1 µM (white bars) and 20 µM (grey bars) was determined in a capillary electrophoresis-based enzyme activity assay [35]. Data represent mean ± SD from three independent measurements, each performed in triplicates. ** p < 0.01.
Pharmaceuticals 14 00542 g002
Figure 3. Investigation of the antiproliferative effect of 4p in three different cancer cell lines. (a) Representative time-course of the percent confluence changes of A431 cells following treatment with 4p at four different concentrations (1.9–30 µM) or vehicle (1% DMSO) for 48 h. (b) EC50 values of 4p in A431, A549, and LNCaP cells. Data represent mean ± SD values from three independent experiments, each in triplicate. (c) Representative phase contrast images of A431 cells treated with 30 µM of 4p or vehicle (1% DMSO control). Images were taken at three different time points: directly after treatment (0 h), at 24 h, and 48 h following treatment. Scale bar (400 µM) for all images is shown in black.
Pharmaceuticals 14 00542 g003
Figure 4. Induction of apoptosis by 4p in cultured A431 cells. (a) Representative phase contrast images of A431 cells cultured in a 96-well plate and treated with 20 µM of 4p or vehicle (1% DMSO control). All wells received IncuCyte® caspase-3/7 green dye at a final concentration of 5 µM simultaneously. Images were taken at three different time points: directly after treatment (0 h), at 24 h, and 48 h following treatment. Green dots in the images represent apoptotic cells. Scale bar (400 µm) for all images is shown in black. (b) Monitoring of apoptotic events in cells treated with either 1 µM (gray) or 20 µM (black) of 4p, compared to control (red) over a period of 48 h. Data represent mean ± SD from an experiment with three replicates. * p < 0.05, ** p < 0.01.
Pharmaceuticals 14 00542 g004
Figure 5. Inhibition of migration of A549 cells in a scratch wound assay. (a) Representative phase contrast images of scratch wounds in A459 cell layer grown to 100% confluence in 96-well imaging plates. Cells were treated with either vehicle (1% DMSO) or 10 µM 4p, and the wound closure was examined directly after treatment (0 h), at 24 h, and 48 h following treatment. Dashed red lines represent the initial wound width. Scale bar (400 µM) for all images is shown in black. (b) Time-course of the relative wound density for cells treated with 4p at 1 µM (gray) and 10 µM (black) or vehicle control (1% DMSO, red). Data represent mean ± SD from an experiment with three replicates. * p < 0.05, ** p < 0.01.
Pharmaceuticals 14 00542 g005
Figure 6. Effect of 4p on the integrity of multicellular spheroids from A549 cell line. Representative phase-contrast images from time-lapse imaging of spheroids treated with either 50 µM of 4p or vehicle control (0.5% DMSO). Increasing numbers of detached cells from the spheroid core start to appear at 48 h post-treatment with 4p. The figure is representative of three independent experiments, each performed at least in duplicates. Scale bar (200 µM) for all images is shown in black.
Pharmaceuticals 14 00542 g006
Figure 7. Uptake of 4p in A431 cancer cell line. (a) Time-dependent changes in the intracellular concentration of 4p in the presence of 1 µM of extracellular concentration of the compound. Cells were harvested at 1, 5, and 12 h post-treatment, counted, and lysed. (b) Concentration-dependent changes in the intracellular concentration of 4p in the presence of 1 or 3 µM of extracellular concentration of the compound. Cells were harvested at 5 h post-treatment, counted, and lysed. In both (a,b), the concentration of 4p in the soluble fraction of the lysate was determined via LC-MS/MS using matrix calibration. Data represent mean ± SD from an experiment with three replicates.
Pharmaceuticals 14 00542 g007
Figure 8. In vitro metabolism study of 4p. (a) Metabolic stability profile of 4p (dashed line) compared to that of imipramine (solid line). Both compounds were incubated with mouse liver microsomal fractions and NADPH for 120 min. The disappearance of the parent ion over time was measured in LC-MS/MS and normalized to the amount of parent ion at the start of the incubation (t = zero). (b) Schematic presentation of major identified metabolites of 4p as elucidated from MS spectra following incubation with mouse liver microsomes and cofactors for phase I metabolism enzymes (green rectangles) and UDPGA to study glucuronidation (blue rectangles).
Pharmaceuticals 14 00542 g008aPharmaceuticals 14 00542 g008b
Publisher’s Note: MDPI stays neutral with regard to jurisdictional claims in published maps and institutional affiliations.