Article

pH Dependence of T2 for Hyperpolarizable 13C-Labelled Small Molecules Enables Spatially Resolved pH Measurement by Magnetic Resonance Imaging

by
Martin Grashei
,
Christian Hundshammer
,
Frits H. A. van Heijster
,
Geoffrey J. Topping
and
Franz Schilling
*
Department of Nuclear Medicine, TUM School of Medicine, Klinikum rechts der Isar, Technical University of Munich, D-81675 Munich, Germany
*
Author to whom correspondence should be addressed.
Pharmaceuticals 2021, 14(4), 327; https://doi.org/10.3390/ph14040327
Submission received: 26 February 2021 / Revised: 22 March 2021 / Accepted: 30 March 2021 / Published: 2 April 2021
(This article belongs to the Special Issue Next Generation of MRI Agents)

Abstract

:
Hyperpolarized 13C magnetic resonance imaging often uses spin-echo-based pulse sequences that are sensitive to the transverse relaxation time T2. In this context, local T2-changes might introduce a quantification bias to imaging biomarkers. Here, we investigated the pH dependence of the apparent transverse relaxation time constant (denoted here as T2) of six 13C-labelled molecules. We obtained minimum and maximum T2 values within pH 1–13 at 14.1 T: [1-13C]acetate (T2,min = 2.1 s; T2,max = 27.7 s), [1-13C]alanine (T2,min = 0.6 s; T2,max = 10.6 s), [1,4-13C2]fumarate (T2,min = 3.0 s; T2,max = 18.9 s), [1-13C]lactate (T2,min = 0.7 s; T2,max = 12.6 s), [1-13C]pyruvate (T2,min = 0.1 s; T2,max = 18.7 s) and 13C-urea (T2,min = 0.1 s; T2,max = 0.1 s). At 7 T, T2-variation in the physiological pH range (pH 6.8–7.8) was highest for [1-13C]pyruvate (ΔT2 = 0.95 s/0.1pH) and [1-13C]acetate (ΔT2 = 0.44 s/0.1pH). Concentration, salt concentration, and temperature alterations caused T2 variations of up to 45.4% for [1-13C]acetate and 23.6% for [1-13C]pyruvate. For [1-13C]acetate, spatially resolved pH measurements using T2-mapping were demonstrated with 1.6 pH units accuracy in vitro. A strong proton exchange-based pH dependence of T2 suggests that pH alterations potentially influence signal strength for hyperpolarized 13C-acquisitions.

Graphical Abstract

1. Introduction

Since the introduction of dissolution dynamic nuclear polarization in 2003 [1], several hyperpolarized 13C-labelled biomolecules have been applied in preclinical [2] and clinical studies [3], establishing new ways to generate magnetic resonance imaging (MRI) contrast. The metabolic conversion of [1-13C]pyruvate to its downstream metabolites [1-13C]lactate, [1-13C]alanine and 13C-bicarbonate has been investigated as an imaging biomarker for the detection and evaluation of various pathologies such as cancer [4], inflammation [5], and related changes in pH [6], as well as the functionality of various organs, such as the heart [7], liver [8], or kidney [9], and of perfusion [10]. Metabolically inert compounds such as 13C-urea and [13C,15N2]urea have also been introduced, enabling the assessment of perfusion and kidney function from signal intensity maps [9]. Hyperpolarized 13C-labelled molecules can also be used as sensors of physicochemical properties by exploiting changes in longitudinal and transverse relaxation times or chemical shift, e.g., for the detection of metal ion concentrations [11] or pH [6,12].
To sense these properties, the initially created hyperpolarized longitudinal magnetization must be excited in MRI experiments, thereby converting the longitudinal magnetization into transverse magnetization. This transverse magnetization then precesses about the static magnetic field axis while decaying exponentially with a time constant T2, known as the transverse relaxation time constant. This decay mainly occurs because the individual spins, composing the net transverse magnetization, experience microscopic field fluctuations over time. These fluctuations induce small changes in the spins’ Larmor frequencies, thereby causing the spins to lose synchrony over time, i.e., to dephase, decreasing the measurable net signal.
T2 limits preparation and acquisition time and thereby influences the achievable spectral and spatial resolution and signal strength; therefore, a long T2 is desirable for hyperpolarized 13C-MRI experiments. Nevertheless, T2 weighting or direct measurement of T2 can also be exploited to generate contrast in hyperpolarized 13C-MRI, whereby dependencies of T2 on biomarkers such as pH might be of interest for in vivo applications.
However, T2 measurements involve acquisitions at multiple echo times that lead to additional dephasing beyond T2. This includes spins diffusing between refocusing pulses [13] and imperfect refocusing [14], potentially leading to a mixture of T1 and T2 decay. The measured T2 is thus an apparent transverse relaxation time constant (Appendix A). Despite this discrepancy, the term T2 is used in the following when reporting results, while explicitly stating here that apparent T2 relaxation times are meant.
Changes in the apparent transverse relaxation time, as demonstrated by T2-mapping for hyperpolarized 13C-urea [15], have been shown to detect alterations of tissue oxygenation [16], protein content [16], viscosity [17] or restricted diffusion due to cellular uptake [17]. Furthermore, T2 measurements in hepatocellular carcinoma showed differences in T2 between healthy and tumor tissue for [1-13C]alanine and [1-13C]lactate [18], with further heterogeneity in T2 indicated by the necessity of multi-exponential fitting of the transverse magnetization decay curves of healthy [15,17,19] and tumor tissue [19,20].
Many approaches for the assessment of metabolism using hyperpolarized magnetic resonance spectroscopy and imaging rely on the acquisition of spin echoes and are inherently sensitive to T2, such as point-resolved spectroscopy (PRESS) [18,21], fast spin echo [16,22,23], double spin echo [8,24], multi-echo spin echo [20], or balanced steady-state free precession (bSSFP) sequences [9,15,17,25,26]. However, to the best of our knowledge, the sensitivity of these sequences to alterations of T2 and heterogeneity in T2 within the imaged object has so far not been considered for the calculation of metabolic conversion rates. This is especially important for sequences that employ echo times on the time scale of the T2 relaxation constants of the metabolites being imaged.
Consequently, the T2 relaxation time constants of several commonly imaged biomolecules, such as [1-13C]pyruvate [19,20,25,27,28], [1-13C]lactate [18,19,20,25,27], [1-13C]alanine [18,19], 13C-urea [15], [13C,15N2]urea [15,16,17], 13C-bicarbonate [19,26], bis-1,1-(hydroxymethyl)-1-13C-cyclopropane-2H8 (HP001) [27] or [1-13C]acetate [26] have been measured at various magnetic field strengths; in vivo for various organs or diseases, or in vitro for various viscosities or media. In addition to those influencing factors, further parameters that are altered in vivo, such as tissue [29] or blood [30,31,32] buffer capacity and pH [33,34], might affect T2 but have not yet been explored.
In this work, the pH dependence of the T2 relaxation time constant of several 13C-labelled biomolecules that are commonly used for hyperpolarized magnetic resonance imaging is investigated. For the two compounds with the strongest pH dependence of T2 in the physiological pH range, namely, [1-13C]pyruvate and [1-13C]acetate, further factors influencing T2 are examined, including concentration, temperature, buffer capacity, and salt concentration. Furthermore, T2 mapping is used to generate images with strong pH-based contrast in buffer-free aqueous solutions using [1-13C]acetate as a pH sensor.

2. Results

The apparent T2 relaxation time constants of some of the most commonly applied hyperpolarized 13C-labelled small molecules, namely [1-13C]acetate, [1-13C]pyruvate, [1-13C]lactate, [1-13C]alanine and 13C-urea, were measured across the pH range 1–13. For [1,4-13C2]fumarate, the T2 relaxation time constant was measured across the pH range 4–13, because its solubility strongly decreases for pH < 4.

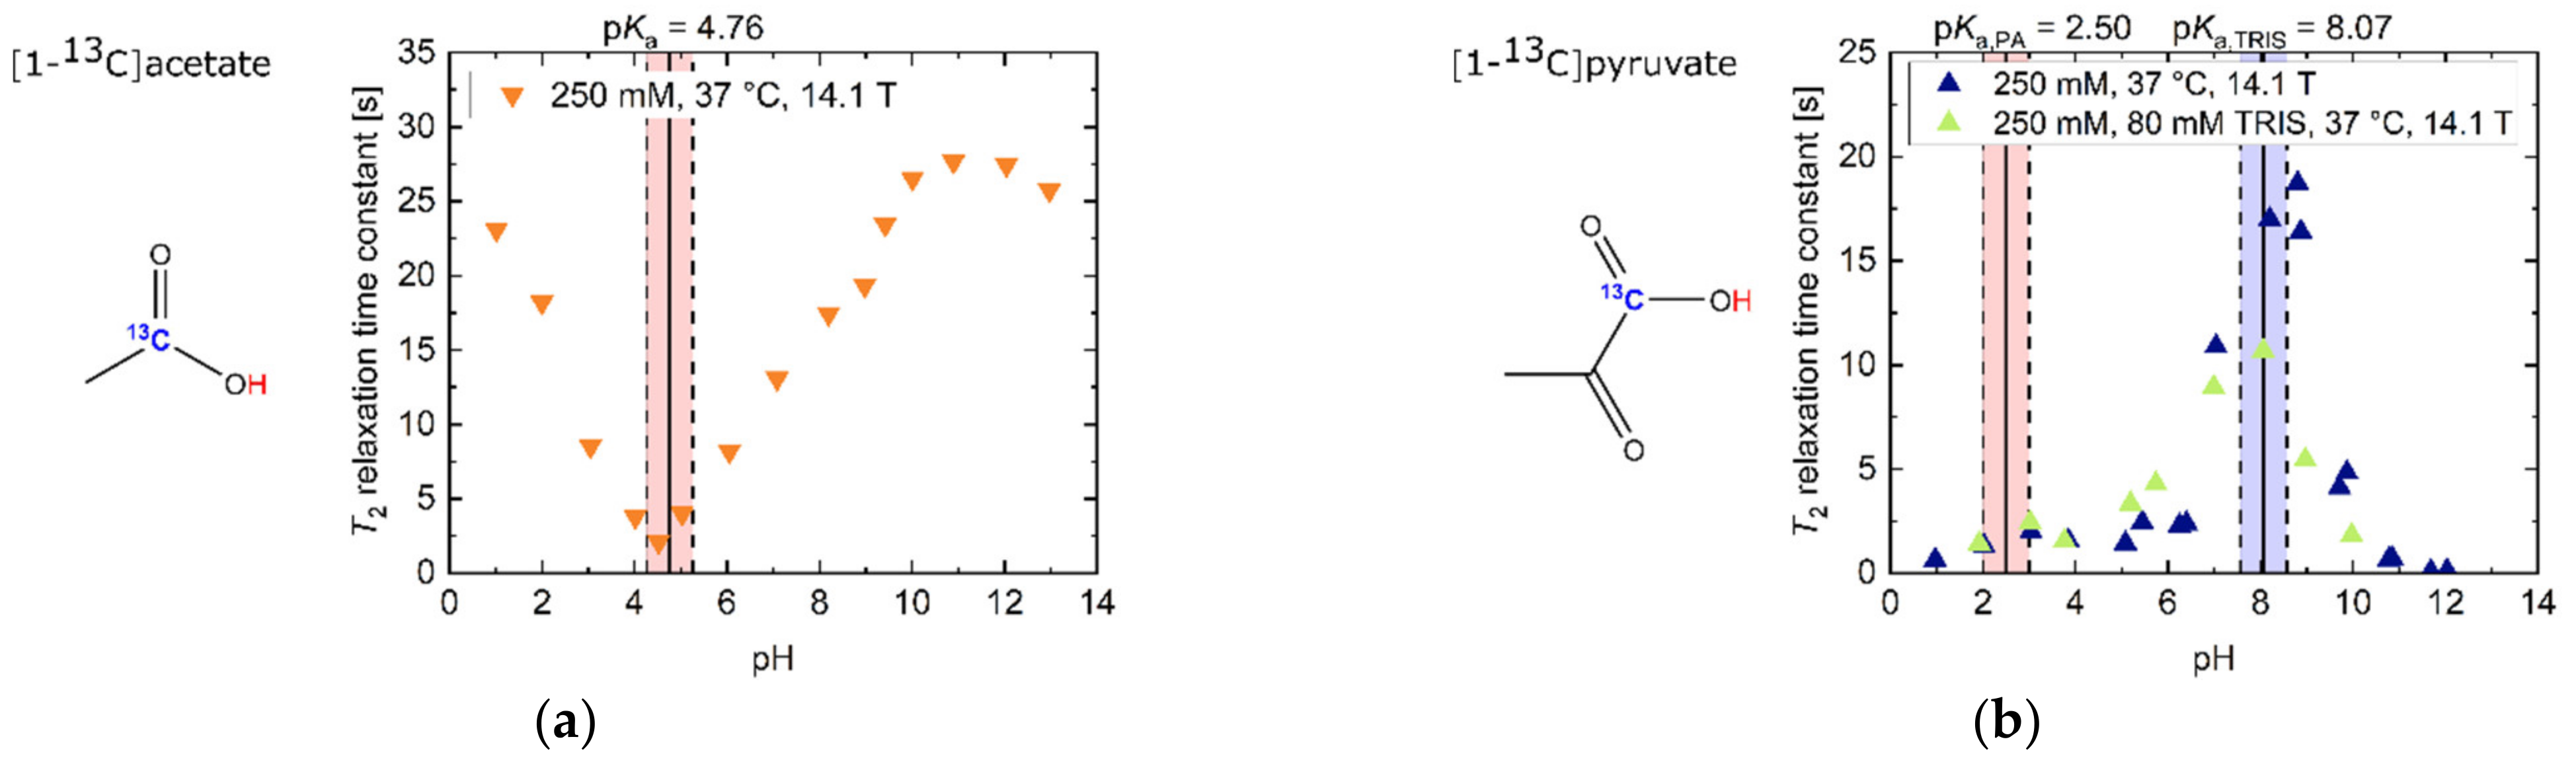
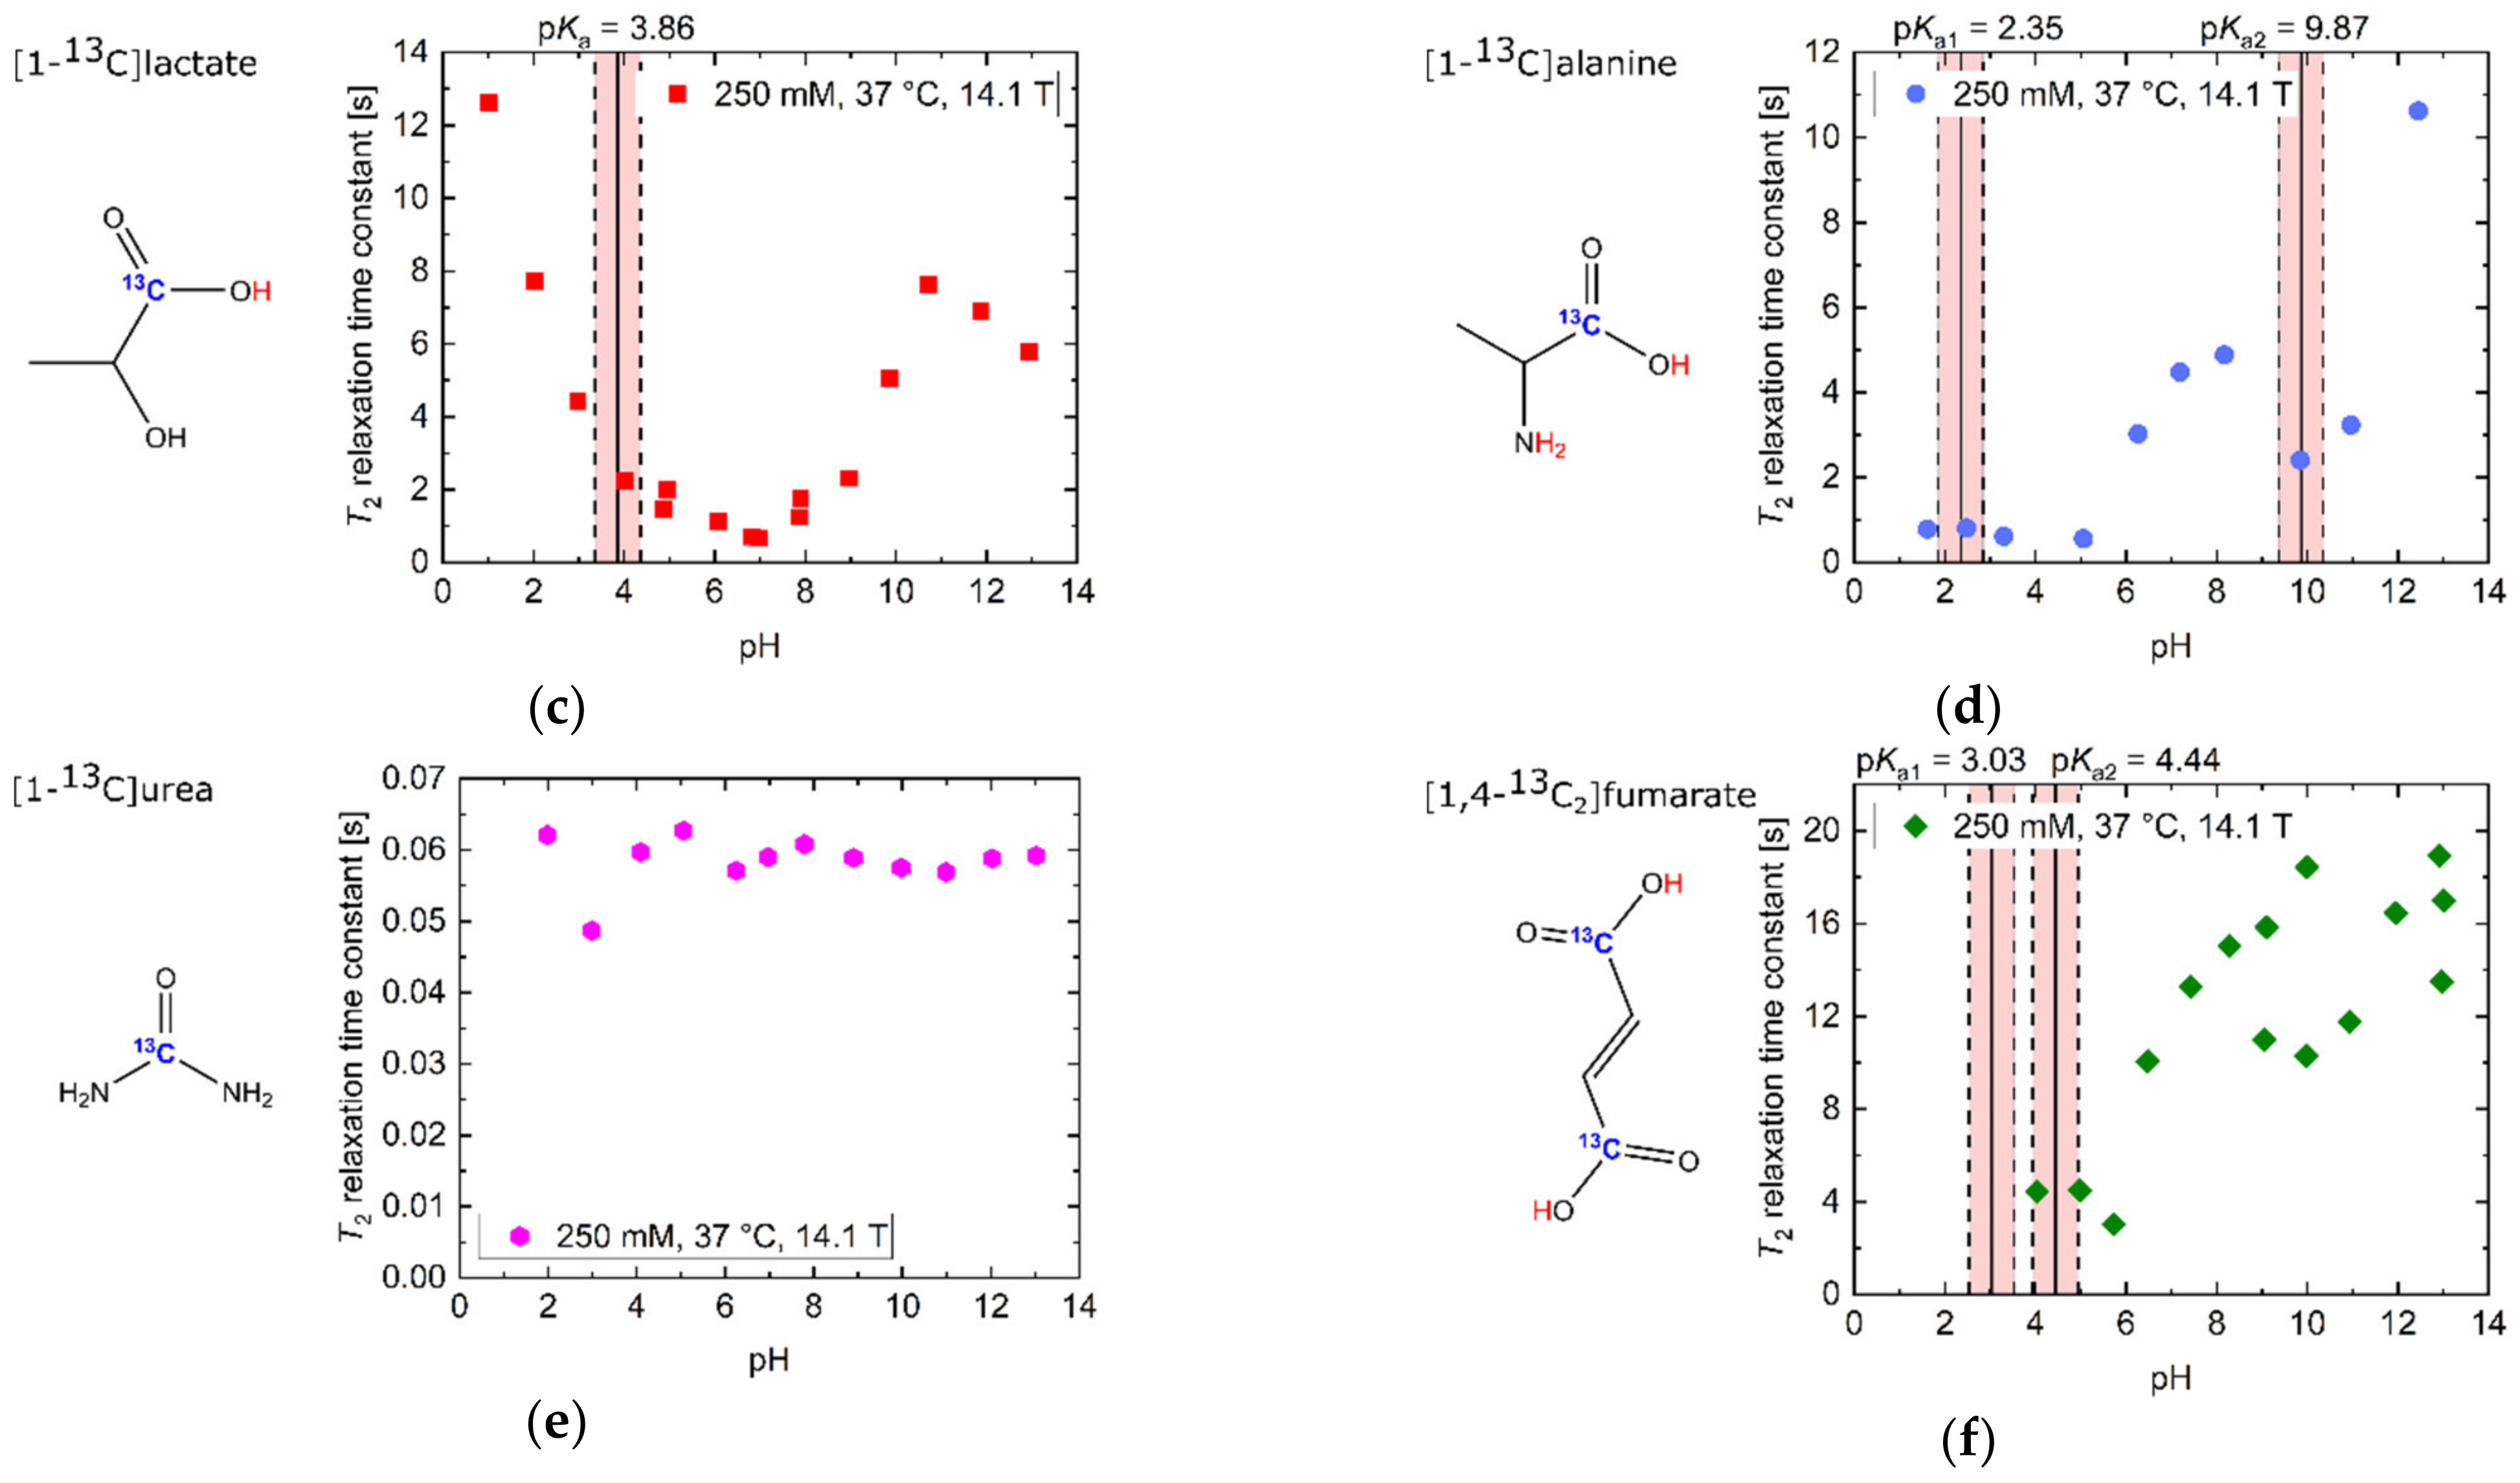
2.1. pH Dependency of T2 for Commonly Used Hyperpolarized 13C-Labelled Small Molecules

In the strongly acidic (T2 = 23.1 s, pH 1.02) and basic (T2 = 25.8 s, pH 12.97) regimes (Figure 1a), [1-13C]acetate showed 13C-T2 relaxation time constants in the order of its T1 at 14.1 T (T1 = 27 s, pH 1; T1 = 39 s, pH 13; [35]), with T2 values in the basic regime being slightly larger compared to the acidic regime. Furthermore, T2 exhibited a linear decrease of one order of magnitude (T2 = 2.1 s, pH 4.52) towards its pKa = 4.76. This slope was flattened towards neutral to slightly basic pH values, because water has a value pKa = 6.81 at 37 °C in this pH regime [36].
[1-13C]pyruvate (Figure 1b) had its maximum T2 at pH 8.81 (T2 = 18.7 s, pH 8.81). Towards even stronger alkaline pH values, T2 decreased by more than two orders of magnitude (T2 = 0.1 s, pH 12.04). Addition of TRIS buffer (pKa = 8.07) also decreased the T2 of pyruvate by 37% (pH 8.07–8.20), predominantly in pH regimes close to the pKa value of the buffer. At even more acidic pH values, close to pyruvate’s pKa = 2.50, T2 was further shortened (1.3 s, pH 2.03).
In contrast, [1-13C]lactate showed a global T2 maximum at strongly acidic pH values (Figure 1c, T2 = 12.6 s, pH 1.03). Towards less acidic pH values around its pKa = 3.86, T2 strongly decreased and had a minimum at neutral pH (T2 = 0.7 s, pH 6.90). Towards more alkaline pH values, T2 of [1-13C]lactate increased, reaching a maximum T2 around pH 11 (T2 = 7.6 s, pH 10.72). Beyond this pH, more alkaline milieus led to a reduction in T2 (T2 = 5.8 s, pH 12.95).
[1-13C]alanine showed an overall decrease in T2 from its maximum at basic pH milieus (Figure 1d, T2 = 10.6 s, pH 12.45) towards acidic pH milieus, with additional reductions in T2 at the pKa values of the amide (pKa1 = 9.87) and the carboxyl group (pKa2 = 2.35). In addition, T2 decreased by one order of magnitude from basic to acidic pH regimes (T2 = 0.8 s, pH 1.61).
In strong contrast, 13C-urea, which does not exchange protons with its aqueous solvent environment, showed an almost constant value for T2 across the entire pH range (Figure 1e, T ¯ 2 = 0.1 s), with a relatively low absolute T2 value compared to the other investigated 13C-labelled molecules (Figure 1a–f).
The T2 of [1,4-13C2]fumarate was also shortened for pH values (T2 = 4.4 s, pH 4.04) near its carboxyl group’s pKa values (pKa1 = 3.03, pKa2 = 4.44), as well as around pH 7. For alkaline pH values above pH 8, T2 reached its maximum values (T2 = 13.5–17.0 s, pH 12.97–13.02).
[1-13C]acetate in the basic regime exhibited the highest overall measured T2 (T2,max = 27.7 s, pH 10.90) with a 13.18-fold increase (ratio T2,max/T2,min) compared to its measured minimum T2 (T2,min = 2.1 s, pH 4.52). Especially notable in the context of applications in hyperpolarized 13C-MRI, [1-13C]acetate’s T2 value at physiological pH 7.4 (T2 = 14.7 s, pH 7.4) was also the longest of all molecules investigated in this work. Furthermore, T2 of [1-13C]acetate also exhibited a strong sensitivity to alterations in the physiological pH range 6.8–7.8 [37,38] (mean ΔT2 = 0.44 s/0.1 pH).
Maximum and minimum T2 values, T2 values at physiological pH, ratio between maximum and minimum T2 values and pH sensitivity of T2 in the physiological pH range are listed for all investigated molecules in Table 1.
As pointed out previously, 13C-urea showed low to no sensitivity of T2 to pH variations in the physiological range (mean ΔT2 < 0.001 s/0.1pH) and little difference between the maximum and minimum measured T2 (ratio T2,max/T2,min = 1.2). In contrast, [1-13C]pyruvate exhibited a more than 200-fold change between its minimum and maximum T2 across the entire pH range. Furthermore, [1-13C]pyruvate showed the largest sensitivity of T2 to pH in the physiological pH range of all molecules (mean ΔT2 = 0.95 s/0.1pH). [1-13C]lactate showed a decrease (pH 6.8–6.9) as well as an increase in relaxation time constant values with increasing pH from pH 6.9 to pH 7.8, with a minimum close to pH 6.9.

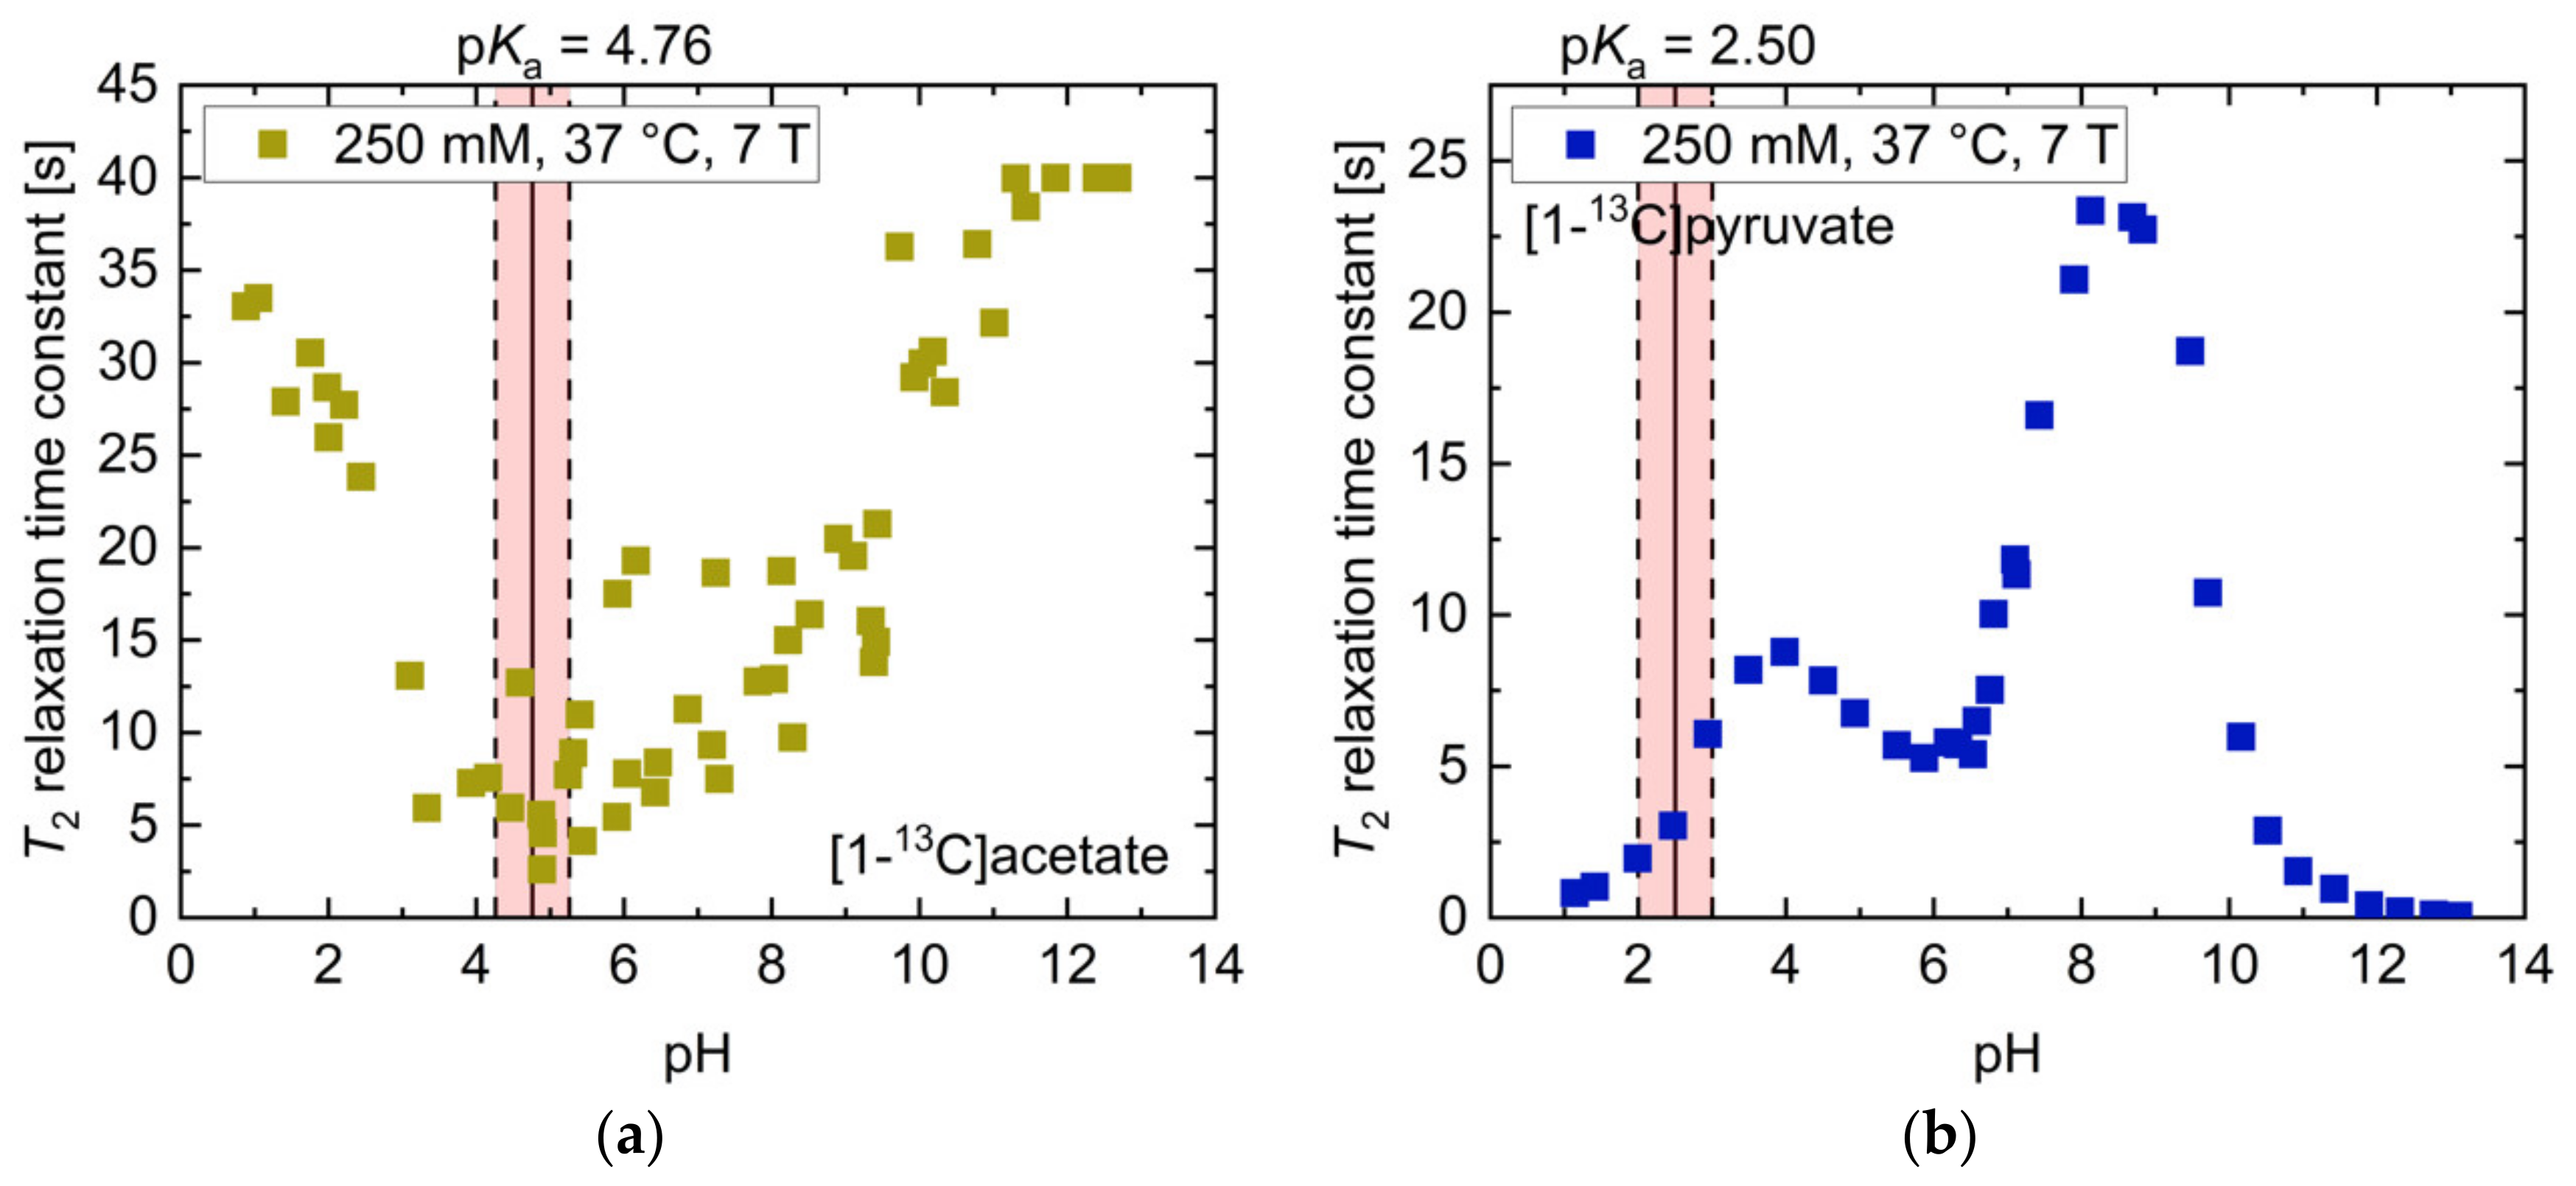
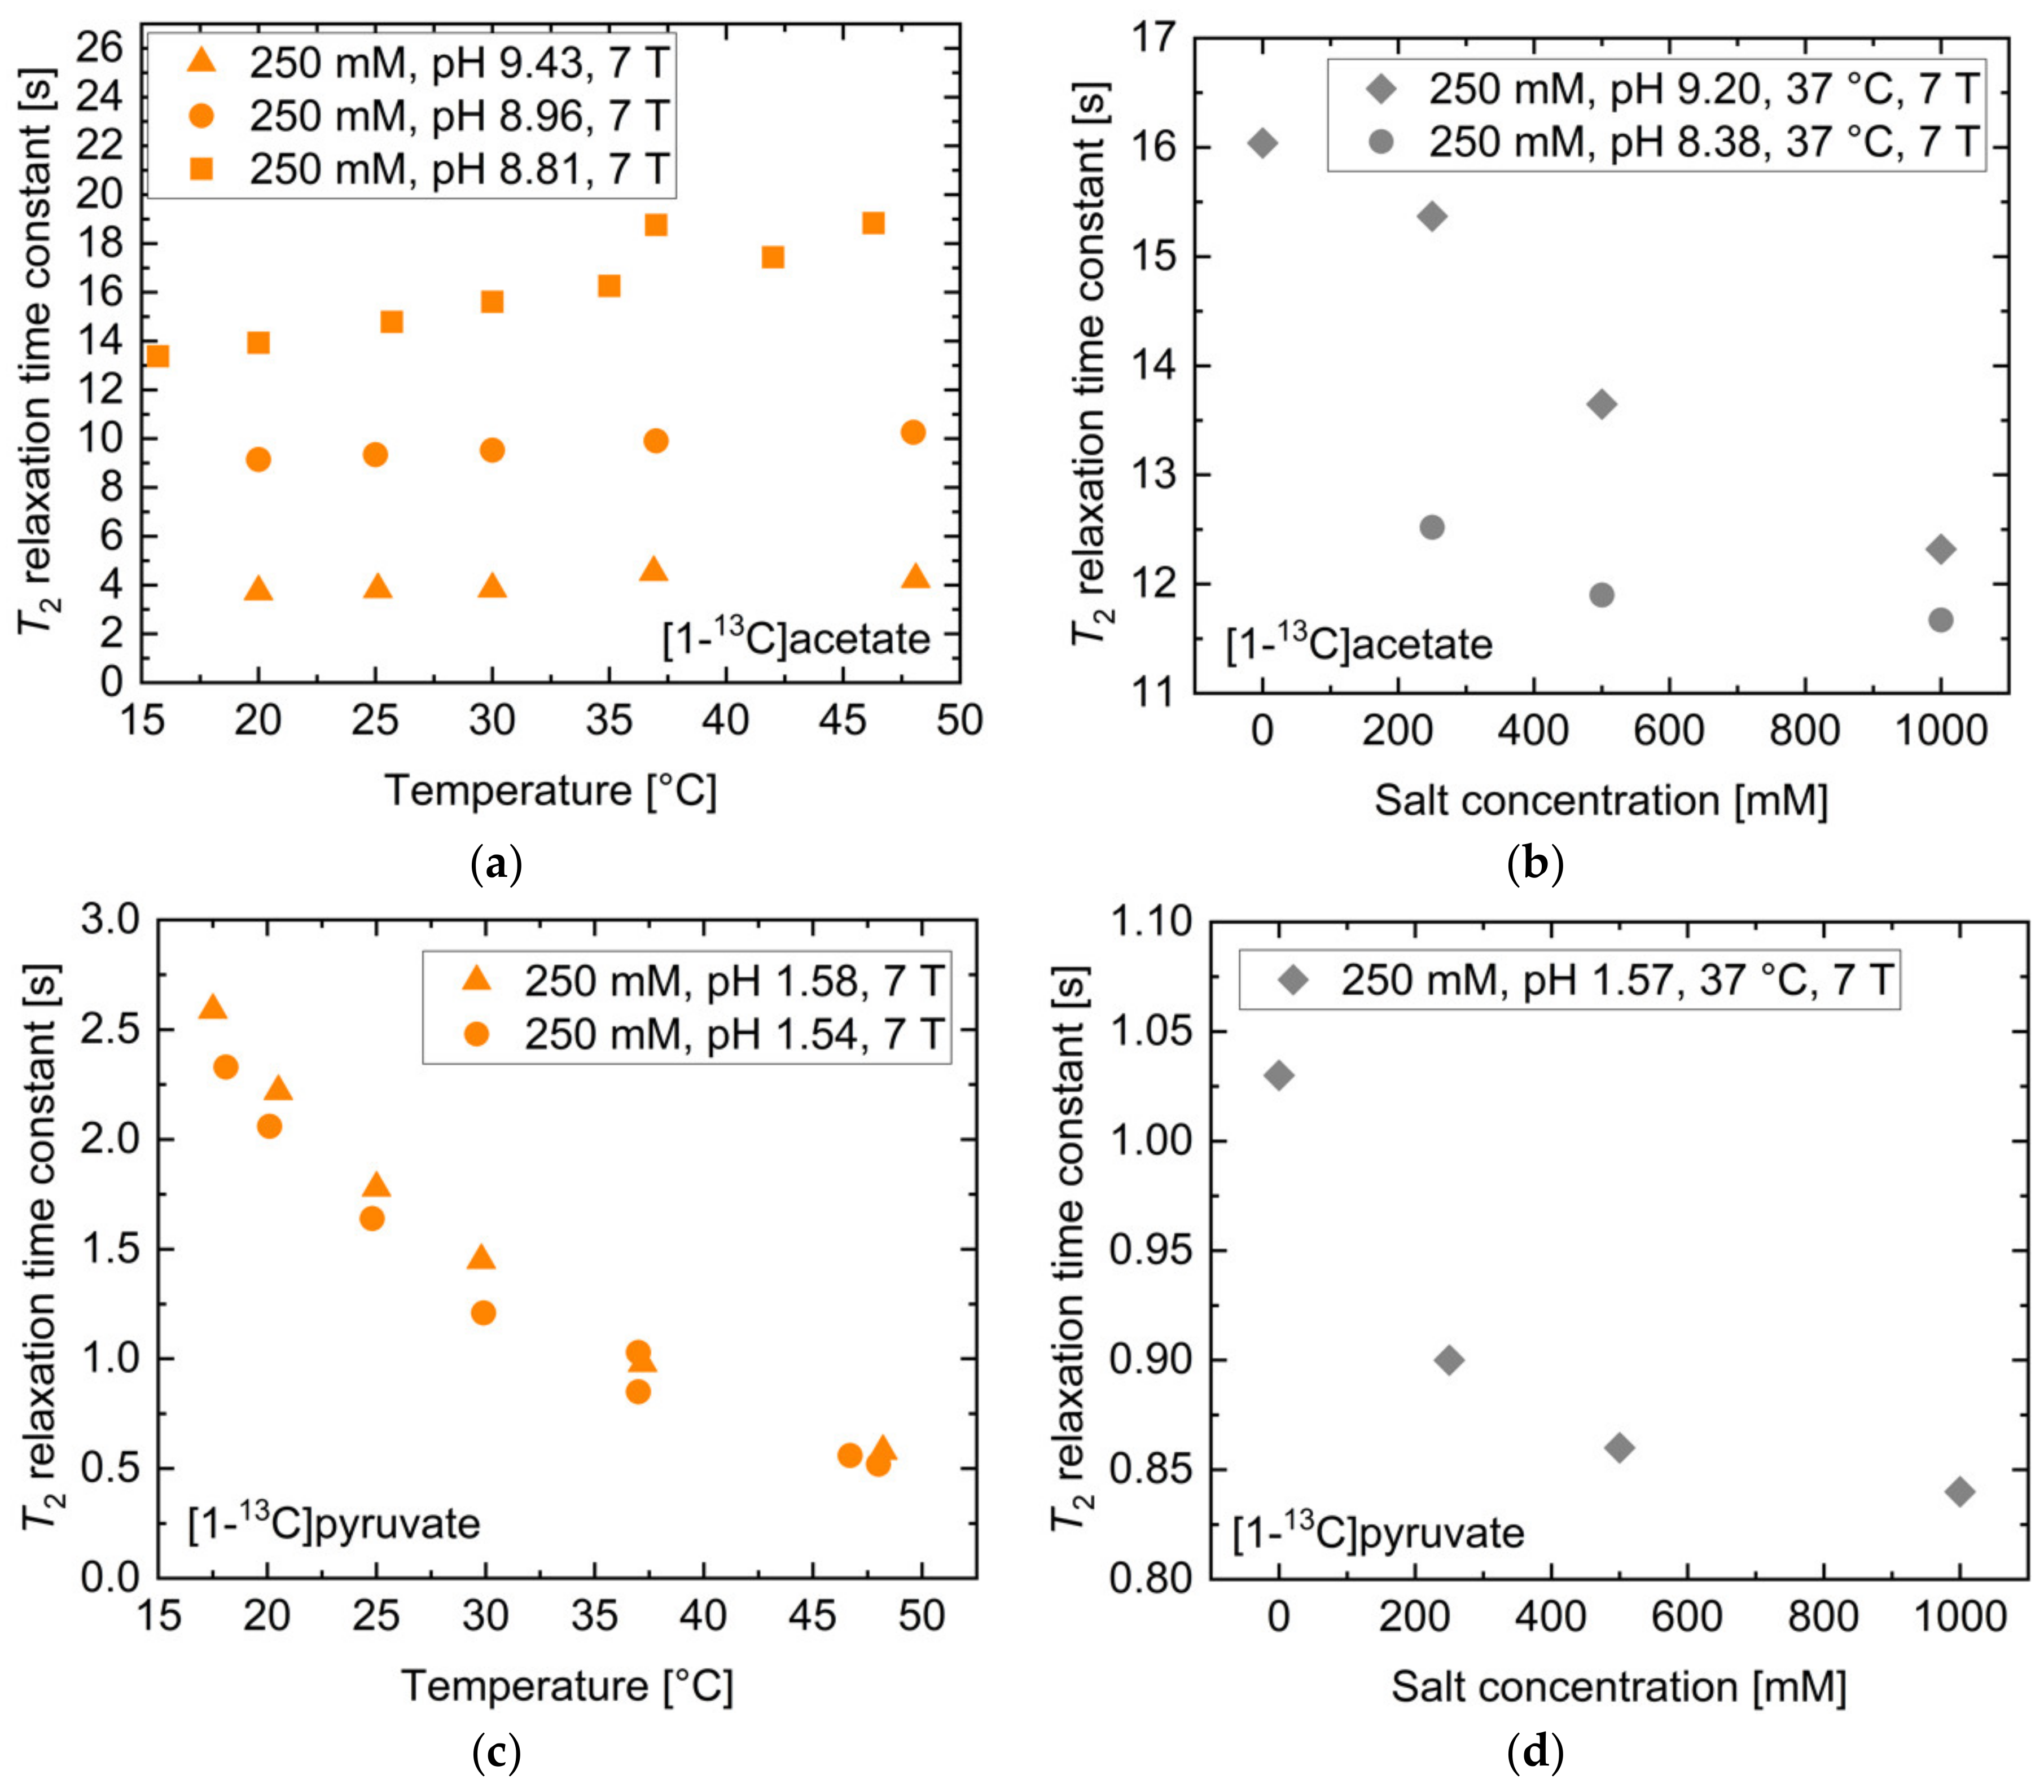
2.2. pH, Temperature and Salt Concentration Dependence of T2 for [1-13C]acetate and [1-13C]pyruvate

Figure 1a,b and Table 1 indicate that [1-13C]acetate and [1-13C]pyruvate showed a strong linear pH dependence of T2 in the physiological pH range (pH 6.8–7.8) [37,38,39]. Therefore, both molecules were considered as potential candidates for in vivo pH imaging via T2 mapping with hyperpolarization techniques for signal enhancement.
The overall pH–T2 dependence of [1-13C]acetate at 7 T (Figure 2a) was similar to higher-field measurements at 14.1 T (Figure 1a), but exhibited higher absolute T2 values (T2 = 40.0 s, pH 11.84–12.68). However, at neutral to slightly basic pH, there was a weaker sensitivity to pH changes at 7 T compared to higher field measurements. [1-13C]pyruvate showed pH-dependent T2 relaxation time constants at 7 T (Figure 2b) of similar magnitude (T2,max = 23.4 s, pH 8.12) compared to 14.1 T (Figure 1b), however also exhibited a local maximum (T2 = 8.8 s, pH 3.98) at slightly acidic pH and a local minimum at pH 6.00 (T2 = 5.3 s, pH 5.87).
The dependence of T2 on temperature, salt concentration, concentration and magnetic field strength was also investigated. For [1-13C]acetate, the temperature dependence of T2 for three different pH values in the range pH = 8.81–9.43 was measured (Figure 3a). Offsets between the different curves are attributed to the different solution pH values for each curve. Only a moderate increase across a wide temperature range (<50% maximum across 30 °C span) was observed. Addition of NaCl salt (Figure 3b) showed a moderate decrease (<25%) in T2 up to 1 M salt concentration for two titrations at pH = 8.23 or 9.32. For unbuffered [1-13C]pyruvate near pH 1.5, T2 showed an exponential reduction upon increases in temperature from 15 to 50 °C (Figure 3c). Addition of NaCl salt showed similar effects (Figure 3d) as for [1-13C]acetate, with the T2 relaxation time constant only being reduced by 16% upon the addition of 1 M NaCl. Furthermore, both molecules showed a strong increase in T2 with decreasing concentration (Supplementary Materials Figure S1); dilution from 250 mM to 50 mM led to an approximately 100% increase in T2, while increasing the concentration from 250 mM to 1000 mM resulted in a decreased T2 of [1-13C]acetate and [1-13C]pyruvate by up to 50% and less than 24%, respectively.
In addition, for [1-13C]pyruvate, the influence of magnetic field strength on T2 was assessed by comparing measurements at 1 T, 7 T and 14.1 T, which showed moderate decreases in T2 with higher magnetic field, particularly at slightly acidic and basic pH regimes (Supplementary Materials Figure S2).
To assess the relevance of concentration, salt concentration, temperature, and pH for T2 measurements in vivo, a realistic range of parameter values centered around a physiological reference value was selected. T2 values for the reference values as well as for the upper and lower bounds of these parameters were derived from the curves in Figure 3a–d and Figure S1. The results are listed for [1-13C]acetate in Table 2 and for [1-13C]pyruvate in Table 3.
The 13C-labelled compounds are typically injected at a concentration of 60–100 mM with an injection volume to blood volume ratio of 1:10 [12], thereby potentially resulting in in vivo variations between 5 mM to 80 mM, with values near 10 mM being likely blood concentrations. Variations of the concentration within this range resulted in T2 changes of up to 45.4% for [1-13C]acetate and 23.6% for [1-13C]pyruvate. Whole blood typically contains approximately 150 mM dissolved salt, with values below 120 mM and above 180 mM indicating severe hypo- and hypernatremia, respectively [40]. Such variations account for up to 8.5% and 2.0% change in T2 for [1-13C]acetate and for [1-13C]pyruvate, respectively. In vivo temperature alterations during magnetic resonance (MR) acquisitions may plausibly cover regions between 35 °C and 39 °C, with 37 °C being normal human body temperature. For [1-13C]acetate, this amounted to only a 1.6% change in T2, while [1-13C]pyruvate showed up to 10.6% deviation in T2 within this temperature range.
Finally, the effect of pH on T2 within a potential in vivo blood pH range from 6.8 [37] to 7.8 [38], with pH 7.4 being physiological blood pH, was evaluated. This revealed a strong alteration of T2 by up to 16.9% for [1-13C]acetate and up to 41.2% for [1-13C]pyruvate within these boundaries, relative to the physiological reference pH. Thus, concentration and pH were shown to have the strongest effect on the transverse relaxation time constants for these molecules under physiologically plausible conditions.

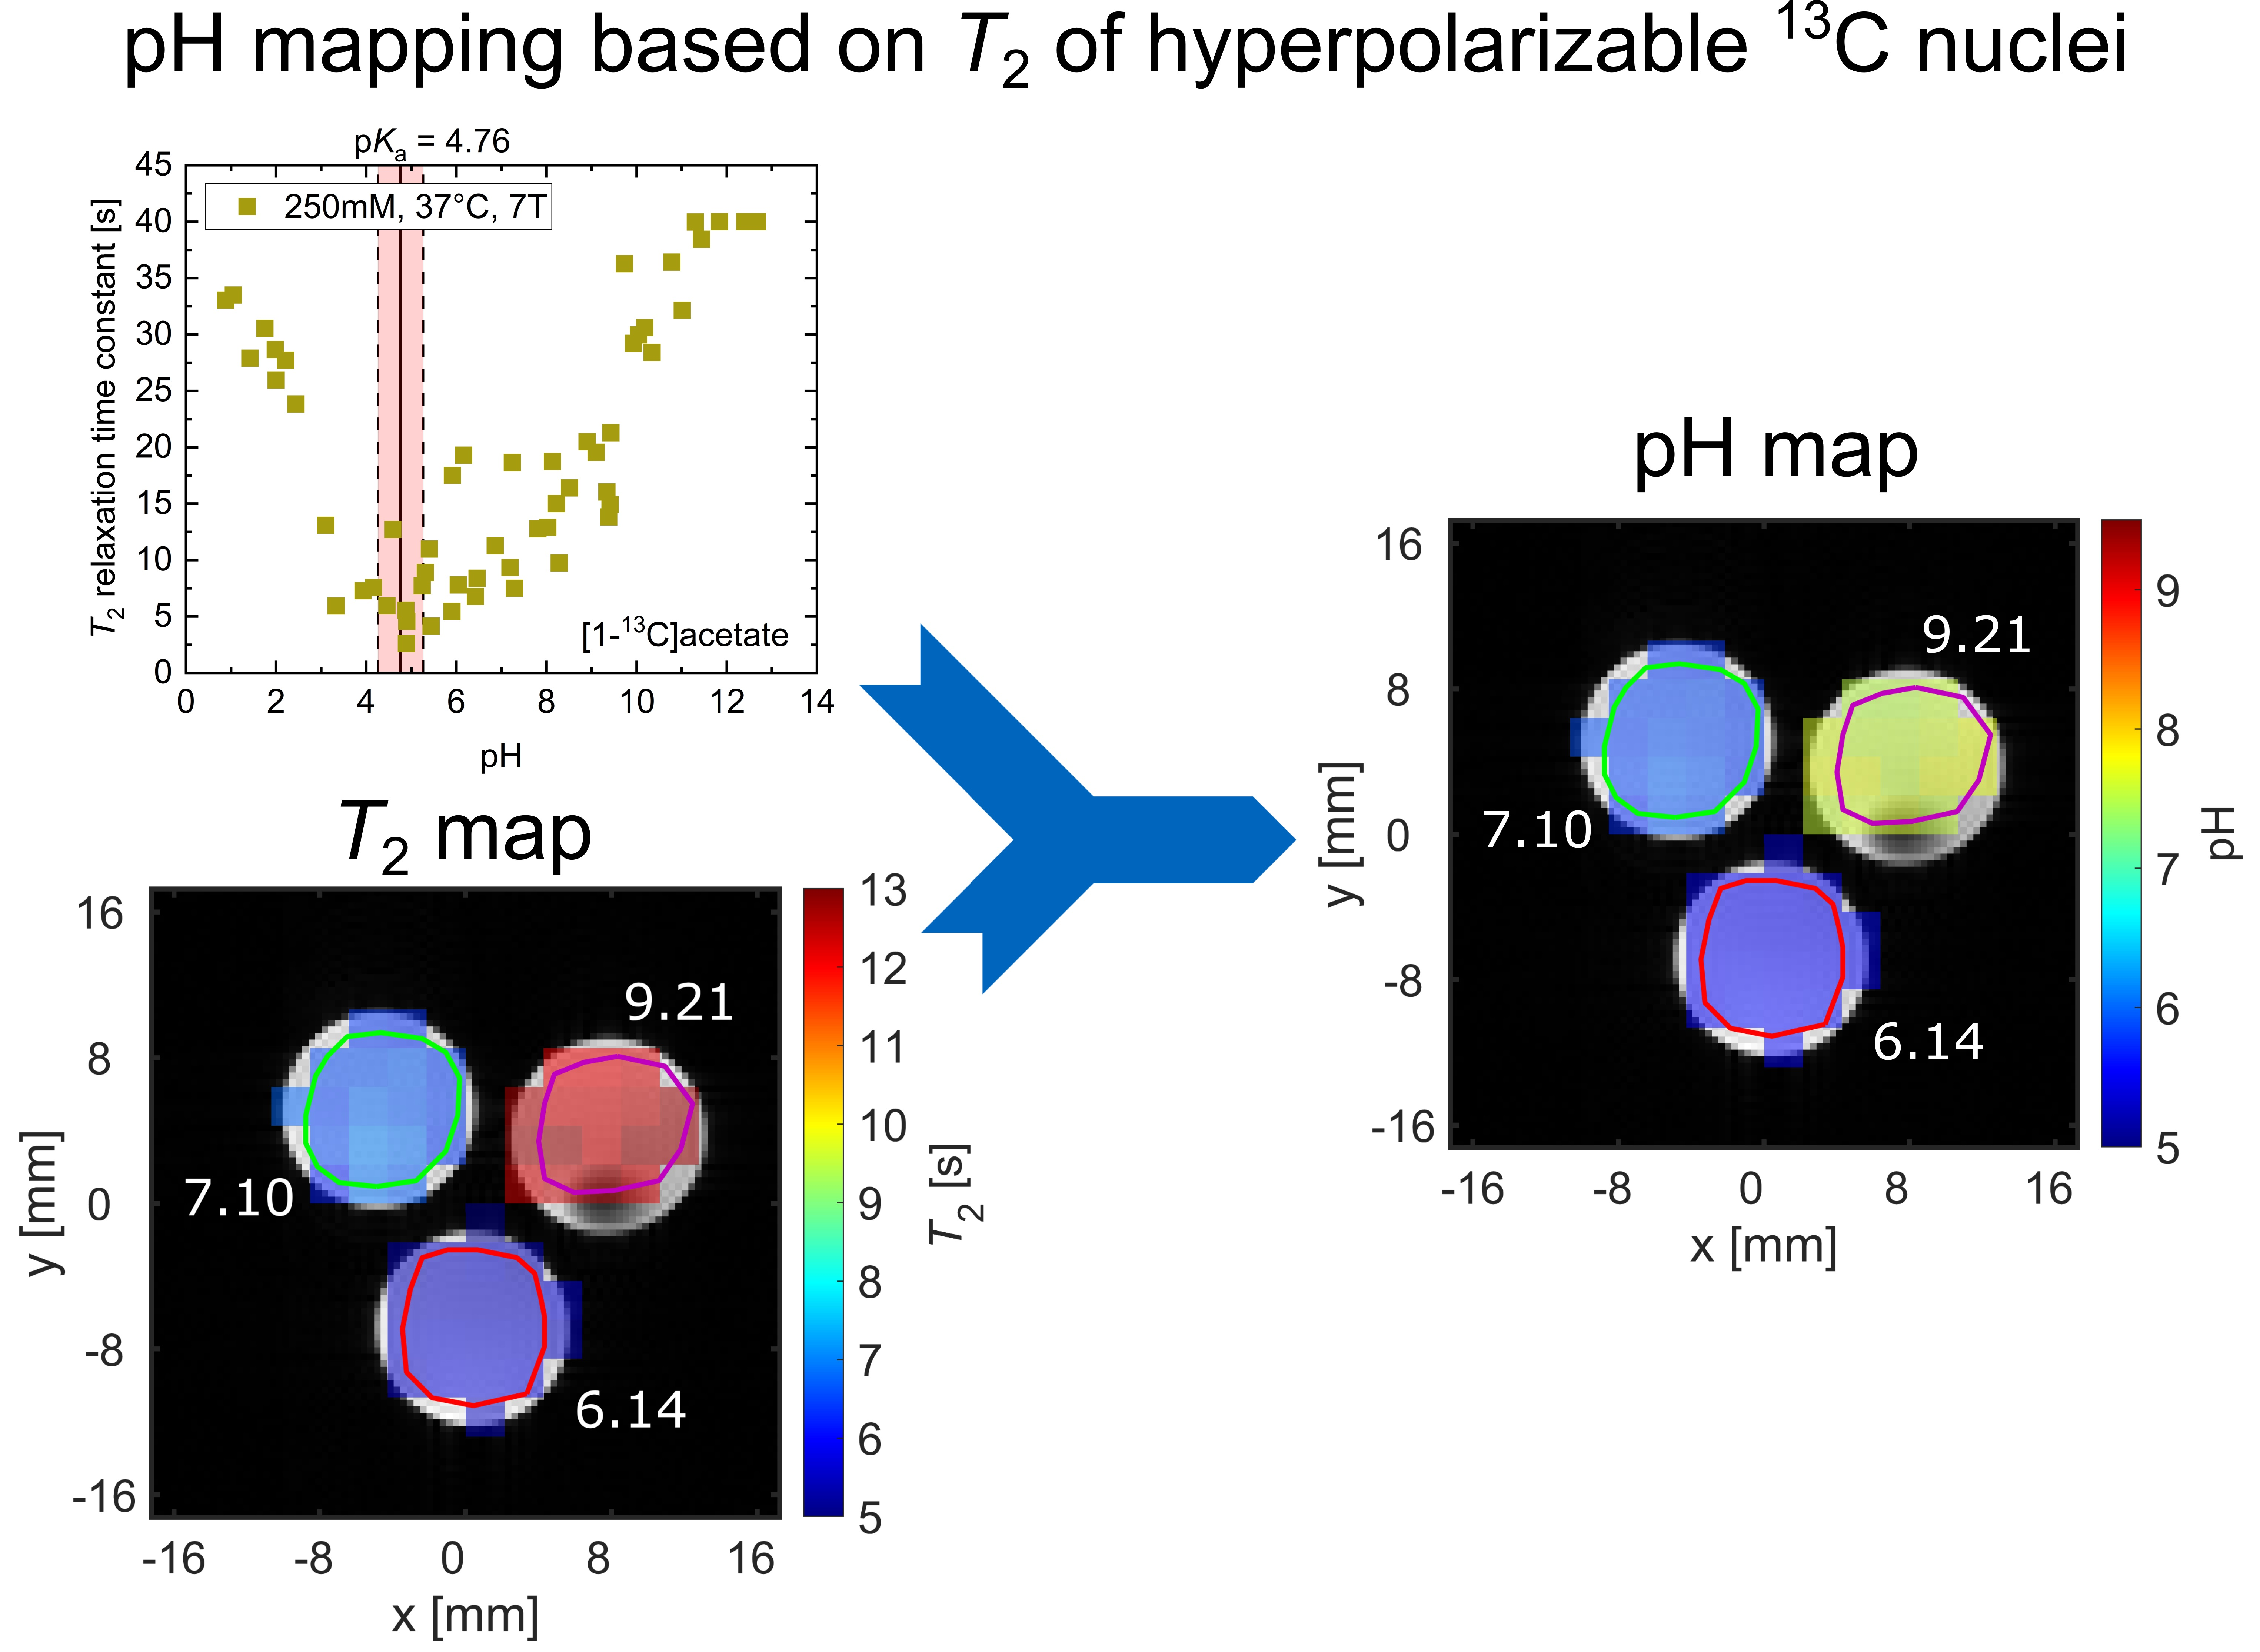
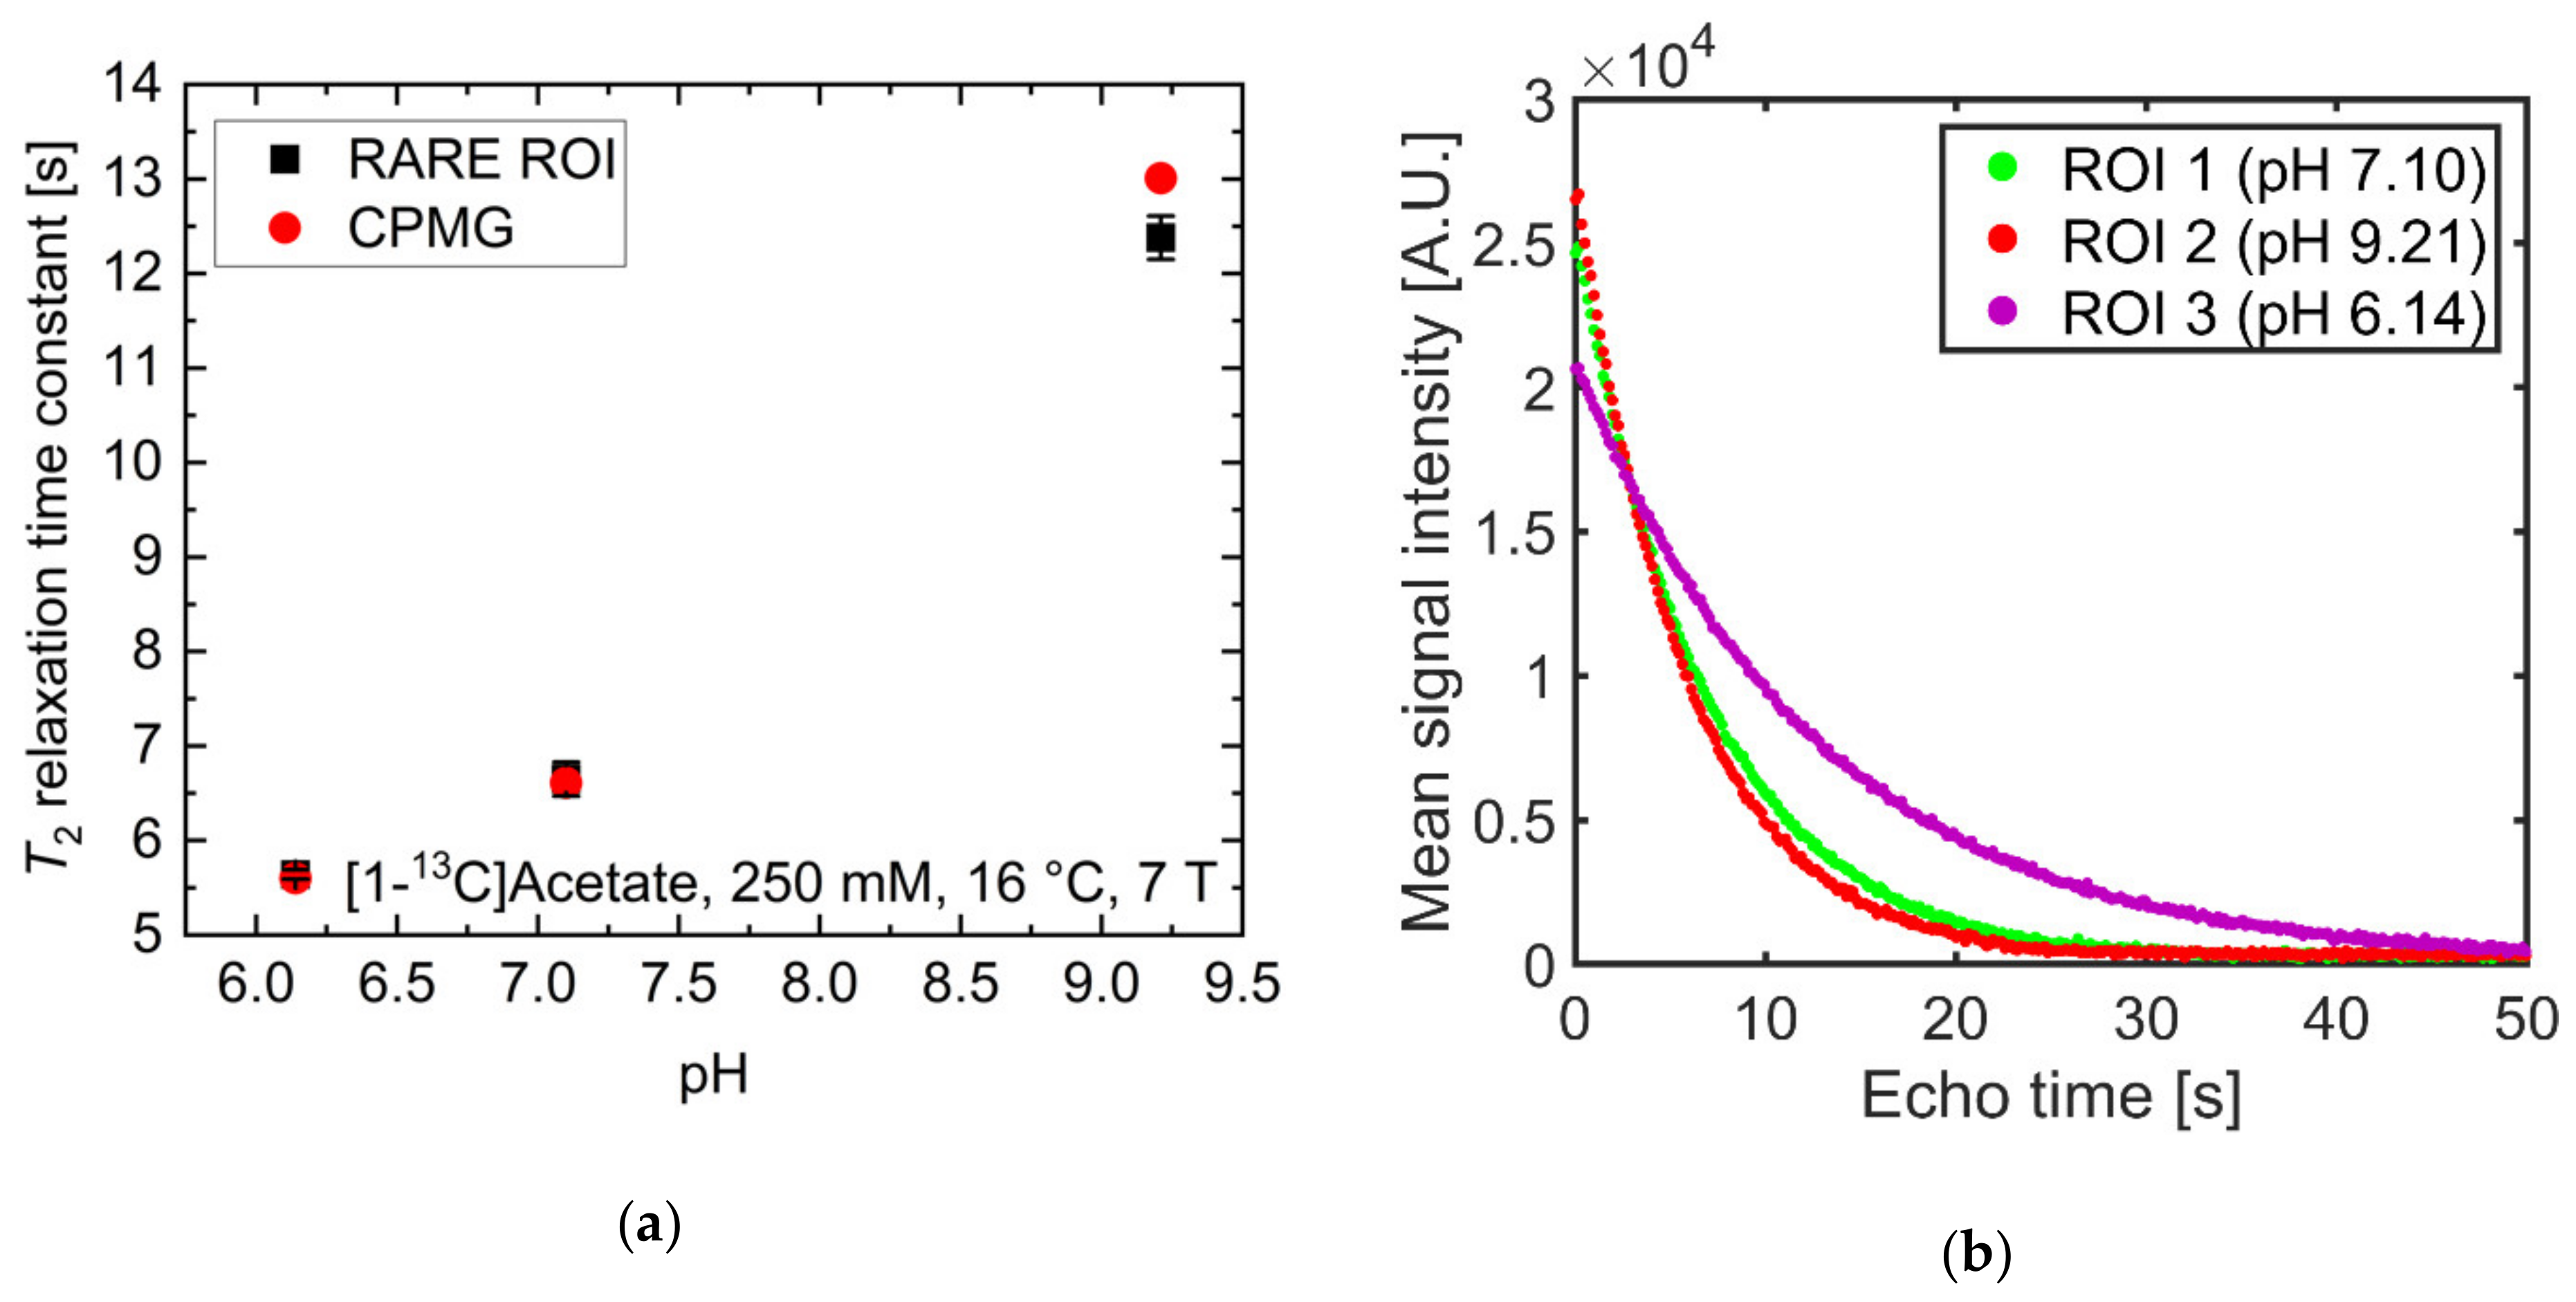
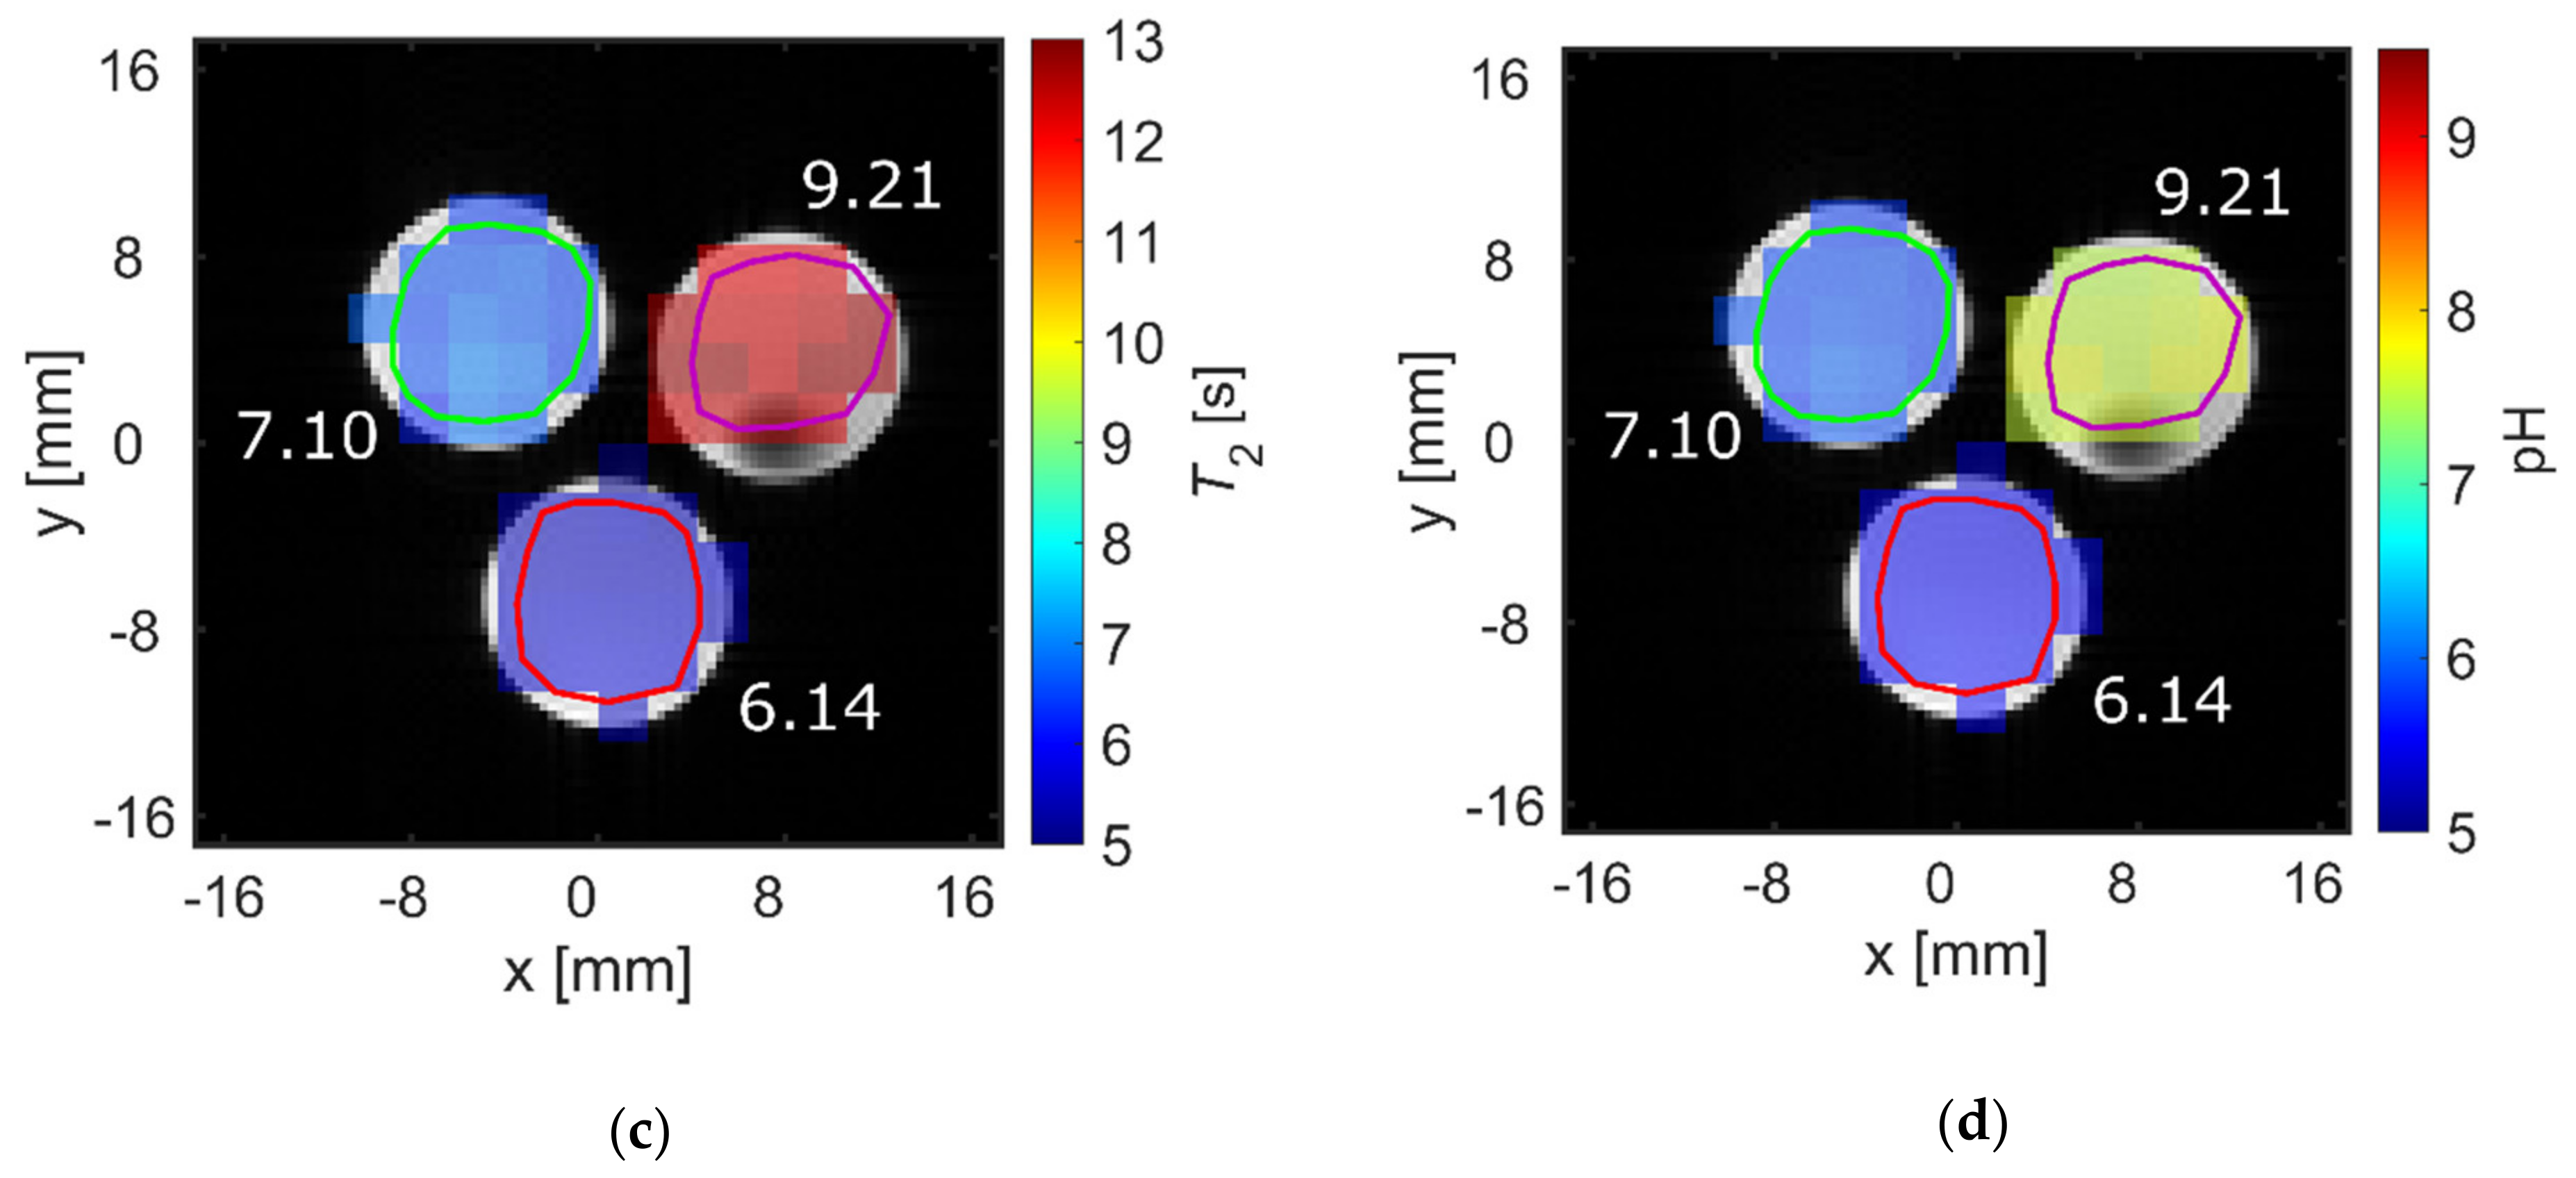
2.3. pH Imaging in Aqueous Solutions Using [1-13C]acetate

pH strongly influenced T2 at physiological pH values for [1-13C]acetate. Therefore, the ability to spatially resolve pH values using T2 mapping was investigated. Three tubes of [1-13C]acetate containing solutions with three different pH values near physiological pH (6.14, 7.10, 9.21) showed strongly differing T2 values when measured for each tube separately (Figure 4a, red). Signal time curves (Figure 4b) from the acquired echo images and averaged across each tube showed long-lasting signals, with T2 values almost identical to those measured with a Carr-Purcell-Meiboom-Gill (CPMG) train without spatial encoding gradients (Figure 4a, black). T2 maps were generated by voxel-wise fitting (Supplementary Materials Figure S3) to the echo image intensities. These maps show good homogeneity of the calculated T2 values across each tube region of interest (ROI) (Figure 4c) and have a high pH contrast between tubes (green encircled ROI: mean T2 = 6.7 ± 0.2 s; red encircled ROI: mean T2 = 5.6 ± 0.1 s; magenta encircled ROI: mean T2 = 12.4 ± 0.2 s). Slight differences in the absolute T2 values between CPMG and rapid acquisition relaxation enhancement (RARE) values are likely caused by additional diffusion-weighting from the applied imaging gradients leading to a shortening of the apparent transverse relaxation times. The small differences between imaging and non-imaging fit results indicate that diffusion related signal loss in the imaging sequence could be minimized sufficiently using short echo times (Appendix A) and low encoding gradient strengths to reproduce the relaxation time constants measured by the non-imaging CPMG methods.
By fitting the titration curve in Figure 2a with a linear relationship in the range pH 6.14–9.21 (15 data points), calibration curves between pH and T2 can be determined, allowing pH maps to be calculated from T2 maps (Figure 4d). The derived T2 values from the CPMG measurements (Figure 4a) cannot be perfectly represented with a linear relationship; therefore, pH maps show systematic uncertainty of up to 1.6 pH units (green encircled ROI: mean pH = 5.87 ± 0.06, true pH = 7.10; red encircled ROI: mean pH = 5.56 ± 0.01, true pH = 6.14; magenta encircled ROI: mean pH = 7.62 ± 0.07, true pH = 9.21). However, tubes of different pH remain well-distinguishable, with a calculated pH heterogeneity of less than 0.1 pH unit within each tube. To further evaluate the ability to translate this pH mapping method for in vivo applications, T2 of hyperpolarized [1-13C]pyruvate was measured at 25 mM at 1 T and thermal [1-13C]pyruvate was measured at 600 mM at 7 T in human blood (Appendix B). Despite some indication for larger T2 values at more acidic blood pH, no robust calibration curve could be obtained.

3. Discussion

In this work, pH was shown to strongly influence T2 relaxation time constants of 13C-labelled hyperpolarizable biomolecules which are commonly imaged in vivo.
[1-13C]acetate at 14.1 T showed a minimum of T2 around pH values close to its pKa at 14.1 T. This can be explained by the fast proton exchange of the carboxyl proton in the vicinity of this pH [41,42]. The slope of the titration curve close to this minimum T2 was slightly flattened towards basic pH values. At pH values close to the pKa = 6.81 of water at 37 °C [36], fast proton exchange at the carboxyl group of acetate with non-dissociated water based on the Grotthuss mechanism might take place. Furthermore, the Grotthuss mechanism, describing the exchange of protons between H2O molecules, might be most efficient at the mentioned pH, with the exchange rate having spectral density at the Larmor frequency of [1-13C]acetate. These effects likely shortened the T2 values of acetate in the pH range similar to the water pKa. The higher absolute T2 values in the basic compared to the acidic regime may be explained by the deprotonated state having one less proton to mediate relaxation via dipole–dipole-interactions. However, acetate ions might still act as weak bases, consequently exhibiting proton exchange with water up to pH 10. Beyond this pH, the acetate ions cannot deprotonate water molecules and T2 reaches a plateau. At 7 T, there is a weaker sensitivity to pH changes at neutral to slightly basic pH (pH 7–9) compared to 14.1 T, which might be explained by proton exchange with water of the acetate carboxyl group having more spectral density at this Larmor frequency. However, T2 values at 7 T are generally higher compared to 14.1 T, most likely caused by decreased chemical shift anisotropy effects at lower field. Temperature appears to only have a minor effect on T2. This, together with T2 being similar to T1 [35], indicates that the correlation time of acetate is relatively short due to relatively fast molecular tumbling. This tumbling rate further increases towards higher temperatures, as indicated by the slight increase in T2 values for increasing temperatures. Salt ions also appear to only slightly shorten T2, because an increased concentration of the diamagnetic Na+-ions induced additional dipolar relaxation mechanisms [43,44]. In contrast, diluting the [1−13C]acetate solution to a concentration lower than 250 mM appears to alter T2 similarly to variations induced by pH, because here the mean distance between hydrated acetate ions in solution becomes too large to still allow hydrogen bond-mediated interactions that potentially enhance T2 relaxation [45].
Low T2 values of [1-13C]pyruvate at strongly basic pH values are most likely explained by base-mediated keto-enol tautomerism [46], where rapid conformational exchanges and subsequent reactions to para-pyruvate enhance relaxation. At neutral pH values, proton exchange at the carboxyl group might be enhanced by rapid hydroxy–hydronium exchange reactions of water, similar to the observations for [1-13C]acetate. This assumption is supported by the observation of decreased T2 values in the same pH range with added buffer, where rapid proton exchange with buffer molecules might occur, thereby potentially inducing additional relaxation via proton exchange between buffer molecules and [1-13C]pyruvate molecules [47]. At strongly acidic pH values, close to pyruvate’s pKa, fast proton exchange and hydration of the molecule to pyruvate-hydrate further shorten T2 [48]. The difference in magnitude between the basic global maximum and the local maximum in the weakly acidic regime can be explained by the increased proton concentration at acidic pH, which enhances dipolar relaxation pathways. Regarding the local minimum of the T2 relaxation time constant at pH 6, proton exchange with water might lead to the observed reduction in T2. However, this does not fully explain the minimum being at a more acidic pH than the neutral point of water. Further theory models and simulations beyond the scope of this work might be helpful to explain this observation. Regarding [1-13C]pyruvate concentration and salt ion concentration, the observations for [1-13C]pyruvate are similar to [1-13C]acetate and can be explained similarly. As for the temperature dependence of T2, [1-13C]pyruvate shows an exponential decrease with higher temperature, in contrast to [1-13C]acetate. Normally, the temperature-dependent molecular tumbling and the related correlation time would lead to an increase in T2. However, the decrease might rather be explained by the hydration process of [1-13C]pyruvate in the pH regime chosen for temperature dependence measurements of T2. Here, an increased temperature potentially increases the hydration rate of pyruvate [49], and the rapid exchange of water molecules between the pyruvate and the bulk water pool might lead to a reduced T2 relaxation time, to a sufficient degree to exceed the increase in T2 due to faster tumbling.
The global T2 maximum of [1-13C]lactate at strongly acidic pH values can be explained by protonated lactic acid molecules forming dimers, rendering the carboxyl proton inaccessible for exchange reactions [50]. At neutral pH, hydrogen bonding of the deprotonated carboxyl group of [1-13C]lactate to the intramolecular hydroxyl group and surrounding water molecules might be most efficient [51], explaining the global minimum of T2. Towards more alkaline pH values, this effect seems to decrease, together with reduced proton concentration, leading to an increase in T2. At even stronger basic pH regimes, the formation of lactate–metal complexes with added Na+-ions and deprotonation of the hydroxy group (pKa = 15.8) start to decrease T2 [52,53].
For [1-13C]alanine, pH milieus close to the pKa of an amine or carboxyl group of this molecule allow fast proton exchange, which appears to be an effective T2 relaxation pathway. Furthermore, the overall decrease in T2 from basic to acidic pH might be explained by susceptibility to the surrounding hydronium ion concentration. In addition, the existence of the amphoteric ion across a wide range of pH values causes the charge distribution in the molecule to be potentially perturbed by dipolar interactions with the charged hydronium ions, thereby promoting T2 relaxation.
For 13C-urea, inability to exchange protons with its environment result in T2 values being almost inert to variations in pH. The low absolute value of T2, compared to other investigated 13C-labelled compounds, can be explained by the strong quadrupolar relaxation induced by 14N nuclei.
For the pH range where [1,4-13C2]fumarate is dissolvable in water, shortened T2 values are seen at pH values near the pKa of its carboxyl groups, where fast proton exchange at both carboxyl groups occurs, as well as potential influence of proton exchange with water around pH 7. For alkaline pH values, T2 reaches its maximum as the molecule exhibits as symmetric double deprotonation with limited ability for the formation of hydrogen bonds due to the high concentration of surrounding hydroxyl ions.
Together, the findings in this work are consistent with fast proton exchange being an effective T2 relaxation pathway, because measured T2 values decreased strongly in these regimes for proton-exchanging molecules. In this context, buffers contribute to proton exchange processes [47] because the addition of TRIS-buffer or measurements in whole blood, which contains phosphate- and bicarbonate-buffers, were shown to exhibit decreased T2 compared to unbuffered aqueous solutions. Notably, for all of the proton-exchanging molecules investigated here, their T2 values were below 50% of their pH-dependent maxima in the vicinity of the pKa of water, which has its neutral point at pH 6.81–7.15 [36], for 16–37 °C. Instead, global and local T2 maxima for all titration curves, excluding 13C-urea, were located at moderate to strongly acidic or basic pH. This suggests that water might also act as a proton exchange enhancing moiety, or that it has an increased ability to form hydrogen bonds with the investigated biomolecules [48,54,55] in pH regimes close to its neutral point, which enhances relaxation.
Apart from this strong pH dependence of T2 relaxation time constants, temperature, concentration and salt ion concentration dependence were investigated to determine their influence on T2 under conditions close to an in vivo setting. For NaCl concentrations in vivo, ranging at most from 120 mM to 180 mM and normally at 150 mM, a rather low variation of T2 was observed for [1-13C]pyruvate and [1-13C]acetate. Temperature variations between 35 °C and 39 °C also appeared to have a limited effect on the T2 of [1-13C]pyruvate and [1-13C]acetate. However, concentration dependence of T2 had a strong effect on in vivo T2 measurements, where local accumulation and dilution of the tracer, governed by perfusion, might dominate observed variations in T2. Therefore, in addition to pH, concentration variations might be of crucial influence when mapping T2 in vivo [15].
T2 relaxation time constants of 13C-labelled biomolecules have already been measured at various field strengths from 3 T to 9.4 T [16,25], within different solvents in vitro [15], and in vivo in several organs [15,16,18,19,25,28]. Previously reported T2 values of 13C-urea [15], [1-13C]pyruvate [25] and [1-13C]acetate [26] show reasonable agreement with the results from this study, when taking field strength differences and uncertainties in pH and temperature into account. However, in the literature, T2 measurements in vivo show considerably shortened relaxation times, typically not exceeding a few seconds for most compounds [19,25,27], except for [13C, 15N2]urea (T2 in vivo up to 11 s [15]). Additionally, multi-compartment relaxation behavior is observed, requiring multi-exponential fitting [15,17,19,20].
While reduced T2 in vivo compared to in vitro results might be attributed to protein content, oxygenation of hemoglobin [16] and metabolic conversion [18], the presence of multiple T2 compartments within tumor tissue [20] might also be related to sub-resolution heterogeneity in pH. Interestingly, comparison of measurements between healthy and tumor tissue showed prolonged relaxation times in the latter for [1-13C]pyruvate, [1-13C]lactate and [1-13C]alanine [18,28], while shorter T2 values were observed in diseased kidneys compared to healthy ones for [13C,15N2]urea [17]. For 13C-urea, this was attributed to alterations in tissue oxygenation. For tumor tissue, changes in pH might also contribute to these observed differences. For acidic cancer types, this should be further considered when using spin echo-based sequences, such as bSSFP or RARE, for the imaging of hyperpolarized [1-13C]pyruvate, [1-13C]lactate and [1-13C]alanine, because pH-based prolongation or shortening of the transverse magnetization signal decay might introduce bias to the quantification of metabolic conversion. Simultaneous mapping of pH [6] using hyperpolarized 13C-bicarbonate as a metabolic product of [1-13C]pyruvate or pH mapping by an additional injection of hyperpolarized [1,5-13C2]zymonic acid [12] or iopamidol together with chemical exchange saturation transfer (CEST) MRI [56] might be a helpful tool for the estimation of such influences.
Despite these potentially strong effects of pH on existing hyperpolarized 13C-MRI imaging quantification approaches, direct application of T2 mapping of the investigated compound for pH mapping in vivo appears challenging because of the strong influence of concentration on T2 relaxation.
In this work, slight deviations between T2 values being measured by a non-localized CPMG train compared to values derived from T2 mapping could be observed. Here, potentially larger B1 inhomogeneities and worse shimming for the 3-phantom-geometry might explain these observations. In blood, additional relaxation mechanisms, e.g., caused by paramagnetic deoxyhemoglobin, might have a stronger effect on T2 than pH. In addition, for injected 13C-labelled compounds, large amounts might flow into and out of the imaged volume and contribute to the measured signal, such that refocusing of the magnetization after a certain echo time, and therefore reliable measurement, might be difficult [18]. Nevertheless, for aqueous solutions of known composition, such as quality control in human hyperpolarized 13C imaging studies [3], pH control might be realized directly inside the magnet bore via NMR-based T2 measurements, thereby potentially speeding up the preparation time.
To further investigate the role of water for proton exchange-mediated relaxation processes, titration curves in different solvents or in solvents with varying water content are required. In order to quantify the potential influence of the pH dependence of T2 for measurements of hyperpolarized 13C-labelled metabolites in vivo, tissue pH-targeting therapies using acetazolamide or bicarbonate can be used together with hyperpolarized 13C imaging to examine changes in metabolite quantification due to pH alterations.

4. Methods

4.1. Chemical Compounds

[1-13C]Na-acetate, [1-13C]alanine and [1,4-13C2]fumaric acid were obtained from Cambridge Isotope Laboratories Inc. (Tewksbury, Massachusetts, USA). [1-13C]pyruvic acid, [1-13C]Na-lactate solution (45–55% w/w) and 13C-urea were obtained from Sigma-Aldrich (St. Louis, Missouri, USA) and used without further purification.

4.2. Sample Preparation

Compounds were dissolved in double distilled (dd) H2O (Millipore Milli-Q, Merck, Darmstadt, Germany) for experiments of the non-hyperpolarized state at 1 T and 7 T, unless otherwise stated, and in 10% D2O and 90% dd H2O for measurements at 14.1 T. For solvents used in measurements with hyperpolarized compounds, refer to Section 4.4., “Hyperpolarization”. For each titration curve, stock solutions of 10 mL were prepared, titrated, and measured, and samples put back into the stock after each measurement. If applicable, solutions were buffered with tris(hydroxymethyl)aminomethane (TRIS) (Sigma Aldrich, St. Louis, MI, USA). pH titrations were performed with 10 M KOH solution, different concentrations of NaOH solutions, ranging from 33 mM to 10 M, and different concentrations of HCl solutions, ranging from 33 mM to 12 M to minimize added acid or base volume and to keep changes in 13C-compound concentration less than 5%. Titration protocols for measurements at 14.1 T can be found elsewhere [35], and titration protocols for measurements at 7 T are listed in the Supplementary Materials (Figure S4). Titrations with salt were performed by adding weighted amounts of 99.5% NaCl powder (Sigma Aldrich, St. Louis, MI, USA). Measurements in human whole blood were performed on blood samples drawn from C.H. and M.G., which were collected in tubes containing ethylenediaminetetraacetic acid (EDTA) as an anticoagulant.

4.3. pH and Temperature Measurement

The pH of NMR samples was measured after spectroscopy measurements using a pH-Combination Electrode N 6000 A and a ProLab 4000 multiparameter benchtop meter (SI analytics, Mainz, Germany). For measurements at 1 T and 14.1 T, the temperature of 600 µL samples was adjusted and maintained automatically with an accuracy of 0.1 °C using the built-in temperature controller of the spectrometer. For measurements at 7 T, the temperature of 2 mL samples was manually adjusted and maintained with an accuracy of 0.5 °C by blowing warm air through the bore using a Pet Dryer Model B-8 (XPower, San Gabriel, California, USA), while temperature was monitored using an MR-compatible temperature monitoring system Model 1030 (SA Instruments Inc., Stony Brook, New York, NY, USA).

4.4. Hyperpolarization

[1-13C]pyruvate was mixed with 16 mM Ox063 trityl radical (GE Healthcare, Chicago, IL, USA) and 1 mM DOTAREM (Guerbet, Villepinte, France). Amounts of 23.3 ± 3.0 mg of this mixture were polarized for at least 40 min at 1.2 K and 3.35 T using a HyperSense® DNP Polarizer (Oxford Instruments, Abingdon, UK) by microwave irradiation at 94.172 GHz and 100 mW power. Dissolution was performed using 3.28 ± 0.60 mL dd H2O containing either 80 mM TRIS (Sigma Aldrich, St. Louis, MI, USA), 80 mM NaOH, 0.1 g/L EDTA or 150 mM Universal buffer (0.1 M disodium phosphate, 0.5 M citric acid), 80 mM NaOH, 0.1 g/L EDTA. Solvents were preheated to 180 °C, resulting in initial solution pH 6.8–7.8 and pH 6.0–7.8, respectively, after dissolution. Further pH data points of titration curves were obtained by rapid titration with NaOH and HCl directly after dissolution.

4.5. C NMR Spectroscopy

4.5.1. Measurements at 1 T

For measurements of hyperpolarized samples, a 43 MHz Spinsolve carbon benchtop spectrometer (Magritek, Aachen, Germany; Wellington, New Zealand) was pre-shimmed using a tube containing 10% D2O and 90% dd H2O. Trains of 4096 spin echoes were acquired using a Carr-Purcell-Meiboom-Gill (CPMG) sequence [13,57] with a short 10 ms echo spacing (to minimize influence of diffusion effects; see Appendix A), receiver bandwidth 200 kHz, 32 spectral points, excitation flip angle 90°, and refocusing flip angle 180°.

4.5.2. Measurements at 7 T

All acquisitions were performed on a 7 T small animal preclinical scanner (Agilent Discovery MR901 magnet and gradient system, Bruker AVANCE III HD electronics) and a dual-tuned 1H/13C volume resonator (inner diameter 31 mm, RAPID Biomedical). Samples were localized and centered using a T1-weighted 1H spoiled gradient recalled echo (FLASH) imaging sequence and shimmed with 1H signal. The reference frequency for each 13C sample was determined by manually adjusting while observing the spectrum with a non-spatially selective pulse-and-acquire free induction decay (FID) spectroscopy sequence. The reference power for 13C was calibrated using similar 13C-FID acquisitions after non-spatially selective excitations with a 1 ms block pulse of varying radiofrequency (RF) power and fitting the complex signal vs. excitation power curves for the 180° phase inversion point, using an in-house-written script in MATLAB (The Mathworks Inc., Natick, MA, USA). After tube temperature was stable, trains of 8192 echoes were acquired using a CPMG sequence with 10 ms echo spacing, receiver bandwidth 5 kHz, 32 spectral points, excitation flip angle 90°, refocusing flip angle 180°, repetition time 300 s, and one average for concentrations of 250 mM or more, or 25 averages for 50 mM-concentrated tubes. For 13C imaging, three tubes of 250 mM [1-13C]acetate containing solution were prepared and pH was adjusted to three different values in the vicinity of physiological pH using NaOH and HCl. For T2 mapping, tubes were grouped, and localization and pre-adjustments were performed as described above. Multiple echo images for T2 maps were acquired on a single axial slice using a single-shot rapid acquisition relaxation enhancement (RARE) sequence with echo spacing 10 ms, 16,384 spin echoes per excitation to repeatedly measure the 16 × 16 acquisition matrix at 1024 effective echo times spaced 160 ms apart, repetition time 300 s, acquisition matrix 16 × 16, field-of-view 32 × 32 mm2, slice thickness 16 mm, nominal RARE-factor 16, 144 averages, and receiver bandwidth 3.2 kHz.

4.5.3. Measurements at 14.1 T

All acquisitions were performed on a Bruker Avance III 600 MHz NMR spectrometer (Bruker, Billerica, Massachusetts, USA). After temperature equilibration, for each T2 measurement, ten acquisitions with a varying number of 1–5000 spin echoes were performed using a CPMG sequence, and only the last echo of each echo train was recorded. Sequences used echo spacing 10 ms, receiver bandwidth 3 kHz, 65,536 spectral points, excitation flip angle 90°, and refocusing flip angle 180°.

4.6. Data Processing and Analysis

Data from acquisitions at 1 T and 14.1 T were analyzed using MNova (Mestrelab, Santiago de Compostela, Spain). Data from acquisitions at 7 T were analyzed using in-house-written MATLAB (The Mathworks Inc., Natick, MA, USA) scripts. For T2 calculation, peaks from spectra of single echo acquisitions at 1 T and 14.1 T were integrated, whereas for data from acquisitions at 7 T, only peak maxima were taken due to low spectral resolution. For the resulting signal decay curves, least-squares fitting with a mono-exponential decay curve including a constant offset was performed. For RARE imaging, echo train decay curves were least-squares fitted voxel-wise analogously to non-localized measurements. For the generation of pH maps, a linear relationship between T2 and pH was assumed, and the conversion formula was fitted using the relevant section of the pH titration curves. All reported T2 values come with a statistical uncertainty of 0.1 s, as was derived from iterative acquisition on the same phantom which is described in detail in the Supplementary Materials (Figure S5).

5. Conclusions

In this work, the pH dependence of the apparent transverse relaxation time constant T2 of small hyperpolarized 13C-labelled biomolecules was investigated. Titration series revealed strong changes in T2 with varying pH, typically resulting in minima for pH regimes close to the pKa of the proton exchanging compounds. Added buffers and water as proton exchange catalysts, or the latter forming hydrogen bonds, also considerably shortened T2 at their respective pKa values. Variations in field strength, temperature, or ion concentration only had a limited effect on T2. The observed sensitivity of T2 to pH, especially for [1-13C]acetate and [1-13C]pyruvate, can be exploited to generate pH maps from T2 mapping via RARE acquisitions in aqueous solutions in vitro and shows that pH variations, as might be the case in vivo, can introduce a bias to signal quantification in T2-sensitive imaging acquisitions.

Supplementary Materials

The following are available online at https://www.mdpi.com/article/10.3390/ph14040327/s1, Figure S1: Concentration dependence of T2 of [1-13C]pyruvate and [1-13C]acetate; Figure S2: Magnetic field strength dependence of T2 for [1-13C]pyruvate; Figure S3: Voxel-wise fitting of echo signal decay curves for T2-mapping of [1-13C]acetate using RARE; Figure S4: Titration protocols; Figure S5: Error Estimation for T2 and pH measurements.

Author Contributions

Conceptualization, F.S., C.H. and M.G.; methodology, G.J.T. and M.G.; formal analysis, M.G., C.H. and F.H.A.v.H.; investigation, M.G., C.H. and F.H.A.v.H.; writing—original draft preparation, M.G.; writing—review and editing, F.S., M.G., C.H., F.H.A.v.H. and G.J.T.; supervision, F.S. All authors have read and agreed to the published version of the manuscript.

Funding

This research was funded by the Deutsche Forschungsgemeinschaft (DFG, German Research Foundation, Sonderforschungsbereich (SFB) 824, grant number 391523415), the BMBF (FKZ 13EZ1114), the Young Academy of the Bavarian Academy of Sciences and Humanities and the European Union’s Horizon 2020 research and innovation program under grant agreement No 820374.

Institutional Review Board Statement

Not applicable.

Informed Consent Statement

Not applicable.

Data Availability Statement

The data presented in this study are available on request from the corresponding author.

Acknowledgments

We acknowledge help from Raimund Marx from the Chemistry Department of the Technical University of Munich with high-field NMR experiments and the Bavarian NMR Center (BNMRZ) for measurement time.

Conflicts of Interest

The authors declare no conflict of interest. The funders had no role in the design of the study; in the collection, analyses, or interpretation of data; in the writing of the manuscript, or in the decision to publish the results.

Appendix A

To achieve reasonably short measurement times, CPMG measurements at 1 T and 7 T were acquired every spin echo of an echo train resulting from a train of refocusing pulses. In this sequence design, a careful trade-off between spectral resolution and diffusion effects is necessary. A longer echo spacing (ES) allows for longer data acquisition during each echo, which improves spectral resolution, which is needed to separate the pyruvate-hydrate and pyruvate peaks. On the other hand, a minimal echo spacing is also necessary for unbiased T2 measurement, due to increased diffusion-weighting for longer echo spacings [13]. For this purpose, T2 relaxation time constants of H2O were measured with CPMG sequences of varying echo spacing between 2.5 ms and 1000 ms (Figure A1).
Figure A1. Proton T2 relaxation time constant of dd H2O measured as a function of inverse echo spacing. The reduction in T2 due to increased diffusion for longer echo times is less than 10% up to 10 ms echo spacing (1/ES = 100 1/s); therefore, this value was used in CPMG acquisitions for T2 measurements within this study.
Pharmaceuticals 14 00327 g0a1
While the apparent value of T2 was strongly reduced for echo spacings exceeding 10 ms (ES < 100 1/s), T2 reached a plateau at approximately 2 s for echo spacings of less than 10 ms, which is in agreement with water apparent transverse relaxation time constants reported previously [13,44,58]. The diffusion-related uncertainty in T2 is less than 10% for an echo spacing of 10 ms, while providing reasonable spectral resolution for separation of [1-13C]pyruvate and [1-13C]pyruvate-hydrate peaks; therefore, this echo spacing was chosen for the reported T2 measurements.

Appendix B

In addition to buffers and paramagnetic ions for which the effects on T2 relaxation time constants were investigated separately, whole blood also consists of red blood cells, which contain hemoglobin with paramagnetic ions and a variety of proteins. To evaluate the feasibility of pH measurements in vivo using T2 mapping of 13C-labelled biomolecules, the T2 relaxation time constant of 600 mM thermally polarized [1-13C]pyruvate at 7 T and 25 mM hyperpolarized [1-13C]pyruvate at 1 T were measured in human whole blood (Figure A2), which was titrated to different pH values using HCl and NaOH.
Figure A2. Measured T2 relaxation time constants of 600 mM thermally or 25 mM hyperpolarized [1-13C]pyruvate at 7 T and 1 T, respectively. Despite no clear dependency on pH being detectable for both measurement conditions, there is a moderate to strong correlation between T2 and pH in whole blood with the relaxation time constant being shortened at higher pH values.
Pharmaceuticals 14 00327 g0a2
While there was no clear dependence between the measured relaxation time constants and the blood pH, measurements with 25 mM hyperpolarized [1-13C]pyruvate containing 26.6 µM OX063 radical showed a trend towards a correlation between blood pH (r = −0.62, p > 0.05) and the T2 relaxation time constant. Experiments with 600 mM thermally polarized [1-13C]pyruvate (r = −0.67, p < 0.05) indicated a moderate correlation, with T2 potentially being increased at acidic pH. These findings do not match the qualitative and quantitative findings in Figure 2b, indicating that additional factors such as blood-specific buffers, hemoglobin, and protein content in whole blood may strongly affect the T2 of pyruvate. These observations render reliable pH measurements in blood using T2 relaxation time constant measurements rather challenging. However, they also emphasize the potential impact of pH alterations in vivo on the quantification of hyperpolarized 13C-labeled biomolecules when applying T2-sensitive image acquisition protocols.

References

  1. Ardenkjaer-Larsen, J.H.; Fridlund, B.; Gram, A.; Hansson, L.; Lerche, M.H.; Servin, R.; Thaning, M.; Golman, K. Increase in signal-to-noise ratio of > 10,000 times in liquid-state NMR. Proc. Natl. Acad. Sci. USA 2003, 100, 10158–10163. [Google Scholar] [CrossRef] [Green Version]
  2. Golman, K.; Zandt, R.I.T.; Lerche, M.; Pehrson, R.; Ardenkjaer-Larsen, J.H. Metabolic Imaging by Hyperpolarized 13C Magnetic Resonance Imaging for In vivo Tumor Diagnosis. Cancer Res. 2006, 66, 10855–10860. [Google Scholar] [CrossRef] [Green Version]
  3. Nelson, S.J.; Kurhanewicz, J.; Vigneron, D.B.; Larson, P.E.Z.; Harzstark, A.L.; Ferrone, M.; Van Criekinge, M.; Chang, J.W.; Bok, R.; Park, I.; et al. Metabolic Imaging of Patients with Prostate Cancer Using Hyperpolarized [1-13C] Pyruvate. Sci. Transl. Med. 2013, 5, 198ra108. [Google Scholar] [CrossRef] [PubMed] [Green Version]
  4. Day, E.S.; Kettunen, I.M.; Gallagher, F.; Hu, D.-E.; Lerche, M.; Wolber, J.; Golman, K.; Ardenkjaer-Larsen, J.H.; Brindle, K.M. Detecting tumor response to treatment using hyperpolarized 13C magnetic resonance imaging and spectroscopy. Nat. Med. 2007, 13, 1382–1387. [Google Scholar] [CrossRef] [PubMed]
  5. MacKenzie, J.D.; Yen, Y.-F.; Mayer, D.; Tropp, J.S.; Hurd, R.E.; Spielman, D.M. Detection of Inflammatory Arthritis by Using Hyperpolarized13C-Pyruvate with MR Imaging and Spectroscopy. Radiology 2011, 259, 414–420. [Google Scholar] [CrossRef] [Green Version]
  6. Gallagher, F.A.; Kettunen, M.I.; Day, S.E.; Hu, D.-E.; Ardenkjaer-Larsen, J.H.; Zandt, R.I.T.; Jensen, P.R.; Karlsson, M.; Golman, K.; Lerche, M.H.; et al. Magnetic resonance imaging of pH in vivo using hyperpolarized 13C-labelled bicarbonate. Nat. Cell Biol. 2008, 453, 940–943. [Google Scholar] [CrossRef] [PubMed]
  7. Lau, A.Z.; Chen, A.P.; Ghugre, N.R.; Ramanan, V.; Lam, W.W.; Connelly, K.A.; Wright, G.A.; Cunningham, C.H. Rapid multislice imaging of hyperpolarized 13C pyruvate and bicarbonate in the heart. Magn. Reson. Med. 2010, 64, 1323–1331. [Google Scholar] [CrossRef] [PubMed]
  8. Cunningham, C.H.; Chen, A.P.; Albers, M.J.; Kurhanewicz, J.; Hurd, R.E.; Yen, Y.-F.; Pauly, J.M.; Nelson, S.J.; Vigneron, D.B. Double spin-echo sequence for rapid spectroscopic imaging of hyperpolarized 13C. J. Magn. Reson. 2007, 187, 357–362. [Google Scholar] [CrossRef] [PubMed]
  9. Leupold, J.; Månsson, S.; Petersson, J.S.; Hennig, J.; Wieben, O. Fast multiecho balanced SSFP metabolite mapping of 1H and hyperpolarized 13C compounds. MAGMA 2009, 22, 251–256. [Google Scholar] [CrossRef] [PubMed]
  10. Von Morze, C.; Larson, P.E.; Hu, S.; Yoshihara, H.A.; Bok, R.A.; Goga, A.; Ardenkjaer-Larsen, J.H.; Vigneron, D.B. Investigating tumor perfusion and metabolism using multiple hyperpolarized 13C compounds: HP001, pyruvate and urea. Magn. Reson. Imaging 2012, 30, 305–311. [Google Scholar] [CrossRef] [Green Version]
  11. Mishra, A.; Pariani, G.; Oerther, T.; Schwaiger, M.; Westmeyer, G.G. Hyperpolarized Multi-Metal13C-Sensors for Magnetic Resonance Imaging. Anal. Chem. 2016, 88, 10790–10794. [Google Scholar] [CrossRef]
  12. Düwel, S.; Hundshammer, C.; Gersch, M.; Feuerecker, B.; Steiger, K.; Buck, A.; Walch, A.; Haase, A.; Glaser, S.J.; Schwaiger, M.; et al. Imaging of pH in vivo using hyperpolarized 13C-labelled zymonic acid. Nat. Commun. 2017, 8, 15126. [Google Scholar] [CrossRef] [Green Version]
  13. Carr, H.Y.; Purcell, E.M. Effects of Diffusion on Free Precession in Nuclear Magnetic Resonance Experiments. Phys. Rev. 1954, 94, 630–638. [Google Scholar] [CrossRef]
  14. Simbrunner, J.; Stollberger, R. Analysis of Carr–Purcell Sequences with Nonideal Pulses. J. Magn. Reson. Ser. B 1995, 109, 301–309. [Google Scholar] [CrossRef]
  15. Reed, G.D.; Von Morze, C.; Bok, R.; Koelsch, B.L.; Van Criekinge, M.; Smith, K.J.; Larson, P.E.Z.; Kurhanewicz, J.; Vigneron, D.B.; Shang, H. High resolution (13)C MRI with hyperpolarized urea: In vivo T(2) mapping and (15)N labeling effects. IEEE Trans. Med. Imaging 2013, 33, 362–371. [Google Scholar] [CrossRef] [PubMed] [Green Version]
  16. Laustsen, C.; Nørlinger, T.S.; Hansen, D.C.; Qi, H.; Nielsen, P.M.; Bertelsen, L.B.; Ardenkjaer-Larsen, J.H.; Jørgensen, H.S. Hyperpolarized 13 C urea relaxation mechanism reveals renal changes in diabetic nephropathy. Magn. Reson. Med. 2015, 75, 515–518. [Google Scholar] [CrossRef] [Green Version]
  17. Reed, G.D.; von Morze, C.; Verkman, A.S.; Koelsch, B.L.; Chaumeil, M.M.; Lustig, M.; Ronen, S.M.; Bok, R.A.; Sands, J.M.; Larson, P.E.Z.; et al. Imaging Renal Urea Handling in Rats at Millimeter Resolution Using Hyperpolarized Magnetic Resonance Relaxometry. Tomography 2016, 2, 125–137. [Google Scholar] [CrossRef] [PubMed]
  18. Yen, Y.-F.; Le Roux, P.; Mayer, D.; King, R.; Spielman, D.M.; Tropp, J.; Pauly, K.B.; Pfefferbaum, A.; Vasanawala, S.S.; E Hurd, R. T2relaxation times of13C metabolites in a rat hepatocellular carcinoma model measuredin vivousing13C-MRS of hyperpolarized [1-13C]pyruvate. NMR Biomed. 2010, 23, 414–423. [Google Scholar] [CrossRef] [Green Version]
  19. Yen, Y.-F.; Le Roux, P.; Bok, R.; Tropp, J.; Chen, A.; Zhang, V.; Zierhut, M.; Albers, M.; Nelson, S. Apparent T2 of 13C-labeled Metabolites In Vivo. In Proceedings of the 16th Scientific Meeting & Exhibition ISMRM, Toronto, ON, Canada, 3–9 May 2008. [Google Scholar]
  20. Kettunen, M.I.; Hu, D.-E.; Witney, T.H.; McLaughlin, R.; Gallagher, F.A.; Bohndiek, S.E.; Day, S.E.; Brindle, K.M. Magnetization transfer measurements of exchange between hyperpolarized [1-13C]pyruvate and [1-13C]lactate in a murine lymphoma. Magn. Reson. Med. 2010, 63, 872–880. [Google Scholar] [CrossRef]
  21. Chen, A.P.; Cunningham, C.H. Single voxel localization for dynamic hyperpolarized 13C MR spectroscopy. J. Magn. Reson. 2015, 258, 81–85. [Google Scholar] [CrossRef]
  22. Golman, K.; Axelsson, O.; Johannesson, H.; Mansson, S.; Olofsson, C.; Petersson, J. Parahydrogen-induced polarization in imaging: Subsecond13C angiography. Magn. Reason. Med. 2001, 46, 1–5. [Google Scholar] [CrossRef]
  23. Mariager, C.Ø.; Nielsen, P.M.; Qi, H.; Ringgaard, S.; Laustsen, C. Hyperpolarized 13 C,15 N2 -urea T2 relaxation changes in acute kidney injury. Magn. Reson. Med. 2018, 80, 696–702. [Google Scholar] [CrossRef]
  24. Larson, P.E.Z.; Kerr, A.B.; Chen, A.P.; Lustig, M.S.; Zierhut, M.L.; Hu, S.; Cunningham, C.H.; Pauly, J.M.; Kurhanewicz, J.; Vigneron, D.B. Multiband excitation pulses for hyperpolarized 13C dynamic chemical-shift imaging. J. Magn. Reson. 2008, 194, 121–127. [Google Scholar] [CrossRef] [Green Version]
  25. Milshteyn, E.; Von Morze, C.; Reed, G.D.; Shang, H.; Shin, P.J.; Zhu, Z.; Chen, H.-Y.; Bok, R.; Goga, A.; Kurhanewicz, J.; et al. Development of high resolution 3D hyperpolarized carbon-13 MR molecular imaging techniques. Magn. Reson. Imaging 2017, 38, 152–162. [Google Scholar] [CrossRef] [PubMed] [Green Version]
  26. Varma, G.; Wang, X.; Vinogradov, E.; Bhatt, R.S.; Sukhatme, V.P.; Seth, P.; Lenkinski, R.E.; Alsop, D.C.; Grant, A.K. Selective spectroscopic imaging of hyperpolarized pyruvate and its metabolites using a single-echo variable phase advance method in balanced SSFP. Magn. Reson. Med. 2016, 76, 1102–1115. [Google Scholar] [CrossRef] [Green Version]
  27. Kettunen, M.I.; Kennedy, B.W.C.; Hu, D.; Brindle, K.M. Spin echo measurements of the extravasation and tumor cell uptake of hyperpolarized [1-13C]lactate and [1-13C]pyruvate. Magn. Reson. Med. 2012, 70, 1200–1209. [Google Scholar] [CrossRef] [PubMed]
  28. Joe, E.; Lee, H.; Lee, J.; Yang, S.; Choi, Y.-S.; Wang, E.; Song, H.-T.; Kim, D.-H. An indirect method forin vivo T2mapping of [1-13C] pyruvate using hyperpolarized13C CSI. NMR Biomed. 2017, 30, e3690. [Google Scholar] [CrossRef]
  29. Souhrada, J.; Bullard, R.W. Tissue buffering capacity: Its role in the prevention of isoproterenol induced necrosis. Life Sci. 1971, 10, 559–564. [Google Scholar] [CrossRef]
  30. Salenius, P. A Study of the Ph and buffer capacity of blood, Plasma and red Blood Cells. Scand. J. Clin. Lab. Investig. 1957, 9, 160–167. [Google Scholar] [CrossRef]
  31. Viikari, S.J.; Harjola, P.; Maamies, T. Clinical Studies on the Buffer Capacity of the Blood. Scand. J. Clin. Lab. Investig. 1954, 6, 122–128. [Google Scholar] [CrossRef]
  32. Von Oettingen, J.; Wolfsdorf, J.; Feldman, H.A.; Rhodes, E.T. Use of Serum Bicarbonate to Substitute for Venous pH in New-Onset Diabetes. Pediatry 2015, 136, e371–e377. [Google Scholar] [CrossRef] [PubMed] [Green Version]
  33. Granja, S.; Tavares-Valente, D.; Queirós, O.; Baltazar, F. Value of pH regulators in the diagnosis, prognosis and treatment of cancer. Semin. Cancer Biol. 2017, 43, 17–34. [Google Scholar] [CrossRef] [PubMed] [Green Version]
  34. Adrogué, H.J.; Madias, N.E. Management of Life-Threatening Acid–Base Disorders. New Engl. J. Med. 1998, 338, 107–111. [Google Scholar] [CrossRef]
  35. Hundshammer, C.; Grashei, M.; Greiner, A.; Glaser, S.J.; Schilling, F. pH Dependence ofT1for13C-Labelled Small Molecules Commonly Used for Hyperpolarized Magnetic Resonance Imaging. Chem. Phys. Chem. 2019, 20, 798–802. [Google Scholar] [CrossRef]
  36. Arcis, H.; Ferguson, J.P.; Cox, J.S.; Tremaine, P.R. The Ionization Constant of Water at Elevated Temperatures and Pressures: New Data from Direct Conductivity Measurements and Revised Formulations from T = 273 K to 674 K and p = 0.1 MPa to 31 MPa. J. Phys. Chem. Ref. Data 2020, 49, 033103. [Google Scholar] [CrossRef]
  37. Yaprak, M.; Kemec, Z.; Cetinkaya, E.; Dayanan, R.; Celiker, O.; Sünger, O. Is a pH of 6.73 compatible with life? Internet J. Nephrol. 2015, 10. [Google Scholar] [CrossRef]
  38. Tripathy, S. Extreme metabolic alkalosis in intensive care. Indian J. Crit. Care Med. 2009, 13, 217–220. [Google Scholar] [CrossRef] [Green Version]
  39. Griffiths, J.R. Are cancer cells acidic? Br. J. Cancer 1991, 64, 425–427. [Google Scholar] [CrossRef] [Green Version]
  40. Reynolds, R.M.; Padfield, P.L.; Seckl, J.R. Disorders of sodium balance. BMJ 2006, 332, 702–705. [Google Scholar] [CrossRef] [Green Version]
  41. Wallerstein, J.; Weininger, U.; Khan, M.A.I.; Linse, S.; Akke, M. Site-Specific Protonation Kinetics of Acidic Side Chains in Proteins Determined by pH-Dependent Carboxyl 13C NMR Relaxation. J. Am. Chem. Soc. 2015, 137, 3093–3101. [Google Scholar] [CrossRef]
  42. Carver, J.; Richards, R. A general two-site solution for the chemical exchange produced dependence of T2 upon the carr-Purcell pulse separation. J. Magn. Reson. 1972, 6, 89–105. [Google Scholar] [CrossRef]
  43. Bloch, F.; Hansen, W.W.; Packard, M. The Nuclear Induction Experiment. Phys. Rev. 1946, 70, 474–485. [Google Scholar] [CrossRef]
  44. Bloembergen, N.; Purcell, E.M.; Pound, R.V. Relaxation Effects in Nuclear Magnetic Resonance Absorption. Phys. Rev. 1948, 73, 679–712. [Google Scholar] [CrossRef]
  45. Rahman, H.M.A.; Hefter, G.; Buchner, R. Hydration of Formate and Acetate Ions by Dielectric Relaxation Spectroscopy. J. Phys. Chem. B 2011, 116, 314–323. [Google Scholar] [CrossRef]
  46. Valadbeigi, Y.; Farrokhpour, H. Theoretical study on keto-enol tautomerism and isomerization in pyruvic acid. Int. J. Quantum Chem. 2013, 113, 2372–2378. [Google Scholar] [CrossRef]
  47. Liepinsh, E.; Otting, G. Proton exchange rates from amino acid side chains—implications for image contrast. Magn. Reson. Med. 1996, 35, 30–42. [Google Scholar] [CrossRef] [PubMed]
  48. Pocker, Y.; Meany, J.E.; Nist, B.J.; Zadorojny, C. Reversible hydration of pyruvic acid. I. Equilibrium studies. J. Phys. Chem. 1969, 73, 2879–2882. [Google Scholar] [CrossRef]
  49. Strehlow, H. Die Kinetik der Hydratation von a-Ketocarbonsäuren. Zeitschrift für Elektrochemie Ber. Bunsenges. Phys. Chem 1962, 66, 392–396. [Google Scholar] [CrossRef]
  50. Losada, M.; Tran, H.; Xu, Y. Lactic acid in solution: Investigations of lactic acid self-aggregation and hydrogen bonding interactions with water and methanol using vibrational absorption and vibrational circular dichroism spectroscopies. J. Chem. Phys. 2008, 128, 014508. [Google Scholar] [CrossRef]
  51. Cassanas, G.; Morssli, M.; Fabrègue, E.; Bardet, L. Vibrational spectra of lactic acid and lactates. J. Raman Spectrosc. 1991, 22, 409–413. [Google Scholar] [CrossRef]
  52. Achilli, E.; Vertova, A.; Visibile, A.; Locatelli, C.; Minguzzi, A.; Rondinini, S.; Ghigna, P. Structure and Stability of a Copper(II) Lactate Complex in Alkaline Solution: A Case Study by Energy-Dispersive X-ray Absorption Spectroscopy. Inorg. Chem. 2017, 56, 6982–6989. [Google Scholar] [CrossRef]
  53. Dudás, C.; Kutus, B.; Böszörményi, É.; Peintler, G.; Attia, A.A.; Lupan, A.; Kele, Z.; Sipos, P.; Pálinkó, I. Calcium complexing behaviour of lactate in neutral to highly alkaline medium. J. Mol. Struct. 2019, 1180, 491–498. [Google Scholar] [CrossRef]
  54. Schnitzler, E.G.; Seifert, N.A.; Ghosh, S.; Thomas, J.; Xu, Y.; Jäger, W. Hydration of the simplest α-keto acid: A rotational spectroscopic and ab initio study of the pyruvic acid–water complex. Phys. Chem. Chem. Phys. 2017, 19, 4440–4446. [Google Scholar] [CrossRef] [PubMed]
  55. Shemesh, D.; Luo, M.; Grassian, V.H.; Gerber, R.B. Absorption spectra of pyruvic acid in water: Insights from calculations for small hydrates and comparison to experiment. Phys. Chem. Chem. Phys. 2020, 22, 12658–12670. [Google Scholar] [CrossRef] [PubMed]
  56. Longo, D.; Dastrù, W.; Digilio, G.; Keupp, J.; Langereis, S.; Lanzardo, S.; Prestigio, S.; Steinbach, O.; Terreno, E.; Uggeri, F.; et al. Iopamidol as a responsive MRI-chemical exchange saturation transfer contrast agent for pH mapping of kidneys: In vivo studies in mice at 7 T. Magn. Reson. Med. 2010, 65, 202–211. [Google Scholar] [CrossRef]
  57. Meiboom, S.; Gill, D.R. Modified Spin-Echo Method for Measuring Nuclear Relaxation Times. Rev. Sci. Instrum. 1958, 29, 688–691. [Google Scholar] [CrossRef] [Green Version]
  58. Tsukiashi, A.; Min, K.S.; Kitayama, H.; Terasawa, H.; Yoshinaga, S.; Takeda, M.; Lindoy, L.F.; Hayami, S. Application of spin-crossover water soluble nanoparticles for use as MRI contrast agents. Sci. Rep. 2018, 8, 14911. [Google Scholar] [CrossRef]
Figure 1. Titration curves of apparent T2 relaxation time constants for several 13C-labelled, thermally polarized biomolecules in H2O at 37 °C and 14.1 T. The range of ±0.5 pH steps around the pKa values of all molecules is indicated in red background color. For [1-13C]pyruvate, the range of ±0.5 pH steps around the pKa values of TRIS buffer is indicated in blue background color. (a) [1-13C]acetate exhibits long T2 values away from the pKa = 4.76. Here, the protonated state, occurring at acidic pH values, has a slightly longer T2 than the deprotonated state, which exists at basic pH values. (b) T2 of [1-13C]pyruvate at extreme basic pH is decreased by one order of magnitude relative to slightly basic pH values around pH 9. Addition of 80 mM TRIS buffer reduces T2 values in the vicinity of the buffer pKa (pH 7–9). (c) [1-13C]lactate shows its longest T2 relaxation time constants for its protonated state below pH 3, as well as a local maximum around pH 11, while exhibiting shorter T2 values at neutral and strongly basic pH. (d) [1-13C]alanine shows a decrease in T2 from basic towards acidic pH, with additionally increased relaxation at its pKa values. (e) 13C-urea shows pH-independent, but very low, T2 values compared to the other investigated compounds. (f) [1,4-13C2]fumarate’s T2 shows a four-fold increase in the double deprotonated state (basic pH) compared to pH milieus close to the pKa values of both carboxyl groups (pH ~4).
Pharmaceuticals 14 00327 g001aPharmaceuticals 14 00327 g001b
Figure 2. pH titration curves of 250 mM thermally polarized [1-13C]acetate and 250 mM [1-13C]pyruvate at 37 °C and 7 T. (a) The pH dependence of [1-13C]acetate qualitatively resembles that observed at 14.1 T (Figure 1a), but shows higher absolute T2 relaxation times and a linear increase from pH close to its pKa to strongly basic pH values. (b) The titration curve of [1-13C]pyruvate exhibits two maxima at slightly basic and moderately acidic pH and a local minimum at pH 6, together with drastically shortened T2 values in the strongly acidic and basic regimes. The range of ±0.5 pH steps around the pKa values of the molecules is indicated in red.
Pharmaceuticals 14 00327 g002
Figure 3. Influence of temperature and salt concentration on T2 of thermally polarized [1-13C] acetate and [1-13C]pyruvate. While [1-13C]acetate shows a linear increase in T2 with temperature (a), T2 of [1-13C]pyruvate decreases exponentially when increasing solution temperature (c). Salt ion concentration leads to minor reductions in T2 for both molecules (b,d).
Pharmaceuticals 14 00327 g003
Figure 4. (a) Comparison of T2 values of [1-13C]acetate measured with a Carr-Purcell-Meiboom-Gill (CPMG) sequence separately for each tube (red) and derived from averaging T2 values within regions of interest analysis of T2 maps generated from rapid acquisition with relaxation enhancement (RARE) imaging data (black). Mean relaxation times show good agreement between acquisition modalities, despite RARE-derived T2 values for each tube being slightly shorter than the corresponding CPMG-derived values. (b) Echo trains in tubes of different pH values. Signal curves were derived from echo images and averaged across regions of interest (green, red, or magenta). They show good preservation of transversal magnetization in later echoes. (c) T2 map generated from voxel-wise mono-exponential fitting of echo trains, showing homogeneity within and high contrast between tubes. (d) pH map generated using an estimated linear relationship between T2 and pH, derived from the titration curve in Figure 2a. In this manner, the pH of the tubes can be estimated with 0.1 pH unit intra-tube voxel-by-voxel variation and with an absolute accuracy of 1.6 pH units.
Pharmaceuticals 14 00327 g004aPharmaceuticals 14 00327 g004b
Table 1. Minimum and maximum T2 values of 250 mM 13C-labelled biomolecules and pH-sensitivity of T2 in the physiological range pH 6.8–7.8 at 14.1 T.
T2,max [s] (pH)T2,min [s] (pH)T2 [s] (pH 7.4)Ratio T2,max/T2,minMean ΔT2 [s/0.1pH] (pH Range 6.8–7.8)
[1-13C]acetate27.7 (10.90)2.1 (4.52)14.713.20.44
[1-13C]alanine10.6 (12.45)0.6 (5.06)4.619.00.09
[1,4-13C2]fumarate18.9 (12.91)3.0 (5.73)13.96.30.19
[1-13C]lactate12.6 (1.03)0.7 (6.99)1.118.9−0.05 (pH 6.8–7)/
0.08 (pH 7–7.8)
[1-13C]pyruvate18.7 (8.81)0.1 (11.69)13.9208.10.95
13C-urea0.1 (7.79)0.1 (2.99)0.11.2<0.001
Note: For T2,max/min values, the corresponding pH is indicated in brackets. T2 values at pH 7.4 were calculated from the interpolation of data points in the close pH range. “Mean ΔT2” indicates the mean change in T2 in seconds per 0.1 pH step in the pH range 6.8–7.8, which is of interest for physiological conditions. All T2 values are rounded to the first digit after the decimal point.
Table 2. Influence of concentration, salt concentration, temperature, and pH within common physiological and pathological variations on T2 relaxation time constants of [1-13C]acetate at 7 T.
[1-13C]acetateT2,ref [s]T2,lower bound [s]T2,upper bound [s]Rel. Change Lower Bound [%]Rel. Change Upper Bound [%]
Concentration20.826.111.425.2−45.4
Salt concentration14.815.114.52.0−1.8
Temperature11.411.311.6−1.61.5
pH11.79.713.0−16.911.2
Note: Parameter ranges and physiological reference values which are assumed to commonly apply to in vivo experiments in healthy subjects: concentration, reference 10 mM, lower bound 5 mM, upper bound 80 mM; salt concentration, reference 150 mM, lower bound 120 mM, upper bound 180 mM [40]; temperature, reference 37 °C, lower bound 35 °C, upper bound 39 °C; pH, reference 7.40, lower bound 6.8 [37], upper bound 7.8 [38].
Table 3. Influence of concentration, salt concentration, temperature, and pH within common physiological and pathological variations on T2 relaxation time constants of [1-13C]pyruvate at 7 T.
[1-13C]pyruvate.T2,ref [s]T2,lower bound [s]T2,upper bound [s]Rel. Change Lower Bound [%]Rel. Change Upper Bound [%]
Concentration2.12.11.61.9−23.6
Salt concentration0.91.00.98.5−2.1
Temperature0.91.00.910.6−9.6
pH15.49.119.7−41.227.4
Note: Parameter ranges and physiological reference values which are assumed to commonly apply to in vivo experiments in healthy subjects: concentration, reference 10 mM, lower bound 5 mM, upper bound 80 mM; salt concentration, reference 150 mM, lower bound 120 mM, upper bound 180 mM [40]; temperature, reference 37 °C, lower bound 35 °C, upper bound 39 °C; pH, reference 7.40, lower bound 6.8 [37], upper bound 7.8 [38].
Publisher’s Note: MDPI stays neutral with regard to jurisdictional claims in published maps and institutional affiliations.

