Article

Unravelling the Interaction of Piperlongumine with the Nucleotide-Binding Domain of HSP70: A Spectroscopic and In Silico Study

by
Ana Paula Ribeiro Povinelli
1,
Gabriel Zazeri
1,
Alan M. Jones
2,* and
Marinnio Lopes Cornélio
1,*
1
Departamento de Física, Instituto de Biocincias, Letras e Cincias Exatas (IBILCE), Universidade Estadual Paulista (UNESP), Rua Cristovão Colombo 2265, São José do Rio Preto 15054-000, Brazil
2
School of Pharmacy, University of Birmingham, Edgbaston, Birmingham B15 2TT, UK
*
Authors to whom correspondence should be addressed.
Pharmaceuticals 2021, 14(12), 1298; https://doi.org/10.3390/ph14121298
Submission received: 17 November 2021 / Revised: 3 December 2021 / Accepted: 7 December 2021 / Published: 13 December 2021
(This article belongs to the Special Issue In Silico Approaches in Drug Design)

Abstract

:
Piperlongumine (PPL) is an alkaloid extracted from several pepper species that exhibits anti-inflammatory and anti-carcinogenic properties. Nevertheless, the molecular mode of action of PPL that confers such powerful pharmacological properties remains unknown. From this perspective, spectroscopic methods aided by computational modeling were employed to characterize the interaction between PPL and nucleotide-binding domain of heat shock protein 70 (NBD/HSP70), which is involved in the pathogenesis of several diseases. Steady-state fluorescence spectroscopy along with time-resolved fluorescence revealed the complex formation based on a static quenching mechanism. Van’t Hoff analyses showed that the binding of PPL toward NBD is driven by equivalent contributions of entropic and enthalpic factors. Furthermore, IDF and Scatchard methods applied to fluorescence intensities determined two cooperative binding sites with Kb of (6.3 ± 0.2) × 104 M−1. Circular dichroism determined the thermal stability of the NBD domain and showed that PPL caused minor changes in the protein secondary structure. Computational simulations elucidated the microenvironment of these interactions, showing that the binding sites are composed mainly of polar amino acids and the predominant interaction of PPL with NBD is Van der Waals in nature.

1. Introduction

Living organisms, regardless of their kingdom, are constantly subjected to stressful situations and respond to these stimuli through changes in cellular metabolism, activating their defence mechanisms [1]. The stress response includes heat shock proteins (HSPs), which is one of the primary cellular protection responses [2,3].
HSPs are part of the large family of proteins known as molecular chaperones, so called because they have the ability to interact reversibly with other proteins, helping in formation, folding and trans-membrane transport [4]. HSP70 is the 70 kDa heat shock protein, composed of a conserved N-terminal nucleotide binding domain (NBD) with ATPase activity, a substrate binding domain (SBD) and a C-terminal domain. Among the domains, NBD is a 40 kDa ATP binding domain [5] with a highly flexible chain.
The HSP70 was found to be over expressed in various cancers in response to the stressful environment of tumors, leading to tumor protection and consequently to therapeutic resistance. Recently, the set of functions of heat shock proteins (HSP) has been extended based on studies that have shown that HSP70 is also found in the extracellular environment and exhibits potent cytokine activity, with the ability to activate the nuclear factor-kappaB (NF-κB) and consequently regulate the expression of pro-inflammatory cytokines [6,7,8]. Due to the involvement of HSP70 in the pathogenesis of several diseases, this macromolecule has become a potential molecular target for the development of pharmacotherapies [9]. Much effort has been dedicated to the search for small ligands that are able to inhibit the chaperone function of HSP70, mostly through the interaction with ADP binding site [5,10]. However, to the best of our knowledge the decrease of HSP70 inflammatory activity due to the binding of small ligands has not been investigated.
Piperlongumine (PPL) is a small molecule that has been reported to have a multitude of biological activities such as anti-inflammatory, anti-carcinogenic, anti-atherosclerotic, amongst others [11,12,13,14]. PPL is an alkaloid isolated from long pepper that is widely used in Indian traditional medicine [15,16]. This molecule is characterized by the presence of electrophilic motifs [12] including an α,β-unsaturated amide acting as a Michael acceptor (inset of Figure 1) [17]. As a potential drug scaffold, PPL has no Lipinski or lead-like rule violations [18]. Biological studies have shown that the anti-inflammatory and anti-carcinogenic activities of PPL are a consequence of the inhibition of NF-κB pathway [17,19,20,21]. However, to the best of our knowledge there are no studies to date regarding the molecular interaction of PPL and NBD/HSP70.
In the present work we bring a detailed biophysical characterization of the interaction of PPL with NBD to support further drug discovery efforts. The experimental characterization is based on multi-pronged spectroscopic approaches. Fluorescence and circular dichroism spectroscopy were employed to disclose the number of binding sites, the mode of binding, the binding affinity, the thermodynamic parameters of interaction and the protein conformational changes due to these interactions. To have a complete description of the complex, molecular docking and dynamics parameterized by experimental results were employed to predict the binding sites and to disclose the molecular interactions in the microenvironments.

2. Results and Discussion

2.1. Fluorescence Spectroscopy

Figure 1 shows the fluorescence emission spectra of Trp90 NBD domain at 330 nm in the absence (a) and the presence of PPL (→y). Furthermore, Figure 1 shows PPL fluorescence emission band at 450 nm while the molecule was added to the solution (→y). The full-width half maximum (FWHM) of ±30 nm for the band of Trp90 and ±45 nm for the band of PPL showed that PPL fluorescence emission intensity did not influence NBD fluorescence emission spectra intensity, which allows for further analyses of the quenching mechanism. The interaction of NBD with PPL was monitored following the intensity of Trp90 emission spectra at 330 nm. Analysis of the spectra revealed the NBD fluorescence was quenched with the addition of PPL in the sample, demonstrating the existence of the quenching effect upon the Trp90 emission.
The quenching mechanism may be classified as dynamic (diffusive encounters) or static (complex formation) processes. It is possible to differentiate them by analysing the dependence of Stern–Volmer constant (KSV) with temperature (Equation (1)) [22]. In general terms, static quenching reflects a decrease in Ksv with the increase in temperature, while dynamic quenching may provoke an increase in Ksv with the increase in temperature. Another method to determine the quenching mechanism involves comparing the ratio of fluorescence signals (F0/F) with the ratio of the lifetime values (τ0/τ). For dynamic quenching, the relation F0/F = τ0/τ has to be observed for the system, otherwise collisions are not observed and the quenching is static [23]. The analysis of the bimolecular quenching rate constant (kq) is another method that can also be used to confirm the quenching mechanism. To have the system ruled by collisions (dynamic quenching), the bimolecular constant cannot exceed the limit of 1010 M−1·s−1 [23].
F 0 F = 1 + K S V · [ P P L ] = 1 + k q · τ 0 · [ P P L ]
The Stern–Volmer plots (Figure 2) presented a linear response to the increment of PPL concentration. At temperatures 283 K, 293 K and 303 K, the KSV constant showed a noticeable decrease by the drop in slope of the linear regression, which is strong evidence of the static quenching process [24]. The quenching mechanism obtained by steady-state fluorescence results was confirmed by time-resolved experiments as a second experimental method. In this experiment, the NBD tryptophan lifetime of excited states were measured in the absence (τ0) and presence (τ) of different concentrations of PPL (Figure S1 and Table S1). The ratio (τ0/τ) of fluorescence lifetime, plotted at the right ordinate of Figure 2, remained close to unity and did not present equivalence with F0/F, which indicated that PPL poorly affects the NBD tryptophan fluorescence lifetime and confirms that the quenching mechanism is static [22]. To further confirm this result, the values of bimolecular constants kq were calculated, all kq are in the order of magnitude of 1012 M−1·s−1 which exceeded the limit of 1010 M−1·s−1 observed for dynamic quenching. In conclusion, these results characterize the quenching mechanism as static, which means that a complex has been formed by the PPL and NBD.
Table 1 shows the data for the Stern–Volmer constants and the bimolecular constant at different temperatures.
Once it was determined that a complex formation occurred, the association constant also known as binding constant (Ka) was calculated. The variables Ka were obtained by linearizing the function of the plot of Figure 3 using the double-logarithm equation (Equation (2)) that relates the quenching fluorescence intensities to the total concentration of PPL.
l o g   ( F 0 F F ) = n · l o g   K a n · l o g   ( 1 [ P P L ] ( F 0 F F 0 ) · [ N B D ] )  
The results of Ka at different temperatures obtained for the first order model (n~1) are shown in Table 1. The binding constants found for different temperatures are in the order of magnitude of 104 M−1. As shown in Table 1, the affinity of the complex is influenced by temperature, since the results of the binding equilibrium experiments showed that Ka decreased while the temperature increased.

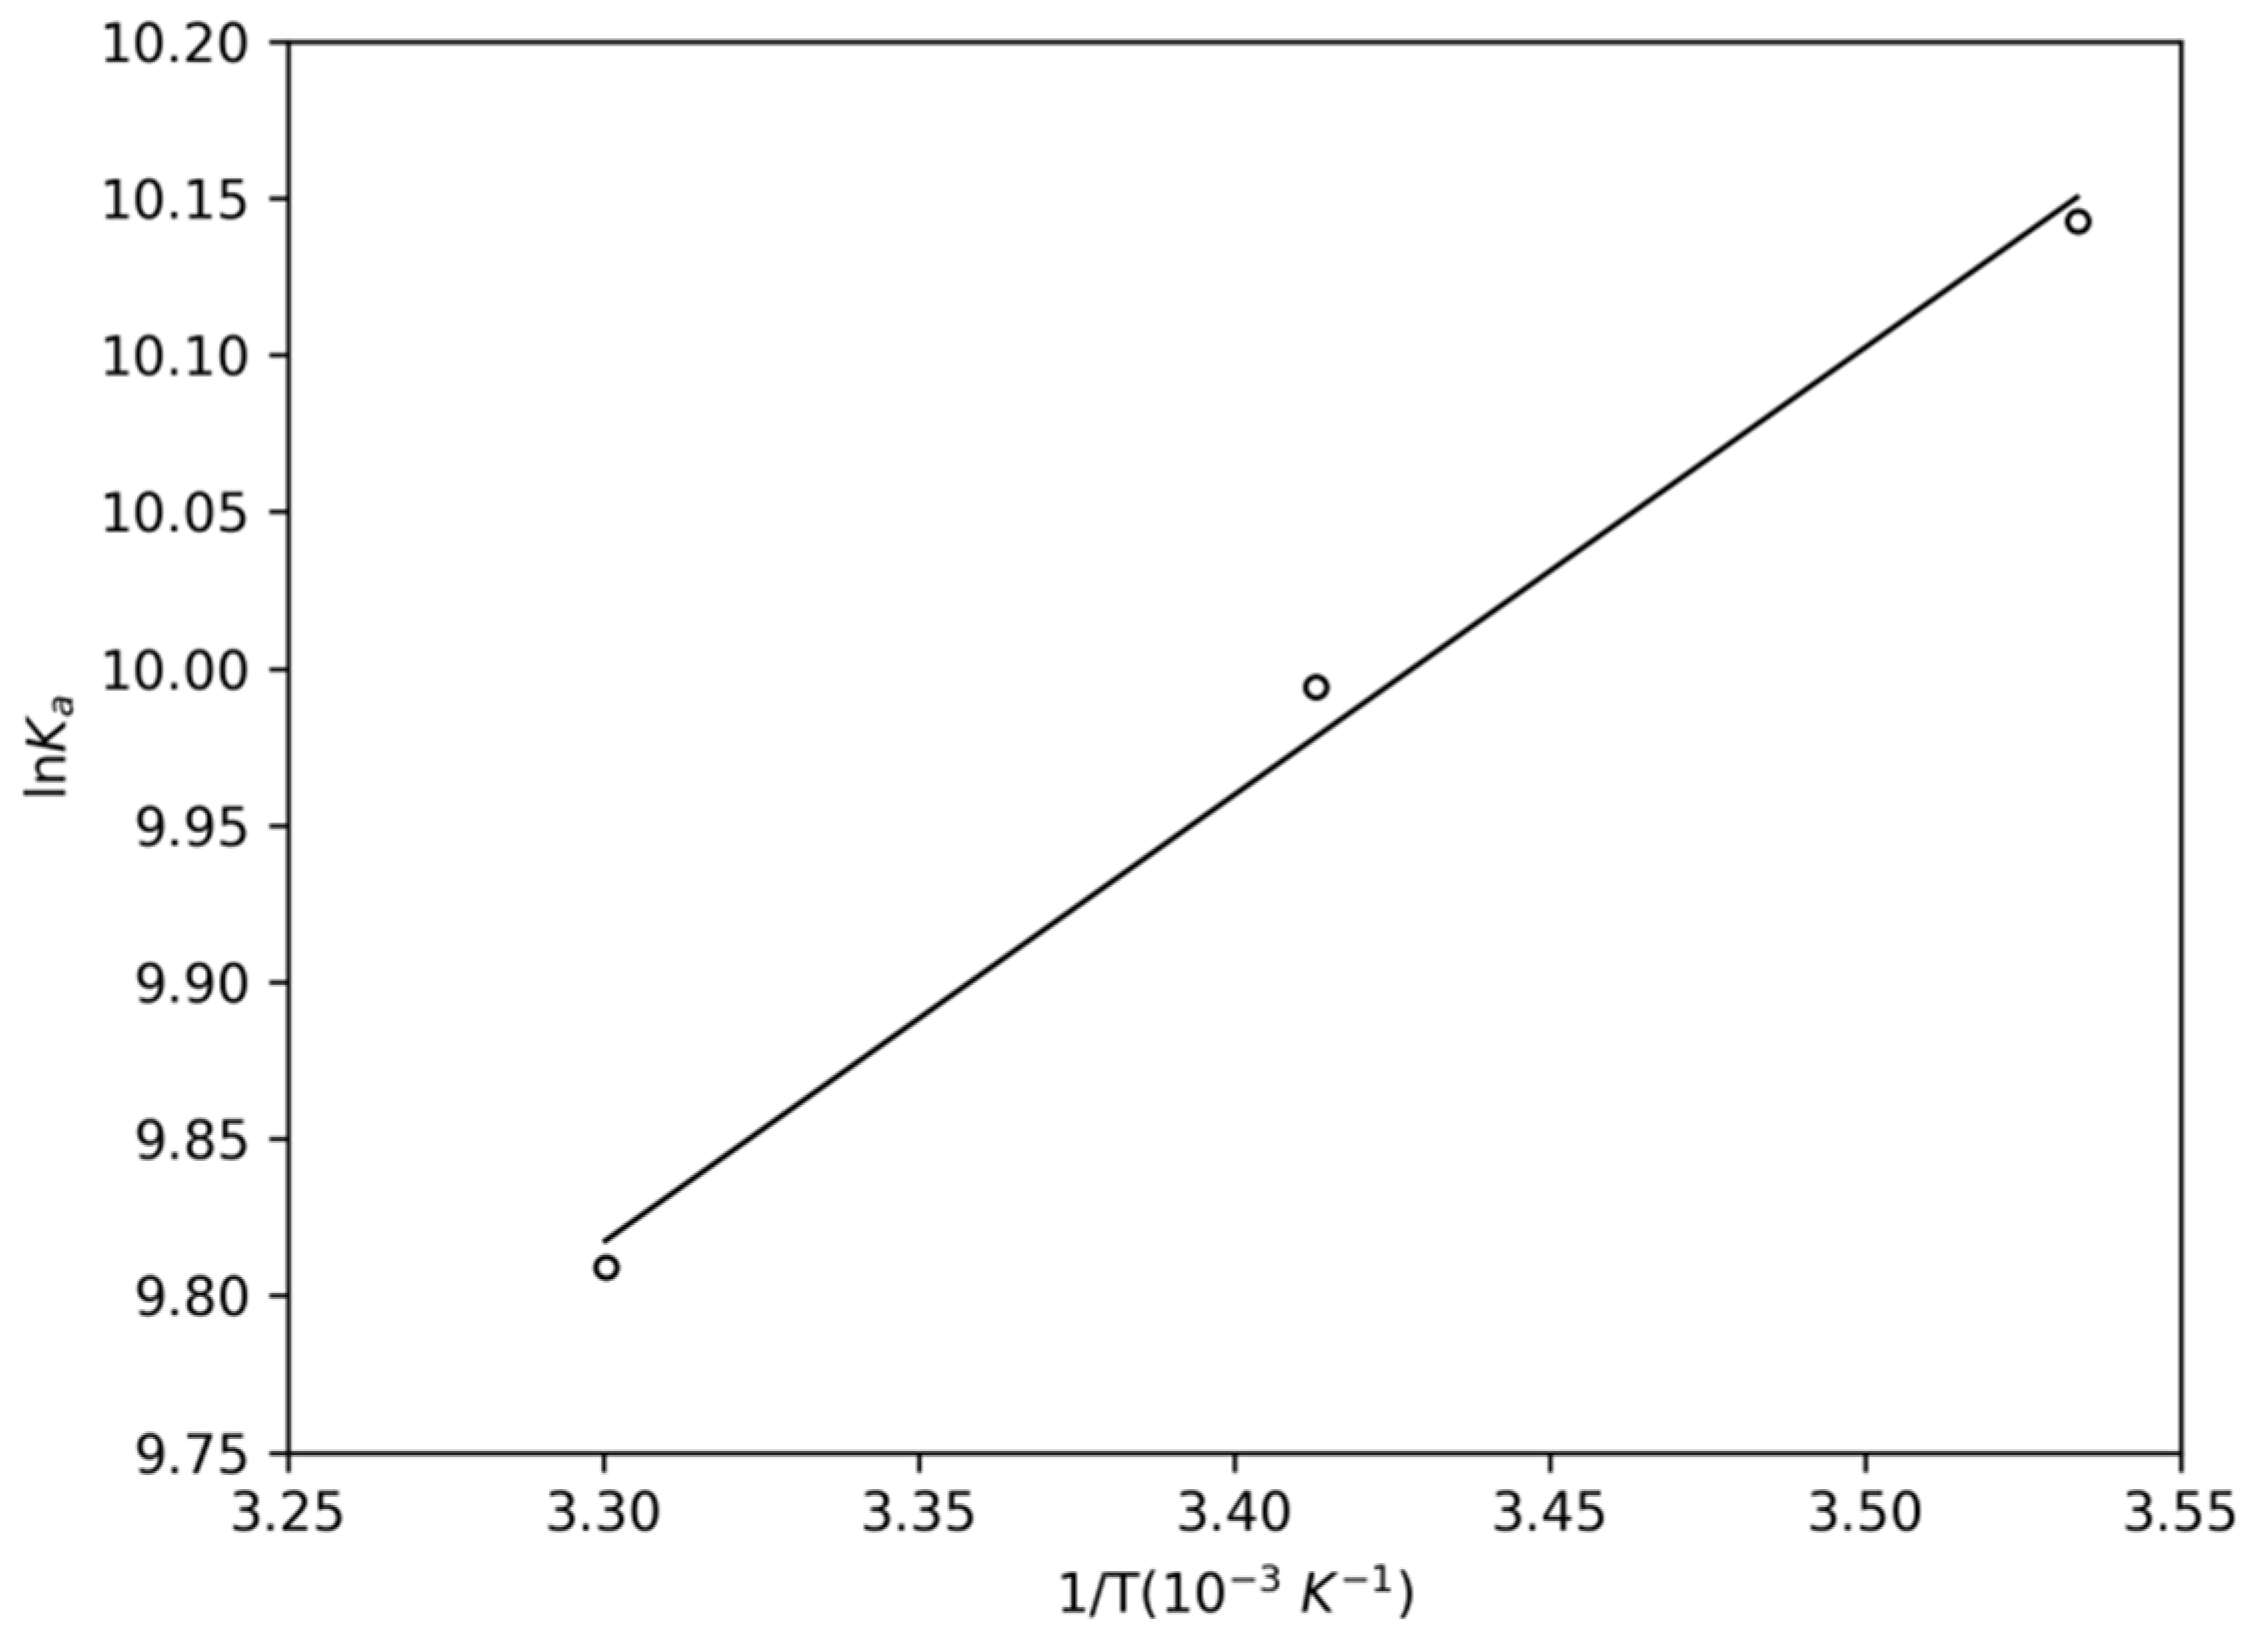
2.1.1. Thermodynamic Parameters

To obtain a description of the thermodynamic of complex formation, the thermodynamic parameters ∆S (entropy variation) and ∆H (enthalpy variation) were determined by linear regression of the data shown in Figure 4, using the Van’t Hoff equation (Equation (3)). ∆G (Gibbs free variation) was obtained according to Equation (4).
l n   K a = Δ H R · T + Δ S R
Δ G = Δ H T Δ S
According to the results of the thermodynamic parameters gathered in Table 2, the values of ∆G exhibited negative values at the three temperatures, which showed the spontaneity of the complex formation process. Besides that, ∆H < 0 characterized the complexation as an exothermic process. Furthermore, the positive values of ∆S may be an effect of water molecules displacement due to PPL entrance into the protein [25]. The thermodynamic balance of ∆H and T·∆S indicated the Van der Waals interactions as the major contribution to the complexation [26].

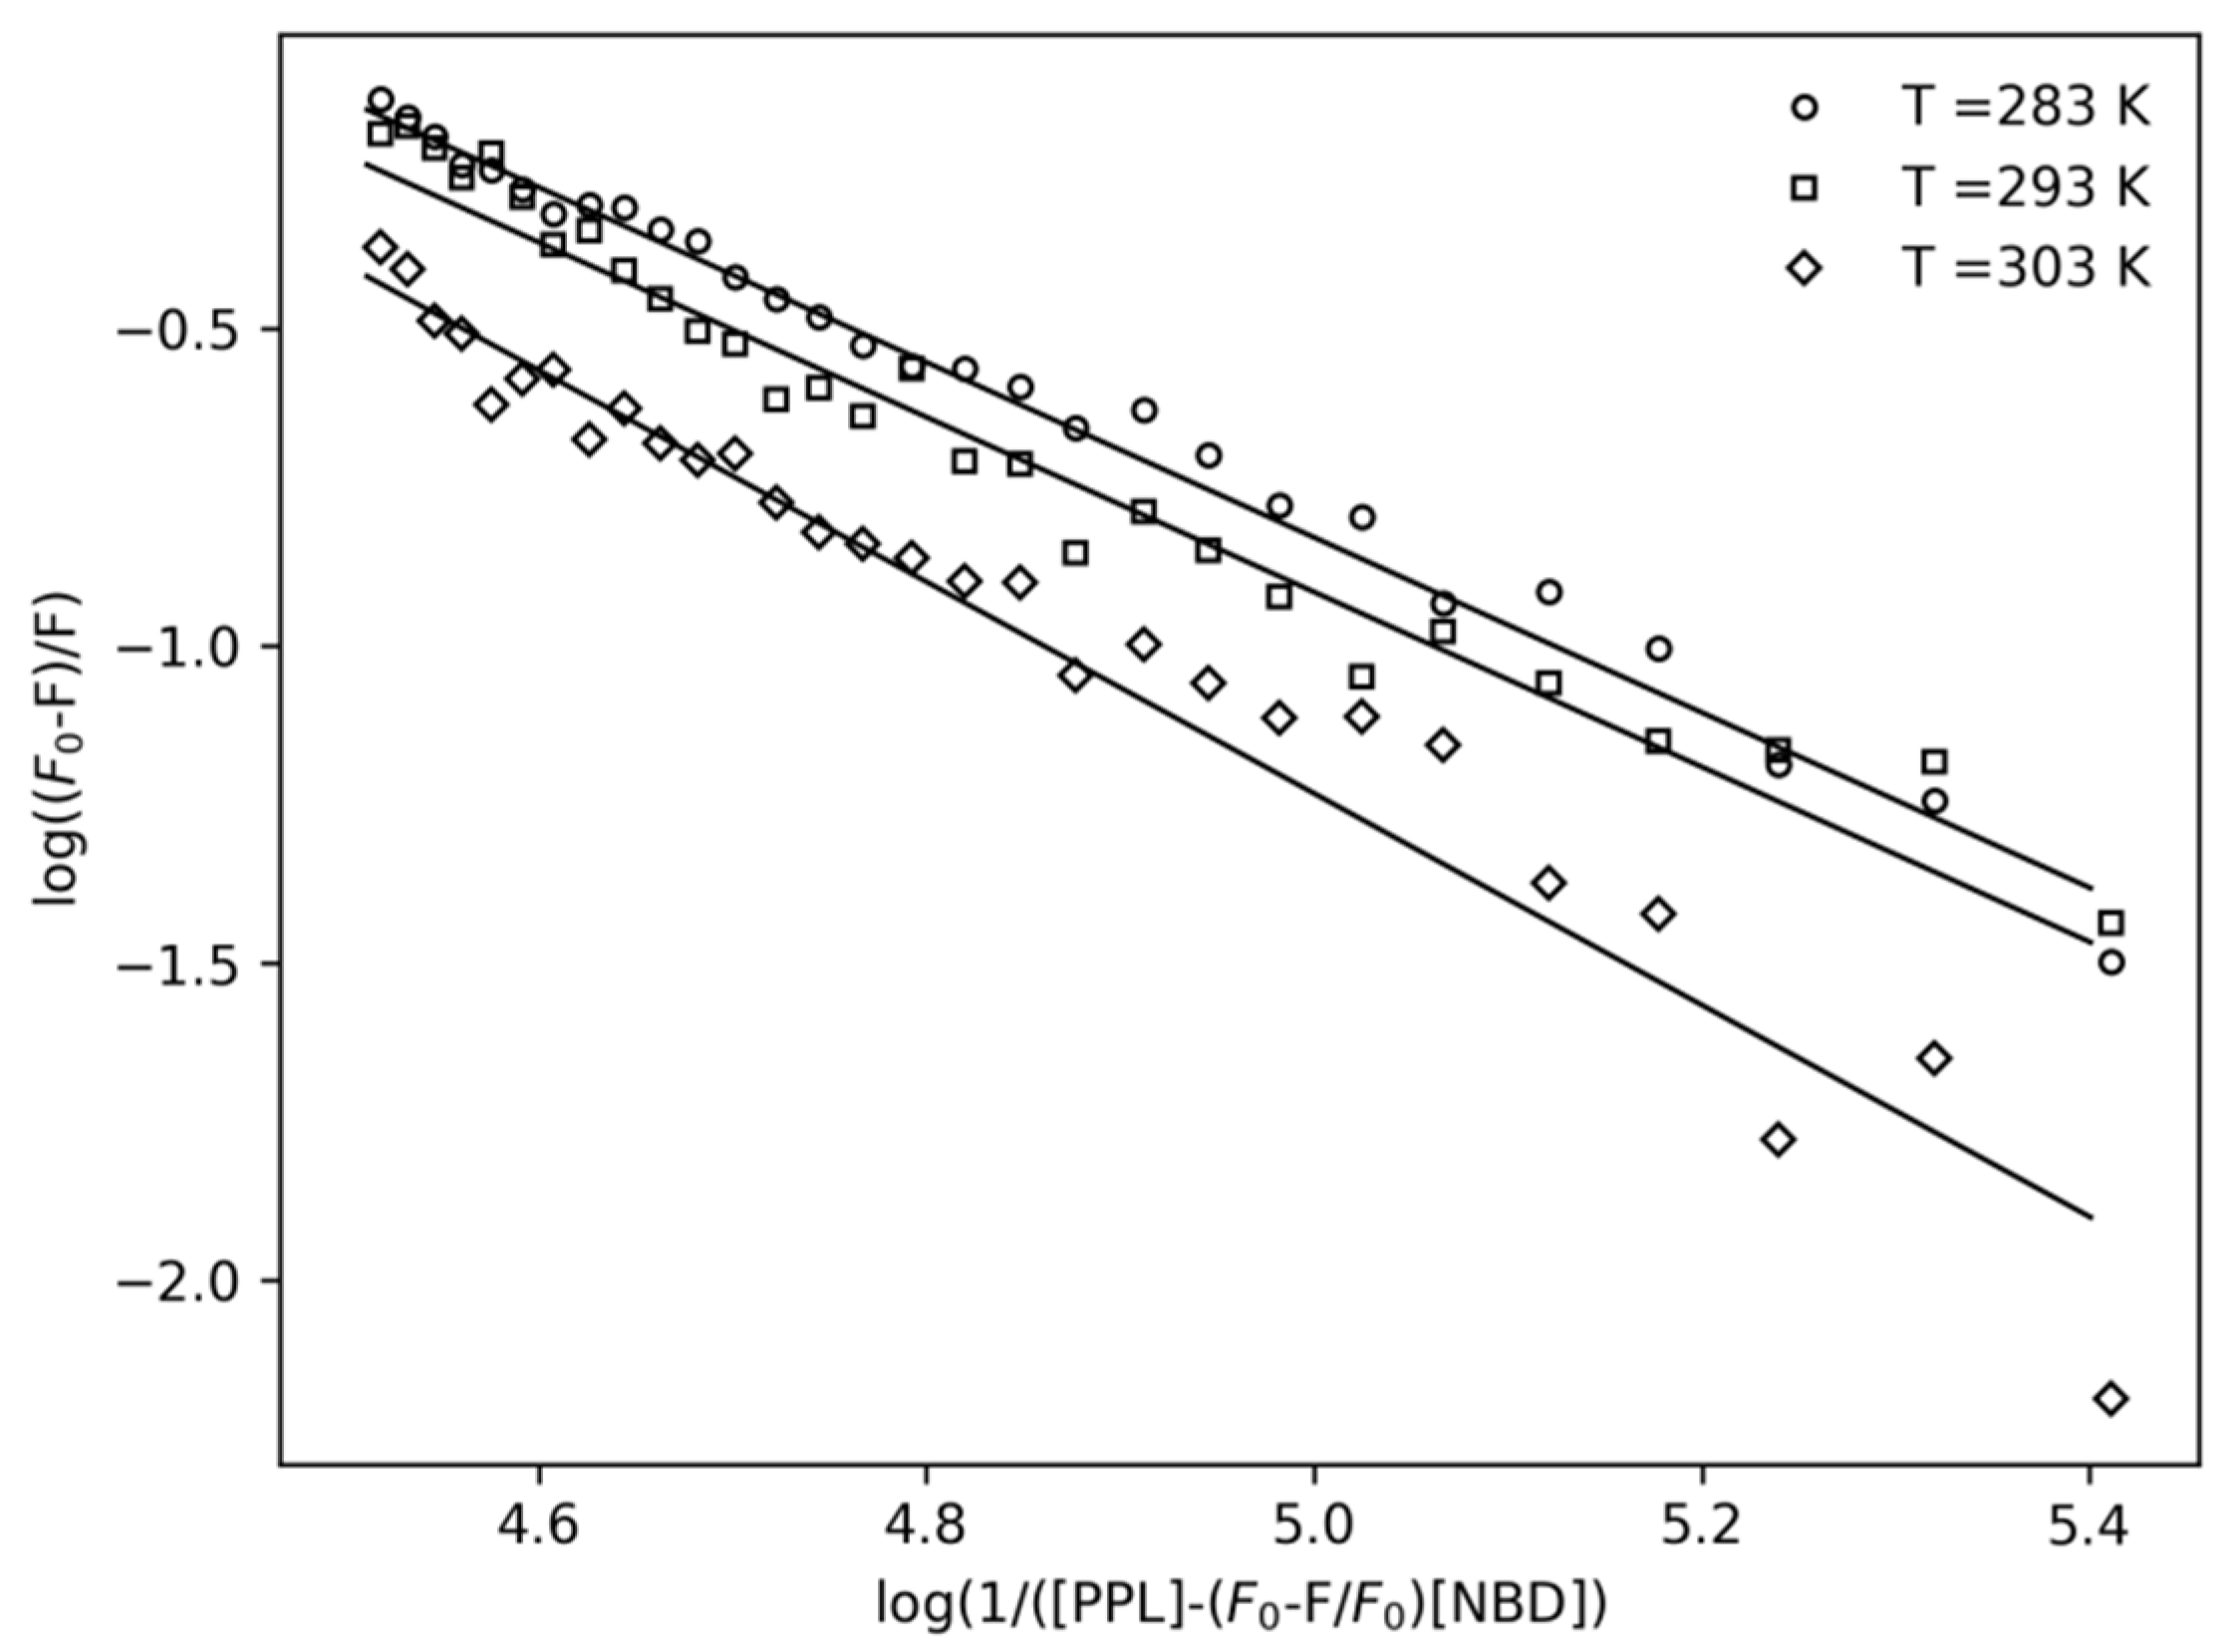
2.1.2. Interaction Density Function (IDF)

As a second method, IDF was also applied in fluorescence data in order to obtain a complete description of the system. Differently from the binding equilibrium model, IDF does not make use of any model a priori [27] and the advantage of applying IDF is the possibility of not only determining the number of binding sites but also identifying cooperativity occurrence among them. IDF considers that, if the free ligand concentration ([PPL]free) is the same for two at different concentrations of total protein ([NBD]), the average interaction density (Συi) will also be the same, and consequently the system will have the same variation on the percentage of quenching (ΔF). The percentage of fluorescence quenching is given by Equation (5). Where F is the observed fluorescence signal in the presence of PPL and F0 is the observed fluorescence signal for free protein. Figure 5 shows the plot of ΔF per log [PPL] for two known concentrations of NBD adjusted by a sigmoidal function.
Δ F = | F F 0 | F 0
Free ligand concentration and the average of interaction density are related to each other through the expression of mass conservation (Equation (6)).
[ P P L ] = [ P P L ] f r e e + ( ν i ) . [ N B D ]
By means of the plot shown on Figure 5, the values of [NBD] and [PPL] for each ΔF were obtained. According to the IDF results, a Scatchard plot was built (Figure 6a). This plot presented a concave function, revealing positive cooperativity between the NBD binding sites [28]. Interestingly, we reported recently that the interaction of piperine with NBD led to a cooperative mode of binding [29]. These results showed that different ligands can induce similar modes of binding in NBD structure.
The number of sites (n) and the binding constant (Kb) were obtained using Hill’s model, based on Equation (7). Another parameter obtained through this model was the cooperativity, indicated by Hill’s coefficient (h). [30]
ν i = n · ( K b [ P P L ] f r e e ) h 1 + ( K b [ P P L ] f r e e )   h
The Hill’s plot (Figure 6b) shows the variation of the average interaction density ( ν i ) with the free ligand concentration ( [ P P L ] f r e e ). With the mathematical fitting of these results, the number of sites (n) and the binding constant (Kb) were found to be 2.2 ± 0.1 and (6.3 ± 0.2) × 104 M−1, respectively. Besides that, the fitting also revealed the Hill’s coefficient (h) as 1.4 ± 0.1, confirming the cooperative binding of PPL toward NBD, previously detected in Scatchard plot.
These results showed that both methods applied in the analysis of fluorescence quenching (binding equilibrium model and IDF) are in agreement with respect to the order of magnitude of Kb, since binding equilibrium model revealed the binding constant as (2.2 ± 0.5) × 104 M−1.

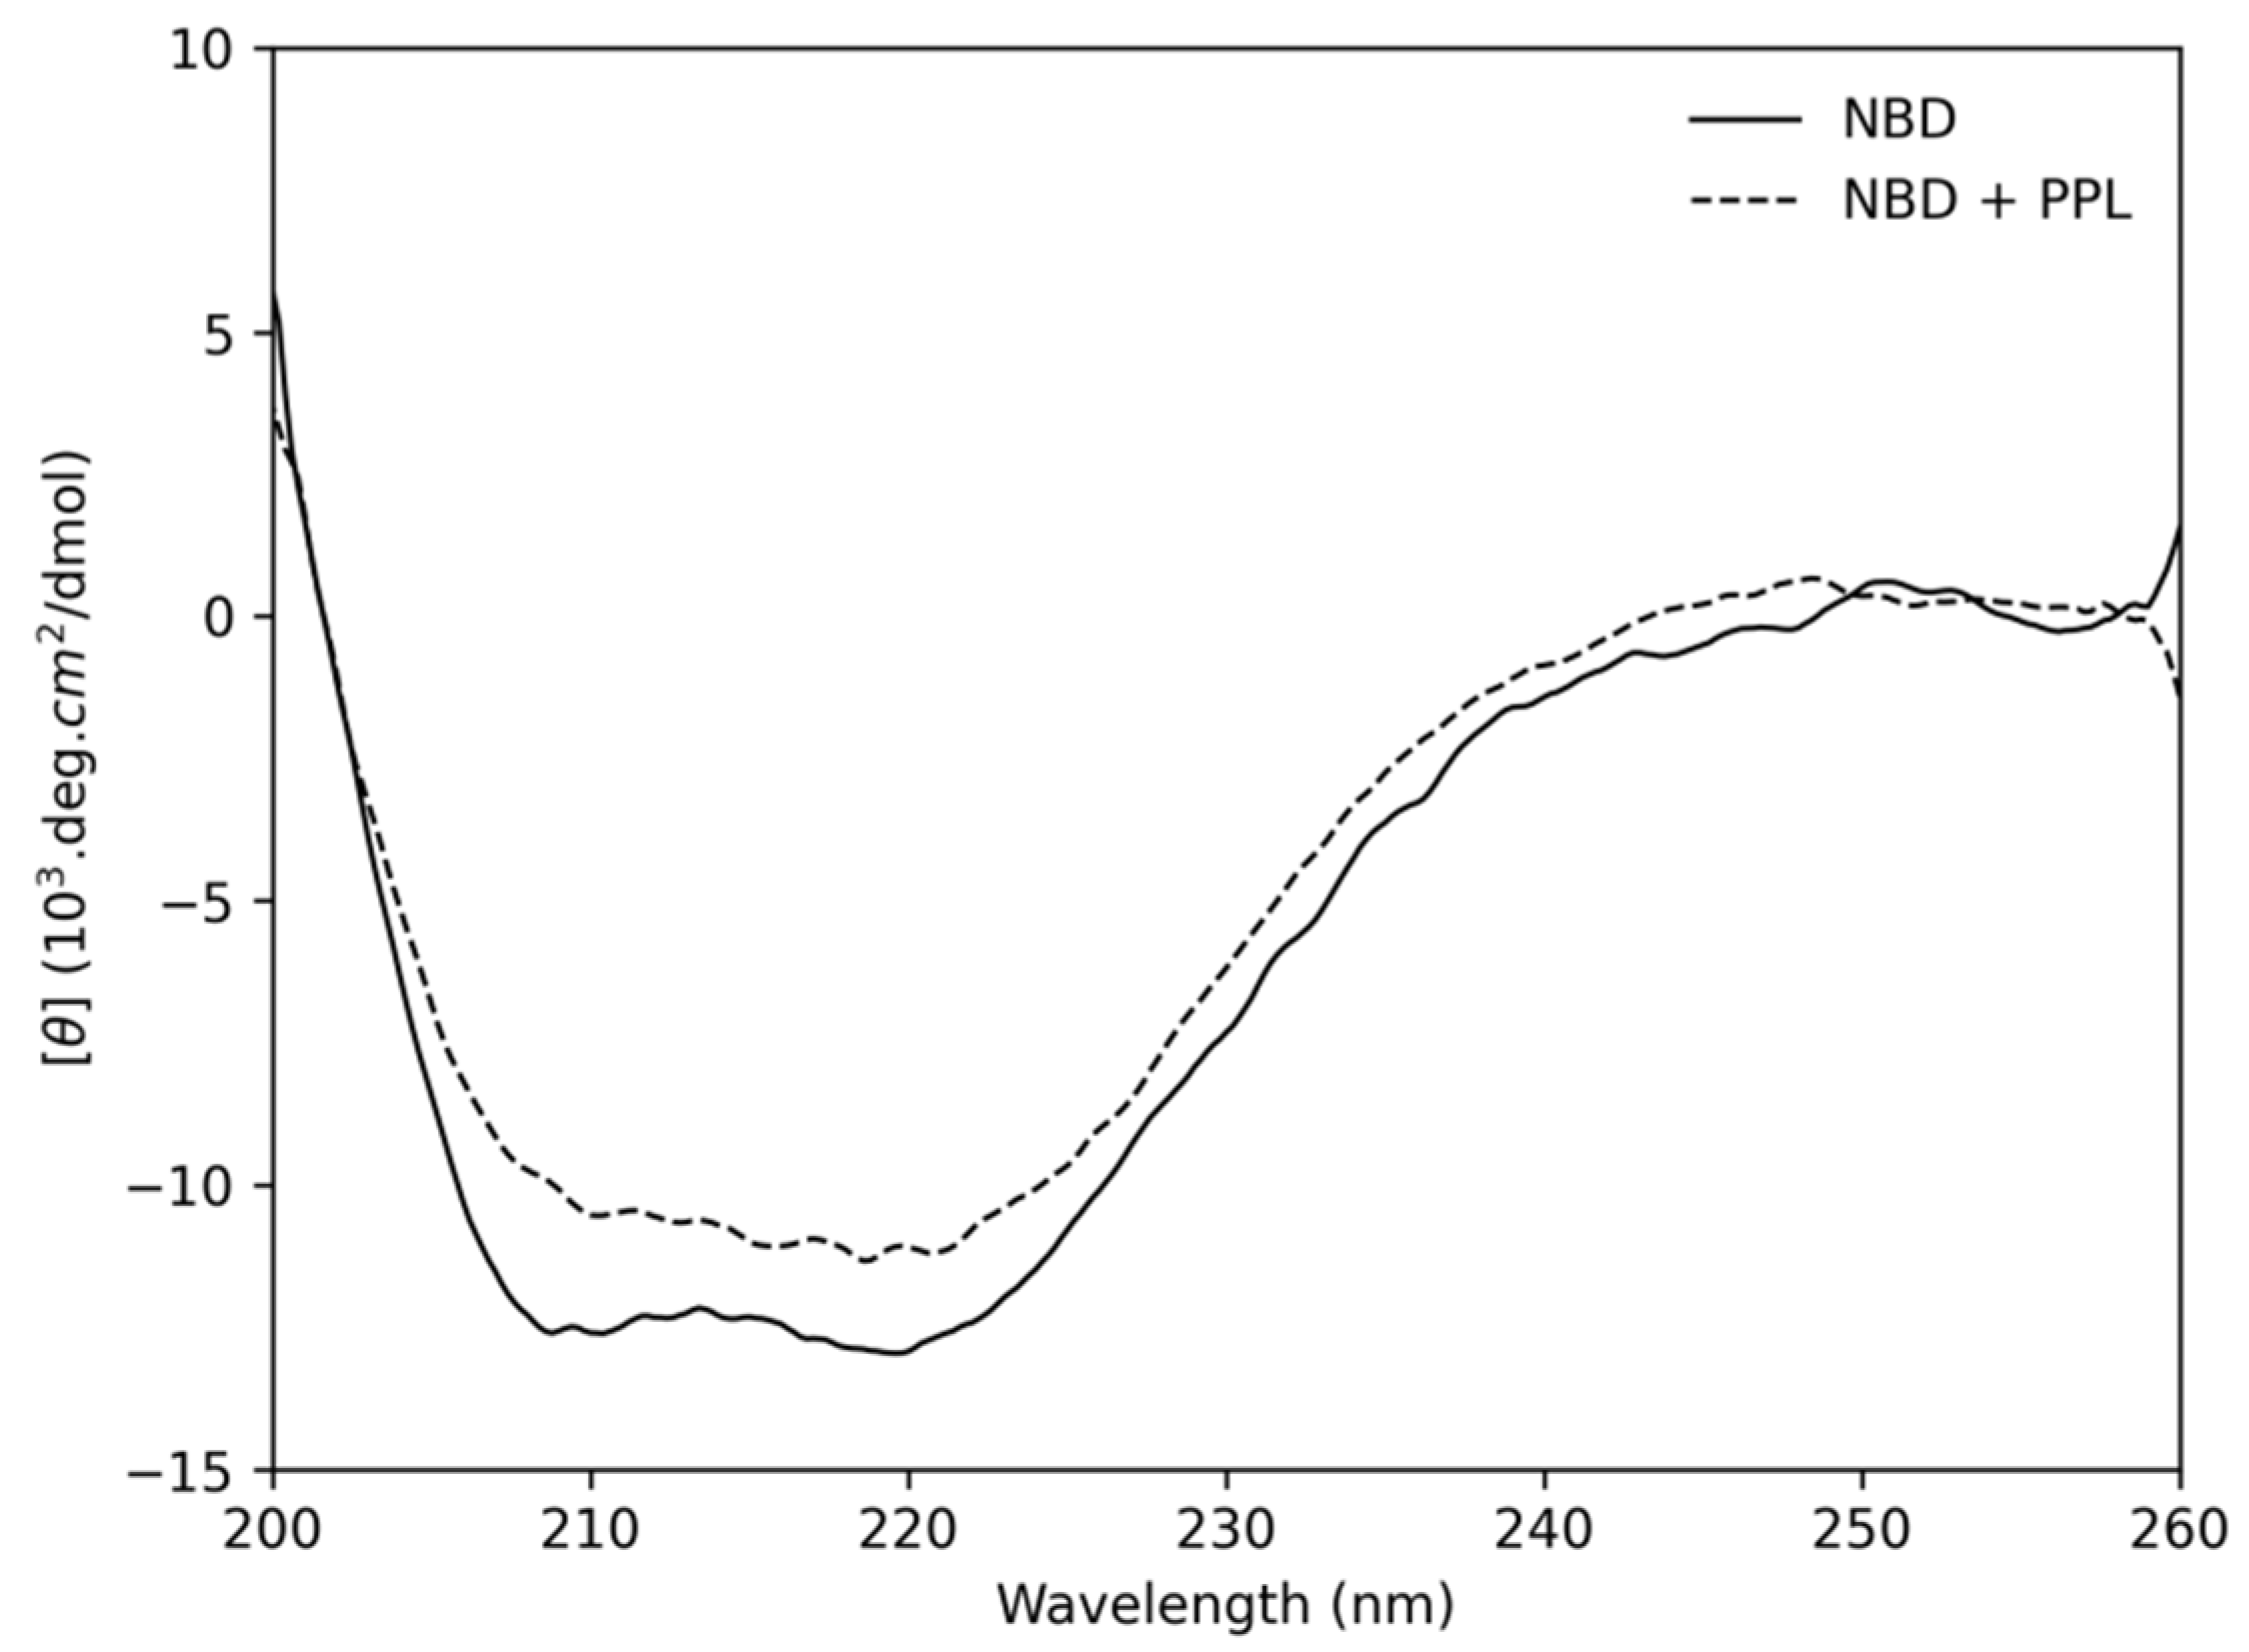
2.2. Circular Dichroism

Circular Dichroism (CD) is a suitable method to analyse secondary structure of proteins in different conditions. In this way, CD experiments were performed to obtain both the thermal structural stability of the domain NBD (Figure 7) and possible secondary conformational changes due to the PPL interaction (Figure 8). Considering that NBD structure is predominantly composed by alpha-helices in solution with two CD characteristic bands centred at 208 nm (π-π*) and at 222 nm (n-π*) [31], the wavelength of 222 nm was followed to monitor the thermal transition (Figure 7b) of NBD. According to the results obtained (Figure 7b), NBD experienced a transition from folded to unfolded state at ~314 K. Similar results were obtained from calorimetric and spectroscopic methods applied to bacterial HSP (DnaK) [32,33].
Figure 8 shows the CD spectrum of pure NBD and in the presence of PPL at stoichiometry of 1:12, the same stoichiometry reached in the IDF experiment. According to the results, the deconvolution of pure NBD spectrum presented 38% of alpha-helices, 14% of β-sheet, 20% of turn and 28% of coil, which is in a good agreement with the results obtained by Zazeri et al. [29] at a similar temperature. After PPL addition, NBD underwent some secondary conformational changes, being 33% of α-helices, 17% of β-sheet, 19% of turn and 31% of coil. Interestingly, while the percentage of α-helices decreased by 5%, the percentage of β-sheet increased by 3%. Despite the smaller secondary structural changes found in this work compared to those reported by Zazeri et al. [29] for the interaction of NBD and piperine, the same behavior for α-helices and β-sheet changes were observed. Furthermore, although the results showed a maximum secondary structure change of 4% (related to α-helices), it is not statistically significant in terms of conformational changes, such changes may modulate the biochemical activity [34].

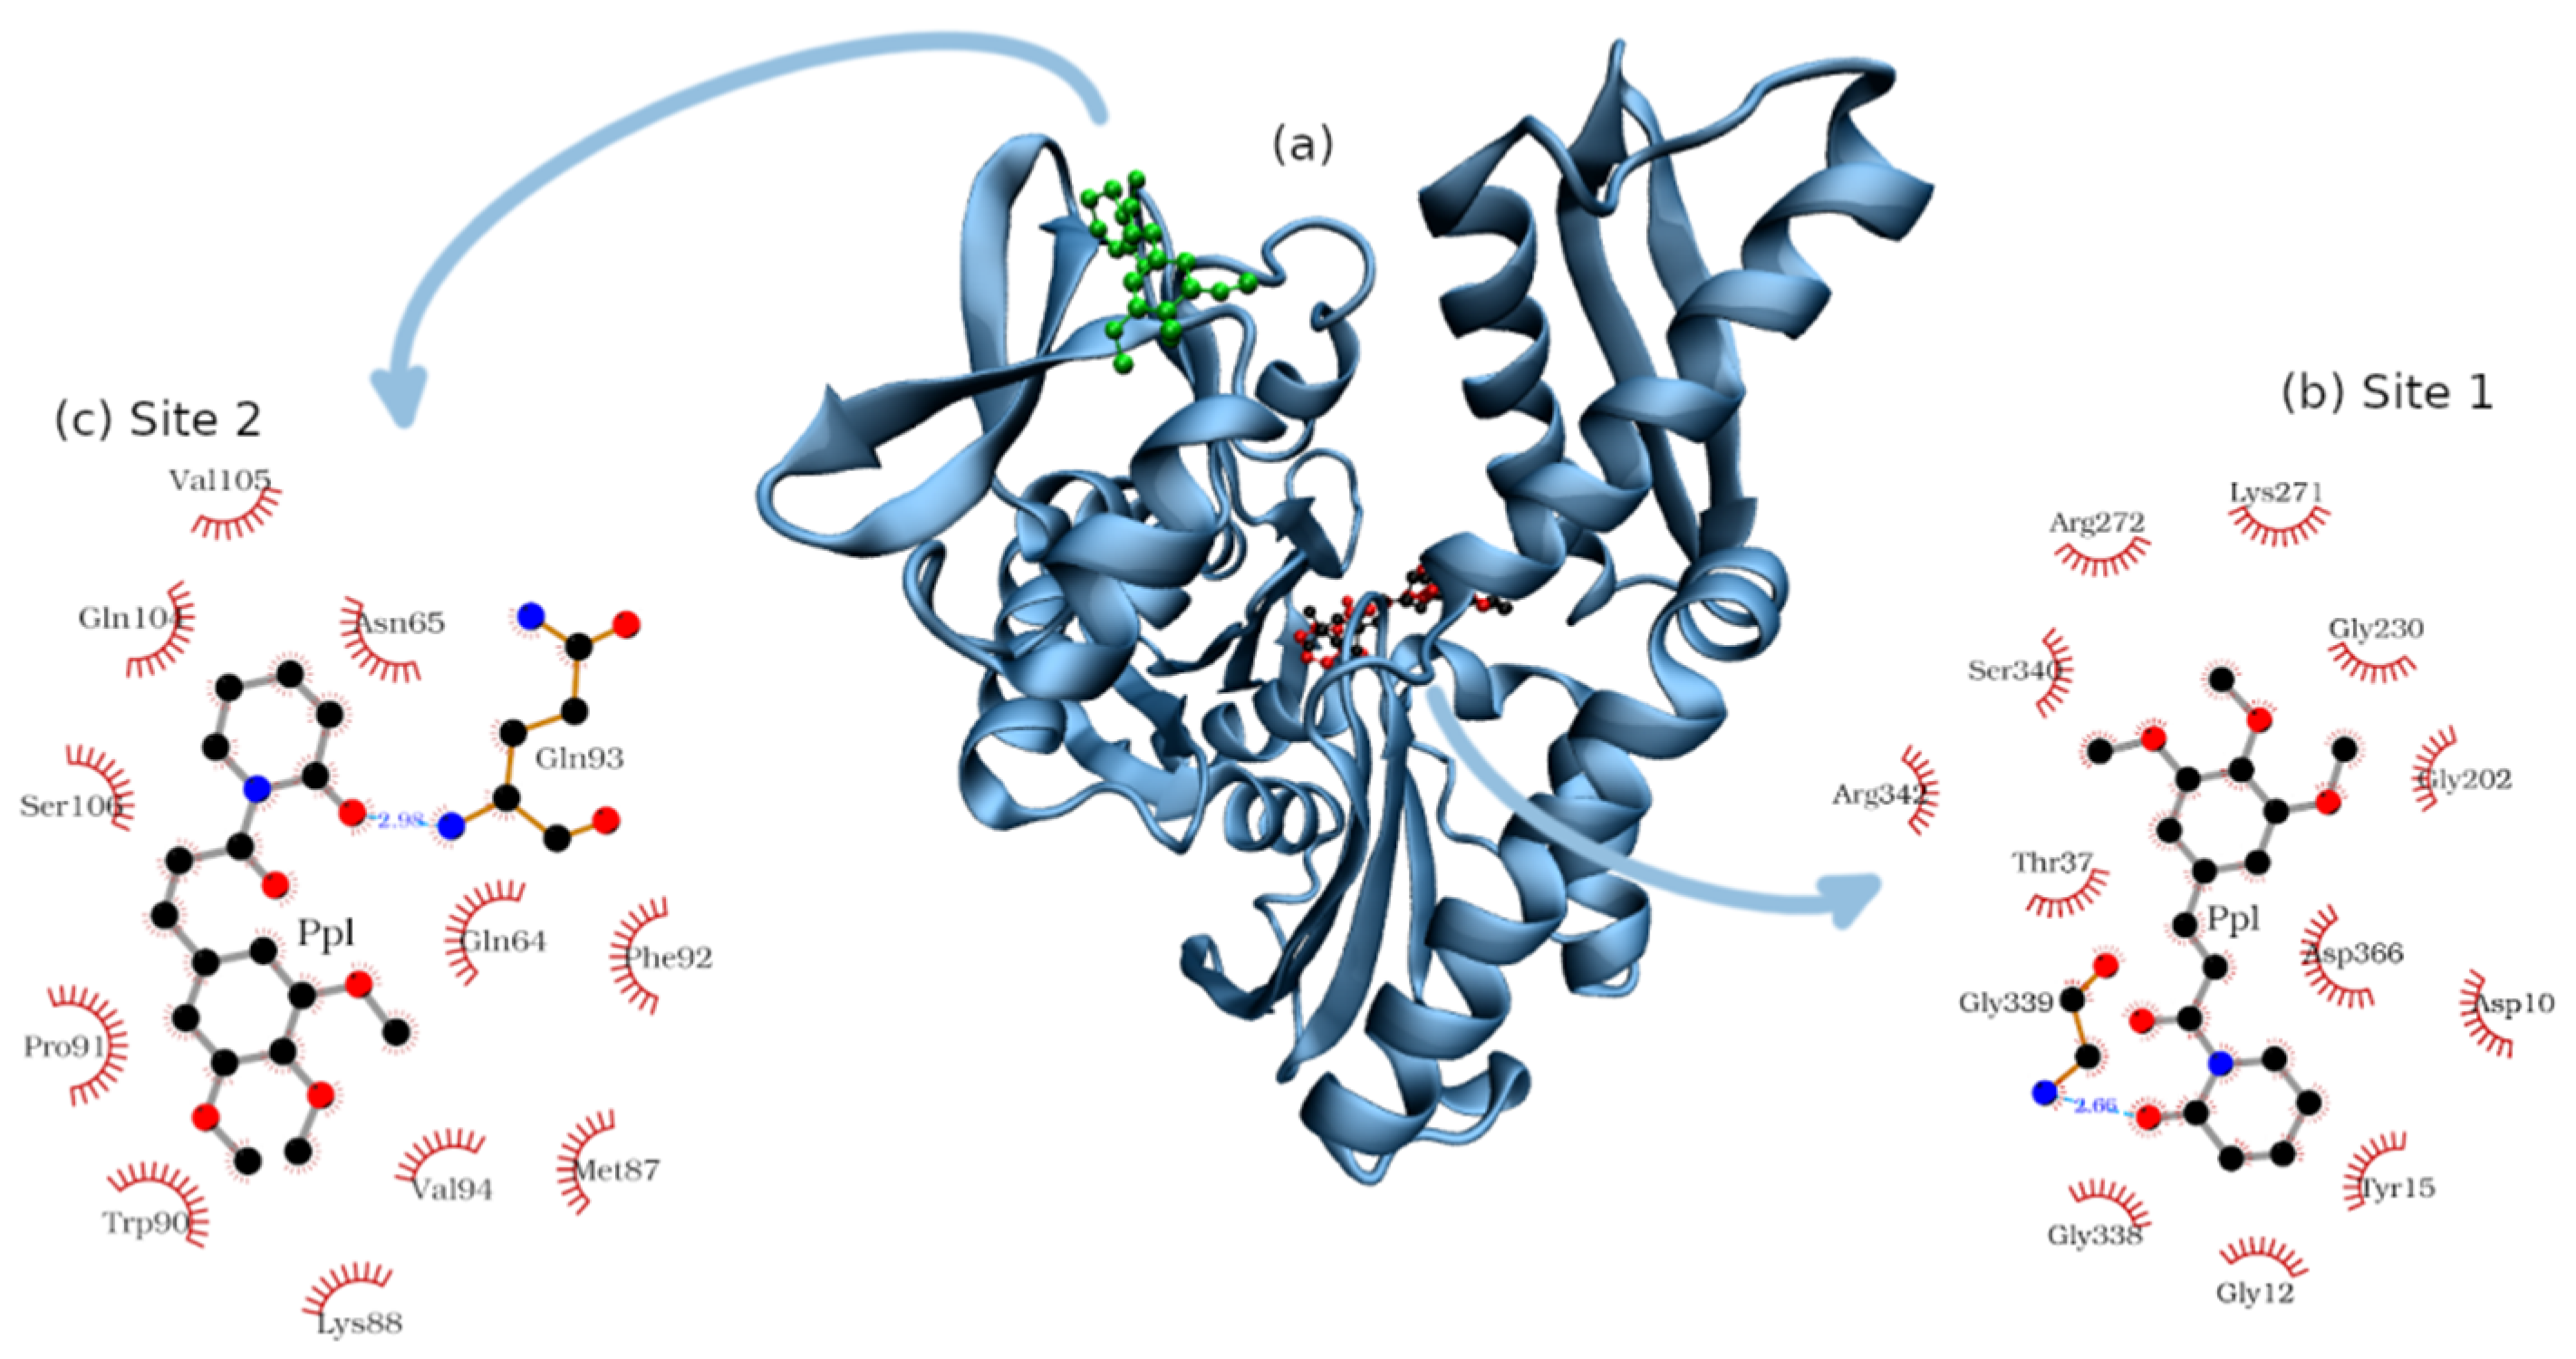
2.3. Molecular Docking

The structure of NBD obtained from PDB 1S3X was directly subjected to molecular docking that disclosed several possible pockets where PPL can interact with NBD (Figure S2), with energy ranked from (7.2 to 5.0 kcal). The analysis of the poses from cluster “a” to “g” (Figure S3) revealed that they are in the environment of the binding site accessed by the ADP molecule, represented in black. The next cluster analyzed was “h”, which is not in the proximity of the ADP binding site, as shown in Figure S3. The next clusters were not considered once they were less populated than the previous ones. For the next analyses, we will consider the coordinates from cluster “a” and “h” as being Site 1 and 2, respectively (Figure 9).
The composition of the bind sites was organized in Table 3, which shows that Site 1 is rich in glycine and presents a generous number of polar amino acids (whether charged or not). Ligplot software detected a hydrogen bond between PPL and the nitrogen atom of Gly339 which is part of the backbone of NBD. It is worth noting that such analysis was made based on a fixed pose calculated by molecular docking; a more holistic analysis of hydrogen bonds will be presented based on molecular dynamics results.
Site 2 presents an equilibrated balance of polar and non-polar amino acids. No negatively charged residues were found in the environment, which favors the interaction with PPL with protein since its structure presents charge delocalization that concentrates negative charges in the extremities of the molecule [35]. Besides that, the interaction of PPL with Site 2 includes one hydrogen bond with Gln93.

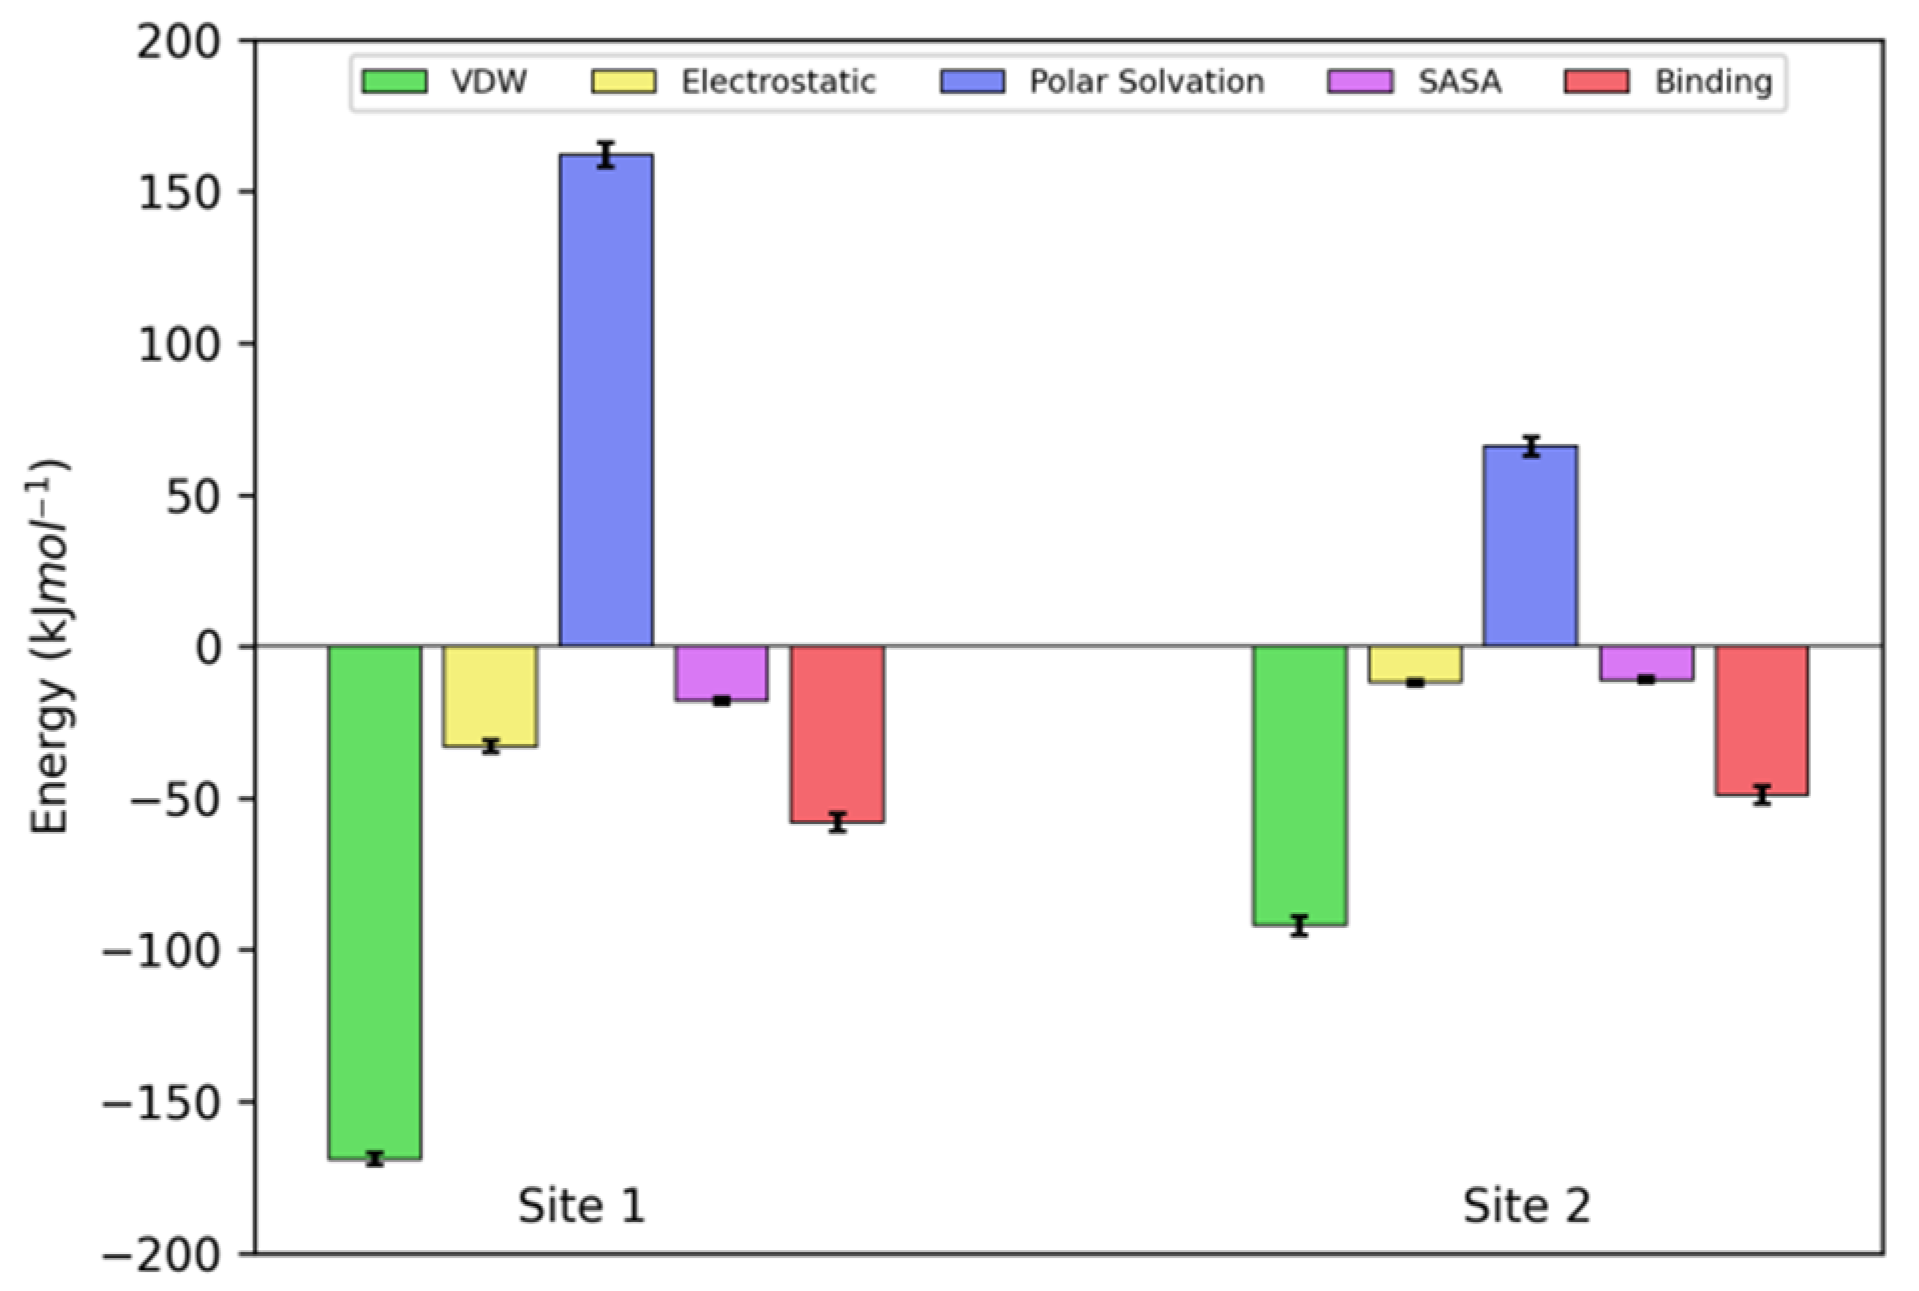
2.4. Molecular Dynamics

The equilibration and stability of the complexes formed by NBD and PPL in Sites 1 and 2 was verified through the parameters obtained from molecular dynamics (Figure 10). The root mean square deviation (RMSD) of NBD with PPL in Site 1 and 2 remained stable during the simulation, fluctuating around 0.25 nm. Similar behavior was found to the RMSD calculated for PPL atoms when bound in Site 1 and 2, which remained stable, fluctuating around 0.1 nm, i.e., PPL remained in the Sites 1 and 2 throughout the simulation.
Another helpful parameter used to verify the stability of the protein-ligand complex is the distance from the centre of geometry (COG) of protein to the COG of ligand. The distance calculated for the complex formed by NBD and PPL in Site 1 remained around 0.7 nm, as expected, since the molecule is located close to the centre of geometry of NBD (Figure 9). For Site 2, the distance fluctuated around 2.5 nm, confirming that PPL remained in the binding site located in the periphery of NBD (Figure 9).
The root mean square fluctuation (RMSF) of the residues of NBD free, bound to PPL in site 1 and 2 was calculated to verify possible changes in the dynamics of the protein caused by the interaction with ligand. No drastic change was observed in the RMSF of NBD with PPL in Sites 1 and 2 when compared to RMSF of free NBD. A slight change was observed for residues 78–87 that compose an α-helix close to Site 1. However, the change in the dynamics is not necessarily due to the interaction of PPL in Site 1 since the dynamics of such residues also presented low fluctuation in the analysis of NBD with PPL in Site 2.
The analyses of hydrogen bonds showed that in Site 1 PPL performs between 1 and 2 H-bond with residues of NBD 72% of the simulation time. Hydrogen bonds are less observed in the interaction of PPL with Site 2. Molecular dynamics revealed that the number of the H-bond was between 0 and 1 in 73% of the simulation time. Hydrogen bonds give an enthalpic contribution to the thermodynamic balance. Application of the Van’t Hoff model to the experimental data (Table 2) gave insight into an equilibrated balance between entropic and enthalpic interactions. Molecular dynamics corroborated this result since a moderate formation of H-bonds in both sites was detected.
Figure 11 shows the results of MMPBSA calculations applied to the trajectory from molecular dynamics simulations. According to the results, the binding sites have similar binding energy (−58 ± 3 kJ·mol−1 and −49 ± 3 kJ·mol−1 for Site 1 and 2, respectively). Moreover, the results revealed the Van der Waals as the predominant interaction of the complex, which reinforced the result obtained from Van’t Hoff analyses.

3. Materials and Methods

3.1. Reagents

Piperlongumine (>97%) was purchased from Sigma-Aldrich Chemical Co. (Schnelldorf, Germany), as dibasic sodium phosphate (>99%) reagents, anhydrous citric acid (>99%), and sodium chloride (>99%). Lyophilised Nucleotide Binding Domain of Heat Shock Protein 70 kDa (>97%) was purchased from GenScript. Methanol was purchased from Dynamics Química Contemporânea LTDA (Indaiatuba, SP, Brazil). All the materials purchased were used as supplied. Ultrapure water was prepared by a Millipore water purification system -Direct-Q UV-3(Merck KGaA, Darmstadt, Germany). Lyophilized NBD was reconstituted in a 50 mM phosphate buffer containing 150 mM sodium chloride, and the pH was adjusted to 7.4 with anhydrous citric acid. Stock solutions of PPL were prepared in methanol. The concentrations of PPL and NBD solutions were determined by UV-Vis experiments performed on Biospectro spectrophotometer (Biospectro, Curitiba, PR, Brazil), using the extinction coefficient of 18700 M−1·cm−1 at 326 nm for PPL and 20,525 M−1·cm−1 at 280 nm for NBD.

3.2. Experimental Methods

3.2.1. Steady-State Fluorescence Spectroscopy

Fluorescence experiments were performed on the Lumina (Thermo Fisher Scientific, Waltham, MA, USA) stationary state spectrofluorimeter equipped with thermal bath and Xenon lamp. A 100 μL quartz cuvette with 2 mm × 10 mm optical path was used in the experiments. The widths of the excitation and the emission slits were adjusted to 10 nm. The wavelength of 295 nm was used to excite the single tryptophan residue of NBD (Trp90). The emission spectra were obtained in the range from 305 to 500 nm with a resolution of 1.0 nm ± 5.0 nm. Each emission point collected was the average of 15 accumulations. The software ScanWave was used to collect the measured data.
In the binding equilibrium experiments, aliquots of PPL (increment of 1.0 μM) were added in NBD solution at 4.0 μM. Measurements were performed at 283 K, 293 K, and 303 K. In the interaction density function analysis, aliquots of PPL (increments of 1.0 μM) were added in NBD solutions at 6.0 μM and 8.0 μM at a fixed temperature (293 K). In all experiments, the final volume of methanol in the buffer was <1.0%.
The correction of the inner filter effects was done with Equation (8), where Fcorr and Fobs are corrected and observed fluorescence intensities, and Aex and Aem are the absorbance of the sample in a 10 mm optical path cuvettes at the excitation and the emission wavelengths, respectively [22].
  F c o r r   = F o b s   · 10 ( 5 · A e x + A e m ) 10

3.2.2. Time-Resolved Fluorescence

Fluorescence lifetime measurements were performed using a Mini-tau filter-based fluorescence lifetime spectrometer coupled to a Time-Correlated Single Photon Counting (TCSPC) system (Edinburgh Instruments, Livingston, UK). Aliquots of PPL were added in the NBD solution from 0 to 24 μM. Experiments were carried out at 293 K.
The sample was excited at 295 nm using a picosecond pulsed light emitting diode (LED), and fluorescence decay was collected using a 340 nm filter. The fluorescence decay profile (Figure S1) was fitted using multiexponential decay (Equation (9)), where τi is the lifetime of each component, and αi is the contribution of each component to total fluorescence decay. The average lifetime <τavg> was calculated using Equation (10) (Table S1).
I T = i = 1 n α i . e T τ i
  τ a v g = α 1 τ 1 2 + α 2 τ 2 2 α 1 τ 1 + α 2 τ 2

3.2.3. Circular Dichroism

Circular dichroism spectra were recorded on a Jasco J-815 spectropolarimeter model DRC-H (Jasco, Easton, MD, USA) equipped with a demountable quartz cell with a 0.01 cm optical path length. The CD spectra were recorded from the 200 to 260 nm range with a scan rate of 20 nm/min and a spectral resolution of 0.1 nm. For each spectrum, 15 accumulations were performed. For the denaturation experiments, the spectra were recorded in the temperature range of 280 and 340 K. The ellipticity θ collected in millidegrees was converted to mean residue ellipticity [θ] (deg·cm2·dmol−1) using Equation (11) and the protein denatured fractions were determined with Equation (12) where [θ]nat is the [θ] at 280 K and [θ]den is [θ] at the 340 K. For the interaction experiments, the molar ratio NBD:PPL was 1:12, the buffer spectrum was subtracted, and the temperature was kept at 293 K. The secondary structures percentages were calculated with CDPro applying the CONTIN method with the SP43 protein library [36].
[ θ ] = θ ( m d e g ) 10 · [ P ] · l · n
f = ( [ θ ] o b s [ θ ] d e n ) ( [ θ ] n a t [ θ ] d e n )

3.3. Computational Methods

3.3.1. Molecular Docking

PPL structure used in molecular docking was obtained from ab initio calculations from our previous work [31]. The AutoDockTools [37] software of the MGL program Tools 1.5.4 was used to prepare the NBD (PDB 1S3X) by adding polar hydrogen atoms and Gasteiger charges. The maps were generated by the AutoGrid 4.2 program [38] with a spacing of 0.541 Å, a dimension of 126 × 126 × 126 points, and grid center coordinates of 51.315, 42.946, and 49.437 for x, y, and z coordinates, respectively. The AutoDock 4.2 program [37] was used to investigate the NBD binding sites using the Lamarckian Genetic Algorithm (LGA) with a population size of 150, a maximum number of generations of 27,000, and energy evaluations equal to 2.5 × 10⁶. All other parameters were selected as software defaults. To generate different conformations, the total number of runs was set to 100. (Figure S2). The final conformations were visualized on VMD [39]. The binding microenvironment was generated by LigPlot [40].

3.3.2. Molecular Dynamics

The simulations of the complex NBD/PPL were performed with GROMOS53a6 force field [41] by Gromacs v.5.1.4 [42]. The complex was placed in a rectangular box, solvated with the simple point charge water (SPC) [43] and neutralized with NaCl in a concentration of 150 mM. The energy minimization was performed with the steepest descent algorithm with 5000 steps and a tolerance of 10 kJ·mol−1. The cut-off for small-range interactions was set to 10 Å and the long-range electrostatic interactions were treated with particle mesh Ewald (PME) [44]. Then, the heavy atoms were restrained with a force constant of 1000 kJ mol−1 nm−2 and the system was submitted to the first stage of equilibration for 100 ps in the NVT ensemble coupled to V-rescale thermostat at 293 K [45]. All bonds were constrained with the LINCS algorithm [46]. Random velocities were generated by the Maxwell–Boltzman distribution. The second stage of equilibration was performed in the NPT ensemble for 100 ps of simulation coupled to Parrinello–Rahman barostat [47] at 1 atm. Finally, the restrictions were turned off and the molecular dynamics simulations were performed with steps of 2 fs using the leap-frog algorithm to integrate the equations of motion. The hydrogen bonds were calculated by gmx hbond. The results presented are an average of three independent simulations.
The free energy of the binding process of PPL toward NBD was calculated by G_mmpbsa tool [48], using the molecular mechanics Poisson–Boltzmann surface area (MM/PBSA) method applied to the snapshots obtained from molecular dynamics simulations. The snapshots were extracted in intervals of 500 ps from the trajectory after the system reached the equilibrium, which was verified by the root mean square deviation (RMSD) and the distance from the center of geometry of NBD to PPL, obtained by the programs gmx rms and gmx distance, respectively (Figure 10). The coarse grid-box (cfac) was set as 2 and the finer grid-box (fadd) was set as 20. The concentration of positive and negative ions was set as 0.150, being the positive and negative radii set as 0.95 and 1.81 Å, which correspond to sodium and chloride atoms, respectively. The values for the vacuum (vdie) and solvent (sdie) dielectric constants were set and 1 and 80, respectively. The solute dielectric constant (pdie) was set as 4.

4. Conclusions

Multi-pronged spectroscopic analyses aided by computational modeling elucidated in detail the main features of the NBD/PPL interaction for the first time. Steady state fluorescence spectroscopy and time-resolved fluorescence results revealed the complex formation via static quenching mechanism. The use of binding equilibrium and IDF methods to treat the fluorescence quenching resulted in a binding affinity with an order of magnitude of 104 M−1. Besides that, IDF method revealed two cooperative binding sites for PPL in NBD. Van’t Hoff analyses showed through the thermodynamic balance that the complexation between NBD and PPL is an exothermic and spontaneous process, with Van der Waals as the key interaction to stabilize the complex. Molecular docking and molecular dynamics disclosed the main features of the microenvironments of interaction. In this context, the microenvironments are rich in polar (charged or non-charged) amino acids. Moreover, MMPBSA data reinforced the experimental results, confirming the equivalence of the binding sites and that Van der Waals interactions were predominant in the complex interaction. Although the environments disclosed by the analyses are highly polar, an elevated number of H-bonds was not observed. Further chemical modifications on the PPL structure aimed at increasing the affinity for the NBD binding sites would benefit from the insertion of hydrogen bond donors to reach the acceptors present in these sites. In conclusion, this work brings the key aspects involved in NBD and PPL interaction, which will further the drug development of PPL.

Supplementary Materials

The following are available online at https://www.mdpi.com/article/10.3390/ph14121298/s1, Figure S1: Time-dependent fluorescence decay of NBD with PPL concentration range from 0 to 24 µM. [NBD] = 10 μM, T = 298 K and λexc = 295 nm, Figure S2: Molecular docking clusters with their respective binding energy scores, Figure S3: Representation of the clusters a-h calculated by molecular docking. ADP molecule is represented in black, cluster a, b, c, d, e, f, g and h are represented in red, yellow, silver, tan, blue, orange and green, respectively, Table S1: Tryptophan lifetime in different stoichiometries HSP70:PPL obtained through biexponential decay.

Author Contributions

Conceptualization, A.P.R.P., G.Z., A.M.J. and M.L.C.; experimental methodology, A.P.R.P. and G.Z.; computational methodology, A.P.R.P. and G.Z.; formal analysis, A.P.R.P. and G.Z.; investigation, A.P.R.P., G.Z. and M.L.C.; resources, A.M.J. and M.L.C.; writing—original draft preparation, A.P.R.P., G.Z., A.M.J. and M.L.C.; writing—review and editing, A.P.R.P., G.Z., A.M.J. and M.L.C.; supervision, A.M.J. and M.L.C.; project administration, M.L.C.; funding acquisition, A.M.J. and M.L.C. All authors have read and agreed to the published version of the manuscript.

Funding

The authors A.P.R.P. and G.Z. were recipients of scholarships from Coordenação de Aperfeiçoamento de Pessoal de Nível Superior—(CAPES), Brazil-Finance Code 001, and Conselho Nacional de Desenvolvimento Científico e Tecnológico (CNPq), Brazil—(Grant 141953/2017-9), respectively. The author M.L.C. acknowledges the financial support from Fundação de Amparo à Pesquisa do Estado de São Paulo-FAPESP (Grant 2017/08834-9), Brazil.

Institutional Review Board Statement

Not applicable.

Informed Consent Statement

Not applicable.

Data Availability Statement

Data is contained within the article and Supplementary Materials.

Acknowledgments

Molecular Dynamics simulations were performed at the Center for Scientific Computing (NCC/GridUNESP) of São Paulo State University (UNESP), Brazil. The authors thank João Ruggiero Neto for availability of spectropolarimeter, Valdecir Ximenes for availability of fluorescence lifetime spectrometer and Marcelo de Freitas Lima for availability of stationary state spectrofluorimeter.

Conflicts of Interest

The authors declare no conflict of interest.

References

  1. Meyer, T.N.; Da Silva, A.L. Resposta celular ao estresse. Rev. Assoc. Med. Bras. 1999, 45, 181–188. (In Portuguese) [Google Scholar] [CrossRef] [PubMed] [Green Version]
  2. Lindquist, S.; Craig, E.A. The heat-shock proteins. Annu. Rev. Genet. 1988, 22, 631–677. [Google Scholar] [CrossRef]
  3. Ritossa, F. A new puffing pattern induced by temperature shock and DNP in Drosophila. Cell. Mol. Life Sci. 1962, 18, 571–573. [Google Scholar] [CrossRef]
  4. Karp, G. Biologia Celular e Molecular: Conceitos e Experimentos, 1st ed.; Manole: Barueri, Brazil, 2005; pp. 53–54. (In Portuguese) [Google Scholar]
  5. Jones, A.M.; Westwood, I.M.; Osborne, J.D.; Matthews, T.P.; Cheeseman, M.D.; Rowlands, M.G.; Jeganathan, F.; Burke, R.; Lee, D.; Kadi, N.; et al. A fragment-based approach applied to a highly flexible target: Insights and challenges towards the inhibition of HSP70 isoforms. Sci. Rep. 2016, 6, 34701. [Google Scholar] [CrossRef]
  6. Somensi, N.; Brum, P.O.; de Miranda Ramos, V.; Gasparotto, J.; Zanotto-Filho, A.; Rostirolla, D.C.; da Silva Morrone, M.; Moreira, J.C.F.; Gelain, D.P. Extracellular HSP70 activates ERK1/2, NF-kB and pro-inflammatory gene transcription through binding with RAGE in A549 human lung cancer cells. Cell. Physiol. Biochem. 2017, 42, 2507–2522. [Google Scholar] [CrossRef] [PubMed]
  7. Hulina, A.; Rajković, M.G.; Despot, D.J.; Jelić, D.; Dojder, A.; Čepelak, I.; Rumora, L. Extracellular Hsp70 induces inflammation and modulates LPS/LTA-stimulated inflammatory response in THP-1 cells. Cell Stress Chaperones 2018, 23, 373–384. [Google Scholar] [CrossRef] [PubMed]
  8. Tukaj, S. Heat shock protein 70 as a double agent acting inside and outside the cell: Insights into autoimmunity. Int. J. Mol. Sci. 2020, 21, 5298. [Google Scholar] [CrossRef] [PubMed]
  9. Yang, S.; Xiao, H.; Cao, L. Recent advances in heat shock proteins in cancer diagnosis, prognosis, metabolism and treatment. Biomed. Pharmacother. 2021, 142, 112074. [Google Scholar] [CrossRef]
  10. Cheeseman, M.D.; Westwood, I.M.; Barbeau, O.; Rowlands, M.; Dobson, S.; Jones, A.M.; Jeganathan, F.; Burke, R.; Kadi, N.; Workman, P.; et al. Exploiting protein conformational change to optimize adenosine-derived inhibitors of HSP70. J. Med. Chem. 2016, 59, 4625–4636. [Google Scholar] [CrossRef] [PubMed]
  11. Bezerra, D.P.; Pessoa, C.; de Moraes, M.O.; Saker-Neto, N.; Silveira, E.R.; Costa-Lotufo, L.V. Overview of the therapeutic potential of piplartine (piperlongumine). Eur. J. Pharm. Sci. 2013, 48, 453–463. [Google Scholar] [CrossRef]
  12. Adams, D.J.; Dai, M.; Pellegrino, G.; Wagner, B.K.; Stern, A.M.; Shamji, A.F.; Schreiber, S.L. Synthesis, cellular evaluation, and mechanism of action of piperlongumine analogs. Proc. Natl. Acad. Sci. USA 2012, 109, 15115–15120. [Google Scholar] [CrossRef] [Green Version]
  13. Piska, K.; Gunia-Krzyżak, A.; Koczurkiewicz, P.; Wójcik-Pszczoła, K.; Pękala, E. Piperlongumine (piplartine) as a lead compound for anticancer agents—Synthesis and properties of analogues: A mini-review. Eur. J. Med. Chem. 2018, 156, 13–20. [Google Scholar] [CrossRef]
  14. Wu, Y.; Min, X.; Zhuang, C.; Li, J.; Yu, Z.; Dong, G.; Yao, J.; Wang, S.; Liu, Y.; Wu, S.; et al. Design, synthesis and biological activity of piperlongumine derivatives as selective anticancer agents. Eur. J. Med. Chem. 2014, 82, 545–551. [Google Scholar] [CrossRef] [PubMed]
  15. Prasad, S.; Tyagi, A.K. Historical spice as a future drug: Therapeutic potential of piperlongumine. Curr. Pharm. Des. 2016, 22, 4151–4159. [Google Scholar] [CrossRef] [PubMed]
  16. Zazeri, G.; Povinelli, A.P.R.; Le Duff, C.S.; Tang, B.; Cornelio, M.L.; Jones, A.M. Synthesis and spectroscopic analysis of piperine-and piperlongumine-inspired natural product scaffolds and their molecular docking with IL-1β and NF-κB proteins. Molecules 2020, 25, 2841. [Google Scholar] [CrossRef]
  17. Sun, L.-D.; Wang, F.; Dai, F.; Wang, Y.-H.; Lin, D.; Zhou, B. Development and mechanism investigation of a new piperlongumine derivative as a potent anti-inflammatory agent. Biochem. Pharmacol. 2015, 95, 156–169. [Google Scholar] [CrossRef]
  18. Zheng, J.; Son, D.J.; Gu, S.M.; Woo, J.R.; Ham, Y.W.; Lee, H.P.; Kim, W.J.; Jung, J.K.; Hong, J.T. Piperlongumine inhibits lung tumor growth via inhibition of nuclear factor kappa B signaling pathway. Sci. Rep. 2016, 6, 26357. [Google Scholar] [CrossRef]
  19. Ginzburg, S.; Golovine, K.V.; Makhov, P.B.; Uzzo, R.G.; Kutikov, A.; Kolenko, V.M. Piperlongumine inhibits NF-κB activity and attenuates aggressive growth characteristics of prostate cancer cells. Prostate 2014, 74, 177–186. [Google Scholar] [CrossRef] [Green Version]
  20. Si, D.; Wang, Y.; Zhou, Y.-H.; Guo, Y.; Wang, J.; Zhou, H.; Li, Z.-S.; Fawcett, J.P. Mechanism of CYP2C9 inhibition by flavones and flavonols. Drug Metab. Dispos. 2009, 37, 629–634. [Google Scholar] [CrossRef] [PubMed] [Green Version]
  21. Gu, S.M.; Lee, H.P.; Ham, Y.W.; Son, D.J.; Kim, H.Y.; Oh, K.W.; Han, S.-B.; Yun, J.; Hong, J.T. Piperlongumine improves lipopolysaccharide-induced amyloidogenesis by suppressing NF-KappaB pathway. Neuromol. Med. 2018, 20, 312–327. [Google Scholar] [CrossRef] [Green Version]
  22. Lakowicz, J.R. Principles of Fluorescence Spectroscopy; Springer: Berlin/Heidelberg, Germany, 2004; Available online: https://www.academia.edu/34533342/Principles_of_Fluorescence_Spectroscopy_Third_Edition (accessed on 6 December 2021).
  23. Lakowicz, J.R.; Weber, G. Quenching of fluorescence by oxygen. Probe for structural fluctuations in macromolecules. Biochemistry 1973, 12, 4161–4170. [Google Scholar] [CrossRef] [PubMed]
  24. Povinelli, A.P.R.; Zazeri, G.; Cornélio, M.L. Molecular Mechanism of Flavonoids Using Fluorescence Spectroscopy and Computational Tools. In Flavonoids A Coloring Model for Cheering Up Life; IntechOpen: London, UK, 2019. [Google Scholar]
  25. Caruso, Í.P.; Vilegas, W.; de Oliveira, L.C.; Cornélio, M.L. Fluorescence spectroscopic and dynamics simulation studies on isoorientin binding with human serum albumin. Spectrochim. Acta Part A Mol. Biomol. Spectrosc. 2020, 228, 117738. [Google Scholar] [CrossRef]
  26. Ross, P.D.; Subramanian, S. Thermodynamics of protein association reactions: Forces contributing to stability. Biochemistry 1981, 20, 3096–3102. [Google Scholar] [CrossRef] [PubMed]
  27. Lohman, T.M.; Bujalowski, W. Thermodynamic methods for model-independent determination of equilibrium binding isotherms for protein-DNA interactions: Spectroscopic approaches to monitor binding. Methods Enzymol. 1991, 208, 258–290. [Google Scholar]
  28. Scatchard, G. The attractions of proteins for small molecules and ions. Ann. N. Y. Acad. Sci. 1949, 51, 660–672. [Google Scholar] [CrossRef]
  29. Zazeri, G.; Povinelli, A.P.R.; de Freitas Lima, M.; Cornélio, M.L. Detailed Characterization of the Cooperative Binding of Piperine with Heat Shock Protein 70 by Molecular Biophysical Approaches. Biomedicines 2020, 8, 629. [Google Scholar] [CrossRef]
  30. Bordbar, A.K.; Saboury, A.A.; Moosavi-Movahedi, A.A. The shapes of Scatchard plots for systems with two sets of binding sites. Biochem. Educ. 1996, 24, 172–175. [Google Scholar] [CrossRef]
  31. Zazeri, G.; Povinelli, P.A.; de Freitas Lima, M.; Cornélio, L.M. Experimental Approaches and Computational Modeling of Rat Serum Albumin and Its Interaction with Piperine. Int. J. Mol. Sci. 2019, 20, 2856. [Google Scholar] [CrossRef] [Green Version]
  32. Montgomery, D.; Jordan, R.; McMacken, R.; Freire, E. Thermodynamic and structural analysis of the folding/unfolding transitions of the Escherichia coli molecular chaperone DnaK. J. Mol. Biol. 1993, 232, 680–692. [Google Scholar] [CrossRef] [PubMed]
  33. Palleros, D.R.; Reid, K.L.; McCarty, J.S.; Walker, G.C.; Fink, A.L. DnaK, hsp73, and their molten globules. Two different ways heat shock proteins respond to heat. J. Biol. Chem. 1992, 267, 5279–5285. [Google Scholar] [CrossRef]
  34. Zazeri, G.; Povinelli, A.P.R.; de Freitas Lima, M.; Cornélio, M.L. The Cytokine IL-1β and Piperine Complex Surveyed by Experimental and Computational Molecular Biophysics. Biomolecules 2020, 10, 1337. [Google Scholar] [CrossRef] [PubMed]
  35. Povinelli, A.P.R.; Zazeri, G.; de Freitas Lima, M.; Cornélio, M.L. Details of the cooperative binding of piperlongumine with rat serum albumin obtained by spectroscopic and computational analyses. Sci. Rep. 2019, 9, 15667. [Google Scholar] [CrossRef] [PubMed] [Green Version]
  36. Sreerama, N.; Woody, R.W. Estimation of protein secondary structure from circular dichroism spectra: Comparison of CONTIN, SELCON, and CDSSTR methods with an expanded reference set. Anal. Biochem. 2000, 287, 252–260. [Google Scholar] [CrossRef] [PubMed]
  37. Morris, G.M.; Huey, R.; Lindstrom, W.; Sanner, M.F.; Belew, R.K.; Goodsell, D.S.; Olson, A.J. AutoDock4 and AutoDockTools4: Automated docking with selective receptor flexibility. J. Comput. Chem. 2009, 30, 2785–2791. [Google Scholar] [CrossRef] [Green Version]
  38. Morris, G.M.; Goodsell, D.S.; Pique, M.E.; Lindstrom, W.; Huey, R.; Forli, S.; Hart, W.E.; Halliday, S.; Belew, R.; Olson, A.J. User Guide AutoDock Version 4.2. Automated Docking of Flexible Ligands to Flexible Receptors. 2010. Available online: https://autodock.scripps.edu/wp-content/uploads/sites/56/2021/10/AutoDock4.2.6_UserGuide.pdf (accessed on 6 December 2021).
  39. Humphrey, W.; Dalke, A.; Schulten, K. VMD: Visual molecular dynamics. J. Mol. Graph. 1996, 14, 33–38. [Google Scholar] [CrossRef]
  40. Wallace, A.C.; Laskowski, R.A.; Thornton, J.M. LIGPLOT: A program to generate schematic diagrams of protein-ligand interactions. Protein Eng. Des. Sel. 1995, 8, 127–134. [Google Scholar] [CrossRef]
  41. Oostenbrink, C.; Villa, A.; Mark, A.E.; Van Gunsteren, W.F. A biomolecular force field based on the free enthalpy of hydration and solvation: The GROMOS force-field parameter sets 53A5 and 53A6. J. Comput. Chem. 2004, 25, 1656–1676. [Google Scholar] [CrossRef]
  42. Van Der Spoel, D.; Lindahl, E.; Hess, B.; Groenhof, G.; Mark, A.E.; Berendsen, H.J.C. GROMACS: Fast, flexible, and free. J. Comput. Chem. 2005, 26, 1701–1718. [Google Scholar] [CrossRef]
  43. Wu, Y.; Tepper, H.L.; Voth, G.A. Flexible simple point-charge water model with improved liquid-state properties. J. Chem. Phys. 2006, 124, 24503. [Google Scholar] [CrossRef]
  44. Batcho, P.F.; Case, D.A.; Schlick, T. Optimized particle-mesh Ewald/multiple-time step integration for molecular dynamics simulations. J. Chem. Phys. 2001, 115, 4003–4018. [Google Scholar] [CrossRef] [Green Version]
  45. Bussi, G.; Donadio, D.; Parrinello, M. Canonical sampling through velocity rescaling. J. Chem. Phys. 2007, 126, 14101. [Google Scholar] [CrossRef] [Green Version]
  46. Hess, B.; Bekker, H.; Berendsen, H.J.C.; Fraaije, J.G.E.M. LINCS: A linear constraint solver for molecular simulations. J. Comput. Chem. 1997, 18, 1463–1472. [Google Scholar] [CrossRef]
  47. Parrinello, M.; Rahman, A. Polymorphic transitions in single crystals: A new molecular dynamics method. J. Appl. Phys. 1981, 52, 7182–7190. [Google Scholar] [CrossRef]
  48. Kumari, R.; Kumar, R.; Consortium, O.S.D.D.; Lynn, A. g_mmpbsa—A GROMACS tool for high-throughput MM-PBSA calculations. J. Chem. Inf. Model. 2014, 54, 1951–1962. [Google Scholar] [CrossRef] [PubMed]
Figure 1. NBD fluorescence emission spectra obtained from titration experiments with increments in the concentration of PPL (pH 7.4, T = 283 K, λexcitation = 295 nm). [NBD] = 4.0 μM; PPL titrations with increments of −1.0 μM (a → y = 0 μM → 24 μM). Inset: Chemical structure of PPL.
Pharmaceuticals 14 01298 g001
Figure 2. Left ordinate: Stern–Volmer plots at three temperatures, 283 K, 293 K, and 303 K. Right ordinate: Time-resolved fluorescence lifetime plot at 293 K; [NBD] = 4.0 μM, [PPL] = 0–24.0 μM. PPL was added to the sample in increments of 1.0 μM.
Pharmaceuticals 14 01298 g002
Figure 3. Double-log plots for the fluorescence quenching of NBD (4.0 μM) by the presence of PPL at 283 K, 293 K, and 303 K.
Pharmaceuticals 14 01298 g003
Figure 4. Van’t Hoff plot for the complex NBD-PPL at 283 K, 293 K, and 303 K.
Pharmaceuticals 14 01298 g004
Figure 5. Plot of ∆F versus Log [PPL] obtained from PPL titration experiments with NBD concentrations of 6.0 μM and 8.0 μM at 293 K.
Pharmaceuticals 14 01298 g005
Figure 6. (a) Scatchard plot for the interaction of NBD and PPL obtained at 293 K based on IDF data. (b) Hill’s plot for the interaction of NBD and PPL.
Pharmaceuticals 14 01298 g006
Figure 7. Denaturation curve of NBD monitored at 222 nm with a melting temperature of 314 K. (a) The plot shows the ellipticity [θ] versus temperature and (b) The plot shows the fraction folded calculated with Equation (12).
Pharmaceuticals 14 01298 g007
Figure 8. Circular Dichroism of free NBD (solid lines) and NBD + PPL at the stoichiometry 1:12 (dotted lines) at 293 K.
Pharmaceuticals 14 01298 g008
Figure 9. Bind sites of NBD accessed by PPL: (a) NBD structure with PPL in Site 1 (red) and in Site 2 (green), in this picture ADP molecule is represented in black. (b) The amino acids composition of Site 1 and the interactions between PPL and NBD, where one hydrogen bond was found between Gly339 and PPL (blue dashed line). (c) The amino acids composition of Site 2 and the interactions between PPL and NBD, where one hydrogen bond was found between Gln93 and PPL (blue dashed line).
Pharmaceuticals 14 01298 g009
Figure 10. Parameters obtained from the molecular dynamics simulation of the NBD (black), NBD with PPL in Site 1 (red) and Site 2 (green). Top Left: The RMSD of (a) protein NBD and (b) molecule PPL. Top Right: Distance between COG of NBD and COG of PPL in Sites 1 and 2. Bottom Left: The RMSF of the residues of (a) NBD, (b) NBD when interacting with PPL in Site 1 and (c) NBD when interacting with PPL in Site 2. Bottom Right: The hydrogen bonds performed between NBD and PPL in (a) Site 1 and (b) Site 2.
Pharmaceuticals 14 01298 g010
Figure 11. Energy decomposition obtained by MMPBSA for the interactions of NBD with PPL for Site 1 and 2. Contributions of Van der Waals (VDW), electrostatic, polar solvation (P.Solvation), and solvent accessible area (SASA) to the final binding energy (Binding).
Pharmaceuticals 14 01298 g011
Table 1. Stern–Volmer constant (KSV), bimolecular constants (kq) and binding constant (Ka) for the complex NBD and PPL at 283, 293 and 303 K.
T (K)KSV (×104 M−1)Kq (×1012 M−1·s−1)Ka (×104 M−1)
2831.9 ± 0.18.9 ± 0.12.5 ± 0.8
2931.5 ± 0.16.9 ± 0.12.2 ± 0.5
3031.0 ± 0.14.3 ± 0.11.8 ± 0.2
Table 2. Thermodynamic parameters of the complex NBD-PPL at the temperatures of 283, 293 and 303 K.
T (K)G (kJ·mol−1)H (kJ·mol−1)S (J·mol−1·K-1)T·∆S (kJ·mol−1)
283−23.7 ± 1.3−11.9 ± 0.942.4 ± 3.411.9 ± 0.9
293−24.2 ± 1.312.4 ± 0.9
303−24.6 ± 1.312.8 ± 1.0
Table 3. The characteristics of amino acids that compose the microenvironment of Sites 1 and 2 obtained by molecular docking.
Binding SitesAmino Acids
Non-PolarPositively ChargedNegatively ChargedPolar
1Gly12, 202, 230, 338, 339Lys271; Arg272, 342Asp10, 366Tyr15; Thr37; Ser340
2Val94, 105; Met87; Pro91; Trp90; Phe92Lys88-Asn65; Gln64; 93, 104; Ser106
Publisher’s Note: MDPI stays neutral with regard to jurisdictional claims in published maps and institutional affiliations.

