Repurposing Clinical Agents for Chemical Exchange Saturation Transfer Magnetic Resonance Imaging: Current Status and Future Perspectives


Abstract
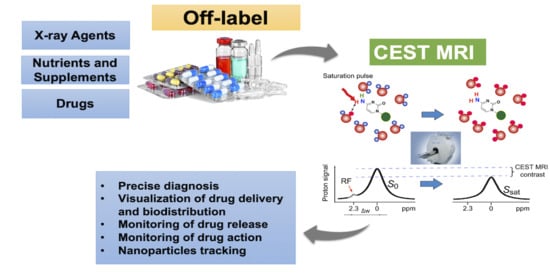
1. Introduction
2. Basics of CEST MRI
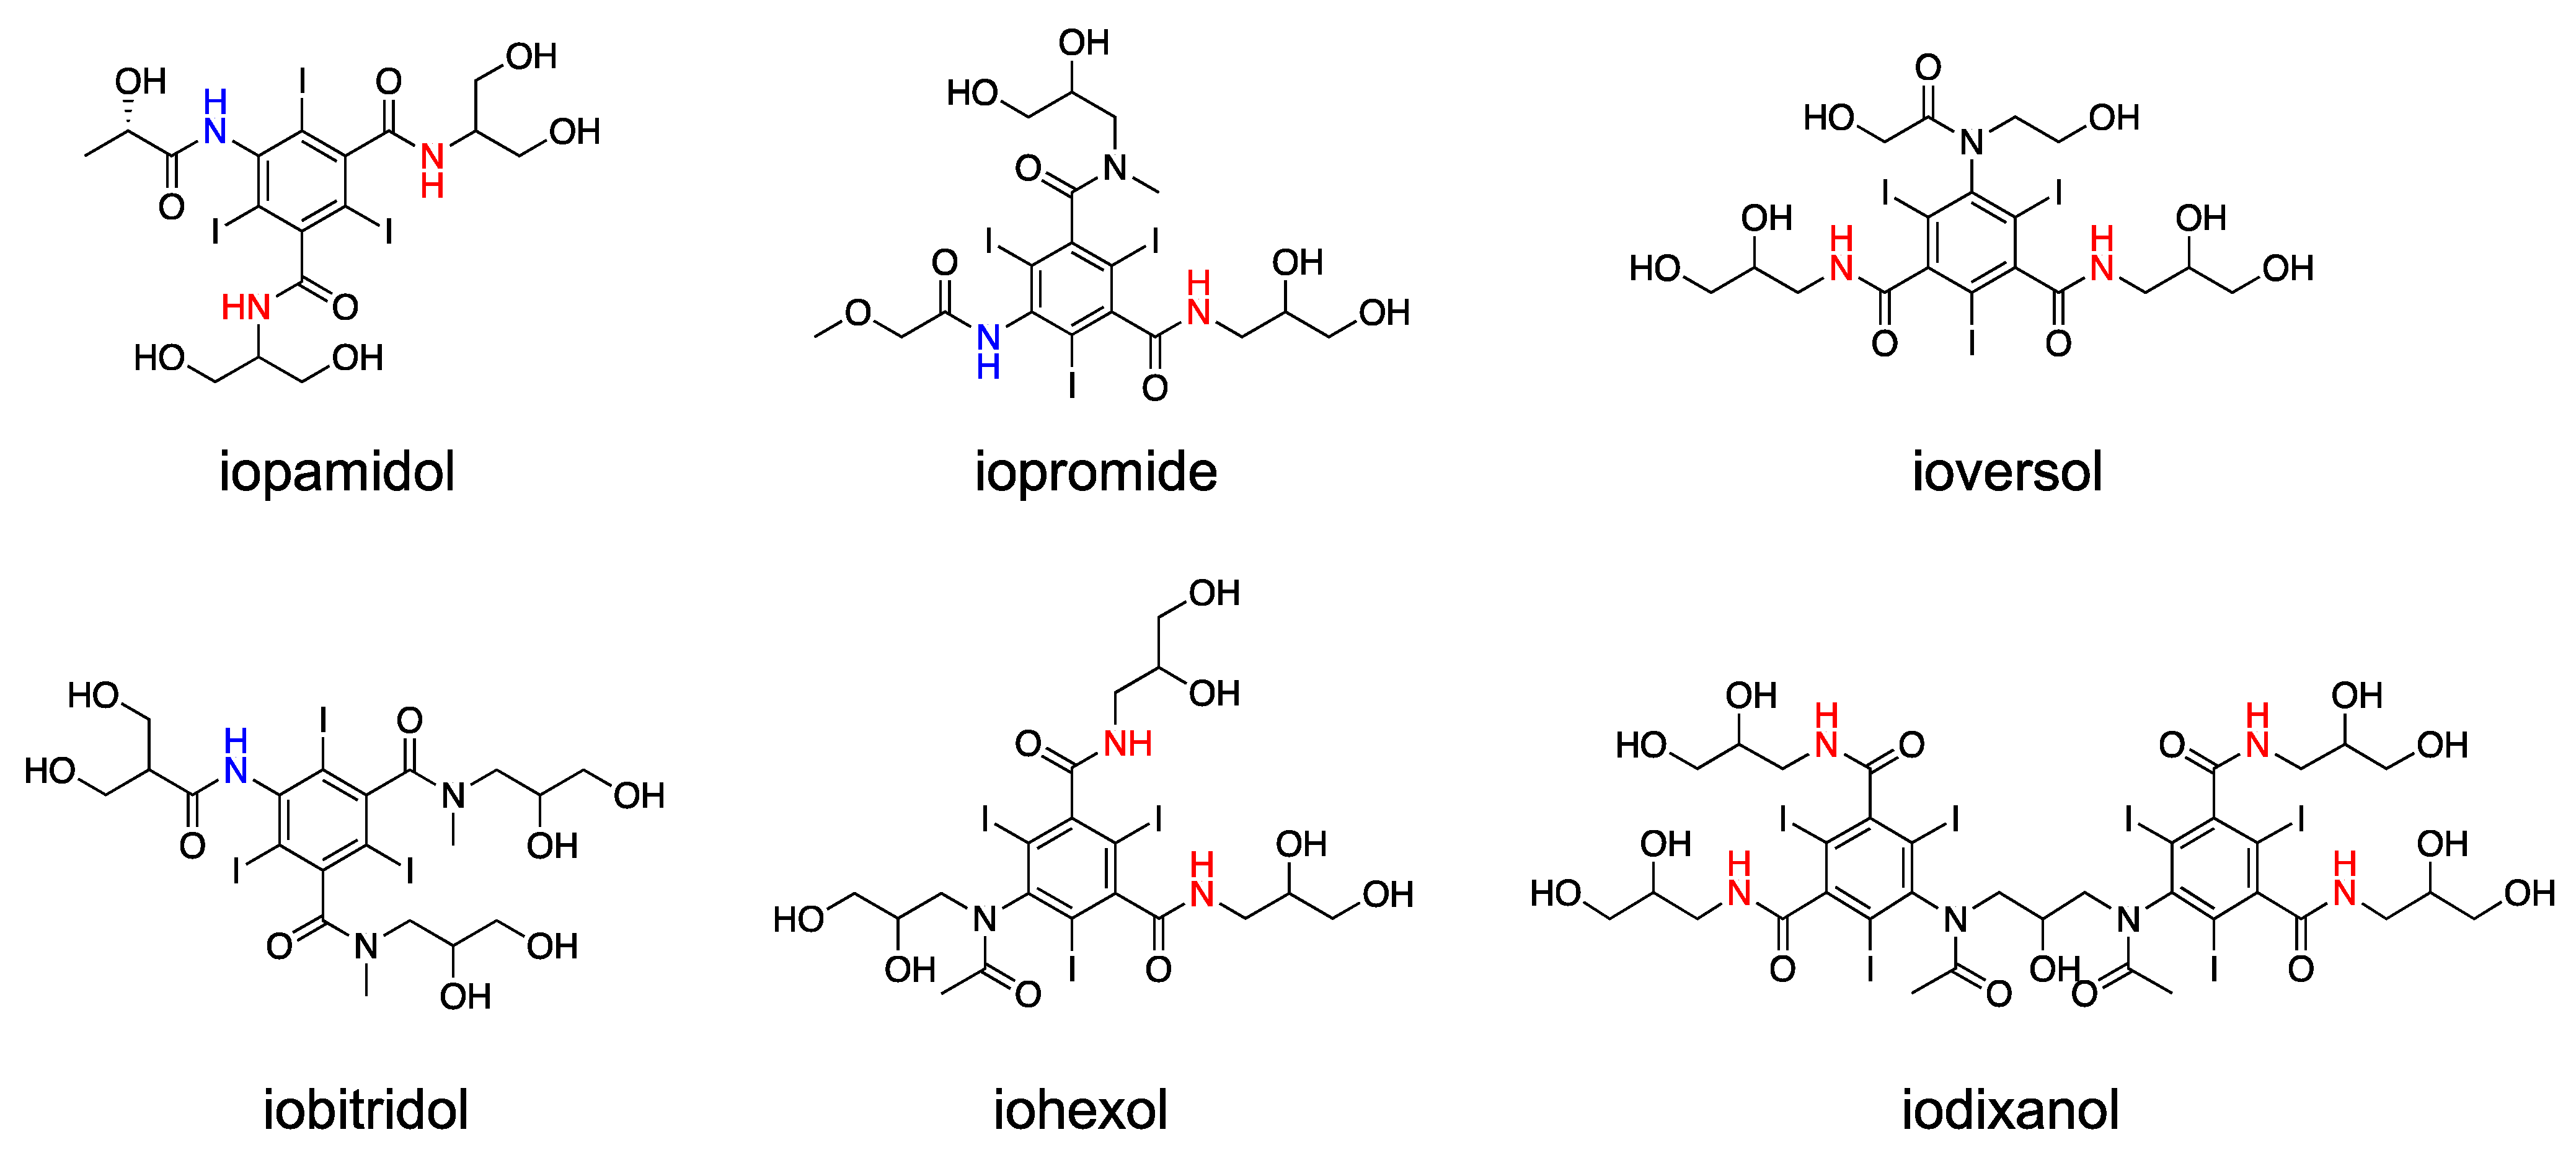
3. Clinical X-Ray Agents for CEST MRI
4. Nutrients and Supplements for CEST MRI
4.1. Glucose and Its Derivatives
4.2. Pharmaceutical Excipients
4.3. Biopolymers
4.4. Biologically Active Molecules and Metabolites
5. Clinical Drugs for CEST MRI
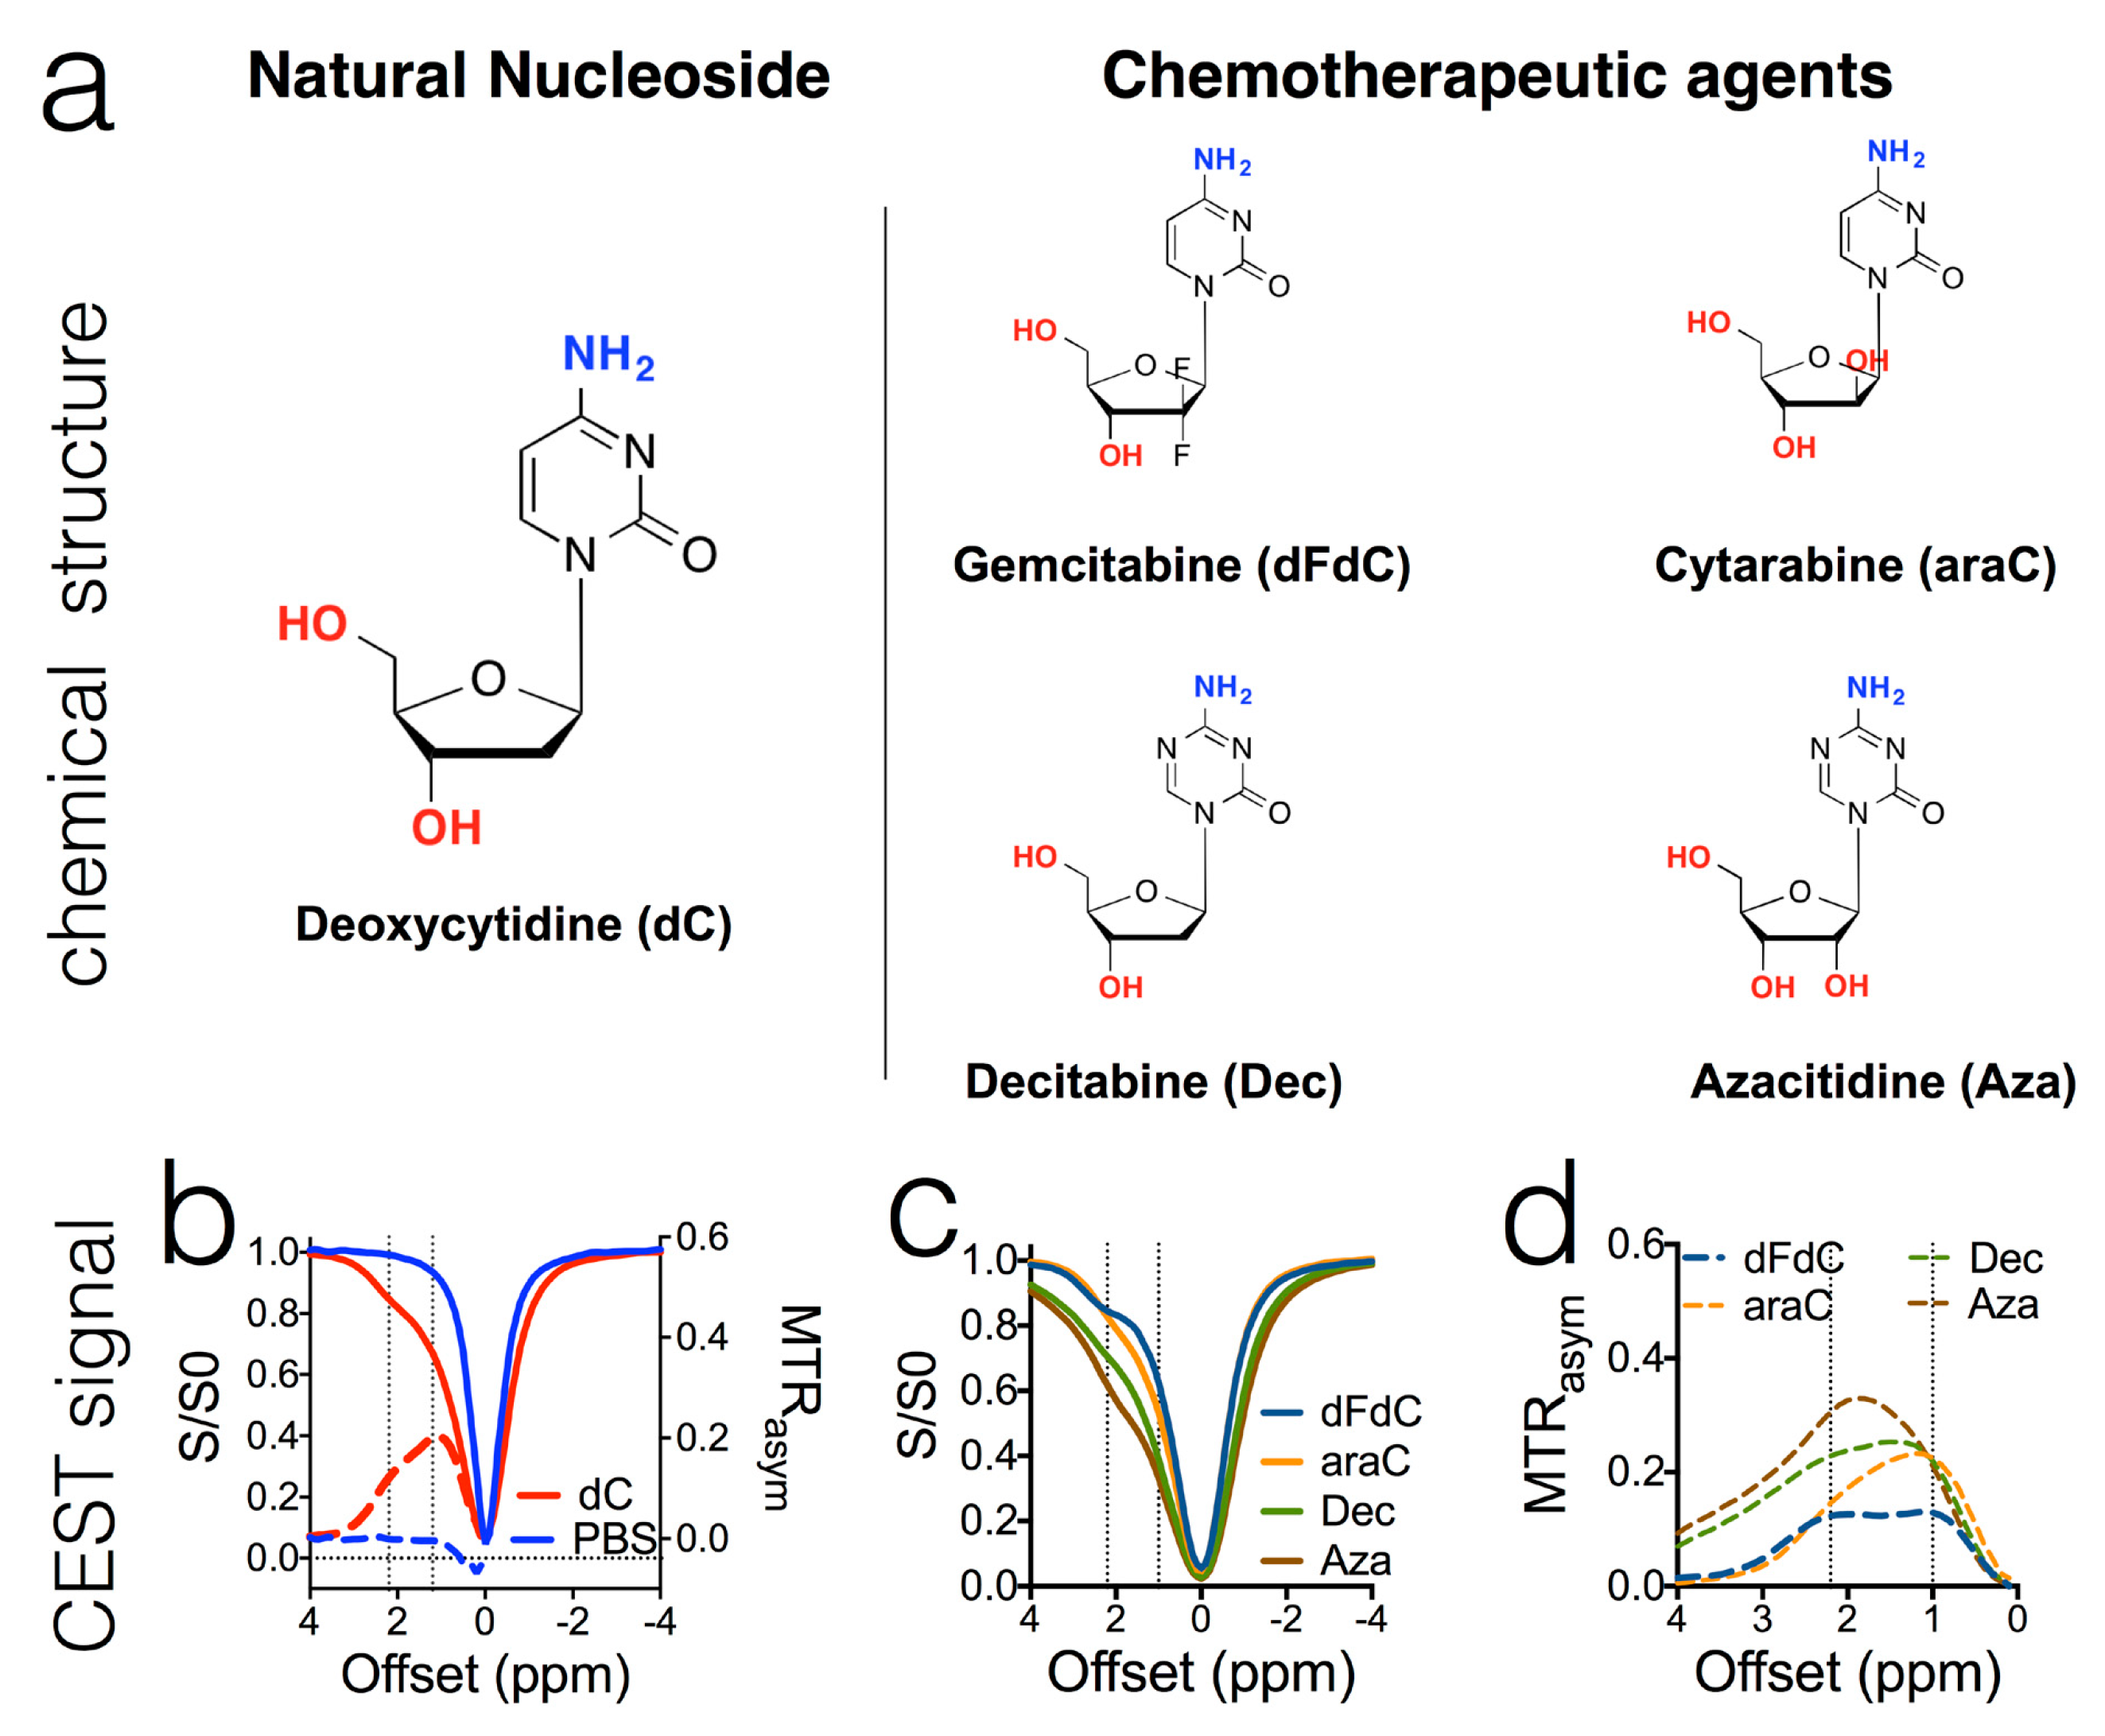
5.1. Anticancer Drugs
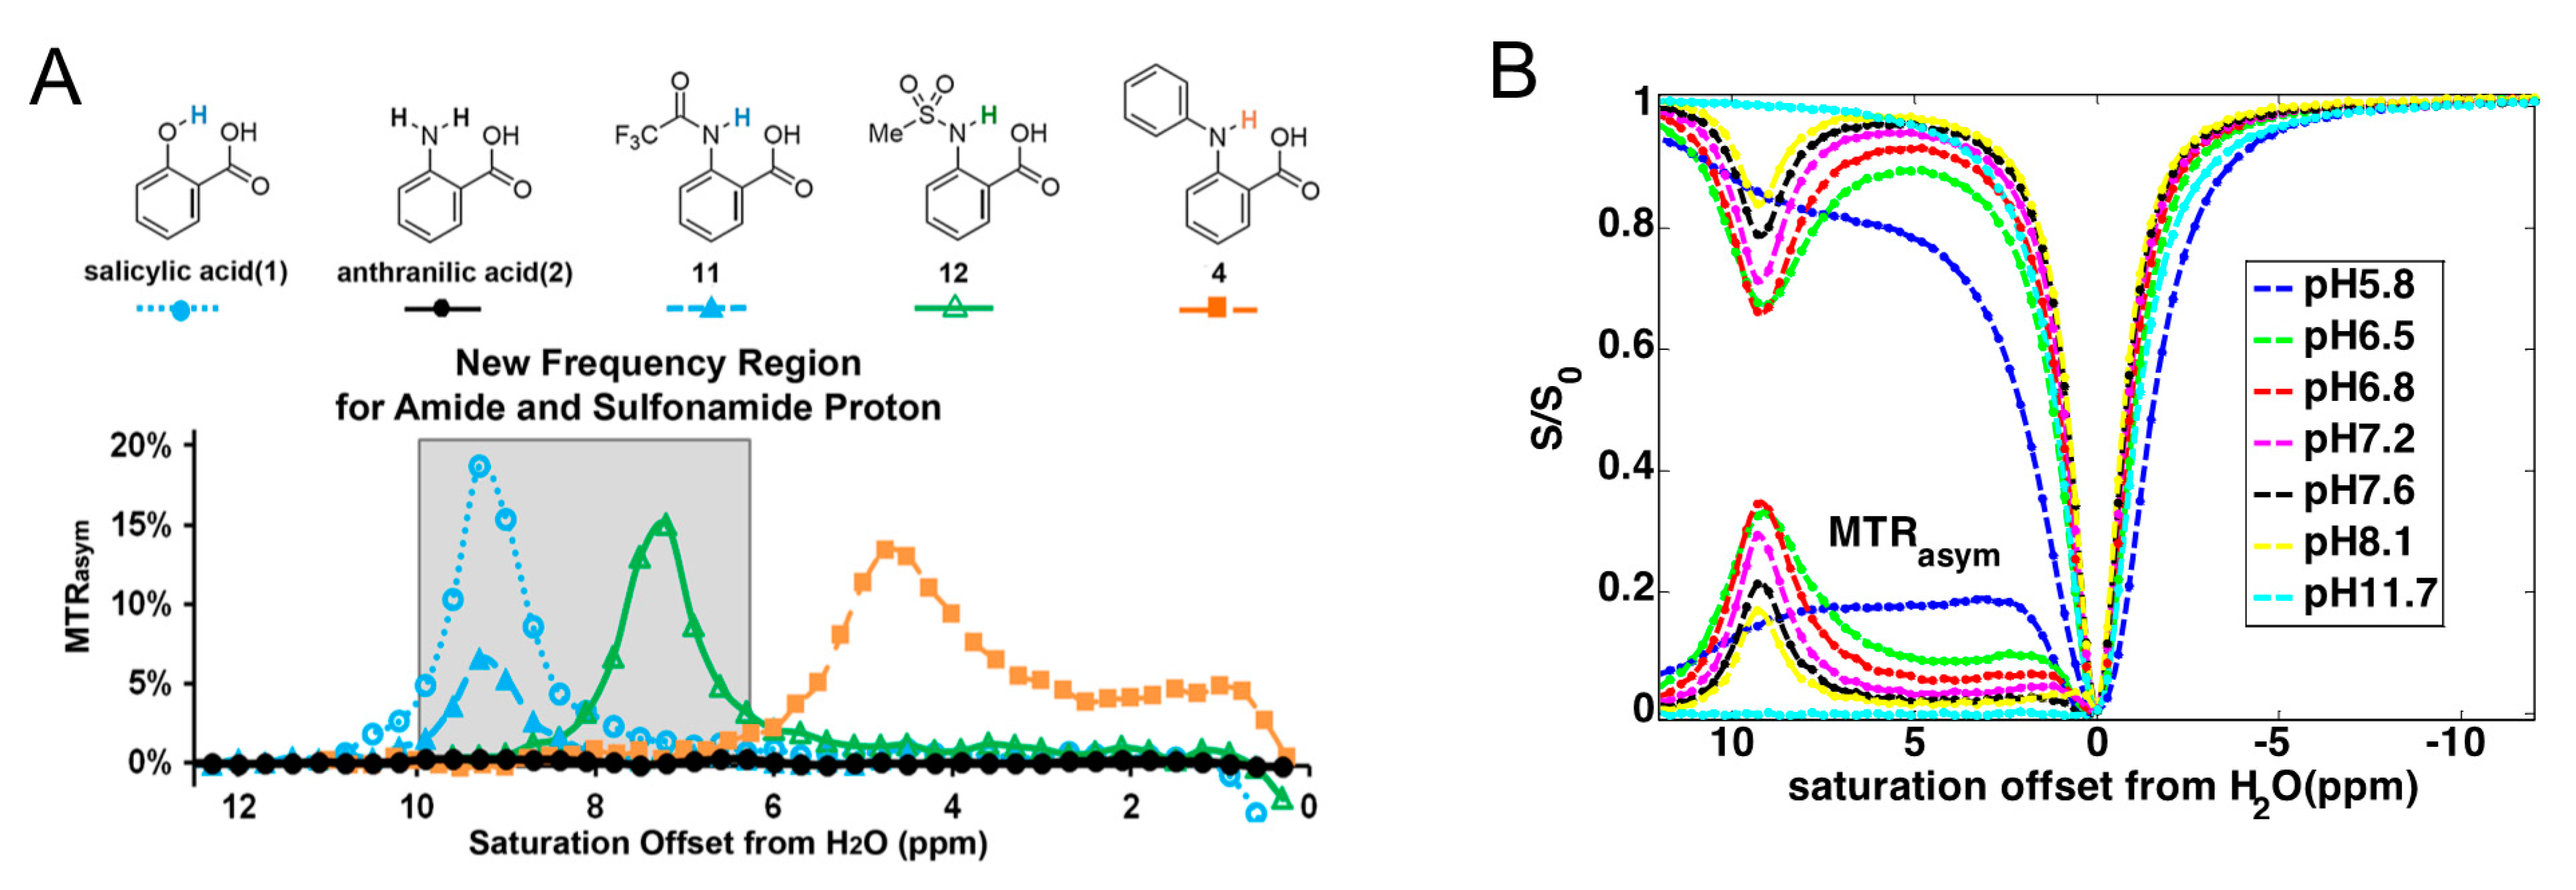
5.2. Anti-Inflammation Drugs
5.3. Drugs for Neurodegenerative Diseases and Cardiovascular Diseases
6. Technical Hurdles and Possible Development that Will Ease the CEST MRI Detection and Translation
7. Conclusions
Author Contributions
Funding
Conflicts of Interest
References
- Ward, K.M.; Aletras, A.H.; Balaban, R.S. A new class of contrast agents for MRI based on proton chemical exchange dependent saturation transfer (CEST). J. Magn. Reson. 2000, 143, 79–87. [Google Scholar] [CrossRef]
- Guivel-Scharen, V.; Sinnwell, T.; Wolff, S.D.; Balaban, R.S. Detection of proton chemical exchange between metabolites and water in biological tissues. J. Magn. Reson. 1998, 133, 36–45. [Google Scholar] [CrossRef]
- Mori, S.; Abeygunawardana, C.; van Zijl, P.C.; Berg, J.M. Water exchange filter with improved sensitivity (WEX II) to study solvent-exchangeable protons. Application to the consensus zinc finger peptide CP-1. J. Magn. Reson. B 1996, 110, 96–101. [Google Scholar] [CrossRef]
- Mori, S.; Johnson, M.O.N.; Berg, J.M.; van Zijl, P.C.M. Water Exchange Filter (WEX Filter) for Nuclear Magnetic Resonance Studies of Macromolecules. J. Am. Chem. Soc. 1994, 116, 11982–11984. [Google Scholar] [CrossRef]
- Zhou, J.; Payen, J.F.; Wilson, D.A.; Traystman, R.J.; van Zijl, P.C. Using the amide proton signals of intracellular proteins and peptides to detect pH effects in MRI. Nat. Med. 2003, 9, 1085–1090. [Google Scholar] [CrossRef]
- Zhou, J.; Yan, K.; Zhu, H. A simple model for understanding the origin of the amide proton transfer MRI signal in tissue. Appl. Magn. Reson. 2012, 42, 393–402. [Google Scholar] [CrossRef] [PubMed]
- van Zijl, P.C.; Zhou, J.; Mori, N.; Payen, J.F.; Wilson, D.; Mori, S. Mechanism of magnetization transfer during on-resonance water saturation. A new approach to detect mobile proteins, peptides, and lipids. Magn. Reson. Med. 2003, 49, 440–449. [Google Scholar] [CrossRef]
- Schure, J.R.; Shrestha, M.; Breuer, S.; Deichmann, R.; Hattingen, E.; Wagner, M.; Pilatus, U. The pH sensitivity of APT-CEST using phosphorus spectroscopy as a reference method. NMR Biomed. 2019, 32, e4125. [Google Scholar] [CrossRef]
- Zhou, J.; Wilson, D.A.; Sun, P.Z.; Klaus, J.A.; Van Zijl, P.C. Quantitative description of proton exchange processes between water and endogenous and exogenous agents for WEX, CEST, and APT experiments. Magn. Reson. Med. 2004, 51, 945–952. [Google Scholar] [CrossRef]
- Sun, P.Z.; Zhou, J.; Sun, W.; Huang, J.; van Zijl, P.C. Detection of the ischemic penumbra using pH-weighted MRI. J. Cereb. Blood Flow Metab. 2007, 27, 1129–1136. [Google Scholar] [CrossRef] [PubMed]
- Leigh, R.; Knutsson, L.; Zhou, J.; van Zijl, P.C. Imaging the physiological evolution of the ischemic penumbra in acute ischemic stroke. J. Cereb. Blood Flow Metab. 2018, 38, 1500–1516. [Google Scholar] [CrossRef] [PubMed]
- McVicar, N.; Li, A.X.; Goncalves, D.F.; Bellyou, M.; Meakin, S.O.; Prado, M.A.; Bartha, R. Quantitative tissue pH measurement during cerebral ischemia using amine and amide concentration-independent detection (AACID) with MRI. J. Cereb. Blood Flow Metab. 2014, 34, 690–698. [Google Scholar] [CrossRef]
- Tietze, A.; Blicher, J.; Mikkelsen, I.K.; Ostergaard, L.; Strother, M.K.; Smith, S.A.; Donahue, M.J. Assessment of ischemic penumbra in patients with hyperacute stroke using amide proton transfer (APT) chemical exchange saturation transfer (CEST) MRI. NMR Biomed. 2014, 27, 163–174. [Google Scholar] [CrossRef] [PubMed]
- Wang, E.; Wu, Y.; Cheung, J.S.; Zhou, I.Y.; Igarashi, T.; Zhang, X.; Sun, P.Z. pH imaging reveals worsened tissue acidification in diffusion kurtosis lesion than the kurtosis/diffusion lesion mismatch in an animal model of acute stroke. J. Cereb. Blood Flow Metab. 2017, 37, 3325–3333. [Google Scholar] [CrossRef] [PubMed]
- Zhou, J.; van Zijl, P.C. Defining an Acidosis-Based Ischemic Penumbra from pH-Weighted MRI. Transl. Stroke Res. 2011, 3, 76–83. [Google Scholar] [CrossRef] [PubMed]
- Cai, K.; Haris, M.; Singh, A.; Kogan, F.; Greenberg, J.H.; Hariharan, H.; Detre, J.A.; Reddy, R. Magnetic resonance imaging of glutamate. Nat. Med. 2012, 18, 302–306. [Google Scholar] [CrossRef] [PubMed]
- Haris, M.; Nath, K.; Cai, K.; Singh, A.; Crescenzi, R.; Kogan, F.; Verma, G.; Reddy, S.; Hariharan, H.; Melhem, E.R.; et al. Imaging of glutamate neurotransmitter alterations in Alzheimer’s disease. NMR Biomed. 2013, 26, 386–391. [Google Scholar] [CrossRef]
- Pepin, J.; Francelle, L.; Carrillo-de Sauvage, M.A.; de Longprez, L.; Gipchtein, P.; Cambon, K.; Valette, J.; Brouillet, E.; Flament, J. In vivo imaging of brain glutamate defects in a knock-in mouse model of Huntington’s disease. Neuroimage 2016, 139, 53–64. [Google Scholar] [CrossRef]
- Bagga, P.; Crescenzi, R.; Krishnamoorthy, G.; Verma, G.; Nanga, R.P.; Reddy, D.; Greenberg, J.; Detre, J.A.; Hariharan, H.; Reddy, R. Mapping the alterations in glutamate with GluCEST MRI in a mouse model of dopamine deficiency. J. Neurochem. 2016, 139, 432–439. [Google Scholar] [CrossRef]
- Ling, W.; Regatte, R.R.; Navon, G.; Jerschow, A. Assessment of glycosaminoglycan concentration in vivo by chemical exchange-dependent saturation transfer (gagCEST). Proc. Natl. Acad. Sci. USA 2008, 105, 2266–2270. [Google Scholar] [CrossRef]
- Singh, A.; Haris, M.; Cai, K.; Kassey, V.B.; Kogan, F.; Reddy, D.; Hariharan, H.; Reddy, R. Chemical exchange saturation transfer magnetic resonance imaging of human knee cartilage at 3 T and 7 T. Magn. Reson. Med. 2012, 68, 588–594. [Google Scholar] [CrossRef]
- Juras, V.; Winhofer, Y.; Szomolanyi, P.; Vosshenrich, J.; Hager, B.; Wolf, P.; Weber, M.; Luger, A.; Trattnig, S. Multiparametric MR Imaging Depicts Glycosaminoglycan Change in the Achilles Tendon during Ciprofloxacin Administration in Healthy Men: Initial Observation. Radiology 2015, 275, 763–771. [Google Scholar] [CrossRef] [PubMed]
- Deng, M.; Yuan, J.; Chen, W.T.; Chan, Q.; Griffith, J.F.; Wang, Y.X. Evaluation of Glycosaminoglycan in the Lumbar Disc Using Chemical Exchange Saturation Transfer MR at 3.0 Tesla: Reproducibility and Correlation with Disc Degeneration. Biomed. Environ. Sci. 2016, 29, 47–55. [Google Scholar] [PubMed]
- Liu, J.; Han, Z.; Chen, G.; Li, Y.; Zhang, J.; Xu, J.; van Zijl, P.C.M.; Zhang, S.; Liu, G. CEST MRI of sepsis-induced acute kidney injury. NMR Biomed. 2018, 31, e3942. [Google Scholar] [CrossRef] [PubMed]
- Wang, F.; Takahashi, K.; Li, H.; Zu, Z.; Li, K.; Xu, J.; Harris, R.C.; Takahashi, T.; Gore, J.C. Assessment of unilateral ureter obstruction with multi-parametric MRI. Magn. Reson. Med. 2018, 79, 2216–2227. [Google Scholar] [CrossRef]
- Wang, F.; Kopylov, D.; Zu, Z.; Takahashi, K.; Wang, S.; Quarles, C.C.; Gore, J.C.; Harris, R.C.; Takahashi, T. Mapping murine diabetic kidney disease using chemical exchange saturation transfer MRI. Magn. Reson. Med. 2016, 76, 1531–1541. [Google Scholar] [CrossRef]
- Zhou, J.; Heo, H.Y.; Knutsson, L.; van Zijl, P.C.M.; Jiang, S. APT-weighted MRI: Techniques, current neuro applications, and challenging issues. J. Magn. Reson. Imaging 2019, 50, 347–364. [Google Scholar] [CrossRef]
- Goldenberg, J.M.; Pagel, M.D. Assessments of tumor metabolism with CEST MRI. NMR Biomed. 2019, 32, e3943. [Google Scholar] [CrossRef]
- van Zijl, P.C.; Yadav, N.N. Chemical exchange saturation transfer (CEST): What is in a name and what isn’t? Magn. Reson. Med. 2011, 65, 927–948. [Google Scholar] [CrossRef]
- Kogan, F.; Hariharan, H.; Reddy, R. Chemical Exchange Saturation Transfer (CEST) Imaging: Description of Technique and Potential Clinical Applications. Curr. Radiol. Rep. 2013, 1, 102–114. [Google Scholar] [CrossRef]
- Goffeney, N.; Bulte, J.W.; Duyn, J.; Bryant, L.H., Jr.; van Zijl, P.C. Sensitive NMR detection of cationic-polymer-based gene delivery systems using saturation transfer via proton exchange. J. Am. Chem. Soc. 2001, 123, 8628–8629. [Google Scholar] [CrossRef] [PubMed]
- Dorazio, S.J.; Olatunde, A.O.; Tsitovich, P.B.; Morrow, J.R. Comparison of divalent transition metal ion paraCEST MRI contrast agents. J. Biol. Inorg. Chem. 2014, 19, 191–205. [Google Scholar] [CrossRef] [PubMed]
- Hancu, I.; Dixon, W.T.; Woods, M.; Vinogradov, E.; Sherry, A.D.; Lenkinski, R.E. CEST and PARACEST MR contrast agents. Acta Radiol. 2010, 51, 910–923. [Google Scholar] [CrossRef] [PubMed]
- Ferrauto, G.; Delli Castelli, D.; Di Gregorio, E.; Terreno, E.; Aime, S. LipoCEST and cellCEST imaging agents: Opportunities and challenges. Wiley Interdiscip. Rev. Nanomed. Nanobiotechnol. 2016, 8, 602–618. [Google Scholar] [CrossRef] [PubMed]
- Jayapaul, J.; Schroder, L. Nanoparticle-Based Contrast Agents for (129)Xe HyperCEST NMR and MRI Applications. Contrast Media Mol. Imaging 2019, 2019, 9498173. [Google Scholar] [CrossRef]
- Zeng, Q.; Bie, B.; Guo, Q.; Yuan, Y.; Han, Q.; Han, X.; Chen, M.; Zhang, X.; Yang, Y.; Liu, M.; et al. Hyperpolarized Xe NMR signal advancement by metal-organic framework entrapment in aqueous solution. Proc. Natl. Acad. Sci. USA 2020, 117, 17558–17563. [Google Scholar] [CrossRef]
- Forsén, S.; Hoffman, R.A. Study of moderately rapid chemical exchange reactions by means of nuclear magnetic double resonance. J. Chem. Phys. 1963, 39, 2892. [Google Scholar] [CrossRef]
- Swanson, S.D. Protein mediated magnetic coupling between lactate and water protons. J. Magn. Reson. 1998, 135, 248–255. [Google Scholar] [CrossRef]
- Mori, S.; Eleff, S.M.; Pilatus, U.; Mori, N.; van Zijl, P.C. Proton NMR spectroscopy of solvent-saturable resonances: A new approach to study pH effects in situ. Magn. Reson. Med. 1998, 40, 36–42. [Google Scholar] [CrossRef]
- Liepinsh, E.; Otting, G. Proton exchange rates from amino acid side chains--implications for image contrast. Magn. Reson. Med. 1996, 35, 30–42. [Google Scholar] [CrossRef]
- Ryoo, D.; Xu, X.; Li, Y.; Tang, J.A.; Zhang, J.; van Zijl, P.C.M.; Liu, G. Detection and Quantification of Hydrogen Peroxide in Aqueous Solutions Using Chemical Exchange Saturation Transfer. Anal. Chem. 2017, 89, 7758–7764. [Google Scholar] [CrossRef] [PubMed]
- Zaiss, M.; Anemone, A.; Goerke, S.; Longo, D.L.; Herz, K.; Pohmann, R.; Aime, S.; Rivlin, M.; Navon, G.; Golay, X.; et al. Quantification of hydroxyl exchange of D-Glucose at physiological conditions for optimization of glucoCEST MRI at 3, 7 and 9.4 Tesla. NMR Biomed. 2019, 32, e4113. [Google Scholar] [CrossRef] [PubMed]
- van Zijl, P.C.M.; Lam, W.W.; Xu, J.; Knutsson, L.; Stanisz, G.J. Magnetization Transfer Contrast and Chemical Exchange Saturation Transfer MRI. Features and analysis of the field-dependent saturation spectrum. Neuroimage 2018, 168, 222–241. [Google Scholar] [CrossRef] [PubMed]
- Khlebnikov, V.; van der Kemp, W.J.M.; Hoogduin, H.; Klomp, D.W.J.; Prompers, J.J. Analysis of chemical exchange saturation transfer contributions from brain metabolites to the Z-spectra at various field strengths and pH. Sci. Rep. 2019, 9, 1089. [Google Scholar] [CrossRef] [PubMed]
- Zaiss, M.; Xu, J.; Goerke, S.; Khan, I.S.; Singer, R.J.; Gore, J.C.; Gochberg, D.F.; Bachert, P. Inverse Z-spectrum analysis for spillover-, MT-, and T1 -corrected steady-state pulsed CEST-MRI--application to pH-weighted MRI of acute stroke. NMR Biomed. 2014, 27, 240–252. [Google Scholar] [CrossRef] [PubMed]
- Sun, P.Z.; Murata, Y.; Lu, J.; Wang, X.; Lo, E.H.; Sorensen, A.G. Relaxation-compensated fast multislice amide proton transfer (APT) imaging of acute ischemic stroke. Magn. Reson. Med. 2008, 59, 1175–1182. [Google Scholar] [CrossRef] [PubMed]
- Sun, P.Z.; van Zijl, P.C.; Zhou, J. Optimization of the irradiation power in chemical exchange dependent saturation transfer experiments. J. Magn. Reson. 2005, 175, 193–200. [Google Scholar] [CrossRef]
- Liu, G.; Song, X.; Chan, K.W.; McMahon, M.T. Nuts and bolts of chemical exchange saturation transfer MRI. NMR Biomed. 2013, 26, 810–828. [Google Scholar] [CrossRef]
- Woessner, D.E.; Zhang, S.; Merritt, M.E.; Sherry, A.D. Numerical solution of the Bloch equations provides insights into the optimum design of PARACEST agents for MRI. Magn. Reson. Med. 2005, 53, 790–799. [Google Scholar] [CrossRef]
- Zaiss, M.; Bachert, P. Chemical exchange saturation transfer (CEST) and MR Z-spectroscopy in vivo: A review of theoretical approaches and methods. Phys. Med. Biol. 2013, 58, R221–R269. [Google Scholar] [CrossRef]
- van Zijl, P.; Knutsson, L. In vivo magnetic resonance imaging and spectroscopy. Technological advances and opportunities for applications continue to abound. J. Magn. Reson. 2019, 306, 55–65. [Google Scholar] [CrossRef] [PubMed]
- Han, Z.; Liu, G. Sugar-based biopolymers as novel imaging agents for molecular magnetic resonance imaging. Wiley Interdiscip. Rev. Nanomed. Nanobiotechnol. 2019, 11, e1551. [Google Scholar] [CrossRef] [PubMed]
- Chen, L.Q.; Howison, C.M.; Jeffery, J.J.; Robey, I.F.; Kuo, P.H.; Pagel, M.D. Evaluations of extracellular pH within in vivo tumors using acidoCEST MRI. Magn. Reson. Med. 2014, 72, 1408–1417. [Google Scholar] [CrossRef] [PubMed]
- Longo, D.L.; Sun, P.Z.; Consolino, L.; Michelotti, F.C.; Uggeri, F.; Aime, S. A general MRI-CEST ratiometric approach for pH imaging: Demonstration of in vivo pH mapping with iobitridol. J. Am. Chem. Soc. 2014, 136, 14333–14336. [Google Scholar] [CrossRef]
- Moon, B.F.; Jones, K.M.; Chen, L.Q.; Liu, P.; Randtke, E.A.; Howison, C.M.; Pagel, M.D. A comparison of iopromide and iopamidol, two acidoCEST MRI contrast media that measure tumor extracellular pH. Contrast Media Mol. Imaging 2015, 10, 446–455. [Google Scholar] [CrossRef]
- Lock, L.L.; Li, Y.; Mao, X.; Chen, H.; Staedtke, V.; Bai, R.; Ma, W.; Lin, R.; Li, Y.; Liu, G.; et al. One-Component Supramolecular Filament Hydrogels as Theranostic Label-Free Magnetic Resonance Imaging Agents. ACS Nano 2017, 11, 797–805. [Google Scholar] [CrossRef]
- Ngen, E.J.; Bar-Shir, A.; Jablonska, A.; Liu, G.; Song, X.; Ansari, R.; Bulte, J.W.; Janowski, M.; Pearl, M.; Walczak, P.; et al. Imaging the DNA Alkylator Melphalan by CEST MRI: An Advanced Approach to Theranostics. Mol. Pharm. 2016, 13, 3043–3053. [Google Scholar] [CrossRef]
- Liu, H.; Jablonska, A.; Li, Y.; Cao, S.; Liu, D.; Chen, H.; Van Zijl, P.C.; Bulte, J.W.; Janowski, M.; Walczak, P.; et al. Label-free CEST MRI Detection of Citicoline-Liposome Drug Delivery in Ischemic Stroke. Theranostics 2016, 6, 1588–1600. [Google Scholar] [CrossRef]
- Li, Y.; Chen, H.; Xu, J.; Yadav, N.N.; Chan, K.W.; Luo, L.; McMahon, M.T.; Vogelstein, B.; van Zijl, P.C.; Zhou, S.; et al. CEST theranostics: Label-free MR imaging of anticancer drugs. Oncotarget 2016, 7, 6369–6378. [Google Scholar] [CrossRef]
- Walker-Samuel, S.; Ramasawmy, R.; Torrealdea, F.; Rega, M.; Rajkumar, V.; Johnson, S.P.; Richardson, S.; Goncalves, M.; Parkes, H.G.; Arstad, E.; et al. In vivo imaging of glucose uptake and metabolism in tumors. Nat. Med. 2013, 19, 1067–1072. [Google Scholar] [CrossRef]
- Chan, K.W.; McMahon, M.T.; Kato, Y.; Liu, G.; Bulte, J.W.; Bhujwalla, Z.M.; Artemov, D.; van Zijl, P.C. Natural D-glucose as a biodegradable MRI contrast agent for detecting cancer. Magn. Reson. Med. 2012, 68, 1764–1773. [Google Scholar] [CrossRef] [PubMed]
- Liu, G.; Moake, M.; Har-el, Y.E.; Long, C.M.; Chan, K.W.; Cardona, A.; Jamil, M.; Walczak, P.; Gilad, A.A.; Sgouros, G.; et al. In vivo multicolor molecular MR imaging using diamagnetic chemical exchange saturation transfer liposomes. Magn. Reson. Med. 2012, 67, 1106–1113. [Google Scholar] [CrossRef] [PubMed]
- Haris, M.; Singh, A.; Mohammed, I.; Ittyerah, R.; Nath, K.; Nanga, R.P.; Debrosse, C.; Kogan, F.; Cai, K.; Poptani, H.; et al. In vivo magnetic resonance imaging of tumor protease activity. Sci. Rep. 2014, 4, 6081. [Google Scholar] [CrossRef] [PubMed]
- Zhang, S.; Merritt, M.; Woessner, D.E.; Lenkinski, R.E.; Sherry, A.D. PARACEST agents: Modulating MRI contrast via water proton exchange. Acc. Chem. Res. 2003, 36, 783–790. [Google Scholar] [CrossRef] [PubMed]
- Aime, S.; Carrera, C.; Delli Castelli, D.; Geninatti Crich, S.; Terreno, E. Tunable imaging of cells labeled with MRI-PARACEST agents. Angew. Chem. Int. Ed. 2005, 44, 1813–1815. [Google Scholar] [CrossRef] [PubMed]
- Chang, N.; Kaufman, S.; Milstien, S. The mechanism of the irreversible inhibition ofrat liver phenylalanine hydroxylase due to treatment with p-chlorophenylalanine. The lack of effect on turnover of phenylalanine hydroxylase. J. Biol. Chem. 1979, 254, 2665–2668. [Google Scholar] [PubMed]
- Gilad, A.A.; van Laarhoven, H.W.; McMahon, M.T.; Walczak, P.; Heerschap, A.; Neeman, M.; van Zijl, P.C.; Bulte, J.W. Feasibility of concurrent dual contrast enhancement using CEST contrast agents and superparamagnetic iron oxide particles. Magn. Reson. Med. 2009, 61, 970–974. [Google Scholar] [CrossRef]
- McMahon, M.T.; Gilad, A.A.; DeLiso, M.A.; Berman, S.M.; Bulte, J.W.; van Zijl, P.C. New “multicolor” polypeptide diamagnetic chemical exchange saturation transfer (DIACEST) contrast agents for MRI. Magn. Reson. Med. 2008, 60, 803–812. [Google Scholar] [CrossRef] [PubMed]
- Klippel, S.; Freund, C.; Schroder, L. Multichannel MRI labeling of mammalian cells by switchable nanocarriers for hyperpolarized xenon. Nano Lett. 2014, 14, 5721–5726. [Google Scholar] [CrossRef]
- Xu, X.; Chan, K.W.; Knutsson, L.; Artemov, D.; Xu, J.; Liu, G.; Kato, Y.; Lal, B.; Laterra, J.; McMahon, M.T.; et al. Dynamic glucose enhanced (DGE) MRI for combined imaging of blood-brain barrier break down and increased blood volume in brain cancer. Magn. Reson. Med. 2015, 74, 1556–1563. [Google Scholar] [CrossRef]
- Rivlin, M.; Navon, G. CEST MRI of 3-O-methyl-D-glucose on different breast cancer models. Magn. Reson. Med. 2018, 79, 1061–1069. [Google Scholar] [CrossRef]
- Rivlin, M.; Tsarfaty, I.; Navon, G. Functional molecular imaging of tumors by chemical exchange saturation transfer MRI of 3-O-Methyl-D-glucose. Magn. Reson. Med. 2014, 72, 1375–1380. [Google Scholar] [CrossRef]
- Sehgal, A.A.; Li, Y.; Lal, B.; Yadav, N.N.; Xu, X.; Xu, J.; Laterra, J.; van Zijl, P.C.M. CEST MRI of 3-O-methyl-D-glucose uptake and accumulation in brain tumors. Magn. Reson. Med. 2019, 81, 1993–2000. [Google Scholar] [CrossRef] [PubMed]
- Jin, T.; Mehrens, H.; Wang, P.; Kim, S.G. Glucose metabolism-weighted imaging with chemical exchange-sensitive MRI of 2-deoxyglucose (2DG) in brain: Sensitivity and biological sources. Neuroimage 2016, 143, 82–90. [Google Scholar] [CrossRef]
- Nasrallah, F.A.; Pages, G.; Kuchel, P.W.; Golay, X.; Chuang, K.H. Imaging brain deoxyglucose uptake and metabolism by glucoCEST MRI. J. Cereb. Blood Flow Metab. 2013, 33, 1270–1278. [Google Scholar] [CrossRef] [PubMed]
- Rivlin, M.; Horev, J.; Tsarfaty, I.; Navon, G. Molecular imaging of tumors and metastases using chemical exchange saturation transfer (CEST) MRI. Sci. Rep. 2013, 3, 3045. [Google Scholar] [CrossRef] [PubMed]
- Li, Y.; Qiao, Y.; Chen, H.; Bai, R.; Staedtke, V.; Han, Z.; Xu, J.; Chan, K.W.Y.; Yadav, N.; Bulte, J.W.M.; et al. Characterization of tumor vascular permeability using natural dextrans and CEST MRI. Magn. Reson. Med. 2018, 79, 1001–1009. [Google Scholar] [CrossRef] [PubMed]
- Liu, G.; Banerjee, S.R.; Yang, X.; Yadav, N.; Lisok, A.; Jablonska, A.; Xu, J.; Li, Y.; Pomper, M.G.; van Zijl, P. A dextran-based probe for the targeted magnetic resonance imaging of tumours expressing prostate-specific membrane antigen. Nat. Biomed. Eng. 2017, 1, 977–982. [Google Scholar] [CrossRef] [PubMed]
- Bagga, P.; Haris, M.; D’Aquilla, K.; Wilson, N.E.; Marincola, F.M.; Schnall, M.D.; Hariharan, H.; Reddy, R. Non-caloric sweetener provides magnetic resonance imaging contrast for cancer detection. J. Transl. Med. 2017, 15, 119. [Google Scholar] [CrossRef]
- Longo, D.L.; Moustaghfir, F.Z.; Zerbo, A.; Consolino, L.; Anemone, A.; Bracesco, M.; Aime, S. EXCI-CEST: Exploiting pharmaceutical excipients as MRI-CEST contrast agents for tumor imaging. Int. J. Pharm. 2017, 525, 275–281. [Google Scholar] [CrossRef]
- Rivlin, M.; Navon, G. Glucosamine and N-acetyl glucosamine as new CEST MRI agents for molecular imaging of tumors. Sci. Rep. 2016, 6, 32648. [Google Scholar] [CrossRef] [PubMed]
- Zhang, J.; Li, Y.; Slania, S.; Yadav, N.N.; Liu, J.; Wang, R.; Zhang, J.; Pomper, M.G.; van Zijl, P.C.; Yang, X.; et al. Phenols as Diamagnetic T2 -Exchange Magnetic Resonance Imaging Contrast Agents. Chemistry 2018, 24, 1259–1263. [Google Scholar] [CrossRef] [PubMed]
- McMahon, M.T.; Gilad, A.A.; Zhou, J.; Sun, P.Z.; Bulte, J.W.; van Zijl, P.C. Quantifying exchange rates in chemical exchange saturation transfer agents using the saturation time and saturation power dependencies of the magnetization transfer effect on the magnetic resonance imaging signal (QUEST and QUESP): Ph calibration for poly-L-lysine and a starburst dendrimer. Magn. Reson. Med. 2006, 55, 836–847. [Google Scholar] [PubMed]
- Longo, D.L.; Dastru, W.; Digilio, G.; Keupp, J.; Langereis, S.; Lanzardo, S.; Prestigio, S.; Steinbach, O.; Terreno, E.; Uggeri, F.; et al. Iopamidol as a responsive MRI-chemical exchange saturation transfer contrast agent for pH mapping of kidneys: In vivo studies in mice at 7 T. Magn. Reson. Med. 2011, 65, 202–211. [Google Scholar] [CrossRef]
- Chan, K.W.; Liu, G.; Song, X.; Kim, H.; Yu, T.; Arifin, D.R.; Gilad, A.A.; Hanes, J.; Walczak, P.; van Zijl, P.C.; et al. MRI-detectable pH nanosensors incorporated into hydrogels for in vivo sensing of transplanted-cell viability. Nat. Mater. 2013, 12, 268–275. [Google Scholar] [CrossRef]
- Bar-Shir, A.; Liu, G.; Chan, K.W.; Oskolkov, N.; Song, X.; Yadav, N.N.; Walczak, P.; McMahon, M.T.; van Zijl, P.C.; Bulte, J.W.; et al. Human protamine-1 as an MRI reporter gene based on chemical exchange. ACS Chem. Biol. 2014, 9, 134–138. [Google Scholar] [CrossRef]
- Liu, G.; Liang, Y.; Bar-Shir, A.; Chan, K.W.; Galpoththawela, C.S.; Bernard, S.M.; Tse, T.; Yadav, N.N.; Walczak, P.; McMahon, M.T.; et al. Monitoring enzyme activity using a diamagnetic chemical exchange saturation transfer magnetic resonance imaging contrast agent. J. Am. Chem. Soc. 2011, 133, 16326–16329. [Google Scholar] [CrossRef] [PubMed]
- Jin, T.; Wang, P.; Zong, X.; Kim, S.G. Magnetic resonance imaging of the Amine-Proton EXchange (APEX) dependent contrast. Neuroimage 2012, 59, 1218–1227. [Google Scholar] [CrossRef] [PubMed]
- Bar-Shir, A.; Liu, G.; Liang, Y.; Yadav, N.N.; McMahon, M.T.; Walczak, P.; Nimmagadda, S.; Pomper, M.G.; Tallman, K.A.; Greenberg, M.M.; et al. Transforming thymidine into a magnetic resonance imaging probe for monitoring gene expression. J. Am. Chem. Soc. 2013, 135, 1617–1624. [Google Scholar] [CrossRef] [PubMed]
- Snoussi, K.; Bulte, J.W.; Gueron, M.; van Zijl, P.C. Sensitive CEST agents based on nucleic acid imino proton exchange: Detection of poly(rU) and of a dendrimer-poly(rU) model for nucleic acid delivery and pharmacology. Magn. Reson. Med. 2003, 49, 998–1005. [Google Scholar] [CrossRef] [PubMed]
- Yang, X.; Song, X.; Li, Y.; Liu, G.; Banerjee, S.R.; Pomper, M.G.; McMahon, M.T. Salicylic acid and analogues as diaCEST MRI contrast agents with highly shifted exchangeable proton frequencies. Angew. Chem. Int. Ed. Engl. 2013, 52, 8116–8119. [Google Scholar] [CrossRef] [PubMed]
- Yang, X.; Song, X.; Ray Banerjee, S.; Li, Y.; Byun, Y.; Liu, G.; Bhujwalla, Z.M.; Pomper, M.G.; McMahon, M.T. Developing imidazoles as CEST MRI pH sensors. Contrast Media Mol. Imaging 2016, 11, 304–312. [Google Scholar] [CrossRef] [PubMed]
- Jones, C.K.; Huang, A.; Xu, J.; Edden, R.A.; Schär, M.; Hua, J.; Oskolkov, N.; Zacà, D.; Zhou, J.; McMahon, M.T. Nuclear Overhauser enhancement (NOE) imaging in the human brain at 7T. Neuroimage 2013, 77, 114–124. [Google Scholar] [CrossRef] [PubMed]
- Zhang, X.-Y.; Wang, F.; Afzal, A.; Xu, J.; Gore, J.C.; Gochberg, D.F.; Zu, Z. A new NOE-mediated MT signal at around−1.6 ppm for detecting ischemic stroke in rat brain. Magn. Reson. Imaging 2016, 34, 1100–1106. [Google Scholar] [CrossRef]
- Daryaei, I.; Pagel, M.D. Double agents and secret agents: The emerging fields of exogenous chemical exchange saturation transfer and T2-exchange magnetic resonance imaging contrast agents for molecular imaging. Res. Rep. Nucl. Med. 2015, 5, 19–32. [Google Scholar]
- Aime, S.; Nano, R.; Grandi, M. A new class of contrast agents for magnetic resonance imaging based on selective reduction of water-T2 by chemical exchange. Investig. Radiol. 1988, 23 (Suppl. 1), S267–S270. [Google Scholar]
- Aime, S.; Calabi, L.; Biondi, L.; De Miranda, M.; Ghelli, S.; Paleari, L.; Rebaudengo, C.; Terreno, E. Iopamidol: Exploring the potential use of a well-established x-ray contrast agent for MRI. Magn. Reson. Med. 2005, 53, 830–834. [Google Scholar] [CrossRef]
- Sinharay, S.; Randtke, E.A.; Howison, C.M.; Ignatenko, N.A.; Pagel, M.D. Detection of Enzyme Activity and Inhibition during Studies in Solution, In Vitro and In Vivo with CatalyCEST MRI. Mol. Imaging Biol. 2018, 20, 240–248. [Google Scholar] [CrossRef]
- Chen, Z.; Li, Y.; Airan, R.; Han, Z.; Xu, J.; Chan, K.W.Y.; Xu, Y.; Bulte, J.W.M.; van Zijl, P.C.M.; McMahon, M.T.; et al. CT and CEST MRI bimodal imaging of the intratumoral distribution of iodinated liposomes. Quant. Imaging Med. Surg. 2019, 9, 1579–1591. [Google Scholar] [CrossRef]
- Longo, D.L.; Michelotti, F.; Consolino, L.; Bardini, P.; Digilio, G.; Xiao, G.; Sun, P.Z.; Aime, S. In Vitro and In Vivo Assessment of Nonionic Iodinated Radiographic Molecules as Chemical Exchange Saturation Transfer Magnetic Resonance Imaging Tumor Perfusion Agents. Investig. Radiol. 2016, 51, 155–162. [Google Scholar] [CrossRef]
- Anemone, A.; Consolino, L.; Longo, D.L. MRI-CEST assessment of tumour perfusion using X-ray iodinated agents: Comparison with a conventional Gd-based agent. Eur. Radiol. 2017, 27, 2170–2179. [Google Scholar] [CrossRef] [PubMed]
- Pavuluri, K.; Manoli, I.; Pass, A.; Li, Y.; Vernon, H.J.; Venditti, C.P.; McMahon, M.T. Noninvasive monitoring of chronic kidney disease using pH and perfusion imaging. Sci. Adv. 2019, 5, eaaw8357. [Google Scholar] [CrossRef] [PubMed]
- Minhas, A.S.; Sharkey, J.; Randtke, E.A.; Murray, P.; Wilm, B.; Pagel, M.D.; Poptani, H. Measuring Kidney Perfusion, pH, and Renal Clearance Consecutively Using MRI and Multispectral Optoacoustic Tomography. Mol. Imaging Biol. 2020, 22, 494–503. [Google Scholar] [CrossRef] [PubMed]
- Longo, D.L.; Busato, A.; Lanzardo, S.; Antico, F.; Aime, S. Imaging the pH evolution of an acute kidney injury model by means of iopamidol, a MRI-CEST pH-responsive contrast agent. Magn. Reson. Med. 2013, 70, 859–864. [Google Scholar] [CrossRef] [PubMed]
- Longo, D.L.; Bartoli, A.; Consolino, L.; Bardini, P.; Arena, F.; Schwaiger, M.; Aime, S. In Vivo Imaging of Tumor Metabolism and Acidosis by Combining PET and MRI-CEST pH Imaging. Cancer Res. 2016, 76, 6463–6470. [Google Scholar] [CrossRef]
- Akhenblit, P.J.; Hanke, N.T.; Gill, A.; Persky, D.O.; Howison, C.M.; Pagel, M.D.; Baker, A.F. Assessing Metabolic Changes in Response to mTOR Inhibition in a Mantle Cell Lymphoma Xenograft Model Using AcidoCEST MRI. Mol. Imaging 2016, 15, 1–10. [Google Scholar] [CrossRef]
- Anemone, A.; Consolino, L.; Conti, L.; Reineri, F.; Cavallo, F.; Aime, S.; Longo, D.L. In vivo evaluation of tumour acidosis for assessing the early metabolic response and onset of resistance to dichloroacetate by using magnetic resonance pH imaging. Int. J. Oncol. 2017, 51, 498–506. [Google Scholar] [CrossRef]
- Jones, K.M.; Randtke, E.A.; Yoshimaru, E.S.; Howison, C.M.; Chalasani, P.; Klein, R.R.; Chambers, S.K.; Kuo, P.H.; Pagel, M.D. Clinical Translation of Tumor Acidosis Measurements with AcidoCEST MRI. Mol. Imaging Biol. 2017, 19, 617–625. [Google Scholar] [CrossRef]
- High, R.A.; Ji, Y.; Ma, Y.J.; Tang, Q.; Murphy, M.E.; Du, J.; Chang, E.Y. In vivo assessment of extracellular pH of joint tissues using acidoCEST-UTE MRI. Quant. Imaging Med. Surg. 2019, 9, 1664–1673. [Google Scholar] [CrossRef]
- Jin, T.; Iordanova, B.; Hitchens, T.K.; Modo, M.; Wang, P.; Mehrens, H.; Kim, S.G. Chemical exchange-sensitive spin-lock (CESL) MRI of glucose and analogs in brain tumors. Magn. Reson. Med. 2018, 80, 488–495. [Google Scholar] [CrossRef]
- Huang, J.; van Zijl, P.C.M.; Han, X.; Dong, C.M.; Cheng, G.W.Y.; Tse, K.H.; Knutsson, L.; Chen, L.; Lai, J.H.C.; Wu, E.X.; et al. Altered d-glucose in brain parenchyma and cerebrospinal fluid of early Alzheimer’s disease detected by dynamic glucose-enhanced MRI. Sci. Adv. 2020, 6, eaba3884. [Google Scholar] [CrossRef] [PubMed]
- Kentrup, D.; Bovenkamp, P.; Busch, A.; Schuette-Nuetgen, K.; Pawelski, H.; Pavenstadt, H.; Schlatter, E.; Herrmann, K.H.; Reichenbach, J.R.; Loffler, B.; et al. GlucoCEST magnetic resonance imaging in vivo may be diagnostic of acute renal allograft rejection. Kidney Int. 2017, 92, 757–764. [Google Scholar] [CrossRef] [PubMed]
- Wu, D.; Xu, J.; Lei, J.; McLane, M.; van Zijl, P.C.; Burd, I. Dynamic glucose enhanced MRI of the placenta in a mouse model of intrauterine inflammation. Placenta 2018, 69, 86–91. [Google Scholar] [CrossRef] [PubMed]
- Xu, X.; Yadav, N.N.; Knutsson, L.; Hua, J.; Kalyani, R.; Hall, E.; Laterra, J.; Blakeley, J.; Strowd, R.; Pomper, M.; et al. Dynamic Glucose-Enhanced (DGE) MRI: Translation to Human Scanning and First Results in Glioma Patients. Tomography 2015, 1, 105–114. [Google Scholar] [PubMed]
- Herz, K.; Lindig, T.; Deshmane, A.; Schittenhelm, J.; Skardelly, M.; Bender, B.; Ernemann, U.; Scheffler, K.; Zaiss, M. T1rho-based dynamic glucose-enhanced (DGErho) MRI at 3 T: Method development and early clinical experience in the human brain. Magn. Reson. Med. 2019, 82, 1832–1847. [Google Scholar] [CrossRef] [PubMed]
- Xu, X.; Xu, J.; Chan, K.W.Y.; Liu, J.; Liu, H.; Li, Y.; Chen, L.; Liu, G.; van Zijl, P.C.M. GlucoCEST imaging with on-resonance variable delay multiple pulse (onVDMP) MRI. Magn. Reson. Med. 2019, 81, 47–56. [Google Scholar] [CrossRef]
- Xu, X.; Sehgal, A.A.; Yadav, N.N.; Laterra, J.; Blair, L.; Blakeley, J.; Seidemo, A.; Coughlin, J.M.; Pomper, M.G.; Knutsson, L.; et al. d-glucose weighted chemical exchange saturation transfer (glucoCEST)-based dynamic glucose enhanced (DGE) MRI at 3T: Early experience in healthy volunteers and brain tumor patients. Magn. Reson. Med. 2020, 84, 247–262. [Google Scholar] [CrossRef]
- Chen, H.; Liu, D.; Li, Y.; Xu, X.; Xu, J.; Yadav, N.N.; Zhou, S.; van Zijl, P.C.M.; Liu, G. CEST MRI monitoring of tumor response to vascular disrupting therapy using high molecular weight dextrans. Magn. Reson. Med. 2019, 82, 1471–1479. [Google Scholar] [CrossRef]
- Han, Z.; Zhang, S.; Fujiwara, K.; Zhang, J.; Li, Y.; Liu, J.; van Zijl, P.C.M.; Lu, Z.R.; Zheng, L.; Liu, G. Extradomain-B Fibronectin-Targeted Dextran-Based Chemical Exchange Saturation Transfer Magnetic Resonance Imaging Probe for Detecting Pancreatic Cancer. Bioconjug. Chem. 2019, 30, 1425–1433. [Google Scholar] [CrossRef]
- Rivlin, M.; Navon, G. Molecular imaging of tumors by chemical exchange saturation transfer MRI of glucose analogs. Quant. Imaging Med. Surg. 2019, 9, 1731–1746. [Google Scholar] [CrossRef]
- Jin, T.; Mehrens, H.; Wang, P.; Kim, S.G. Chemical exchange-sensitive spin-lock MRI of glucose analog 3-O-methyl-d-glucose in normal and ischemic brain. J. Cereb. Blood Flow Metab. 2018, 38, 869–880. [Google Scholar] [CrossRef] [PubMed]
- Larsen, C. Dextran prodrugs—structure and stability in relation to therapeutic activity. Adv. Drug Deliv. Rev. 1989, 3, 103–154. [Google Scholar] [CrossRef]
- Armstrong, J.K.; Wenby, R.B.; Meiselman, H.J.; Fisher, T.C. The hydrodynamic radii of macromolecules and their effect on red blood cell aggregation. Biophys. J. 2004, 87, 4259–4270. [Google Scholar] [CrossRef] [PubMed]
- Dreher, M.R.; Liu, W.; Michelich, C.R.; Dewhirst, M.W.; Yuan, F.; Chilkoti, A. Tumor vascular permeability, accumulation, and penetration of macromolecular drug carriers. J. Natl. Cancer Inst. 2006, 98, 335–344. [Google Scholar] [CrossRef]
- Chang, R.; Ueki, I.; Troy, J.; Deen, W.; Robertson, C.R.; Brenner, B. Permselectivity of the glomerular capillary wall to macromolecules. II. Experimental studies in rats using neutral dextran. Biophys. J. 1975, 15, 887. [Google Scholar] [CrossRef]
- Dubick, M.A.; Wade, C.E. A review of the efficacy and safety of 7.5% NaCl/6% dextran 70 in experimental animals and in humans. J. Trauma 1994, 36, 323–330. [Google Scholar] [CrossRef]
- Thorén, L. The dextrans—Clinical data. Dev. Biol. Stand. 1980, 48, 157–167. [Google Scholar]
- Rhee, S.G. Cell signaling. H2O2, a necessary evil for cell signaling. Science 2006, 312, 1882–1883. [Google Scholar] [CrossRef]
- Veal, E.A.; Day, A.M.; Morgan, B.A. Hydrogen peroxide sensing and signaling. Mol. Cell 2007, 26, 1–14. [Google Scholar] [CrossRef]
- Chan, K.W.; Jiang, L.; Cheng, M.; Wijnen, J.P.; Liu, G.; Huang, P.; van Zijl, P.C.; McMahon, M.T.; Glunde, K. CEST-MRI detects metabolite levels altered by breast cancer cell aggressiveness and chemotherapy response. NMR Biomed. 2016, 29, 806–816. [Google Scholar] [CrossRef] [PubMed]
- Shin, S.H.; Wendland, M.F.; Zhang, B.; Tran, A.; Tang, A.; Vandsburger, M.H. Noninvasive imaging of renal urea handling by CEST-MRI. Magn. Reson. Med. 2020, 83, 1034–1044. [Google Scholar] [CrossRef] [PubMed]
- Gigli, M.; Doglia, S.M.; Millot, J.M.; Valentini, L.; Manfait, M. Quantitative study of doxorubicin in living cell nuclei by microspectrofluorometry. Biochim. Biophys. Acta 1988, 950, 13–20. [Google Scholar] [CrossRef]
- Stevens, A.N.; Morris, P.G.; Iles, R.A.; Sheldon, P.W.; Griffiths, J.R. 5-fluorouracil metabolism monitored in vivo by 19F NMR. Br. J. Cancer 1984, 50, 113–117. [Google Scholar] [CrossRef] [PubMed]
- Yuan, Y.; Zhang, J.; Qi, X.; Li, S.; Liu, G.; Siddhanta, S.; Barman, I.; Song, X.; McMahon, M.T.; Bulte, J.W.M. Furin-mediated intracellular self-assembly of olsalazine nanoparticles for enhanced magnetic resonance imaging and tumour therapy. Nat. Mater. 2019, 18, 1376–1383. [Google Scholar] [CrossRef]
- Zhang, X.; Yuan, Y.; Li, S.; Zeng, Q.; Guo, Q.; Liu, N.; Yang, M.; Yang, Y.; Liu, M.; McMahon, M.T.; et al. Free-base porphyrins as CEST MRI contrast agents with highly upfield shifted labile protons. Magn. Reson. Med. 2019, 82, 577–585. [Google Scholar] [CrossRef]
- Song, X.; Yang, X.; Ray Banerjee, S.; Pomper, M.G.; McMahon, M.T. Anthranilic acid analogs as diamagnetic CEST MRI contrast agents that feature an intramolecular-bond shifted hydrogen. Contrast Media Mol. Imaging 2015, 10, 74–80. [Google Scholar] [CrossRef]
- Grieb, P. Neuroprotective properties of citicoline: Facts, doubts and unresolved issues. CNS Drugs 2014, 28, 185–193. [Google Scholar] [CrossRef]
- Fenniche, S.; Dhaoui, A.; Ammar, F.B.; Benmously, R.; Marrak, H.; Mokhtar, I. Acebutolol-induced subacute cutaneous lupus erythematosus. Skin Pharmacol. Physiol. 2005, 18, 230–233. [Google Scholar] [CrossRef]
- Liu, G.; Bettegowda, C.; Qiao, Y.; Staedtke, V.; Chan, K.W.; Bai, R.; Li, Y.; Riggins, G.J.; Kinzler, K.W.; Bulte, J.W.; et al. Noninvasive imaging of infection after treatment with tumor-homing bacteria using Chemical Exchange Saturation Transfer (CEST) MRI. Magn. Reson. Med. 2013, 70, 1690–1698. [Google Scholar] [CrossRef]
- Farrar, C.T.; Buhrman, J.S.; Liu, G.; Kleijn, A.; Lamfers, M.L.; McMahon, M.T.; Gilad, A.A.; Fulci, G. Establishing the Lysine-rich Protein CEST Reporter Gene as a CEST MR Imaging Detector for Oncolytic Virotherapy. Radiology 2015, 275, 746–754. [Google Scholar] [CrossRef]
- Han, Z.; Li, Y.; Zhang, J.; Liu, J.; Chen, C.; van Zijl, P.C.; Liu, G. Molecular Imaging of Deoxycytidine Kinase Activity Using Deoxycytidine-Enhanced CEST MRI. Cancer Res. 2019, 79, 2775–2783. [Google Scholar] [CrossRef]
- Lesniak, W.G.; Oskolkov, N.; Song, X.; Lal, B.; Yang, X.; Pomper, M.; Laterra, J.; Nimmagadda, S.; McMahon, M.T. Salicylic Acid Conjugated Dendrimers Are a Tunable, High Performance CEST MRI NanoPlatform. Nano Lett. 2016, 16, 2248–2253. [Google Scholar] [CrossRef]
- Banerjee, S.R.; Song, X.; Yang, X.; Minn, I.; Lisok, A.; Chen, Y.; Bui, A.; Chatterjee, S.; Chen, J.; van Zijl, P.C.M.; et al. Salicylic Acid-Based Polymeric Contrast Agents for Molecular Magnetic Resonance Imaging of Prostate Cancer. Chemistry 2018, 24, 7235–7242. [Google Scholar] [CrossRef] [PubMed]
- Fernandez-Cuervo, G.; Sinharay, S.; Pagel, M.D. A CatalyCEST MRI Contrast Agent that Can Simultaneously Detect Two Enzyme Activities. ChemBioChem 2016, 17, 383–387. [Google Scholar] [CrossRef] [PubMed]
- Sinharay, S.; Howison, C.M.; Baker, A.F.; Pagel, M.D. Detecting in vivo urokinase plasminogen activator activity with a catalyCEST MRI contrast agent. NMR Biomed. 2017, 30, e3721. [Google Scholar] [CrossRef] [PubMed]
- Daryaei, I.; Ghaffari, M.M.; Jones, K.M.; Pagel, M.D. Detection of Alkaline Phosphatase Enzyme Activity with a CatalyCEST MRI Biosensor. ACS Sens. 2016, 1, 857–861. [Google Scholar] [CrossRef] [PubMed]
- Hingorani, D.V.; Montano, L.A.; Randtke, E.A.; Lee, Y.S.; Cardenas-Rodriguez, J.; Pagel, M.D. A single diamagnetic catalyCEST MRI contrast agent that detects cathepsin B enzyme activity by using a ratio of two CEST signals. Contrast Media Mol. Imaging 2016, 11, 130–138. [Google Scholar] [CrossRef]
- Song, X.; Walczak, P.; He, X.; Yang, X.; Pearl, M.; Bulte, J.W.M.; Pomper, M.G.; McMahon, M.T.; Janowski, M. Salicylic acid analogues as chemical exchange saturation transfer MRI contrast agents for the assessment of brain perfusion territory and blood-brain barrier opening after intra-arterial infusion. J. Cereb. Blood Flow Metab. 2016, 36, 1186–1194. [Google Scholar] [CrossRef]
- Cai, X.; Zhang, J.; Lu, J.; Yi, L.; Han, Z.; Zhang, S.; Yang, X.; Liu, G. N-Aryl Amides as Chemical Exchange Saturation Transfer Magnetic Resonance Imaging Contrast Agents. Chemistry 2020, 26, 11705–11709. [Google Scholar] [CrossRef]
- Cron, G.O.; Beghein, N.; Ansiaux, R.; Martinive, P.; Feron, O.; Gallez, B. 19F NMR in vivo spectroscopy reflects the effectiveness of perfusion-enhancing vascular modifiers for improving gemcitabine chemotherapy. Magn. Reson. Med. 2008, 59, 19–27. [Google Scholar] [CrossRef]
- Herzig, R.H.; Hines, J.D.; Herzig, G.P.; Wolff, S.N.; Cassileth, P.A.; Lazarus, H.M.; Adelstein, D.J.; Brown, R.A.; Coccia, P.F.; Strandjord, S.; et al. Cerebellar toxicity with high-dose cytosine arabinoside. J. Clin. Oncol. 1987, 5, 927–932. [Google Scholar] [CrossRef] [PubMed]
- Aime, S.; Delli Castelli, D.; Terreno, E. Highly Sensitive MRI Chemical Exchange Saturation Transfer Agents Using Liposomes. Angew. Chem. Int. Ed. 2005, 117, 5649–5651. [Google Scholar] [CrossRef]
- Castelli, D.D.; Terreno, E.; Longo, D.; Aime, S. Nanoparticle-based chemical exchange saturation transfer (CEST) agents. NMR Biomed. 2013, 26, 839–849. [Google Scholar] [CrossRef] [PubMed]
- Winter, P.M. Magnetic resonance chemical exchange saturation transfer imaging and nanotechnology. Wiley Interdiscip. Rev. Nanomed. Nanobiotechnol. 2012, 4, 389–398. [Google Scholar] [CrossRef]
- Demetriou, E.; Story, H.E.; Bofinger, R.; Hailes, H.C.; Tabor, A.B.; Golay, X. Effect of Liposomal Encapsulation on the Chemical Exchange Properties of Diamagnetic CEST Agents. J. Phys. Chem. B 2019, 123, 7545–7557. [Google Scholar] [CrossRef]
- Zhu, H.; Jones, C.K.; van Zijl, P.C.; Barker, P.B.; Zhou, J. Fast 3D chemical exchange saturation transfer (CEST) imaging of the human brain. Magn. Reson. Med. 2010, 64, 638–644. [Google Scholar] [CrossRef]
- Wen, Z.; Hu, S.; Huang, F.; Wang, X.; Guo, L.; Quan, X.; Wang, S.; Zhou, J. MR imaging of high-grade brain tumors using endogenous protein and peptide-based contrast. Neuroimage 2010, 51, 616–622. [Google Scholar] [CrossRef]
- Dixon, W.T.; Hancu, I.; Ratnakar, S.J.; Sherry, A.D.; Lenkinski, R.E.; Alsop, D.C. A multislice gradient echo pulse sequence for CEST imaging. Magn. Reson. Med. 2010, 63, 253–256. [Google Scholar] [CrossRef]
- Togao, O.; Keupp, J.; Hiwatashi, A.; Yamashita, K.; Kikuchi, K.; Yoneyama, M.; Honda, H. Amide proton transfer imaging of brain tumors using a self-corrected 3D fast spin-echo dixon method: Comparison With separate B0 correction. Magn. Reson. Med. 2017, 77, 2272–2279. [Google Scholar] [CrossRef]
- Heo, H.Y.; Zhang, Y.; Lee, D.H.; Jiang, S.; Zhao, X.; Zhou, J. Accelerating chemical exchange saturation transfer (CEST) MRI by combining compressed sensing and sensitivity encoding techniques. Magn. Reson. Med. 2017, 77, 779–786. [Google Scholar] [CrossRef]
- Zhang, Y.; Heo, H.Y.; Jiang, S.; Lee, D.H.; Bottomley, P.A.; Zhou, J. Highly accelerated chemical exchange saturation transfer (CEST) measurements with linear algebraic modeling. Magn. Reson. Med. 2016, 76, 136–144. [Google Scholar] [CrossRef] [PubMed]
- Zhang, Y.; Heo, H.Y.; Lee, D.H.; Jiang, S.; Zhao, X.; Bottomley, P.A.; Zhou, J. Chemical exchange saturation transfer (CEST) imaging with fast variably-accelerated sensitivity encoding (vSENSE). Magn. Reson. Med. 2017, 77, 2225–2238. [Google Scholar] [CrossRef] [PubMed]
- Schmitt, B.; Zaiss, M.; Zhou, J.; Bachert, P. Optimization of pulse train presaturation for CEST imaging in clinical scanners. Magn. Reson. Med. 2011, 65, 1620–1629. [Google Scholar] [CrossRef]
- Yoshimaru, E.S.; Randtke, E.A.; Pagel, M.D.; Cardenas-Rodriguez, J. Design and optimization of pulsed Chemical Exchange Saturation Transfer MRI using a multiobjective genetic algorithm. J. Magn. Reson. 2016, 263, 184–192. [Google Scholar] [CrossRef]
- Stabinska, J.; Cronenberg, T.; Wittsack, H.J.; Lanzman, R.S.; Muller-Lutz, A. Quantitative pulsed CEST-MRI at a clinical 3T MRI system. MAGMA 2017, 30, 505–516. [Google Scholar] [CrossRef] [PubMed]
- Chan, R.W.; Myrehaug, S.; Stanisz, G.J.; Sahgal, A.; Lau, A.Z. Quantification of pulsed saturation transfer at 1.5T and 3T. Magn. Reson. Med. 2019, 82, 1684–1699. [Google Scholar] [CrossRef] [PubMed]
- Bottomley, P.A. Turning up the heat on MRI. J. Am. Coll. Radiol. 2008, 5, 853–855. [Google Scholar] [CrossRef]
- van Osch, M.J.P.; Webb, A.G. Safety of Ultra-High Field MRI: What are the Specific Risks? Curr. Radiol. Rep. 2014, 2, 1–8. [Google Scholar] [CrossRef]


| Exchangeable Proton | Signal Frequency Offset Δω (ppm) | Examples |
|---|---|---|
| Hydroxyl (–OH) | 0.8–2, 4.8 | Glucose [60,61,70]; 3-OMG [71,72,73] 2DG [74,75,76]; dextran [77,78]; sucralose [79]; sucrose [80]; glucosamine [81]; phenols [82] |
| Amide (–NH) | 3.5, 4.2, 5.6 | Poly-L-lysine [83]; iopamidol [84]; iopromide [55]; mobile proteins [5] |
| Amino (–NH2) | 1.8–2.4 | L-arginine [62,85]; protamine [86]; cytosine/5-FC [87]; proteins [88] folate acids [59] |
| Heterocyclic ring amide (–NH) | 5–6.3 | Barbituric acid [86]; thymidine [89]; uridin70e [90] |
| Hydrogen bonds | 6–12 | Salicylic acids [91]; imidazoles [92]; H2O2 [41] |
| Aliphatic protons (rNOE) | −1.6, −3.5 | Mobile proteins [93,94] |
| Category | Examples | Exchangeable Protons |
|---|---|---|
| Anticancer drugs | Gemcitabine [59], Cytarabine [59], Decitabine [59], Azacitidine [59], | OH, NH2 |
| Fludarabine [59] | OH, NH2 | |
| Methotrexate [59], Pemetrexed [56] | NH2, Heterocyclic ring amide | |
| Melphalan [57] | NH2 | |
| Olsalazine [134] | OH | |
| Porphyrins (TPPS4) [135] | inner nitrogen protons (NH) | |
| Nonsteroidal anti-inflammatory drugs | Anthranilic acid (Flufenamic acid) [136] | NH (hydrogen bond) |
| Salicylic Acid [91] | OH (hydrogen bond) | |
| Neuroprotective drugs | Citicoline [137] | OH, NH2 |
| Cardiovascular drugs | Acebutolol [138] | N-aryl amide |
| Therapeutic bacteria and virus | Clostridium-NT [139] Oncolytic herpes simplex virus (HSV) [140] | Bacterial cells lysine-rich protein (LRP) gene |
Publisher’s Note: MDPI stays neutral with regard to jurisdictional claims in published maps and institutional affiliations. |
© 2020 by the authors. Licensee MDPI, Basel, Switzerland. This article is an open access article distributed under the terms and conditions of the Creative Commons Attribution (CC BY) license (http://creativecommons.org/licenses/by/4.0/).
Share and Cite
Chen, Z.; Han, Z.; Liu, G. Repurposing Clinical Agents for Chemical Exchange Saturation Transfer Magnetic Resonance Imaging: Current Status and Future Perspectives. Pharmaceuticals 2021, 14, 11. https://doi.org/10.3390/ph14010011
Chen Z, Han Z, Liu G. Repurposing Clinical Agents for Chemical Exchange Saturation Transfer Magnetic Resonance Imaging: Current Status and Future Perspectives. Pharmaceuticals. 2021; 14(1):11. https://doi.org/10.3390/ph14010011
Chicago/Turabian StyleChen, Zelong, Zheng Han, and Guanshu Liu. 2021. "Repurposing Clinical Agents for Chemical Exchange Saturation Transfer Magnetic Resonance Imaging: Current Status and Future Perspectives" Pharmaceuticals 14, no. 1: 11. https://doi.org/10.3390/ph14010011
APA StyleChen, Z., Han, Z., & Liu, G. (2021). Repurposing Clinical Agents for Chemical Exchange Saturation Transfer Magnetic Resonance Imaging: Current Status and Future Perspectives. Pharmaceuticals, 14(1), 11. https://doi.org/10.3390/ph14010011