Hippocampal Proteome of Rats Subjected to the Li-Pilocarpine Epilepsy Model and the Effect of Carisbamate Treatment

 , , and
Abstract
1. Introduction
2. Results
2.1. Proteomics
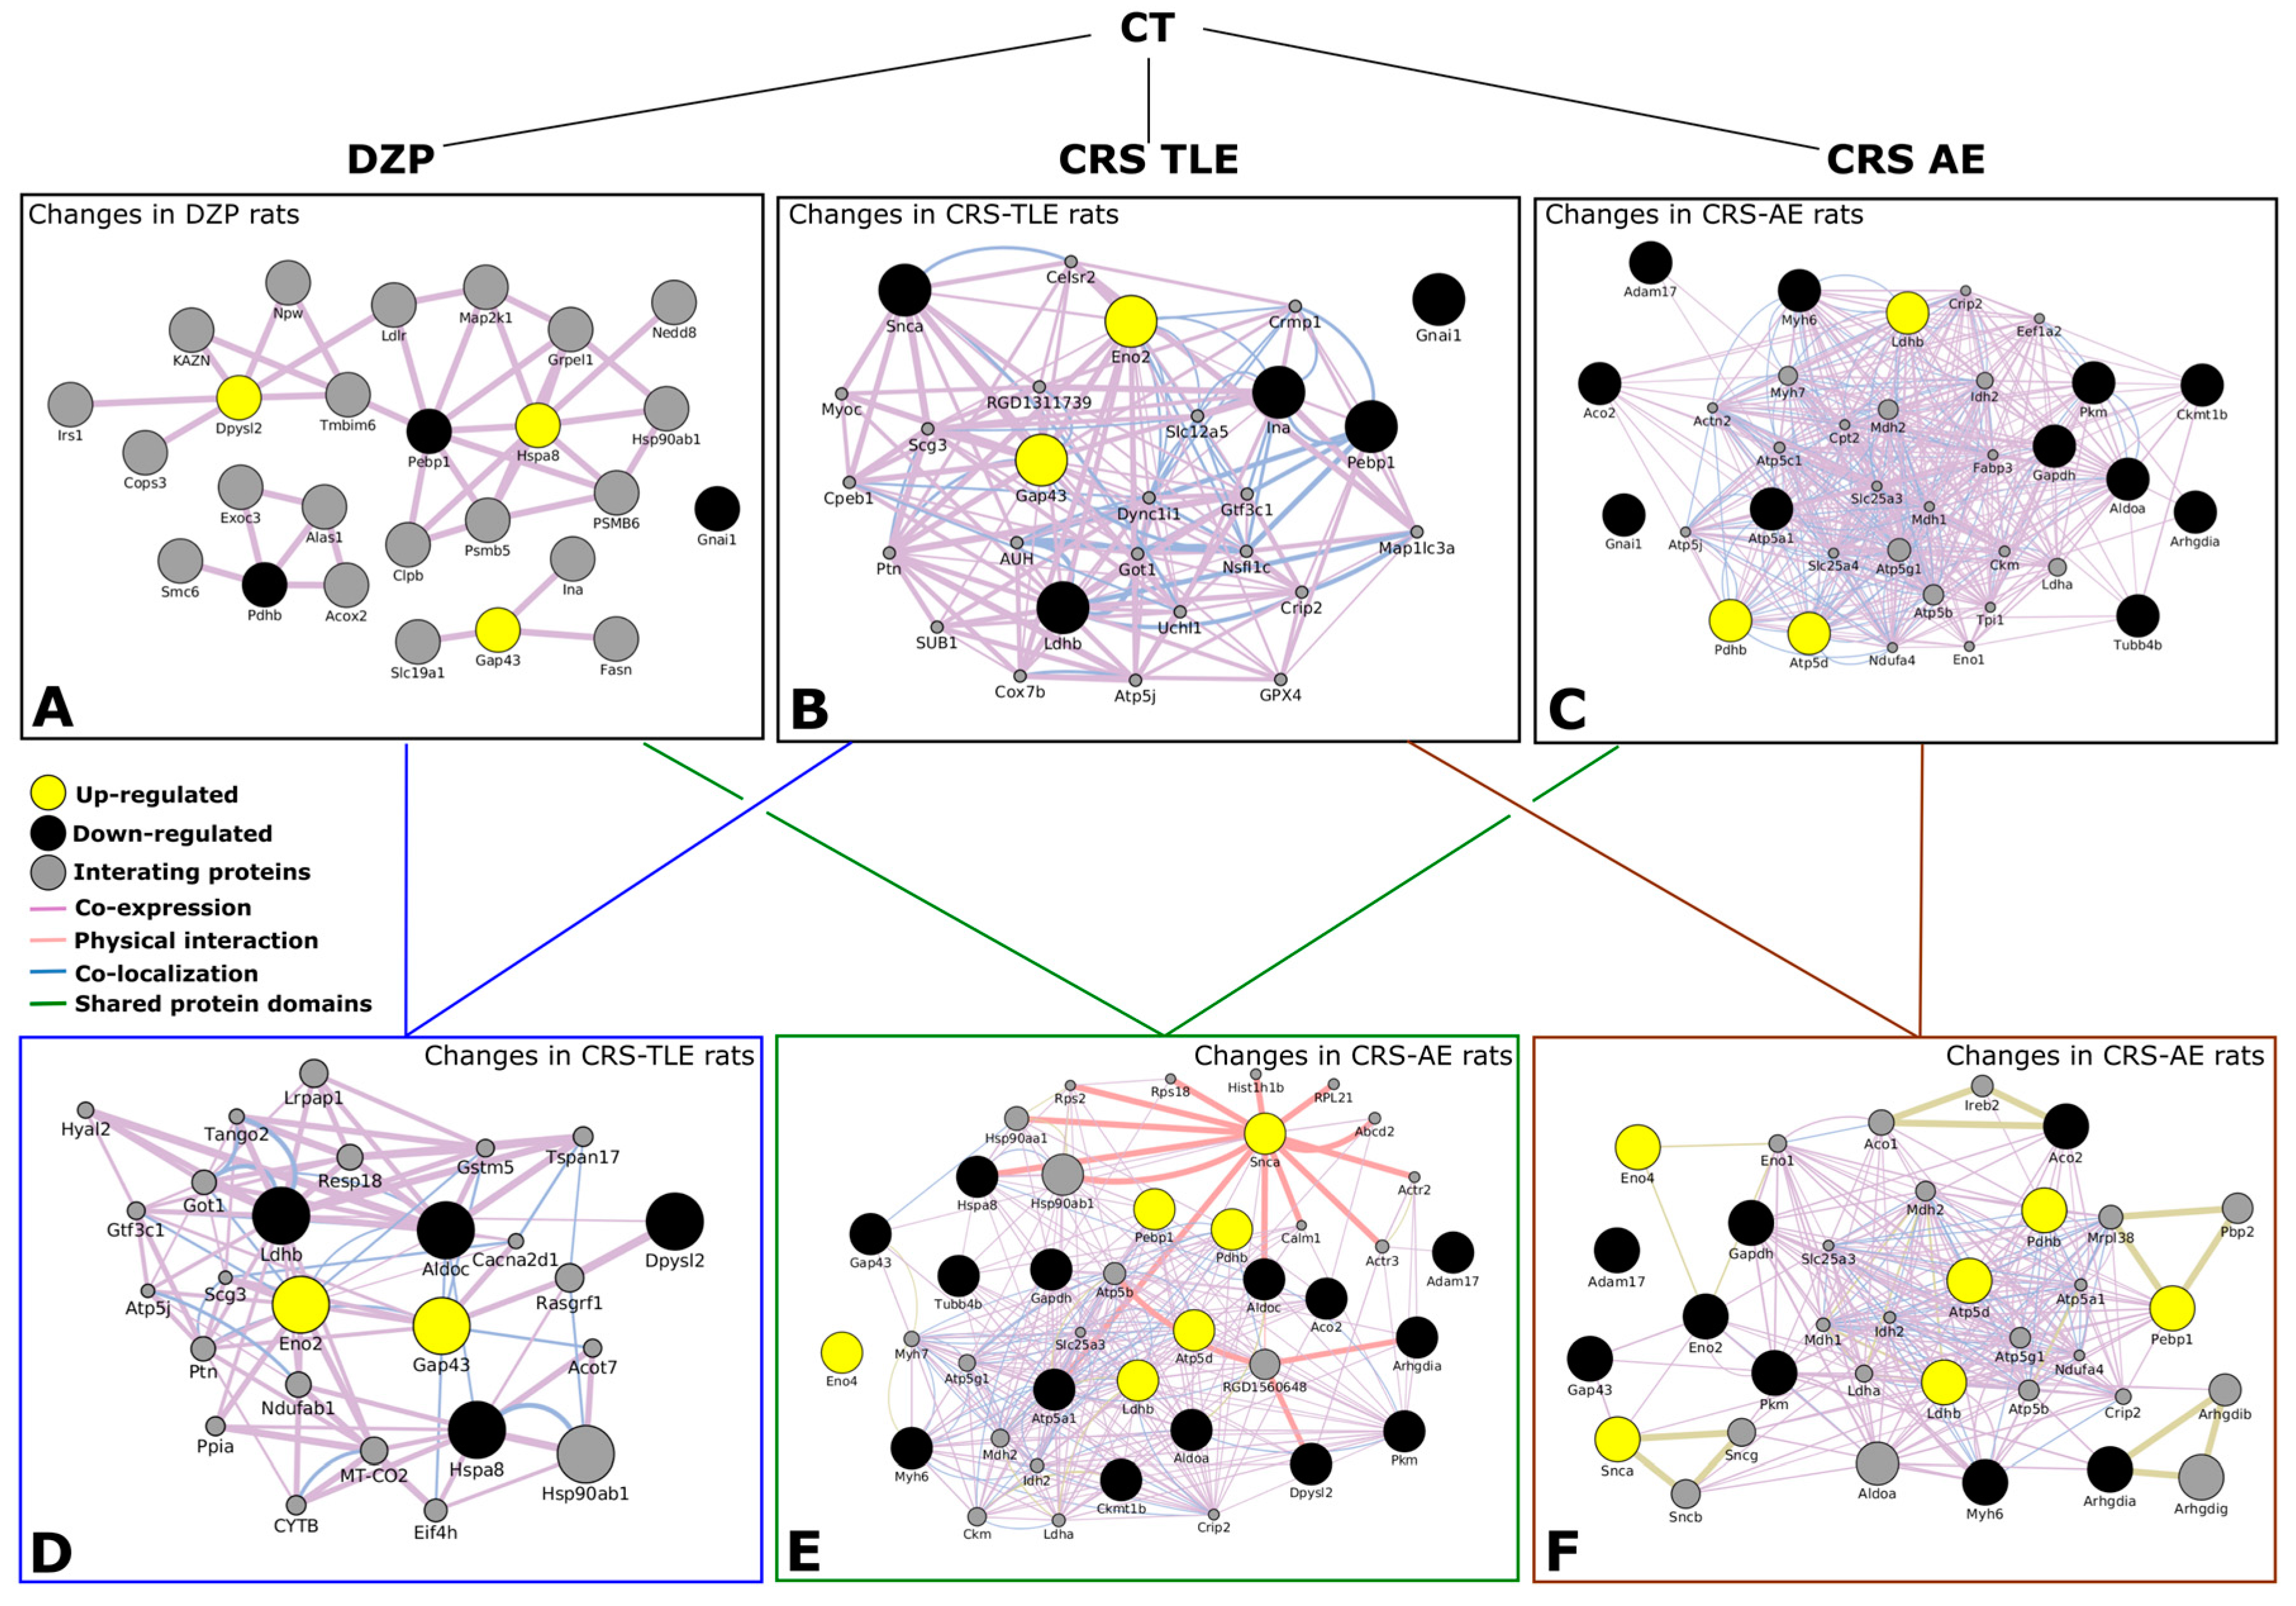
2.2. Interactome
2.3. Western Blot Confirmation
3. Discussion
3.1. Neuronal Development and Plasticity
3.2. Glycolysis and Energy Production
3.3. Neuronal Excitability
3.4. Pathways Observed in the CRS-NCS Group
4. Materials and Methods
5. Conclusions
Acknowledgments
Author Contributions
Conflicts of Interest
References
- Engel, J., Jr. Excitation and inhibition in epilepsy. Can. J. Neurol. Sci. J. Can. Sci. Neurol. 1996, 23, 167–174. [Google Scholar] [CrossRef]
- French, J.A.; Williamson, P.D.; Thadani, V.M.; Darcey, T.M.; Mattson, R.H.; Spencer, S.S.; Spencer, D.D. Characteristics of medial temporal lobe epilepsy: I. Results of history and physical examination. Ann. Neurol. 1993, 34, 774–780. [Google Scholar] [CrossRef] [PubMed]
- Bernasconi, N.; Bernasconi, A.; Caramanos, Z.; Antel, S.B.; Andermann, F.; Arnold, D.L. Mesial temporal damage in temporal lobe epilepsy: A volumetric MRI study of the hippocampus, amygdala and parahippocampal region. Brain J. Neurol. 2003, 126, 462–469. [Google Scholar] [CrossRef]
- Leite, J.P.; Bortolotto, Z.A.; Cavalheiro, E.A. Spontaneous recurrent seizures in rats: An experimental model of partial epilepsy. Neurosci. Biobehav. Rev. 1990, 14, 511–517. [Google Scholar] [CrossRef]
- Curia, G.; Longo, D.; Biagini, G.; Jones, R.S.G.; Avoli, M. The pilocarpine model of temporal lobe epilepsy. J. Neurosci. Methods 2008, 172, 143–157. [Google Scholar] [CrossRef] [PubMed]
- Fernandes, M.J.da S.; Carneiro, J.E.M.; Amorim, R.P.; Araujo, M.G.L.; Nehlig, A. Neuroprotective agents and modulation of temporal lobe epilepsy. Front. Biosci. 2015, 7, 79–93. [Google Scholar] [CrossRef]
- François, J.; Boehrer, A.; Nehlig, A. Effects of carisbamate (RWJ-333369) in two models of genetically determined generalized epilepsy, the GAERS and the audiogenic Wistar AS. Epilepsia 2008, 49, 393–399. [Google Scholar] [CrossRef] [PubMed]
- François, J.; Germe, K.; Ferrandon, A.; Koning, E.; Nehlig, A. Carisbamate has powerful disease-modifying effects in the lithium-pilocarpine model of temporal lobe epilepsy. Neuropharmacology 2011, 61, 313–328. [Google Scholar] [CrossRef] [PubMed]
- Makinson, C.D.; Tanaka, B.S.; Sorokin, J.M.; Wong, J.C.; Christian, C.A.; Goldin, A.L.; Escayg, A.; Huguenard, J.R. Regulation of Thalamic and Cortical Network Synchrony by Scn8a. Neuron 2017, 93, 1165–1179.e6. [Google Scholar] [CrossRef] [PubMed]
- Danober, L.; Deransart, C.; Depaulis, A.; Vergnes, M.; Marescaux, C. Pathophysiological mechanisms of genetic absence epilepsy in the rat. Prog. Neurobiol. 1998, 55, 27–57. [Google Scholar] [CrossRef]
- Faure, J.-B.; Marques-Carneiro, J.E.; Akimana, G.; Cosquer, B.; Ferrandon, A.; Herbeaux, K.; Koning, E.; Barbelivien, A.; Nehlig, A.; Cassel, J.-C. Attention and executive functions in a rat model of chronic epilepsy. Epilepsia 2014, 55, 644–653. [Google Scholar] [CrossRef] [PubMed]
- Faure, J.-B.; Akimana, G.; Carneiro, J.E.M.; Cosquer, B.; Ferrandon, A.; Geiger, K.; Koning, E.; Penazzi, L.; Cassel, J.-C.; Nehlig, A. A comprehensive behavioral evaluation in the lithium-pilocarpine model in rats: Effects of carisbamate administration during status epilepticus. Epilepsia 2013, 54, 1203–1213. [Google Scholar] [CrossRef] [PubMed]
- Liu, Y.; Yohrling, G.J.; Wang, Y.; Hutchinson, T.L.; Brenneman, D.E.; Flores, C.M.; Zhao, B. Carisbamate, a novel neuromodulator, inhibits voltage-gated sodium channels and action potential firing of rat hippocampal neurons. Epilepsy Res. 2009, 83, 66–72. [Google Scholar] [CrossRef] [PubMed]
- Lee, C.-Y.; Lee, M.-L.; Shih, C.-C.; Liou, H.-H. Carisbamate (RWJ-333369) inhibits glutamate transmission in the granule cell of the dentate gyrus. Neuropharmacology 2011, 61, 1239–1247. [Google Scholar] [CrossRef] [PubMed]
- Shim, S.; El Mansari, M.; Blier, P. Modulation of the antidepressant-like effects of sustained administration of carisbamate and lamotrigine on monoaminergic systems: Electrophysiological studies in the rat brain. J. Pharmacol. Exp. Ther. 2013, 347, 487–496. [Google Scholar] [CrossRef] [PubMed]
- Vergnes, M.; Marescaux, C.; Depaulis, A. Mapping of spontaneous spike and wave discharges in Wistar rats with genetic generalized non-convulsive epilepsy. Brain Res. 1990, 523, 87–91. [Google Scholar] [CrossRef]
- Alzate, O. Neuroproteomics. In Neuroproteomics; Alzate, O., Ed.; Frontiers in Neuroscience; CRC Press: Boca Raton, FL, USA, 2010; ISBN-13: 978-1-4200-7625-7. [Google Scholar]
- Fernandes, M.J.S.; Amorim, R.P.; Carneiro, J.E.M.; Araújo, M.G.L.; Persike, D.S. Proteomics-Based Strategy to Identify Biomarkers and Pharmacological Targets in Temporal Lobe Epilepsy. In Pharmacoresistance in Epilepsy; Rocha, L., Cavalheiro, E.A., Eds.; Springer: New York, NY, USA, 2013; pp. 115–126. [Google Scholar]
- Liu, X.; Wen, F.; Yang, J.; Chen, L.; Wei, Y.-Q. A review of current applications of mass spectrometry for neuroproteomics in epilepsy. Mass Spectrom. Rev. 2010, 29, 197–246. [Google Scholar] [CrossRef] [PubMed]
- Pitkänen, A.; Lukasiuk, K. Molecular biomarkers of epileptogenesis. Biomark. Med. 2011, 5, 629–633. [Google Scholar] [CrossRef] [PubMed]
- He, S.; Wang, Q.; He, J.; Pu, H.; Yang, W.; Ji, J. Proteomic analysis and comparison of the biopsy and autopsy specimen of human brain temporal lobe. Proteomics 2006, 6, 4987–4996. [Google Scholar] [CrossRef] [PubMed]
- Mériaux, C.; Franck, J.; Park, D.B.; Quanico, J.; Kim, Y.H.; Chung, C.K.; Park, Y.M.; Steinbusch, H.; Salzet, M.; Fournier, I. Human temporal lobe epilepsy analyses by tissue proteomics. Hippocampus 2014, 24, 628–642. [Google Scholar] [CrossRef] [PubMed]
- Heverin, M.; Brennan, G.P.; Koehler, C.J.; Treumann, A.; Henshall, D.C. Proteomic analysis of 14-3-3 zeta binding proteins in the mouse hippocampus. Int. J. Physiol. Pathophysiol. Pharmacol. 2012, 4, 74–83. [Google Scholar] [PubMed]
- Wu, L.; Peng, J.; Wei, C.; Liu, G.; Wang, G.; Li, K.; Yin, F. Characterization, using comparative proteomics, of differentially expressed proteins in the hippocampus of the mesial temporal lobe of epileptic rats following treatment with valproate. Amino Acids 2011, 40, 221–238. [Google Scholar] [CrossRef] [PubMed]
- Hengst, U.; Albrecht, H.; Hess, D.; Monard, D. The phosphatidylethanolamine-binding protein is the prototype of a novel family of serine protease inhibitors. J. Biol. Chem. 2001, 276, 535–540. [Google Scholar] [CrossRef] [PubMed]
- Monard, D. Cell-derived proteases and protease inhibitors as regulators of neurite outgrowth. Trends Neurosci. 1988, 11, 541–544. [Google Scholar] [CrossRef]
- Seeds, N.W.; Basham, M.E.; Haffke, S.P. Neuronal migration is retarded in mice lacking the tissue plasminogen activator gene. Proc. Natl. Acad. Sci. USA 1999, 96, 14118–14123. [Google Scholar] [CrossRef] [PubMed]
- Tsirka, S.E.; Rogove, A.D.; Bugge, T.H.; Degen, J.L.; Strickland, S. An Extracellular Proteolytic Cascade Promotes Neuronal Degeneration in the Mouse Hippocampus. J. Neurosci. 1997, 17, 543–552. [Google Scholar] [PubMed]
- Vaughan, P.J.; Pike, C.J.; Cotman, C.W.; Cunningham, D.D. Thrombin receptor activation protects neurons and astrocytes from cell death produced by environmental insults. J. Neurosci. Off. J. Soc. Neurosci. 1995, 15, 5389–5401. [Google Scholar]
- Persike, D.S.; Lima, M.L.; Amorim, R.P.; Cavalheiro, E.A.; Yacubian, E.M.T.; Centeno, R.S.; Carrete, J.H.; Schenkman, S.; Canzian, M.; Fernandes, M.J.S. Hippocampal proteomic profile in temporal lobe epilepsy. J. Epilepsy Clin. Neurophysiol. 2012, 18, 53–56. [Google Scholar] [CrossRef]
- Morimura, R.; Nozawa, K.; Tanaka, H.; Ohshima, T. Phosphorylation of Dpsyl2 (CRMP2) and Dpsyl3 (CRMP4) is required for positioning of caudal primary motor neurons in the zebrafish spinal cord. Dev. Neurobiol. 2013, 73, 911–920. [Google Scholar] [CrossRef] [PubMed]
- Neve, R.L.; Coopersmith, R.; McPhie, D.L.; Santeufemio, C.; Pratt, K.G.; Murphy, C.J.; Lynn, S.D. The neuronal growth-associated protein GAP-43 interacts with rabaptin-5 and participates in endocytosis. J. Neurosci. Off. J. Soc. Neurosci. 1998, 18, 7757–7767. [Google Scholar]
- Longo, B.; Vezzani, A.; Mello, L.E. Growth-associated protein 43 expression in hippocampal molecular layer of chronic epileptic rats treated with cycloheximide. Epilepsia 2005, 46, 125–128. [Google Scholar] [CrossRef] [PubMed]
- Holahan, M.R.; Honegger, K.S.; Tabatadze, N.; Routtenberg, A. GAP-43 gene expression regulates information storage. Learn. Mem. Cold Spring Harb. N 2007, 14, 407–415. [Google Scholar] [CrossRef] [PubMed]
- Routtenberg, A.; Cantallops, I.; Zaffuto, S.; Serrano, P.; Namgung, U. Enhanced learning after genetic overexpression of a brain growth protein. Proc. Natl. Acad. Sci. USA 2000, 97, 7657–7662. [Google Scholar] [CrossRef] [PubMed]
- Zhao, W.; Ng, K.T.; Sedman, G.L. Passive avoidance learning induced change in GAP43 phosphorylation in day-old chicks. Brain Res. Bull. 1995, 36, 11–17. [Google Scholar] [CrossRef]
- Garcia-Mata, R.; Boulter, E.; Burridge, K. The “invisible hand”: Regulation of RHO GTPases by RHOGDIs. Nat. Rev. Mol. Cell Biol. 2011, 12, 493–504. [Google Scholar] [CrossRef] [PubMed]
- Wang, J.; Wang, J.; Zhang, Y.; Yang, G.; Zhou, W.-J.; Shang, A.-J.; Zou, L.-P. Proteomic analysis of adrenocorticotropic hormone treatment of an infantile spasm model induced by N-methyl-d-aspartic acid and prenatal stress. PloS ONE 2012, 7, e45347. [Google Scholar] [CrossRef] [PubMed]
- Boulter, E.; Garcia-Mata, R.; Guilluy, C.; Dubash, A.; Rossi, G.; Brennwald, P.J.; Burridge, K. Regulation of Rho GTPase crosstalk, degradation and activity by RhoGDI1. Nat. Cell Biol. 2010, 12, 477–483. [Google Scholar] [CrossRef] [PubMed]
- Connolly, N.M.C.; Prehn, J.H.M. The metabolic response to excitotoxicity—Lessons from single-cell imaging. J. Bioenerg. Biomembr. 2015, 47, 75–88. [Google Scholar] [CrossRef] [PubMed]
- Arjunan, P.; Nemeria, N.; Brunskill, A.; Chandrasekhar, K.; Sax, M.; Yan; Jordan, F.; Guest, J.R.; Furey, W. Structure of the Pyruvate Dehydrogenase Multienzyme Complex E1 Component from Escherichia coli at 1.85 Å Resolution†,‡. Biochemistry (Mosc.) 2002, 41, 5213–5221. [Google Scholar] [CrossRef]
- Mailloux, R.J. Teaching the fundamentals of electron transfer reactions in mitochondria and the production and detection of reactive oxygen species. Redox Biol. 2015, 4, 381–398. [Google Scholar] [CrossRef] [PubMed]
- Lutas, A.; Yellen, G. The ketogenic diet: Metabolic influences on brain excitability and epilepsy. Trends Neurosci. 2013, 36, 32–40. [Google Scholar] [CrossRef] [PubMed]
- Haller, M.; Mironov, S.L.; Karschin, A.; Richter, D.W. Dynamic activation of KATP channels in rhythmically active neurons. J. Physiol. 2001, 537, 69–81. [Google Scholar] [CrossRef] [PubMed]
- Tanner, G.R.; Lutas, A.; Martínez-François, J.R.; Yellen, G. Single K ATP channel opening in response to action potential firing in mouse dentate granule neurons. J. Neurosci. Off. J. Soc. Neurosci. 2011, 31, 8689–8696. [Google Scholar] [CrossRef] [PubMed]
- Andreyeva, A.; Leshchyns’ka, I.; Knepper, M.; Betzel, C.; Redecke, L.; Sytnyk, V.; Schachner, M. CHL1 is a selective organizer of the presynaptic machinery chaperoning the SNARE complex. PloS ONE 2010, 5, e12018. [Google Scholar] [CrossRef] [PubMed]
- Leshchyns’ka, I.; Sytnyk, V.; Richter, M.; Andreyeva, A.; Puchkov, D.; Schachner, M. The adhesion molecule CHL1 regulates uncoating of clathrin-coated synaptic vesicles. Neuron 2006, 52, 1011–1025. [Google Scholar] [CrossRef] [PubMed]
- Alim, M.A.; Ma, Q.-L.; Takeda, K.; Aizawa, T.; Matsubara, M.; Nakamura, M.; Asada, A.; Saito, T.; Kaji, H.; Yoshii, M.; Hisanaga, S.; Uéda, K. Demonstration of a role for alpha-synuclein as a functional microtubule-associated protein. J. Alzheimers Dis. JAD 2004, 6, 435–442. [Google Scholar] [CrossRef] [PubMed]
- Norris, E.H.; Giasson, B.I.; Lee, V.M.-Y. Alpha-synuclein: Normal function and role in neurodegenerative diseases. Curr. Top. Dev. Biol. 2004, 60, 17–54. [Google Scholar] [CrossRef] [PubMed]
- Surguchov, A.; Surgucheva, I.; Sharma, M.; Sharma, R.; Singh, V. Pore-Forming Proteins as Mediators of Novel Epigenetic Mechanism of Epilepsy. Front. Neurol. 2017, 8, 3. [Google Scholar] [CrossRef] [PubMed]
- Murphy, D.D.; Rueter, S.M.; Trojanowski, J.Q.; Lee, V.M. Synucleins are developmentally expressed, and alpha-synuclein regulates the size of the presynaptic vesicular pool in primary hippocampal neurons. J. Neurosci. Off. J. Soc. Neurosci. 2000, 20, 3214–3220. [Google Scholar]
- George, J.M.; Yang, M.-L. α-Synuclein Physiology and Membrane Binding. Madame Curie Bioscience Database. Available online: https://www.ncbi.nlm.nih.gov/books/NBK6143/ (accessed on 30 July 2017).
- Perez, R.G.; Waymire, J.C.; Lin, E.; Liu, J.J.; Guo, F.; Zigmond, M.J. A Role for α-Synuclein in the Regulation of Dopamine Biosynthesis. J. Neurosci. 2002, 22, 3090–3099. [Google Scholar] [PubMed]
- Liu, L.-B.; Omata, W.; Kojima, I.; Shibata, H. Insulin Recruits GLUT4 from Distinct Compartments via Distinct Traffic Pathways with Differential Microtubule Dependence in Rat Adipocytes. J. Biol. Chem. 2003, 278, 30157–30169. [Google Scholar] [CrossRef] [PubMed]
- Bustelo, X.R.; Sauzeau, V.; Berenjeno, I.M. GTP-binding proteins of the Rho/Rac family: Regulation, effectors and functions in vivo. BioEssays News Rev. Mol. Cell. Dev. Biol. 2007, 29, 356–370. [Google Scholar] [CrossRef] [PubMed]
- Stankiewicz, T.R.; Linseman, D.A. Rho family GTPases: Key players in neuronal development, neuronal survival, and neurodegeneration. Front. Cell. Neurosci. 2014, 8, 314. [Google Scholar] [CrossRef] [PubMed]
- Sha, L.; Xu, Q. Complex Roles of Notch Signaling in the Development of Temporal Lobe Epilepsy: Evidence and Speculation. Mol. Cell. Epilepsy 2014, 1. [Google Scholar] [CrossRef]
- Sha, L.; Wu, X.; Yao, Y.; Wen, B.; Feng, J.; Sha, Z.; Wang, X.; Xing, X.; Dou, W.; Jin, L.; Li, W.; Wang, N.; Shen, Y.; Wang, J.; Wu, L.; Xu, Q. Notch signaling activation promotes seizure activity in temporal lobe epilepsy. Mol. Neurobiol. 2014, 49, 633–644. [Google Scholar] [CrossRef] [PubMed]
- Bertrand, D. Neuronal Nicotinic Acetylcholine Receptors and Epilepsy. Epilepsy Curr. 2002, 2, 191–193. [Google Scholar] [CrossRef] [PubMed]
- Raggenbass, M.; Bertrand, D. Nicotinic receptors in circuit excitability and epilepsy. J. Neurobiol. 2002, 53, 580–589. [Google Scholar] [CrossRef] [PubMed]
- Morrisett, R.A.; Jope, R.S.; Snead, O.C. Effects of drugs on the initiation and maintenance of status epilepticus induced by administration of pilocarpine to lithium-pretreated rats. Exp. Neurol. 1987, 97, 193–200. [Google Scholar] [CrossRef]
- Racine, R.J. Modification of seizure activity by electrical stimulation. II. Motor seizure. Electroencephalogr. Clin. Neurophysiol. 1972, 32, 281–294. [Google Scholar] [CrossRef]
- Bradford, M.M. A rapid and sensitive method for the quantitation of microgram quantities of protein utilizing the principle of protein-dye binding. Anal. Biochem. 1976, 72, 248–254. [Google Scholar] [CrossRef]
- R Development Core Team, 2013 R Development Core Team (2013). R: A language and Environment for Statistical Computing. R Foundation for Statistical Computing: Vienna, Austria; ISBN 3-900051-07-0. Available online: http://www.R-project.org (accessed on 30 July 2017).
- Fernie, A.R.; Carrari, F.; Sweetlove, L.J. Respiratory metabolism: Glycolysis, the TCA cycle and mitochondrial electron transport. Curr. Opin. Plant Biol. 2004, 7, 254–261. [Google Scholar] [CrossRef] [PubMed]


| Protein | Gene | UniProt ID | Mean of Optical Density | |||
|---|---|---|---|---|---|---|
| CT | DZP | CRS-TLE | CRS-NCS | |||
| Aconitase | Aco2 | Q99798 | 4936 | 7904 | 6626 | 453 * # § |
| ADAM metallopeptidase domain 17 | Adam17 | Q9Z0F8 | 1378 | 1448 | 1380 | 911 * # § |
| Aldolase A | Aldoa | P05065 | 7537 | 9228 | 9117 | 679 * # |
| Aldolase C | Aldoc | P05063 | 2136 | 2659 | 1381 # | 1951 # |
| Alpha internexin | Ina | P23565 | 8882 | 6997 | 5493 * | 6656 |
| Alpha synuclein | Snca | P37377 | 4141 | 1868 | 657 * | 5590 # § |
| ATP synthase alpha subunit | Atp5a1 | P15999 | 9684 | 9106 | 5389 | 764 * # |
| ATP synthase delta subunit | Atp5d | P35434 | 2707 | 2437 | 2597 | 4079 * # § |
| Creatine kinase U-type | Ckmt1 | P25809 | 5151 | 5242 | 4467 | 3405 * # |
| Dihydropyrimidinase-like 2 | Dpysl2 | P47942 | 2079 | 6635 * | 3166 # | 2962 # |
| Enolase 4 | Eno4 | D3ZRT2 | 843 | 493 | 723 | 1168 # § |
| Enolase 2 | Eno2 | P07323 | 12,747 | 13,264 | 20,937 * # | 12,009 § |
| Glyceraldehyde 3-phosphate dehydrogenase (Similar) | RGD1565368 | P04797 | 8984 | 9174 | 8824 | 3971 * # § |
| Glyceraldehyde 3-phosphate dehydrogenase | Gapdh | P04797 | 21,062 | 26,009 | 23,227 | 6032 * # § |
| Guanine nucleotide-binding protein G(i), alpha-1 subunit | Gnai1 | P10824 | 8054 | 2625 * | 3925 * | 2459 * |
| Heat shock cognate 71 kDa protein | Hspa8 | P63018 | 4763 | 13,475 * | 7216 # | 3475 # |
| lactate dehydrogenase chain-B | Ldhb | P42123 | 7183 | 7058 | 2502 * # | 10,166 * # § |
| Myosin-6 | Myh6 | P02563 | 3063 | 3814 | 4148 | 1223 * # § |
| Neuromodulin | Gap43 | P07936 | 4202 | 10,646 * | 20,957 * # | 7264 # § |
| Phosphatidylethanolamine binding protein 1 | Pebp1 | P31044 | 9292 | 4951 * | 4854 * | 9429 # § |
| Pyruvate dehydrogenase E1 component | Pdhb | P49432 | 3930 | 2253 * | 2647 | 7687 * # § |
| Pyruvate kinase M1/M2 | Pkm2 | P11980 | 7605 | 8491 | 7945 | 3497 * # § |
| Rho GDP dissociation inhibitor 1 | Arhgdia | Q5XI73 | 2987 | 2383 | 5142 | 767 * # § |
| Tubulin beta-2C chain | Tubb2c | P69897 | 127,231 | 142,920 * | 98,280 * # | 48,681 * # |
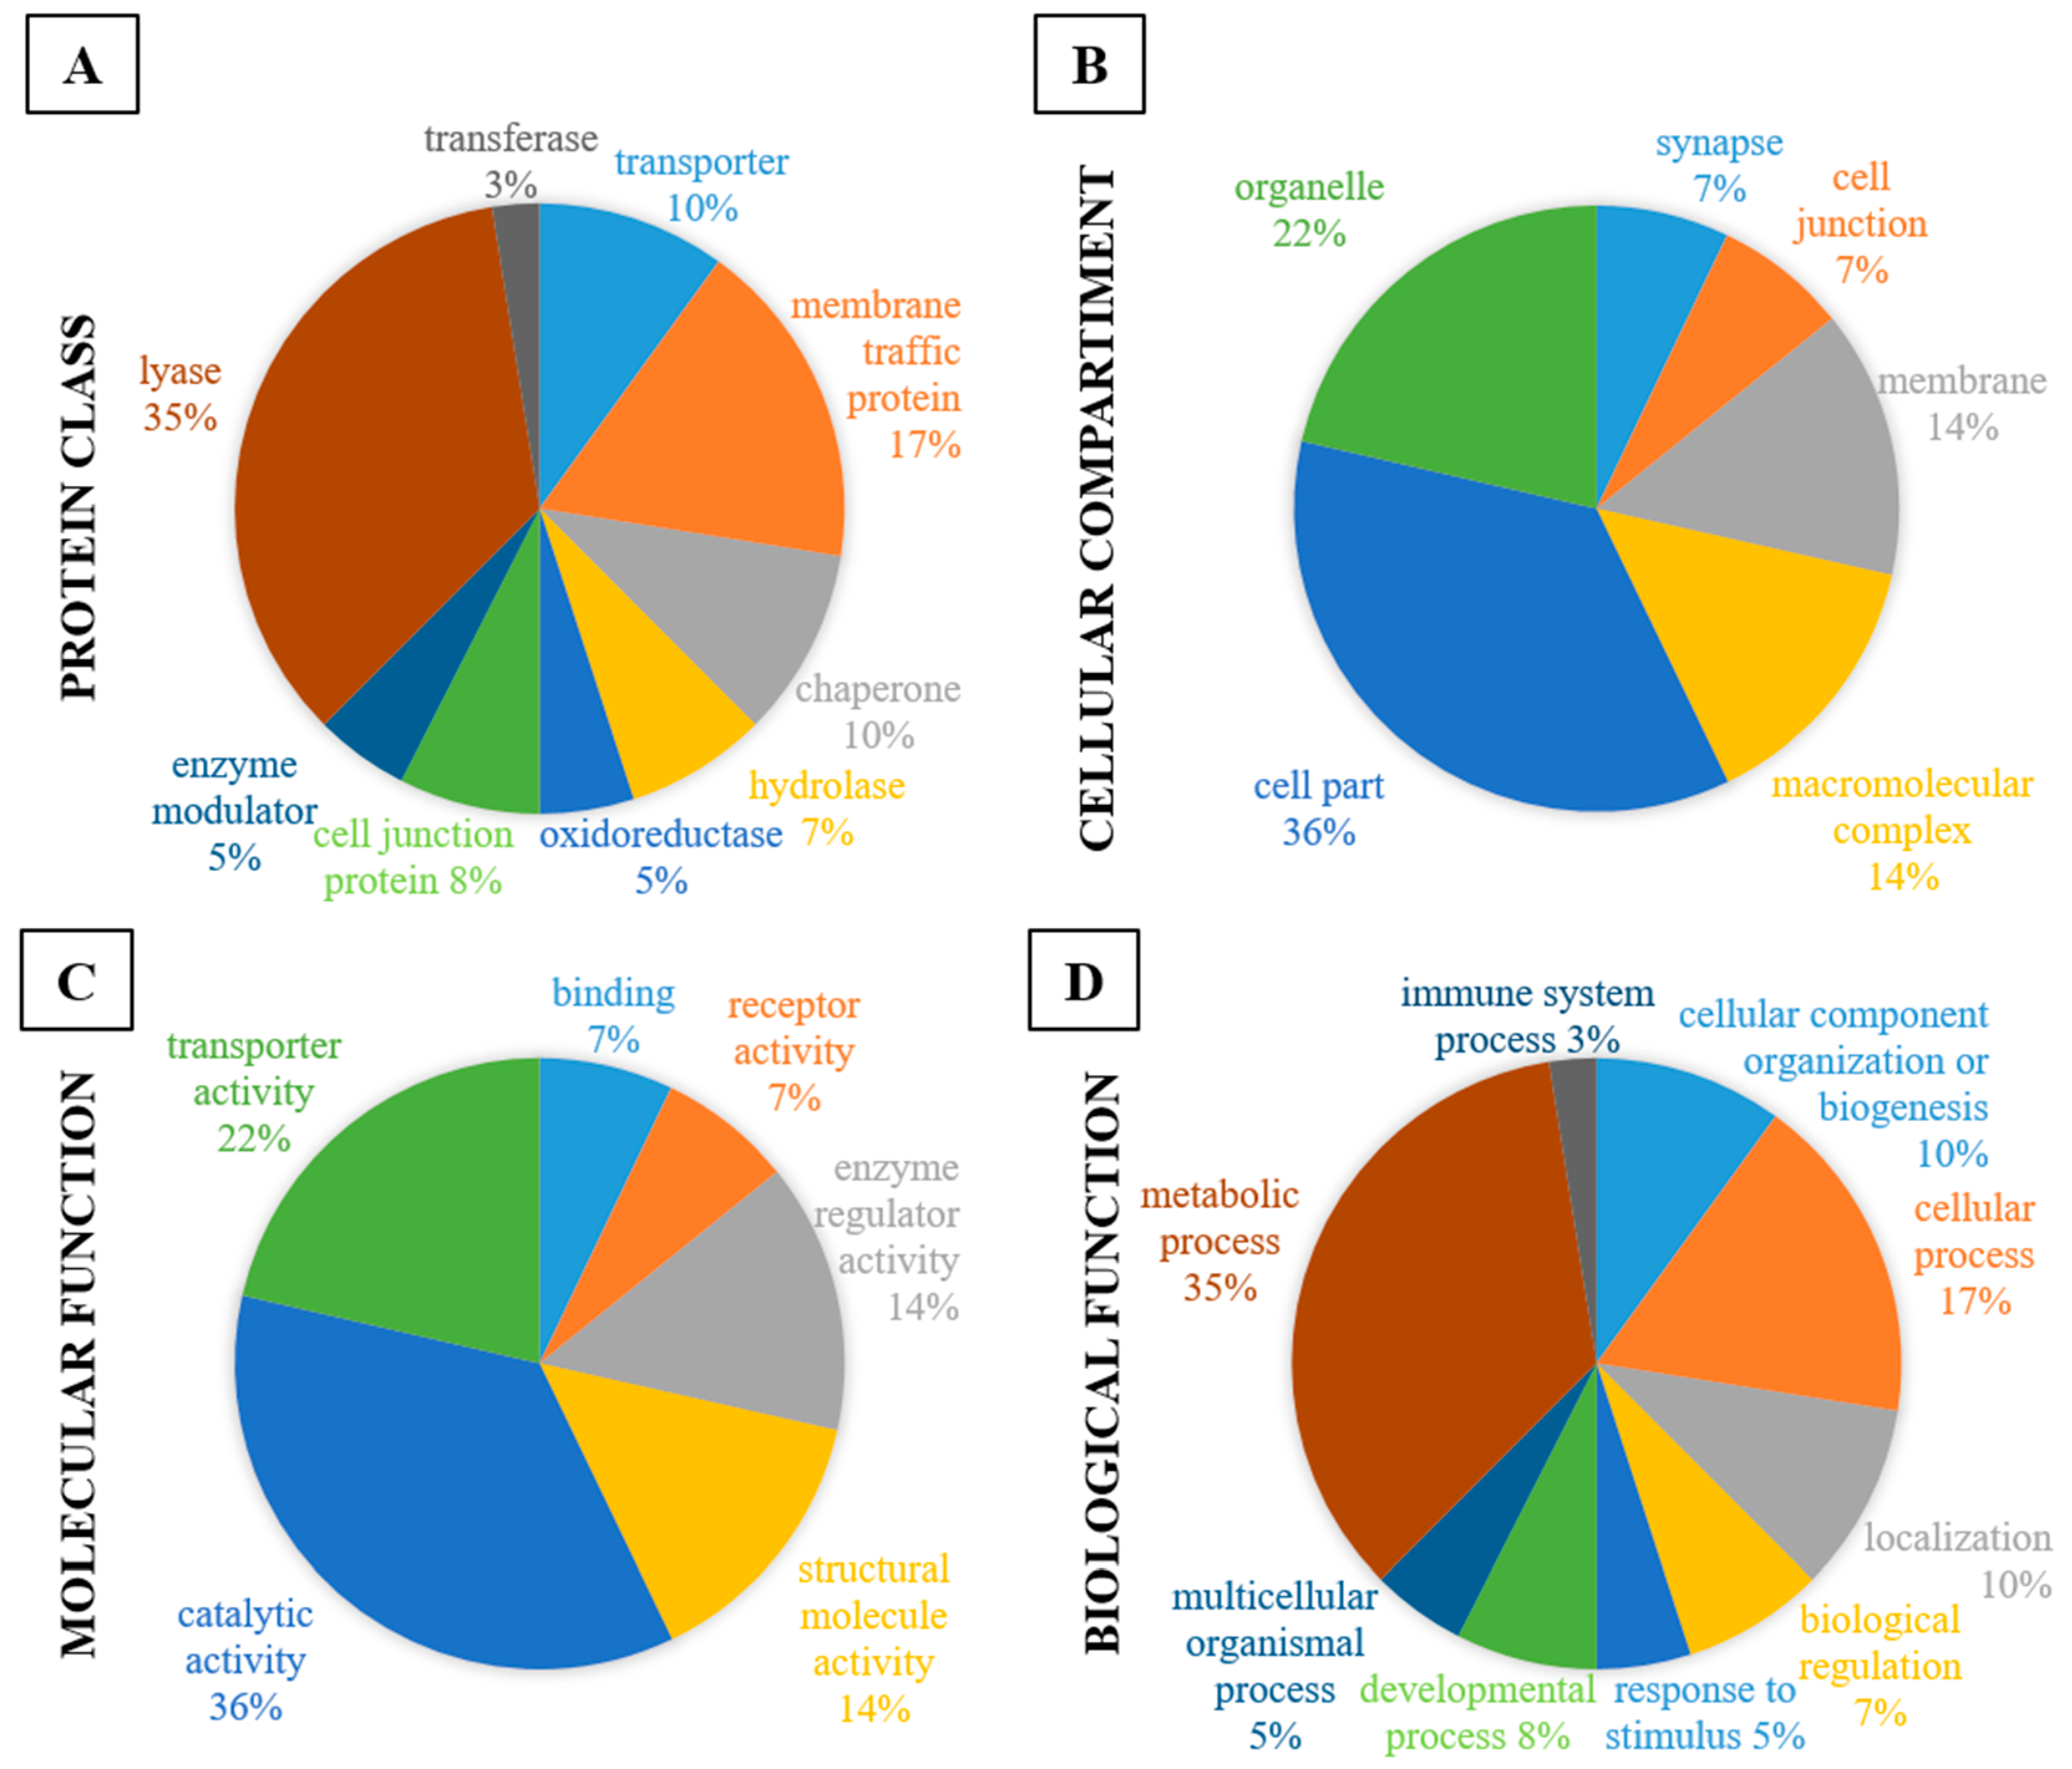
| Protein Class | CT vs. DZP | CT vs. CRS-NCS | CT vs. CRS-TLE | DZP vs. CRS-NCS | DZP vs. CRS-TLE | CRS-NCS vs. CRS-TLE |
| transporter | 6% | 5% | ||||
| hydrolase | 6% | 11% | 33% | |||
| oxidoreductase | 25% | 18% | 14% | 16% | 33% | 21% |
| cell junction protein | 6% | 5% | 7% | |||
| enzyme modulator | 25% | 18% | 14% | 11% | 14% | |
| lyase | 25% | 12% | 14% | 11% | 33% | 21% |
| transferase | 25% | 12% | 11% | 7% | ||
| nucleic acid binding | 6% | 5% | ||||
| cytoskeletal protein | 12% | 14% | 11% | 7% | ||
| signaling molecule | 6% | 5% | 7% | |||
| chaperone | 14% | 5% | 7% | |||
| structural protein | 14% | |||||
| membrane traffic protein | 14% | 5% | 7% | |||
| Cell Compartment | CT vs. DZP | CT vs. CRS-NCS | CT vs. CRS-TLE | DZP vs. CRS-NCS | DZP vs. CRS-TLE | CRS-NCS vs. CRS-TLE |
| synapse | 17% | 13% | 8% | 33% | 14% | |
| membrane | 17% | 17% | 13% | 8% | 14% | |
| macromolecular complex | 17% | 25% | 13% | 17% | ||
| cell part | 33% | 33% | 38% | 33% | 33% | 29% |
| organelle | 17% | 17% | 25% | 25% | 33% | 29% |
| cell junction | 8% | 8% | 14% | |||
| Molecular Function | CT vs. DZP | CT vs. CRS-NCS | CT vs. CRS-TLE | DZP vs. CRS-NCS | DZP vs. CRS-TLE | CRS-NCS vs. CRS-TLE |
| binding | 25% | 20% | 17% | 17% | 17% | |
| receptor activity | 5% | 6% | ||||
| structural molecule activity | 10% | 17% | 11% | 8% | ||
| signal transducer activity | 25% | 5% | 17% | |||
| catalytic activity | 50% | 50% | 50% | 56% | 100% | 67% |
| transporter activity | 10% | 11% | 8% | |||
| Biological Function | CT vs. DZP | CT vs. CRS-NCS | CT vs. CRS-TLE | DZP vs. CRS-NCS | DZP vs. CRS-TLE | CRS-NCS vs. CRS-TLE |
| response to stimulus | 14% | 5% | 10% | |||
| immune system process | 14% | 5% | 20% | |||
| developmental process | 5% | 30% | 5% | 7% | ||
| cellular process | 14% | 25% | 24% | 27% | ||
| multicellular organismal process | 5% | 5% | 7% | |||
| Metabolic process | 29% | 35% | 30% | 33% | 60% | 40% |
| biological regulation | 14% | 5% | 10% | 20% | 7% | |
| cellular component organization or biogenesis | 14% | 10% | 10% | 14% | 13% | |
| localization | 10% | 10% | 14% |
| Pathway | CT vs. DZP | CT vs. CRS-NCS | CT vs. CRS-TLE | DZP vs. CRS-NCS | DZP vs. CRS-TLE | CRS-NCS vs. CRS-TLE |
|---|---|---|---|---|---|---|
| ATP synthesis (P02721) | 3% | 4% | ||||
| Metabotropic glutamate receptor group III pathway (P00039) | 5% | 3% | 5% | |||
| Apoptosis signaling pathway (P00006) | 5% | 4% | 14% | |||
| Opioid proopiomelanocortin pathway (P05917) | 5% | 3% | 5% | |||
| Alzheimer disease-amyloid secretase pathway (P00003) | 4% | 6% | ||||
| Alzheimer disease-presenilin pathway (P00004) | 3% | 4% | 6% | |||
| Opioid prodynorphin pathway (P05916) | 5% | 3% | 5% | |||
| Alzheimer disease-amyloid secretase pathway (P00003) | 3% | |||||
| Opioid proenkephalin pathway (P05915) | 5% | 3% | 5% | |||
| Enkephalin release (P05913) | 5% | 3% | 5% | |||
| Inflammation mediated by chemokine and cytokine signaling pathway (P00031) | 5% | 6% | 5% | 4% | 6% | |
| Dopamine receptor mediated signaling pathway (P05912) | 5% | 3% | 5% | |||
| Parkinson disease (P00049) | 5% | 5% | 8% | 14% | 6% | |
| EGF receptor signaling pathway (P00018) | 5% | 5% | 4% | 6% | ||
| Gonadotropin-releasing hormone receptor pathway (P06664) | 5% | 3% | 5% | |||
| PI3 kinase pathway (P00048) | 5% | 3% | 5% | |||
| Cytoskeletal regulation by Rho GTPase (P00016) | 6% | 8% | 6% | |||
| Nicotine pharmacodynamics pathway (P06587) | 5% | 3% | 5% | |||
| Notch signaling pathway (P00045) | 3% | 4% | 6% | |||
| Nicotinic acetylcholine receptor signaling pathway (P00044) | 3% | 4% | 6% | |||
| Muscarinic acetylcholine receptor 2 and 4 signaling pathway (P00043) | 5% | 3% | 5% | |||
| Metabotropic glutamate receptor group II pathway (P00040) | 5% | 3% | 5% | |||
| Fructose galactose metabolism (P02744) | 3% | 8% | 14% | |||
| Huntington disease (P00029) | 6% | 8% | 6% | |||
| Pyruvate metabolism (P02772) | 3% | 4% | 6% | |||
| Wnt signaling pathway (P00057) | 3% | 4% | ||||
| Heterotrimeric G-protein signaling pathway-Gi alpha and Gs alpha mediated pathway (P00026) | 5% | 3% | 5% | |||
| 5HT1 type receptor mediated signaling pathway (P04373) | 5% | 3% | 5% | |||
| Glycolysis (P00024) | 6% | 5% | 15% | 29% | 19% | |
| GABA-B receptor II signaling (P05731) | 5% | 3% | 5% | 6% | ||
| Endogenous cannabinoid signaling (P05730) | 5% | 3% | 5% | |||
| TCA cycle (P00051) | 3% | 4% | 6% | |||
| FGF signaling pathway (P00021) | 5% | 5% | 4% | 6% | ||
| Axon guidance mediated by semaphorins (P00007 | 4% | 14% | ||||
| Pyrimidine Metabolism (P02771) | 4% | 14% |
© 2017 by the authors. Licensee MDPI, Basel, Switzerland. This article is an open access article distributed under the terms and conditions of the Creative Commons Attribution (CC BY) license (http://creativecommons.org/licenses/by/4.0/).
Share and Cite
Marques-Carneiro, J.E.; Persike, D.S.; Litzahn, J.J.; Cassel, J.-C.; Nehlig, A.; Fernandes, M.J.d.S. Hippocampal Proteome of Rats Subjected to the Li-Pilocarpine Epilepsy Model and the Effect of Carisbamate Treatment. Pharmaceuticals 2017, 10, 67. https://doi.org/10.3390/ph10030067
Marques-Carneiro JE, Persike DS, Litzahn JJ, Cassel J-C, Nehlig A, Fernandes MJdS. Hippocampal Proteome of Rats Subjected to the Li-Pilocarpine Epilepsy Model and the Effect of Carisbamate Treatment. Pharmaceuticals. 2017; 10(3):67. https://doi.org/10.3390/ph10030067
Chicago/Turabian StyleMarques-Carneiro, José Eduardo, Daniele Suzete Persike, Julia Julie Litzahn, Jean-Christophe Cassel, Astrid Nehlig, and Maria José da Silva Fernandes. 2017. "Hippocampal Proteome of Rats Subjected to the Li-Pilocarpine Epilepsy Model and the Effect of Carisbamate Treatment" Pharmaceuticals 10, no. 3: 67. https://doi.org/10.3390/ph10030067
APA StyleMarques-Carneiro, J. E., Persike, D. S., Litzahn, J. J., Cassel, J.-C., Nehlig, A., & Fernandes, M. J. d. S. (2017). Hippocampal Proteome of Rats Subjected to the Li-Pilocarpine Epilepsy Model and the Effect of Carisbamate Treatment. Pharmaceuticals, 10(3), 67. https://doi.org/10.3390/ph10030067