2.1. Studying Cell Stages
In molecular imprinting, surface cavities are formed by optimal alignment of the pre-polymer backbone around the template. This results in optimized fit between the final layer and the respective analyte both with respect to geometry and steric functionality. As yeast undergoes different growth stages during its reproductive cycle, the size and shape of the cell changes, whereas the chemical properties on its surface remain basically constant. Yet, by mass-sensitive detection with QCM, individual growth stages can be distinguished. According to Sauerbrey, the mass increase on the MIP-surface leads to a linear frequency decline of the oscillating quartz crystal. Such gravimetric sensors able to detect different stages in the development of yeast are reliable and easy to operate. Hence, they could be applied in biotechnology and in industrial fermentation processes, thus opening up new opportunities for monitoring microorganisms on-line. For the imprinting procedure with synchronized yeast, the cell culture was treated with
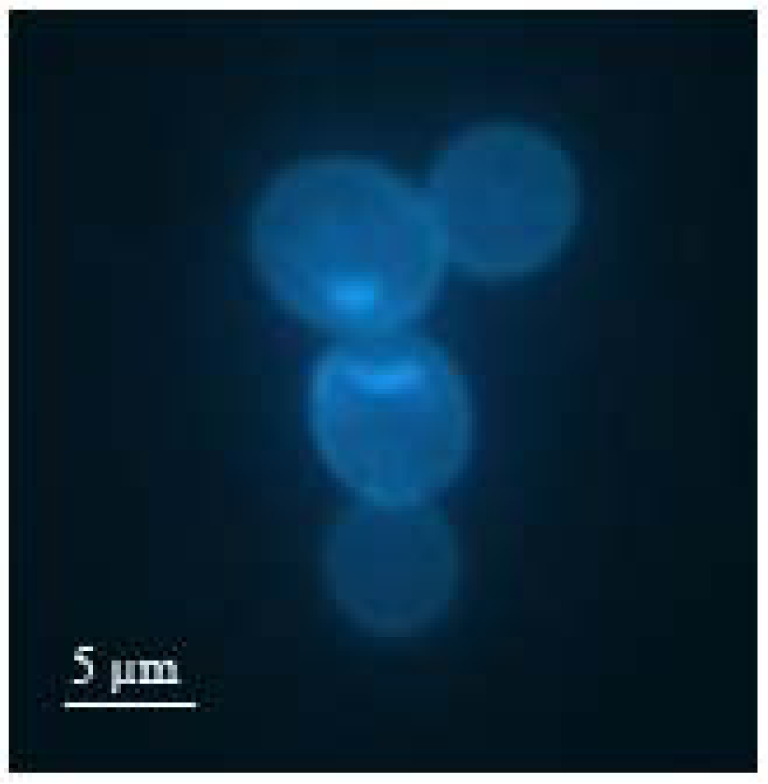
N-hydroxyurea, which stops the growth at the end of S (or synthesis) phase. Due to inhibition of DNA replication after budding, cell division is prevented. At this point of growth, the eukaryote exists in a duplex form in the size of approximately 9 μm, which is slightly smaller than two single cells.
Figure 1 shows a fluorescence microscope image of such a duplex cell marked with bisbenzimide. Here, it can be observed that the bud has reached roughly the size of the mother cell.
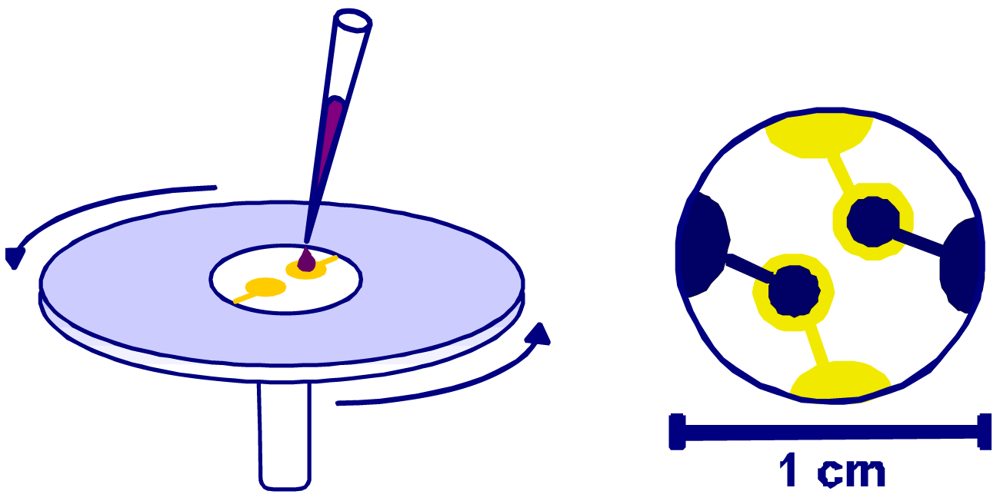
In order to generate optimum cavities in the polymer, the duplex cell suspension was dripped onto the polyurethane coating and immediately spin cast allowing the cells to arrange in horizontal position (
Figure 2).
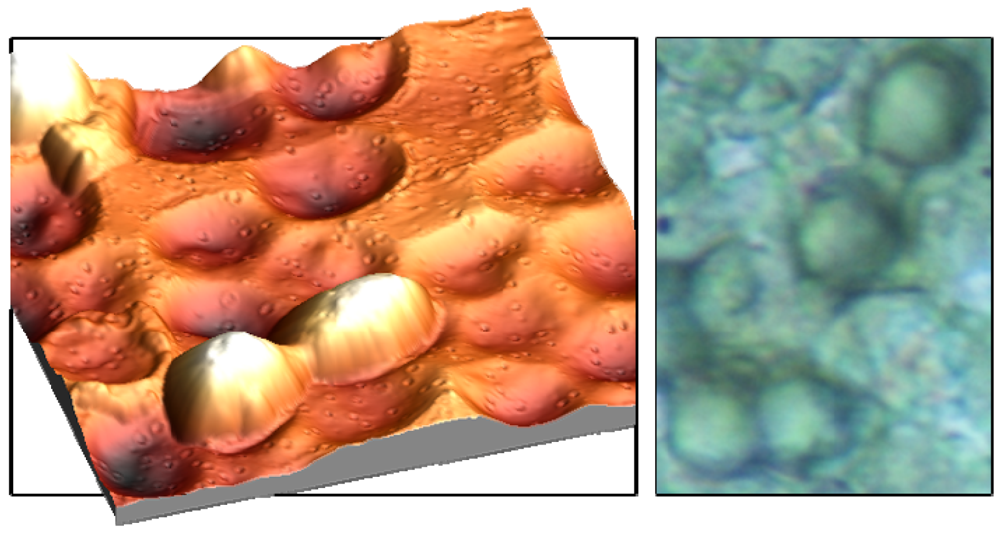
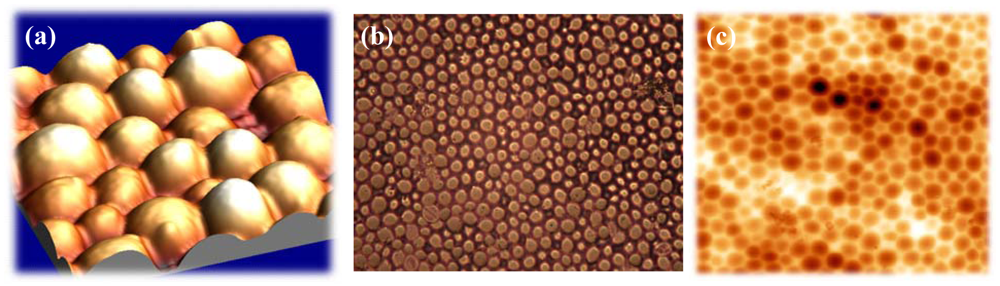
Fixing this monolayer with clean glass platelets finally results in imprints with the highest possible interaction area. As can be seen from
Figures 3a and b, incorporated cells can ‘lie’ in the polymer surface, which not only facilitates the inclusion but also enhances the adhesion in the layer. In this way, the frequency response can be further improved. The left picture in
Figure 3 was recorded with an Atomic Force Microscope, which represents an important tool in surface characterization. Apart from that, also reflected-light microscopy can be used for characterizing the respective surface (
Figure 3).
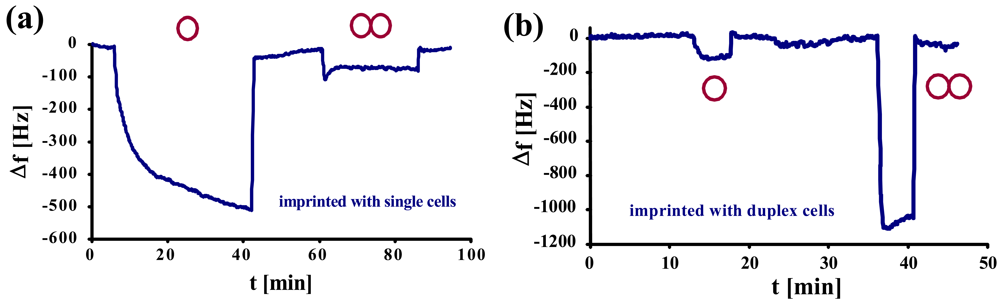
Studies on selectivity of such MIPs on mass-sensitive sensors were compared to QCMs imprinted with single yeast cells. In
Figure 4a, a normal yeast-sensitive sensor was exposed to a solution of single cells and to synchronized duplex cells of the same concentration (1.17 × 10
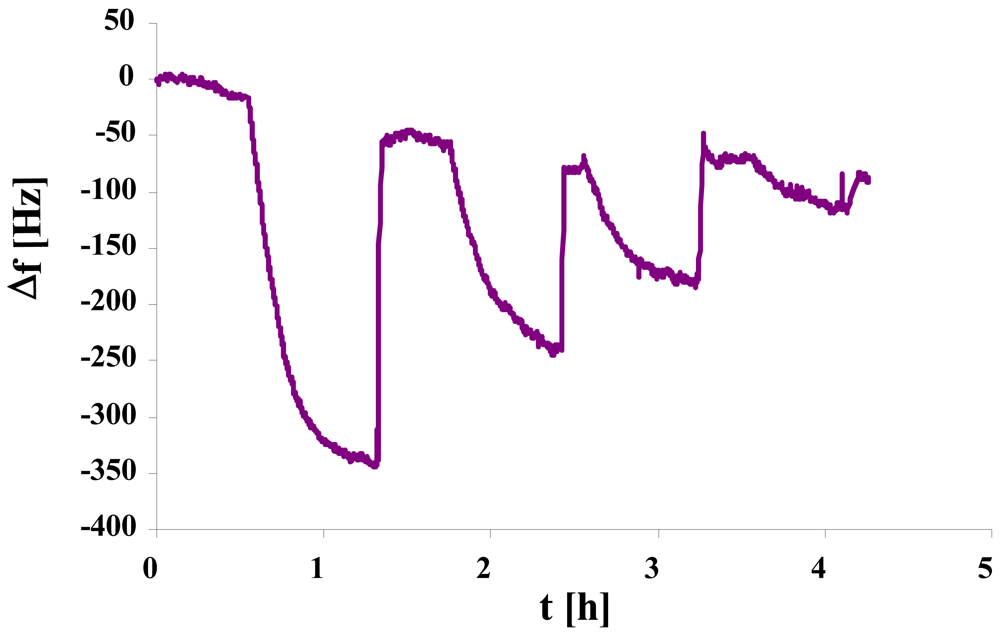
6 cells/μL). The same measurement was repeated with a sensor for duplex cells (
Figure 4b).
Here, it becomes evident that the two sensors show contrary behavior. While the frequency of the normal yeast sensor declines only by ∼100 Hz, the one for duplex cells shows a frequency drop of more than 1 kHz. Generally, both the sensors imprinted with single yeast cells (a) and with duplex cells (b), respectively, exhibit low cross-sensitivity and, at the same time, strong affinity to their own template. This can also be seen by the different response times between the template and the respective “competing” compound: the former usually shows (somewhat) longer response times. A reason for this may be that the cells have to arrange themselves in a way to optimally fit into the cavities. As selectivity in this case is strongly determined by geometry, nonspecific interactions are much faster.
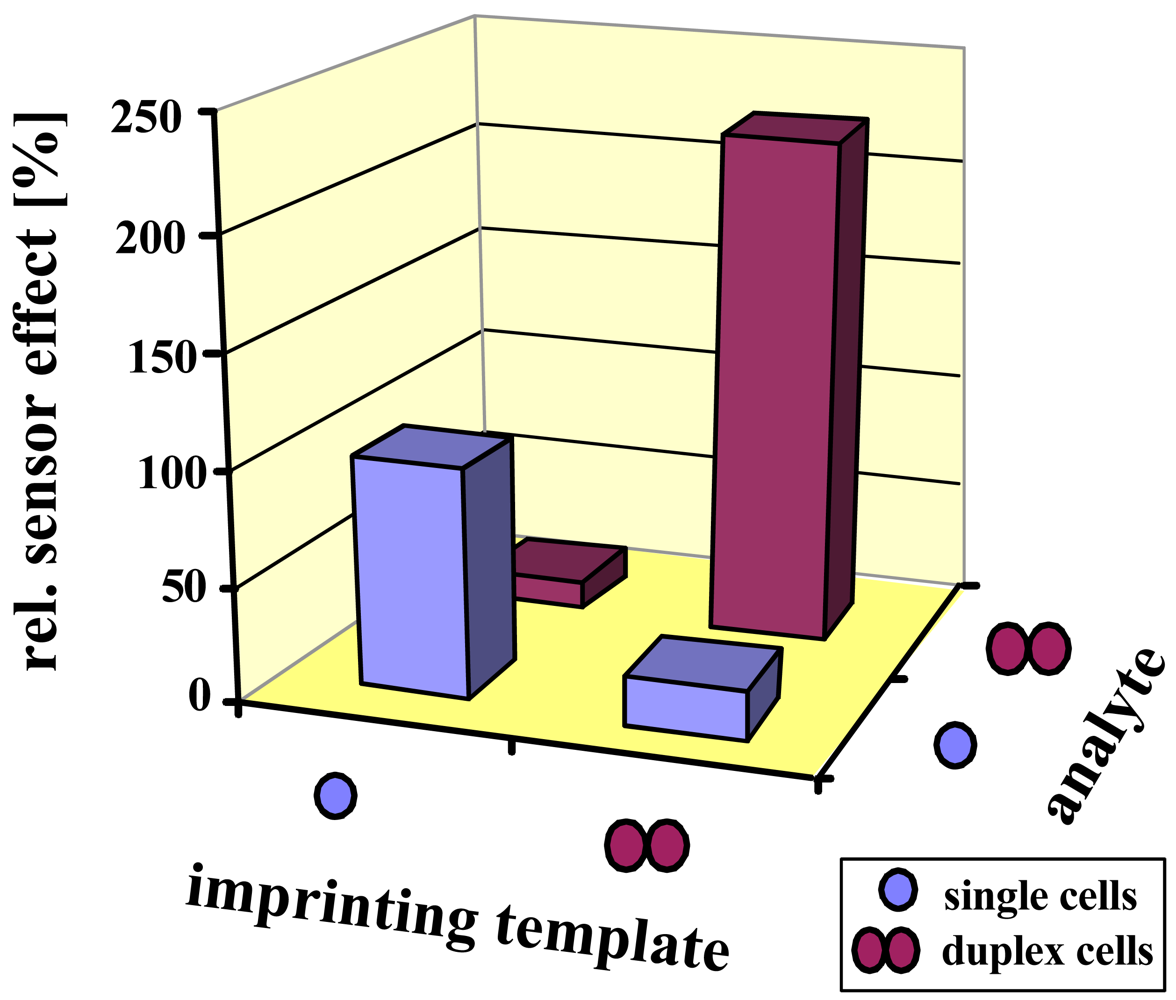
The selectivity results are summarized in
Figure 5. Again, both sensors prefer their respective template by at least a factor of five. Since the size of a duplex is less than twice the diameter of a single cell, this prevents incorporation of the incorrect analyte, being of course a main reason for selectivity. Additionally, the polysaccharide pattern of the cell wall slightly changes during the cell cycle, also leading to minor effects.
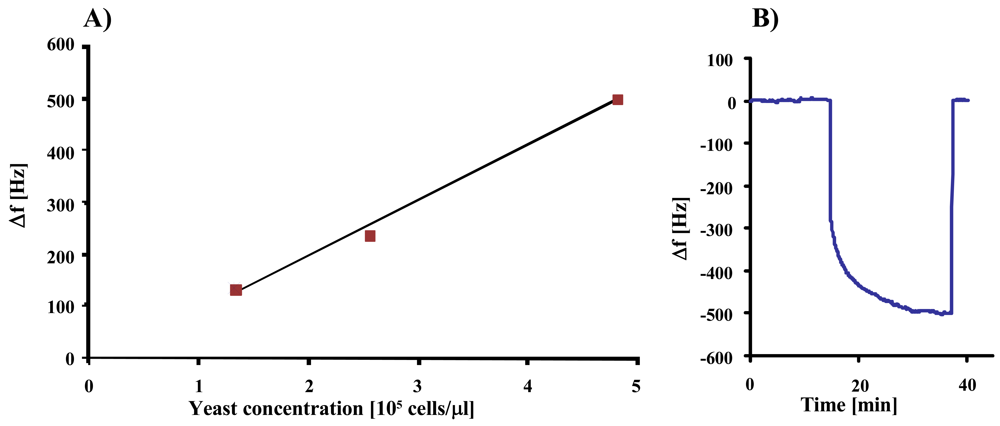
In the next step, we studied the sensor characteristics of duplex cell MIP, the result of which can be seen in
Figure 6. The measurement shows linear behavior at low concentrations, whereas the effect at 2.3 × 10
5 cells/μL exceeds the expected value probably due to multilayer adsorption of yeast on the MIP.
2.2. Artificial Yeast Master
As mentioned previously, we also focused on standardizing yeast MIPs via artificial stamps. For this purpose, an imprinted polyurethane layer is cast with another polymer (e.g., PDMS), thereby yielding plastic yeast cell copies. These are in turn used for templating in the imprinting procedure.
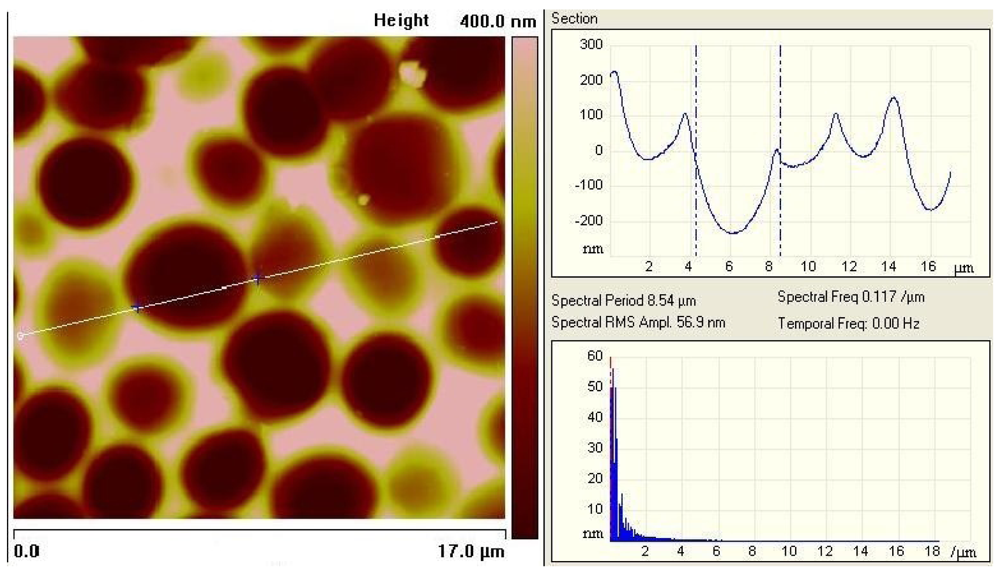
Figure 7a shows an AFM image of such an artificial stamp, while
Figure 7b depicts the same stamp in light microscope. Cavities produced by imprinting with a master stamp are presented in
Figure 7c. The size of the cavities is the same as can be obtained by templating with the natural cells.
In the next step, we evaluated the sensor properties of the resulting imprints. Previous studies already proved the selectivity of such MIP between
S. cerevisiae and
S. bayanus [
10]. Here, the cross-sensitivity towards the non-template is very low in spite of the similar geometry of the two analytes. The present work is targeted at the sensor characteristic, as can be seen in
Figure 8 showing the individual frequency shifts of a QCM coated with stamp-templated yeast MIP at four concentrations.
Further work in this field concentrates on artificial stamps for different growth stages of
S. cerevisiae. In recent studies, we succeeded in designing PDMS stamps from different yeast cell stages. For this purpose, we cultured yeast in YPD nutrient solution at room temperature. After approximately 20 minutes, the cells have reached early synthesis phase, with increased cell size and starting growth of buds.
Figure 9 shows an AFM image of the PU-layer sensitive to cells of this growth stage generated by artificial stamp. Evidently, also these artificial polymer templates lead to cavities correctly reproducing the geometrical features of the budding yeasts.
Figure 10 complements this picture by the sensor characteristic and an individual sensor response of the respective MIP material indicating also optimized interaction networks between polymer and analyte.
2.3. Multichannel Quartz Crystal Microbalances
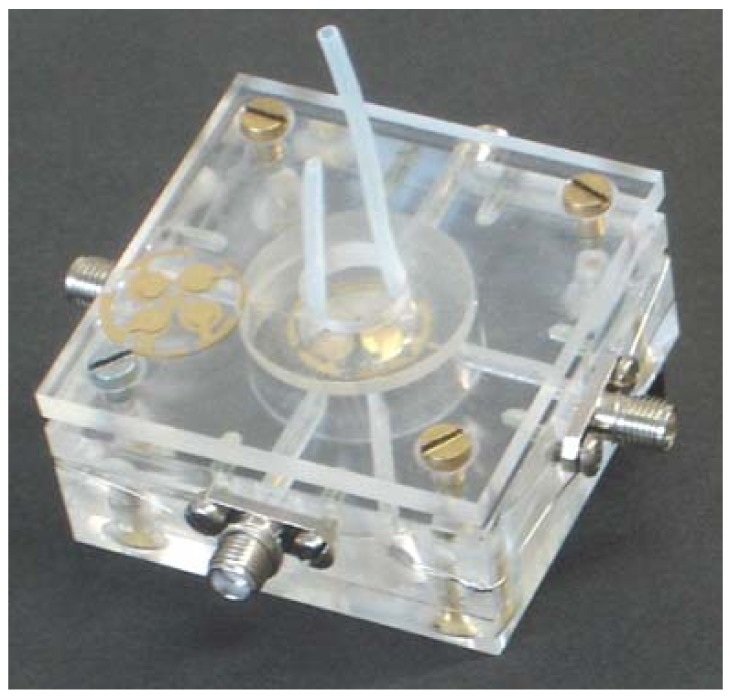
Multichannel quartz crystal microbalances (MQCM) represent a promising approach for biosensor applications and have also attracted substantial interest in biotechnology and industry. Miniaturization of the devices results in substantial cost reduction and time saving. Besides, a multichannel sensor on a single quartz crystal improves the reproducibility and enables the simultaneous detection of several analytes. In this work, we designed QCM with four-electrode geometry and optimized them for measuring in liquid phase. In order to minimize the frequency interference between the individual channels, the size and thickness of the electrodes had to be carefully chosen. The final structures are 3.5 mm in diameter on the side facing the analyte chamber and 3 mm on the back side. The thickness of the gold layer is 120–140 nm. The measuring cell for a 4-channel sensor is shown in
Figure 11.
One of the main problems in using multi-electrode setups on QCM in liquid phase is possible cross talk between the channels leading to impaired results. Therefore, neither the individual resonance frequencies, nor the electrodes should be too close together. The former is usually already given by manual screen printing, which is a directional process and thus usually leads to certain variation in electrode thickness. For the latter, the diameter of the electrode pairs has to be optimized. According to our experience, the distance between neighboring electrode pairs should be in the range of two millimeters. Substantially decreasing the electrode diameters, however, leads to reduced sensitivity. Therefore, the abovementioned dimensions are the result of longer lasting optimization.
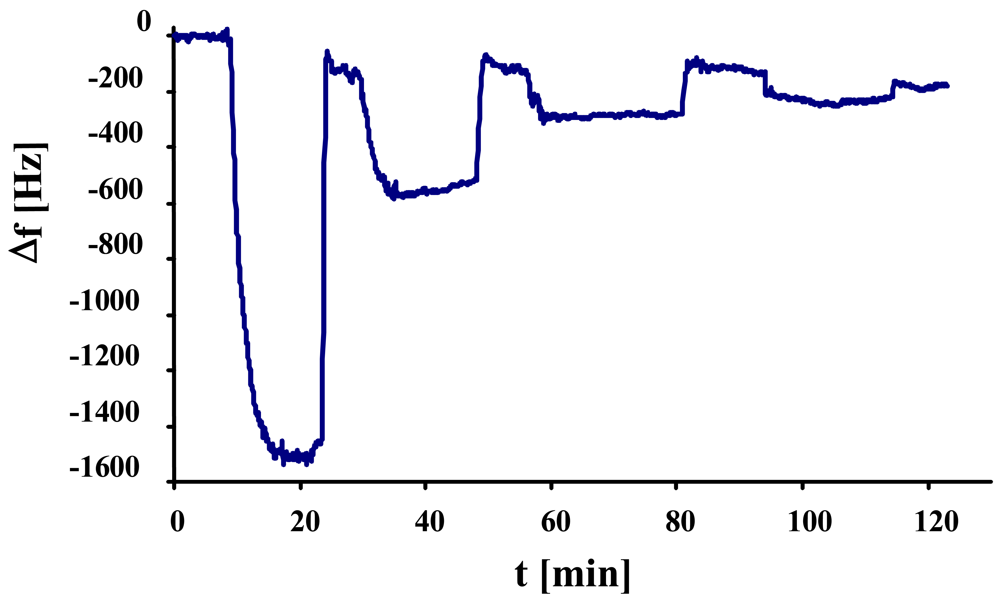
For the first tests, we coated the MQCM with polyurethane and imprinted them with different growth stages of
S. cerevisiae. One electrode is imprinted with single cells and another with synchronized duplex cells, while the two remaining electrodes are left non-imprinted. Each channel is now connected with a dedicated oscillator and read out with a frequency counter and custom-made software. The resulting measurement in
Figure 12 shows the sensor response to the addition of yeast (5 mg/mL). Here, the frequency decrease of the yeast imprinted electrode (single cells) obviously outperforms the others by about 400 Hz. The electrode imprinted with duplex cells shows a slightly higher effect than the non-imprinted ones which reflect the unspecific interactions of the analyte with the polymer. Compared to the previous measurements, the sensor responses are higher in this case, which is due to differences in thickness of the quartz substrate and electrode geometry, respectively.


