Hyperspectral Sensor Data Capability for Retrieving Complex Urban Land Cover in Comparison with Multispectral Data: Venice City Case Study (Italy)

Abstract
:1. Introduction
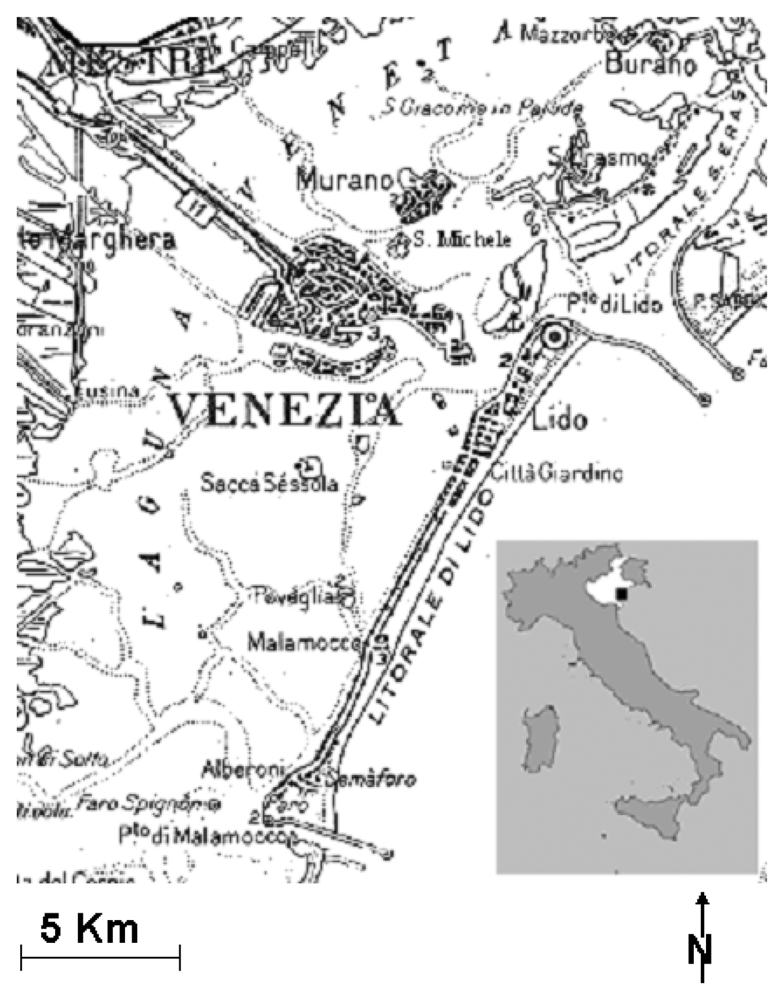
2. Study area
3. Data
3.1. Remote sensing data
3.2. Image pre-processing
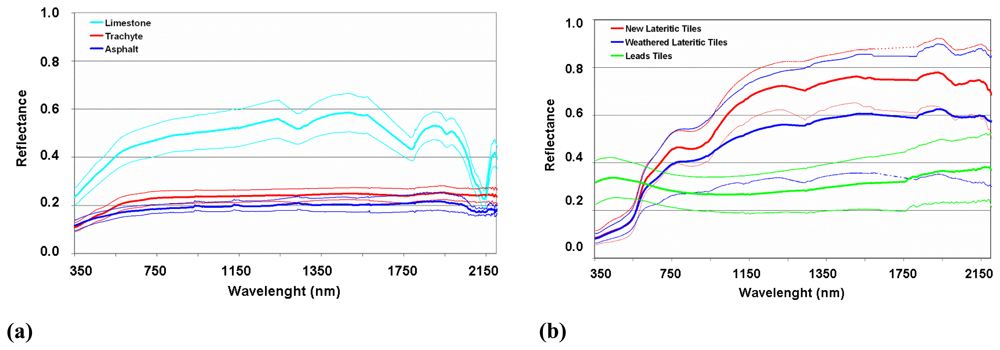
3.3. Field campaign
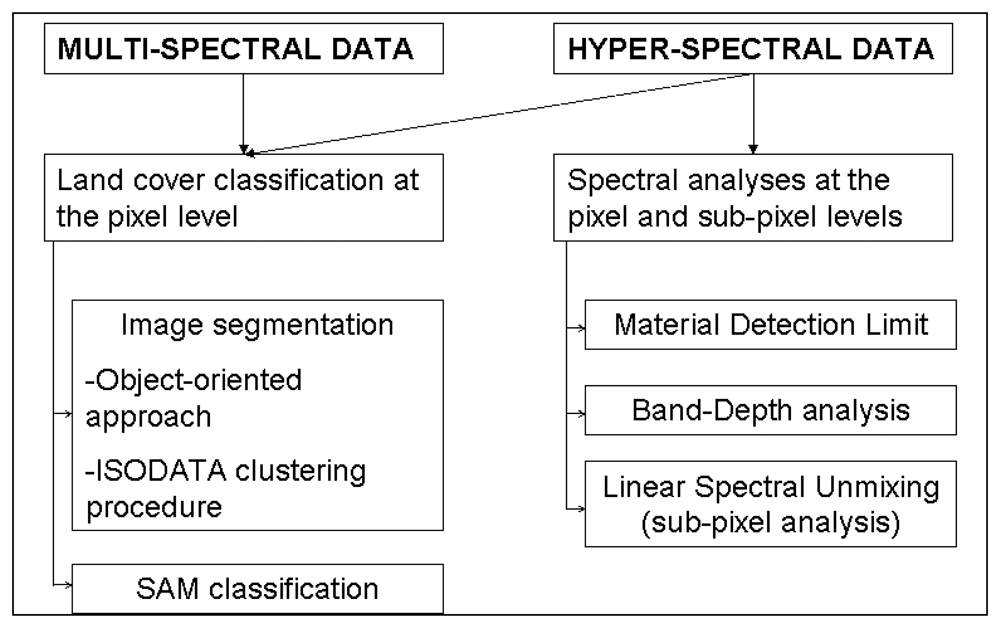
4. Methods
4.1. Image segmentation
4.1.1. Object-Oriented approach
4.1.2. ISODATA Clustering
4.2. SAM classification
4.3. Spectral analyses
4.3.1. Band and Material Detection Limit analyses
4.3.2. Band-Depth Analysis
4.3.3. Linear Spectral Unmixing
5. Results and discussion
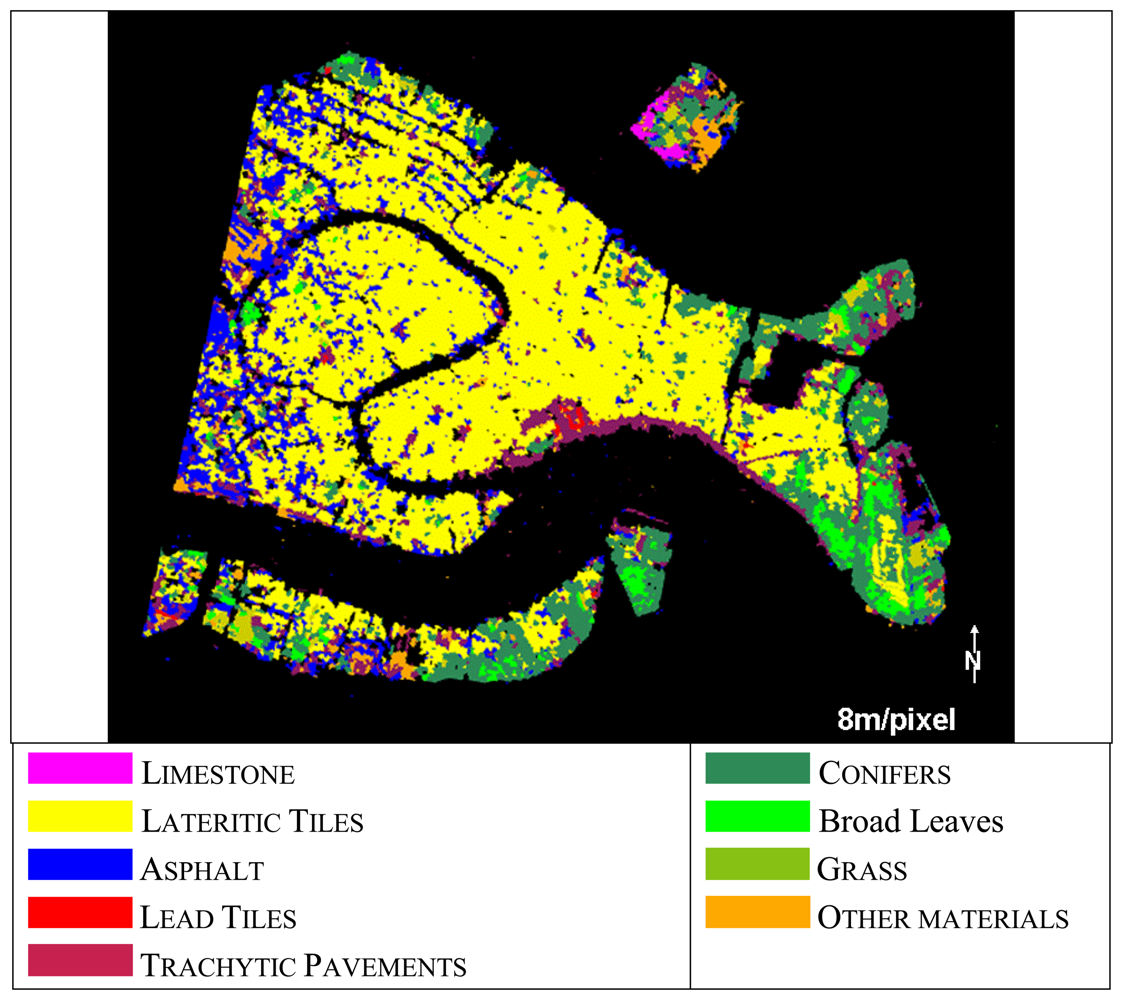
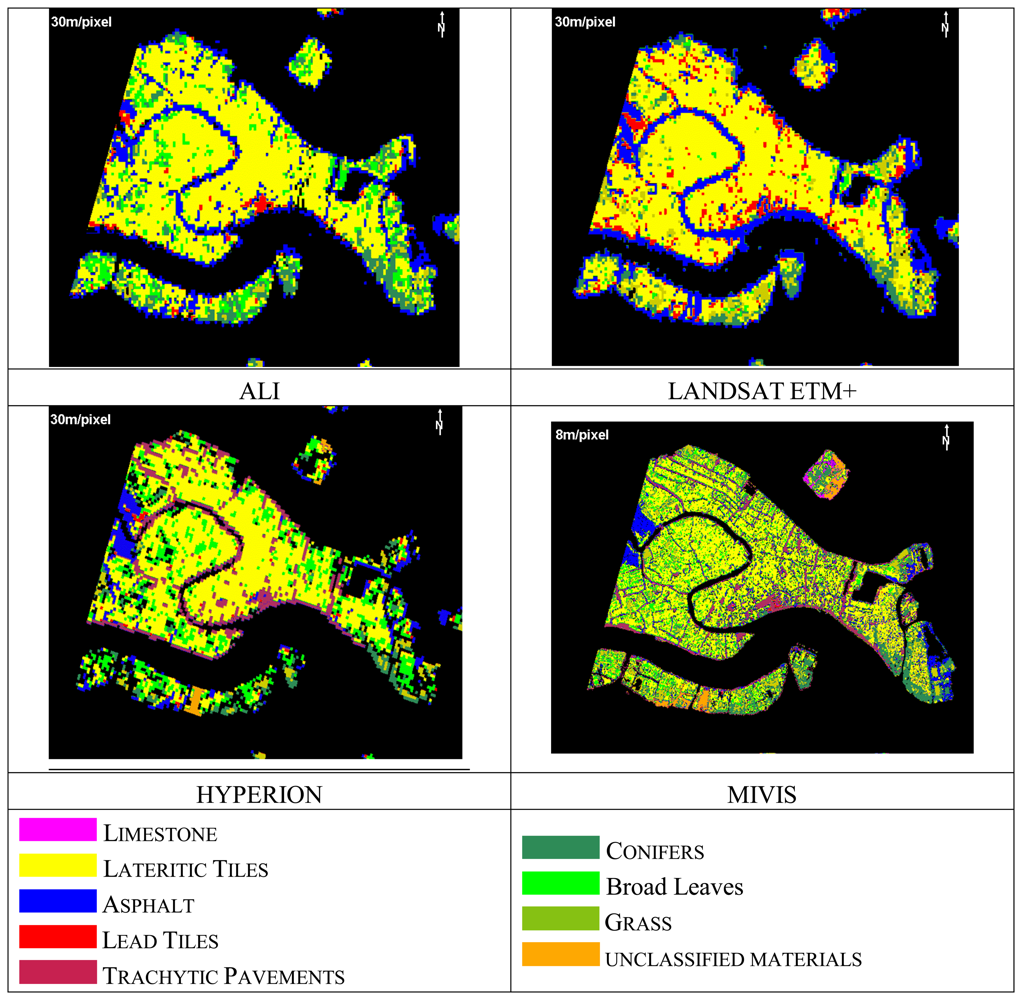
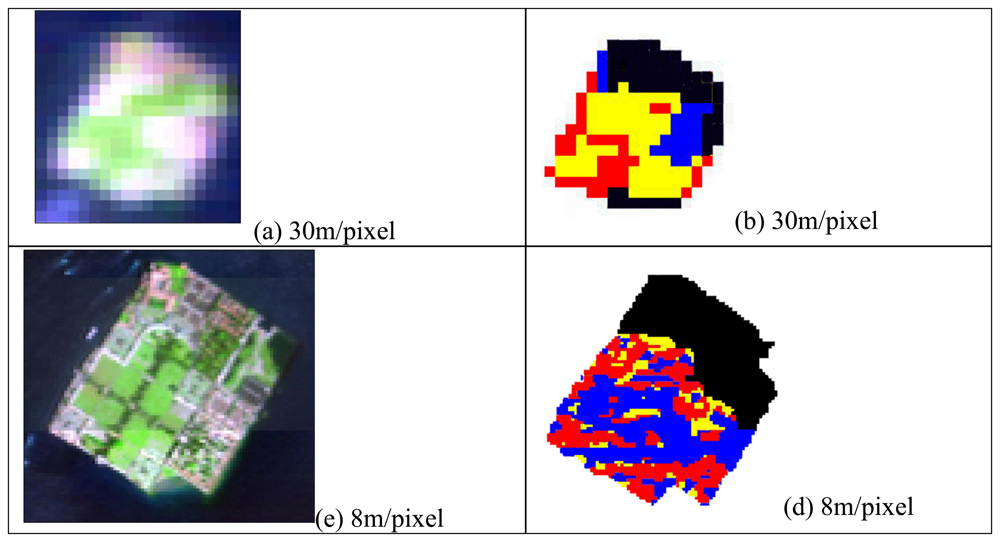
5.1. Image segmentation results
5.2. SAM classification results
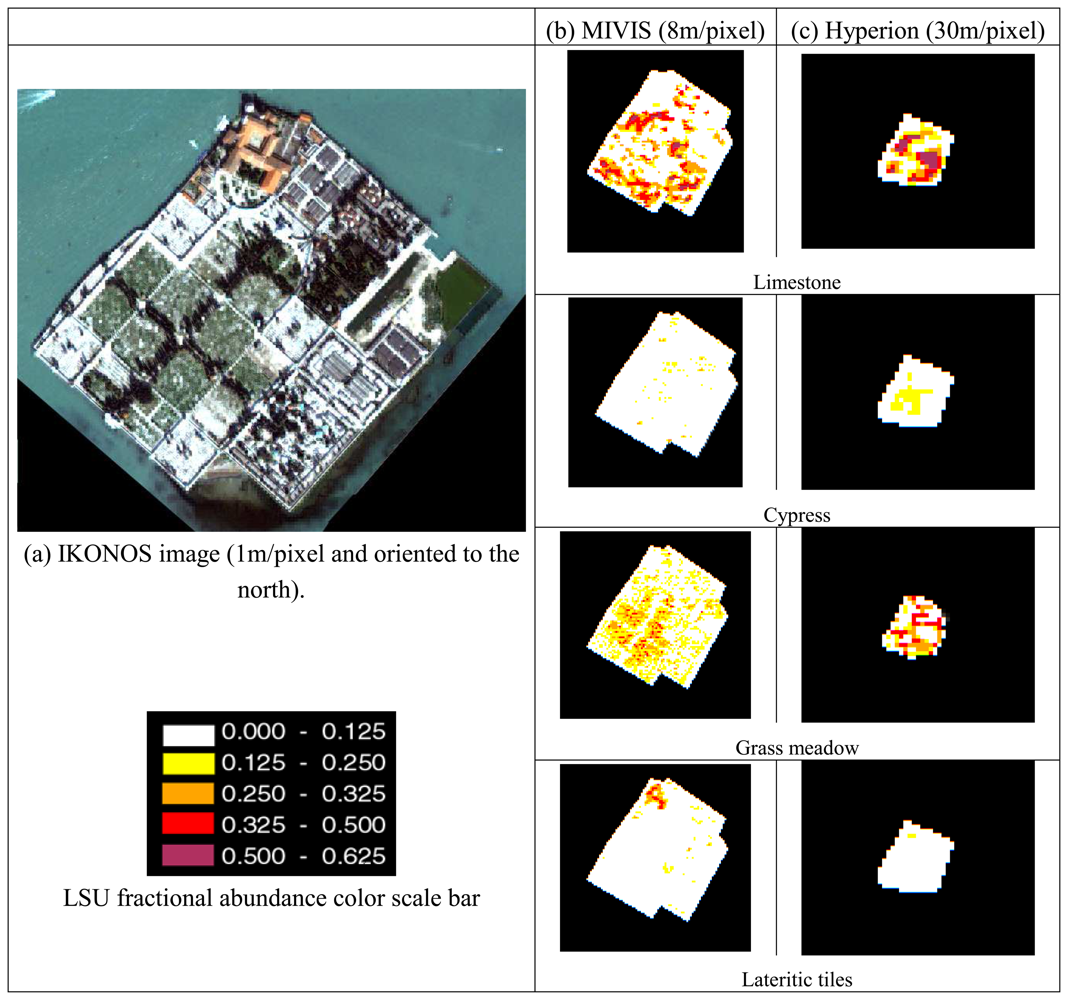
5.3. Spectral Analyses results
5.3.1. Material Detection Limit results
5.3.2. Band-Depth and Linear Spectral Unmixing results
6. Conclusions
Acknowledgments
References
- Bassani, C.; Cavalli, R.M.; Cavalcante, F.; Cuomo, V.; Palombo, A.; Pascucci, S.; Pignatti, S. Deterioration status of asbestos-cement roofing sheets assessed by analyzing hyperspectral data. Remote Sensing of Environment 2007, 109, 361–378. [Google Scholar]
- Ben-Dor, E.; Levin, N.; Saaroni, H. A spectral based recognition of the urban environment using the visible and near-infrared spectral region (0.4–1.1 m). A case study over Tel-Aviv. International Journal of Remote Sensing 2001, 22(11), 2193–2218. [Google Scholar]
- Berk, A.; Bernstein, L.S.; Anderson, G.P.; Acharya, P.K.; Robertson, D.C.; Chetwynd, J.H.; Adler-Golden, S.M. MODTRAN Cloud and Multiple Scattering Upgrades with Application to AVIRIS. Remote Sensing of the Environment 1998, 65, 367–375. [Google Scholar]
- Bianchi, R.; Marino, C.M.; Pignatti, S. Airborne hyperspectral remote sensing in Italy. Proceedings of Recent Advances in Remote Sensing and Hyperspectral Remote Sensing, Rome, Italy, September 23-30, 1994; pp. 29–37.
- Bokoye, A.I.; Dionne, P. Urban material characterization from the Hyperion hyperspectral imager: Application to downtown Montreal (Quebec, Canada). Image and signal processing for remote sensing. Conference No.9, Barcelona, ESPAGNE, (09/09/2003); 2004; 5238, pp. 569–574. [Google Scholar]
- Carlson, T.N.; Sanchez-Azofeifa, G.A. Satellite remote sensing of land use changes in and around San José, Costa Rica. Remote Sensing of Environment 1999, 70, 247–256. [Google Scholar]
- Chan, C.I. Hyperspectral Imaging: Techniques for Spectral Detection and Classification.; Kluwer Academic Publishers: Dordrecht, 2003. [Google Scholar]
- Clapham, W.B. Continuum-based classification of remotely sensed imagery to describe urban sprawl on a watershed scale. Remote Sensing of Environment 2003, 86, 322–340. [Google Scholar]
- Clark, R.N.; Roush, T.D. Reflectance Spectroscopy: Quantitative Analysis Techniques for Remote Sensing Applications. Journal of Geophysical Research 1984, 89, 6329–6340. [Google Scholar]
- Collwell, R.N. Manual of Remote Sensing; American Society of Photogrammetry and Remote Sensing: Falls Church Eds., 1983. [Google Scholar]
- Datt, B.; McVicar, T.R.; van Niel, T.G.; Jupp, D.L.B.; Pearlman, J.S. Preprocessing EO-1 Hyperion hyperspectral data to support the application of agricultural indexes. IEEE Transactions on Geoscience and Remote Sensing 2003, 41, 1246–1259. [Google Scholar]
- European Space Agency Scientific Campaign Unit ESTEC. Exploitation of CHRIS data from the Proba Mission for Science and Applications. In Experimenters' Handbook Issue 4: Baseline Programme; 1999; ESA-ESTEC. [Google Scholar]
- Forster, B.C. An examination of some problems and solutions in monitoring urban areas from satellite platforms. International Journal of Remote Sensing 1985, 6, 139–151. [Google Scholar]
- Gao, B. An operational method for estimating signal to noise ratios from data acquired with imaging spectrometers. Remote Sensing of Environment 1993, 43, 23–33. [Google Scholar]
- Heiden, U.; Roessner, S.; Segl, K.; Kaufmann, H. Analysis of spectral signatures of urban surfaces for their area-wide identification using hyperspectral HyMap data. Proceedings of IEEE -ISPRS Joint Workshop on Remote Sensing and Data Fusion over Urban Areas, Rome, Italy, November 8-9, 2001; pp. 173–177.
- Heiden, U.; Segl, K.; Roessner, S.; Kaufmann, H. Determination of robust spectral features for identification of urban surface materials in hyperspectral remote sensing data. Remote Sensing of Environment 2007, 111, 537–552. [Google Scholar]
- Hepner, G.F.; Chen, J. Investigation of imaging spectroscopy for discriminating urban land covers and surface materials. Proceedings of AVIRIS Earth Science and Applications Workshop, Palo Alto, CA, 27 Feb - 2 Mar 2001.
- Herold, M.; Gardner, M.; Roberts, D. Spectral resolution requirements for mapping urban areas. IEEE Transactions on Geoscience and Remote Sensing 2003, 41(9), 1907–1919. [Google Scholar]
- Herold, M.; Roberts, D.A.; Gardner, M.E.; Dennison, P.E. Spectrometry for urban area remote sensing. Development and analysis of a spectral library from 350 to 2400 nm. Remote Sensing of Environment 2004, (91), 304–319. [Google Scholar]
- Jensen, J.R. Introductory Digital Image Processing: A Remote Sensing PerspectiveUpper Saddle River, NJ; Prentice Hall, 3rd Ed. ed; 2005; 526 pages. [Google Scholar]
- Ji, M.; Jensen, J.R. Effectiveness of subpixel analysis in detecting and quantifying urban imperviousness from Landsat Thematic Mapper Imagery. Geocarto International 1999, 14, 31–39. [Google Scholar]
- Kirkland, L.E.; Kenneth, C.H.; Salisbury, J.W. Thermal Infrared spectral band detection limits for unidentified surface materials. Applied Optics 2001, 40(27), 4852–4864. [Google Scholar]
- Kirkland, L.E.; Herr, K.C.; Adams, P.M. Infrared stealthy surfaces: Why TES and THEMIS may miss some substantial mineral deposits on Mars and implications for remote sensing of planetary surfaces. Journal of Geophysical Research 2003, 108(E12), 5137. [Google Scholar]
- Kokaly, R.F.; Clark, R.N. Spectroscopic determination of leaf biochemistry using band-depth analysis of absorption features and stepwise multiple linear regression. Remote Sensing of Environment 1999, 67, 267–287. [Google Scholar]
- Kruse, F.A.; Lefkoff, A.B.; Boardman, J.B.; Heidebrecht, K.B.; Shapiro, A.T.; Barloon, P.J.; Goetz, A. F. H. The Spectral Image Processing System (SIPS) - Interactive Visualization and Analysis of Imaging spectrometer Data. Remote Sensing of the Environment 1993, 44, 145–163. [Google Scholar]
- ITT Visual Information Solutions. ENVI - Environment for Visualizing Images, Version 4.4. 2008. Available at: www.ittvis.com/envi/.
- Lhermitte, S.; Verbesselt, J.; Jonckheere, I.; Nackaerts, K.; van Aardt, J.A.N.; Verstraeten, W.W.; Coppin, P. Hierarchical image segmentation based on similarity of NDVI time series. Remote Sensing of Environment 2007, 112, 506–521. [Google Scholar]
- Mathieu, R.; Aryal, J.; Chong, A.K. Object-Based Classification of Ikonos Imagery for Mapping Large-Scale Vegetation Communities in Urban Areas. Sensors 2007, 7, 2860–2880. [Google Scholar]
- Matthew, M.W.; Adler-Golden, S.M.; Berk, A.; Richtsmeier, S.C.; Levine, R.Y.; Bernstein, L.S.; Acharya, P.K.; Anderson, G.P.; Felde, G.W.; Hoke, M.P.; Ratkowski, A.; Burke, H.H.; Kaiser, R.D.; Miller, D.P. Status of Atmospheric Correction Using a MODTRAN4-based Algorithm. In SPIE Proceedings; Algorithms for Multispectral, Hyperspectral, and Ultraspectral Imagery VI, 2000; pp. 199–207. [Google Scholar]
- Myint, S.W.; Lam, N.S.; Tyler, J.M. Wavelets for urban spatial feature discrimination: comparisons with fractal, spatial autocorrelation, and spatial co-occurrence approaches. Photogrammetric Engineering and Remote Sensing 2004, 70, 803–812. [Google Scholar]
- Pearlman, J.S.; Barry, P.S.; Segal, C.C.; Shepanski, J.; Beiso, D.; Carman, S.L. Hyperion, a space-based imaging spectrometer. IEEE Transactions on Geoscience and Remote Sensing 2003, 41, 1160–1173. [Google Scholar]
- Powell, R.L.; Roberts, D.A.; Dennison, P.E.; Hess, L.L. Sub-pixel mapping of urban land cover using multiple endmember spectral mixture analysis: Manaus, Brazil. Remote Sensing of Environment 2007, 106(2), 253–267. [Google Scholar]
- Pu, R.; Xu, B.; Gong, P. Oakwood crown closure estimation by unmixing Landsat TM data. Int. J. Remote Sensing 2003, 24(22), 4433–4445. [Google Scholar]
- Rashed, T.; Weeks, J.R.; Stow, D.; Fugate, D. Measuring temporal compositions of urban morphology through spectral mixture analysis: Towards a soft approach to change analysis in crowded cities. International Journal of Remote Sensing 2005, 26, 699–718. [Google Scholar]
- Richards, J.A. Remote Sensing Digital Image Analysis.; Springer-Verlag: Berlin, 1999; p. 240. [Google Scholar]
- Ridd, M.K. Exploring a V–I–S (vegetation–impervious surface–soil) model for urban ecosystem analysis through remote sensing: comparative anatomy for cities. International Journal of Remote Sensing 1995, 16, 2165–2185. [Google Scholar]
- Settle, J.J.; Drake, N.A. Linear mixing and estimation of ground cover proportions. International Journal of Remote Sensing 1993, 14(6), 1159–1177. [Google Scholar]
- Small, C. Scaling Properties of Urban Reflectance Spectra. Proceeding of AVIRIS Earth Science and Applications Workshop, Pasadena, CA, 27 Feb -2 Mar, 2001.
- Small, C. High spatial resolution spectral mixture analysis of urban reflectance. Remote Sensing of Environment 2003, 88, 170–186. [Google Scholar]
- Small, C. A global analysis of urban reflectance. International Journal of Remote Sensing 2005, 26, 661–681. [Google Scholar]
- Smith, G.M.; Curran, P.J. Methods for estimating image signal-to-noise ratio (SNR). Atkinson, P.M., Tate, N. J., Eds.; In Advances in remote sensing and GIS analysis; pp. 61–74. New York; John Wiley & Sons, 1999. [Google Scholar]
- Stuckens, J.; Coppin, P.R.; Bauer, M.E. Integrating contextual information with per-pixel classifications for improved land cover classifications. Remote Sensing of Environment 2000, 71, 282–296. [Google Scholar]
- Tou, J.T.; Gonzalez, R.C. Pattern Recognition Principles; Addison-Wesley Publishing Company: Reading, Massachusetts, 1974. [Google Scholar]
- Toutin, T. Error Tracking in Ikonos Geometric Processing Using a 3D Parametric Model. Photogrammetric Engineering and Remote Sensing 2003, 69(1), 43–51. [Google Scholar]
- Ungar, S. G.; Pearlman, J. S.; Mendenhall, J. A.; Reuter, D. Overview of the Earth Observing One (EO-1) mission. IEEE Transactions on Geoscience and Remote Sensing 2003, 41, 1149–1159. [Google Scholar]
- Van Der Meer, F.D.; De Jong, S. Imaging Spectrometry, Basic Principles and Prospective Applications; 2003; Kluwer Academic Publishers: Dordrecht. [Google Scholar]
- Vermote, E.F.; El Saleous, N.; Justice, C.O.; Kaufman, Y.J.; Privette, J.L.; Remer, L. Asbestos: Geology, Mineralogy, Mining, and Uses. U.S. Department of the Interior; U.S. Geological Survey, Open-File Report 02-149, 1997. Available: http://minerals.usgs.gov/minerals/pubs/commodity/asbestos/ (accessed:02/2008).
- Wu, C. Normalized spectral mixture analysis for monitoring urban composition using ETM+ imagery. Remote Sensing of Environment 2004, 93, 480–492. [Google Scholar]

| Spatial Resolution (m) | Bands | Spectral coverage (μm) | System of Acquisition | Radiometric calibration | |
|---|---|---|---|---|---|
| (a) ALI | 10-30 | 10 | 0.4-2.4 | Push-broom | L1R |
| (b) HYPERION | 30 | 220 | 0.4-2.5 | Push-broom | L1R |
| (c) ETM+ | 30 | 8 | 0.4-12.5 | Push-broom | L1R |
| (d) IKONOS | 1 | 4 | 0.4-0.7 | Push-broom | |
| (e) MIVIS | 8 (at 4000m) | 102 | 0.4-12.7 | Whisk-broom | CNR-LARA |
| VIS | 20 | 0.4-0.83 | |||
| VNIR | 8 | 1.15-1.55 | |||
| SWIR | 64 | 2-2.5 | |||
| TIR | 10 | 8.2-12.7 | |||
| Conifers | Broadleaves | Grass | Lateritic STiles | Lead Tiles | Limestone | Asphalt pavements | Trachyte pavements | Other materials | |
|---|---|---|---|---|---|---|---|---|---|
| MIVIS | 13.9 | 2.3 | 2.3 | 53.9 | 1.6 | 1.4 | 7.7 | 10.4 | 6.6 |
| IKONOS ground truth | 17.8 | 52.4 | 1.9 | 1.0 | 5.4 | 12.3 | 9.2 | ||
| Vegetation % | Roofing Tiles % | Paving materials % | Other materials % | |
|---|---|---|---|---|
| ALI | 22.5 | 71.7 | 3 | 2.8 |
| ETM+ | 22.3 | 71.12 | 4.22 | 2.36 |
| Hyperion | 18.72 | 60.3 | 15.16 | 5.82 |
| MIVIS | 20.31 | 51.23 | 26.27 | 2.19 |
| IKONOS Ground truth | 17.8 | 52.4 | 20.6 | 9.2 |
| VEGETATION | ROOFING MATERIALS | PAVING MATERIALS | OTHER MATERIS | ||||||
|---|---|---|---|---|---|---|---|---|---|
| Conifers | Broadleaves | Grass | Lateritic Tiles | Lead Tiles | Limestone | Asphalt pavements | Trachyte pavements | ||
| ALI | 10.3 | 11.3 | 3.2 | 54.2 | 2.2 | 16.7 | 2.1 | ||
| ETM+ | 7.8 | 2.8 | 7.9 | 51.0 | 8.0 | 11.1 | 114 | ||
| Hyperion | 7.7 | 17.6 | 3.5 | 48.2 | 1.5 | 0.7 | 7.1 | 7.9 | 5.8 |
| MIVIS | 12.3 | 4.9 | 4.0 | 49.7 | 1.7 | 1.6 | 7.1 | 8.5 | 10.2 |
| IKONOS ground-truh | 17.8 | 52.4 | 1.9 | 1.0 | 5.4 | 12.3 | 9.2 | ||
| Limestone d = 0,48 | New Lateritic Tiles d = 0,02 | Asphalt d = 0,08 | ||||
|---|---|---|---|---|---|---|
| MIVIS | Hyperion | MIVIS | Hyperion | MIVIS | Hyperion | |
| BDL % | 10,47 | 5,17 | 3,64 | 3,63 | 17,98 | 8,17 |
| fmin% | 21,99 | 10,85 | > 100 | > 100 | > 100 | > 100 |
| MDA (m2) | 14 | 98 | > pixel | > pixel | > pixel | > pixel |
| Correlation | MIVIS | ||||
|---|---|---|---|---|---|
| Coefficient | Limestone | Grass | Cypress | Tiles | |
| Ground Truth | Limestone | 0.45 | 0.39 | 0.02 | 0.05 |
| Grass | 0.42 | 0.75 | 0.22 | 0.16 | |
| Cypress | 0.18 | 0.30 | 0.43 | 0.11 | |
| Tiles | 0.00 | 0.04 | 0.09 | 0.42 | |
| Correlation | Hyperion | ||||
| Coefficient | Limestone | Grass | Cypress | Tiles | |
| Ground Truth | Limestone | 0.68 | 0.32 | 0.16 | 0.22 |
| Grass | 0.40 | 0.56 | 0.55 | 0.09 | |
| Cypress | 0.30 | 0.53 | 0.40 | 0.10 | |
| Tiles | 0.07 | 0.12 | 0.00 | 0.53 | |
© 2008 by the authors; licensee Molecular Diversity Preservation International, Basel, Switzerland. This article is an open access article distributed under the terms and conditions of the Creative Commons Attribution license ( http://creativecommons.org/licenses/by/3.0/).
Share and Cite
Cavalli, R.M.; Fusilli, L.; Pascucci, S.; Pignatti, S.; Santini, F. Hyperspectral Sensor Data Capability for Retrieving Complex Urban Land Cover in Comparison with Multispectral Data: Venice City Case Study (Italy). Sensors 2008, 8, 3299-3320. https://doi.org/10.3390/s8053299
Cavalli RM, Fusilli L, Pascucci S, Pignatti S, Santini F. Hyperspectral Sensor Data Capability for Retrieving Complex Urban Land Cover in Comparison with Multispectral Data: Venice City Case Study (Italy). Sensors. 2008; 8(5):3299-3320. https://doi.org/10.3390/s8053299
Chicago/Turabian StyleCavalli, Rosa Maria, Lorenzo Fusilli, Simone Pascucci, Stefano Pignatti, and Federico Santini. 2008. "Hyperspectral Sensor Data Capability for Retrieving Complex Urban Land Cover in Comparison with Multispectral Data: Venice City Case Study (Italy)" Sensors 8, no. 5: 3299-3320. https://doi.org/10.3390/s8053299
APA StyleCavalli, R. M., Fusilli, L., Pascucci, S., Pignatti, S., & Santini, F. (2008). Hyperspectral Sensor Data Capability for Retrieving Complex Urban Land Cover in Comparison with Multispectral Data: Venice City Case Study (Italy). Sensors, 8(5), 3299-3320. https://doi.org/10.3390/s8053299