Classifying Oriental Beech (Fagus orientalis Lipsky.) Forest Sites Using Direct, Indirect and Remote Sensing Methods: A Case Study from Turkey


Abstract
:1. Introduction
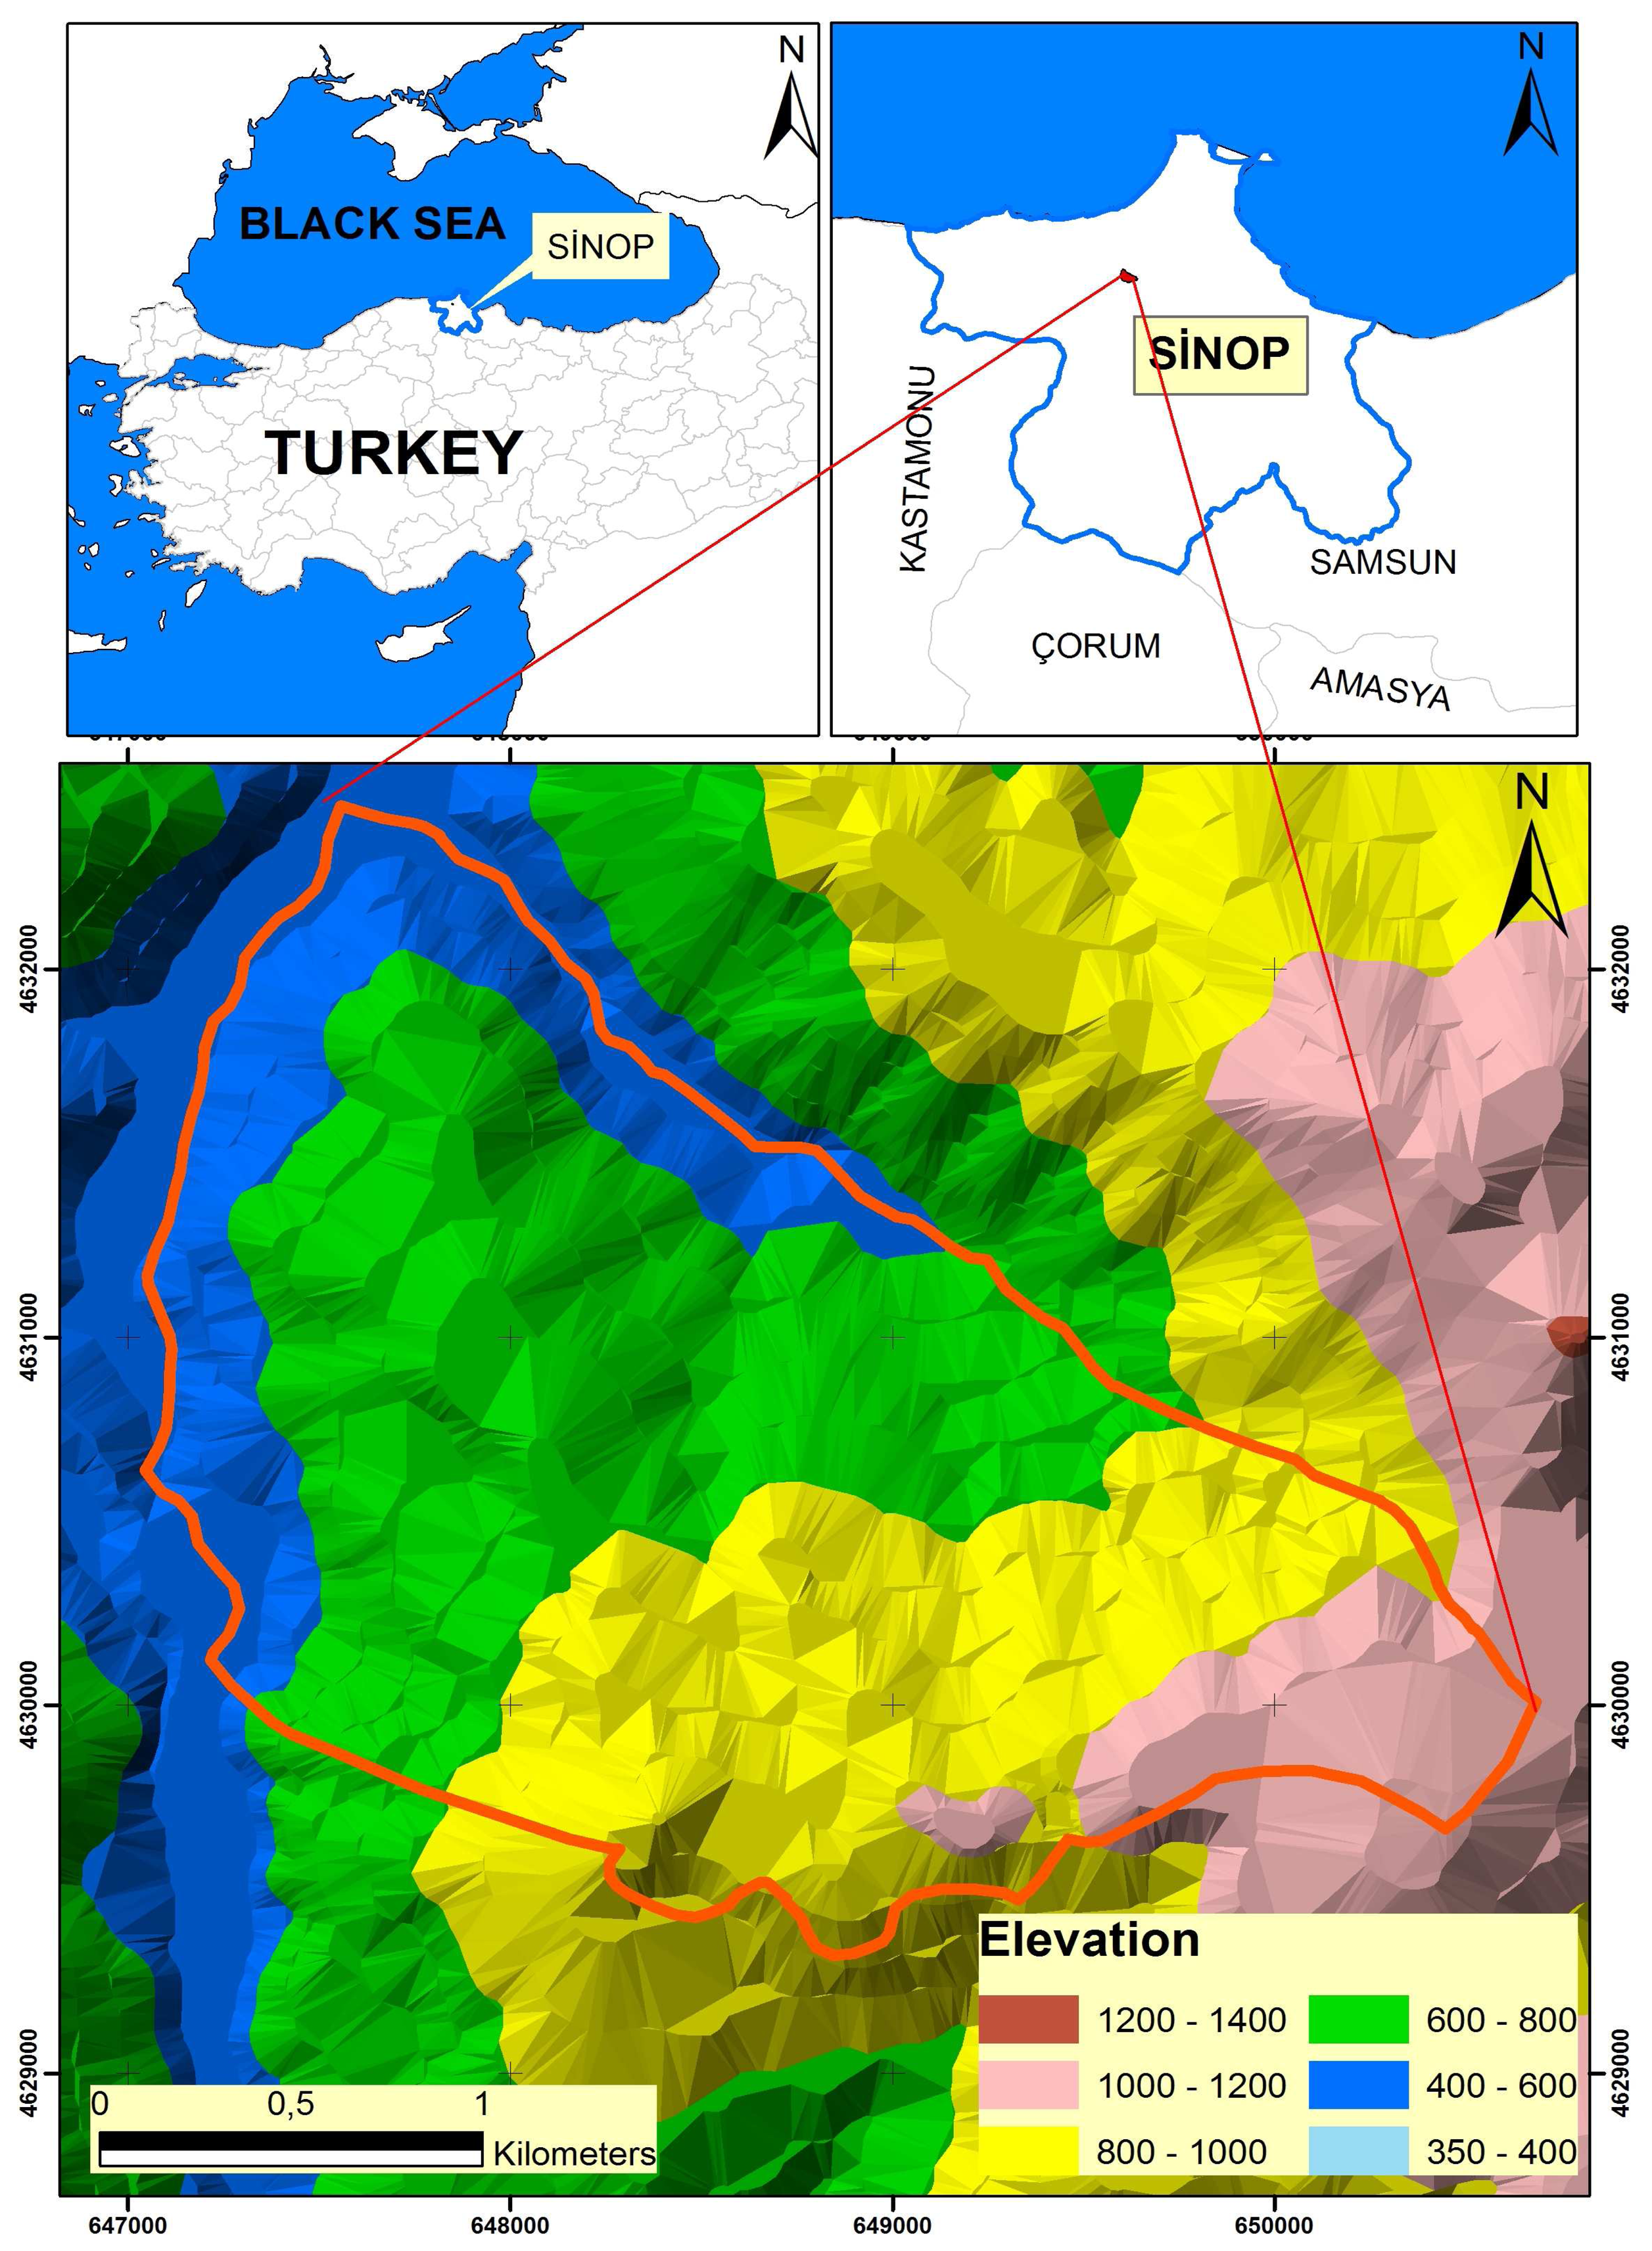
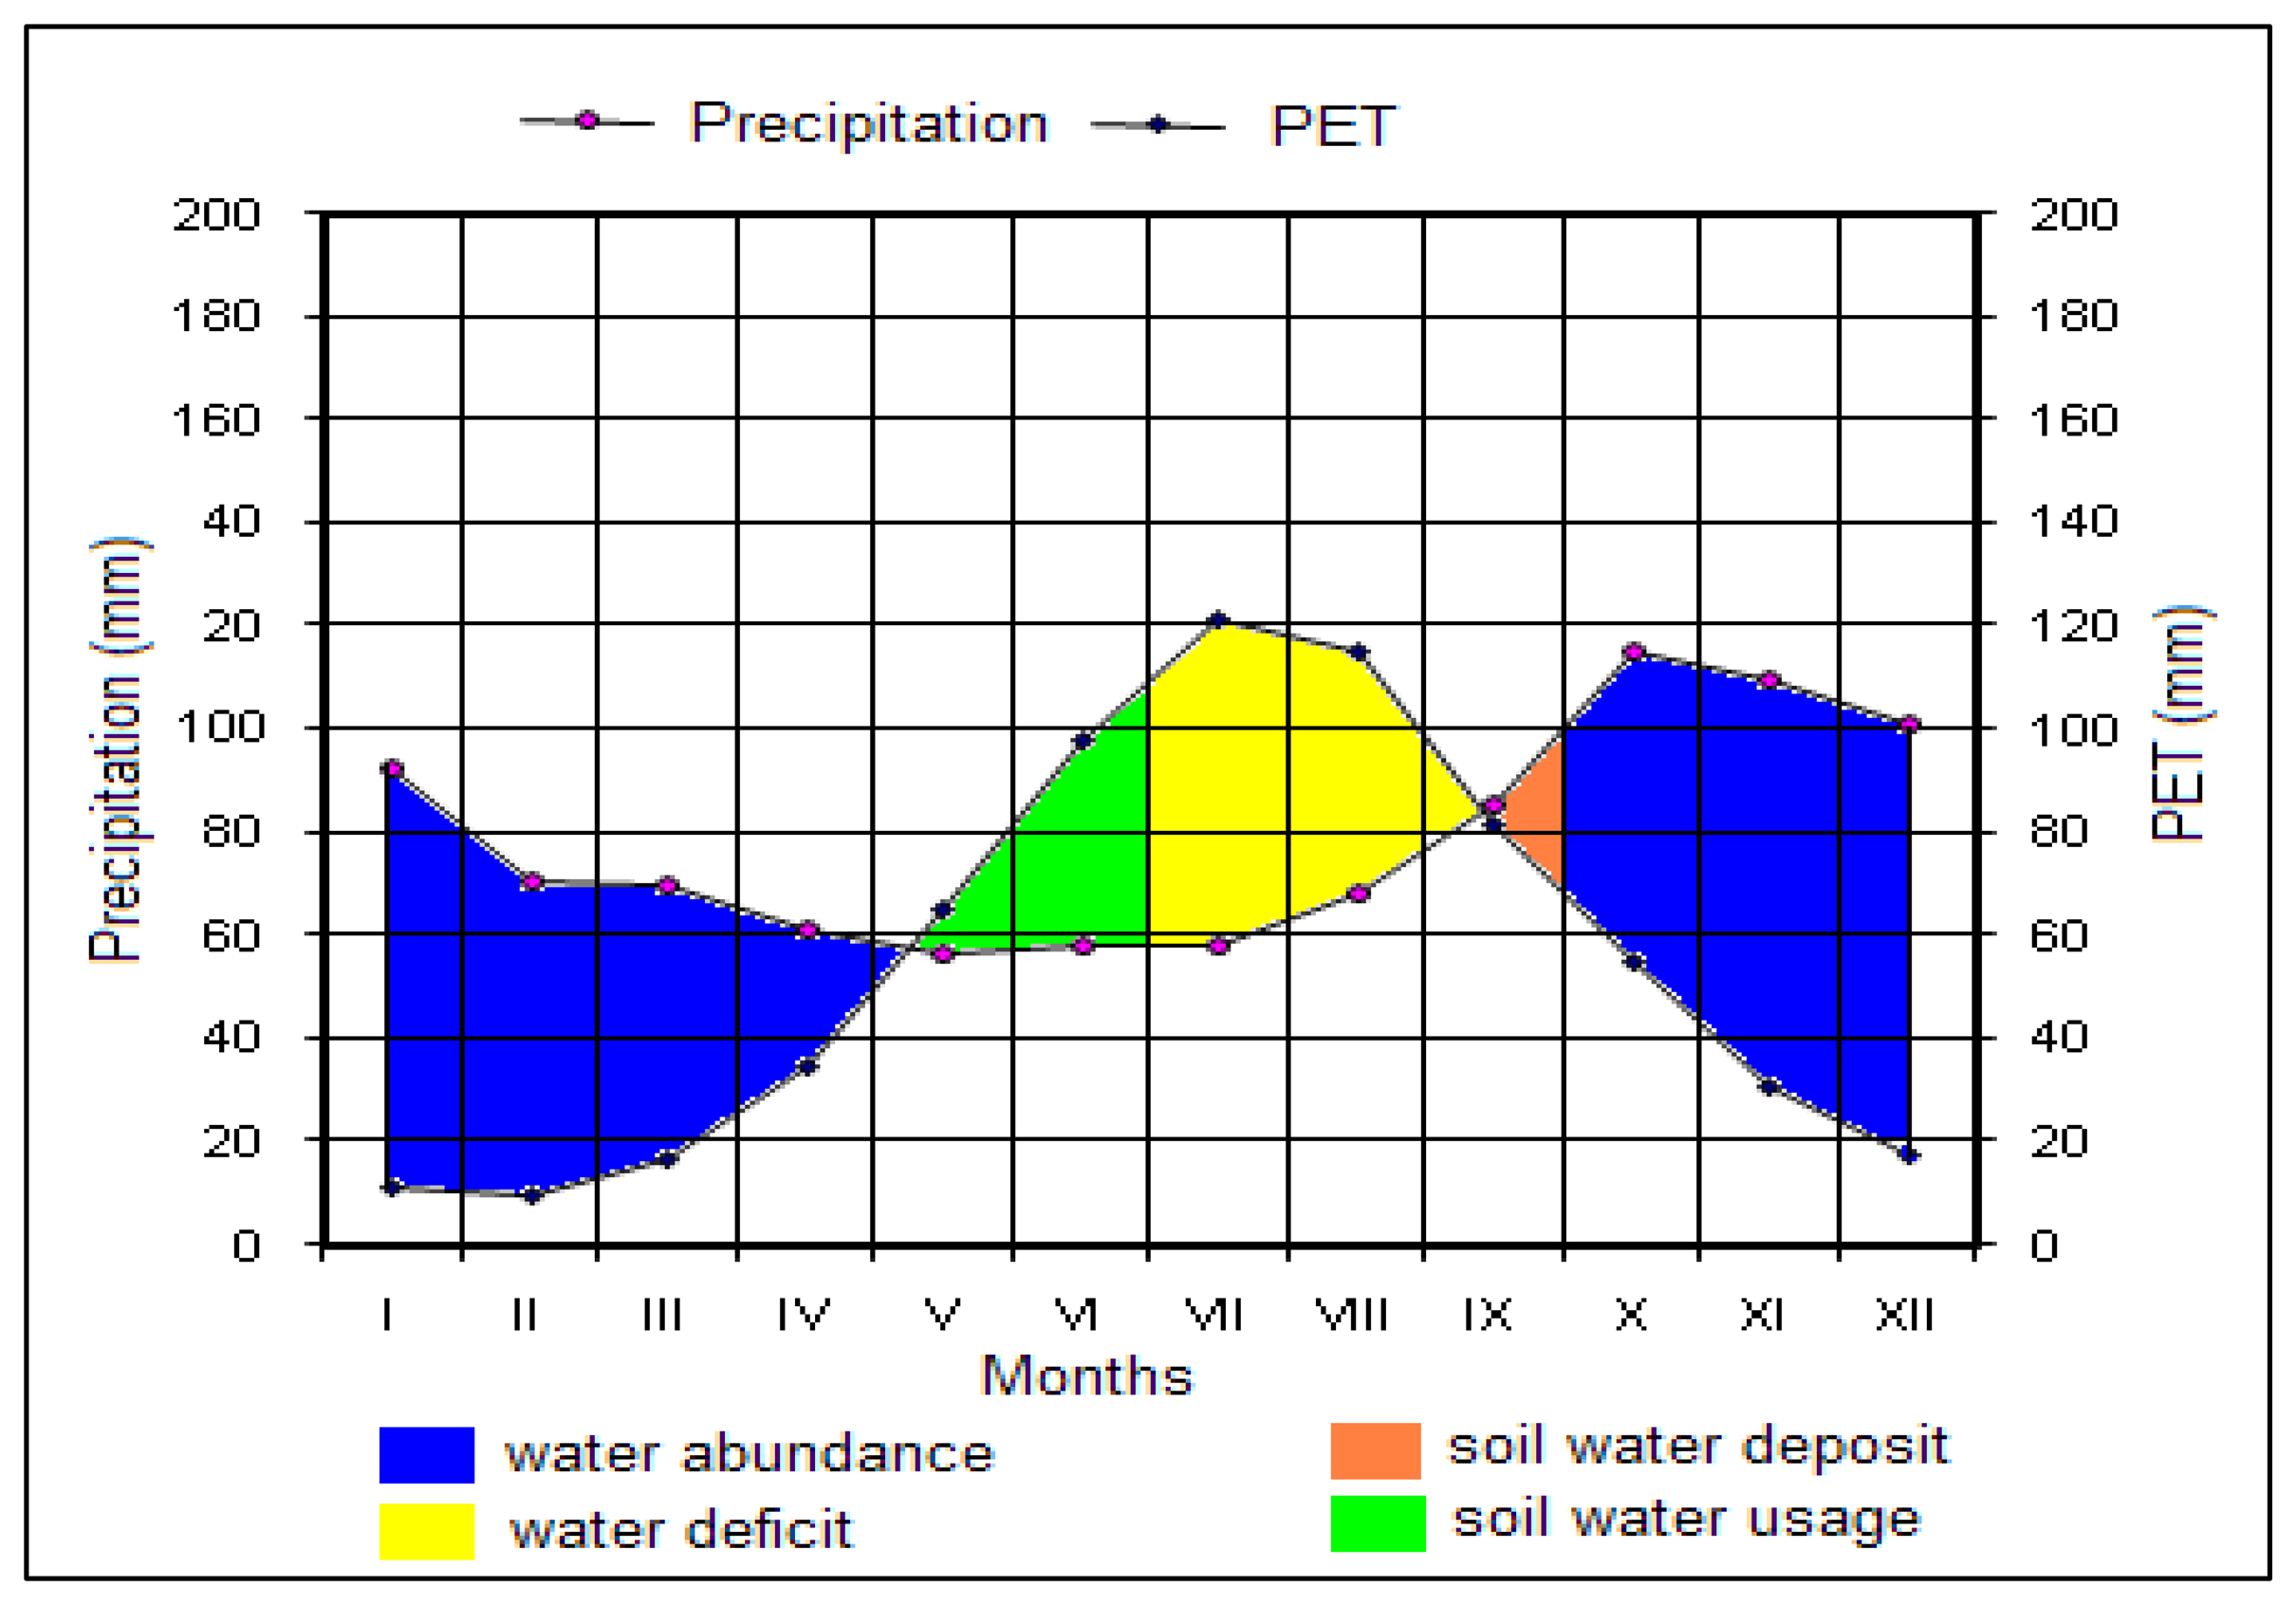
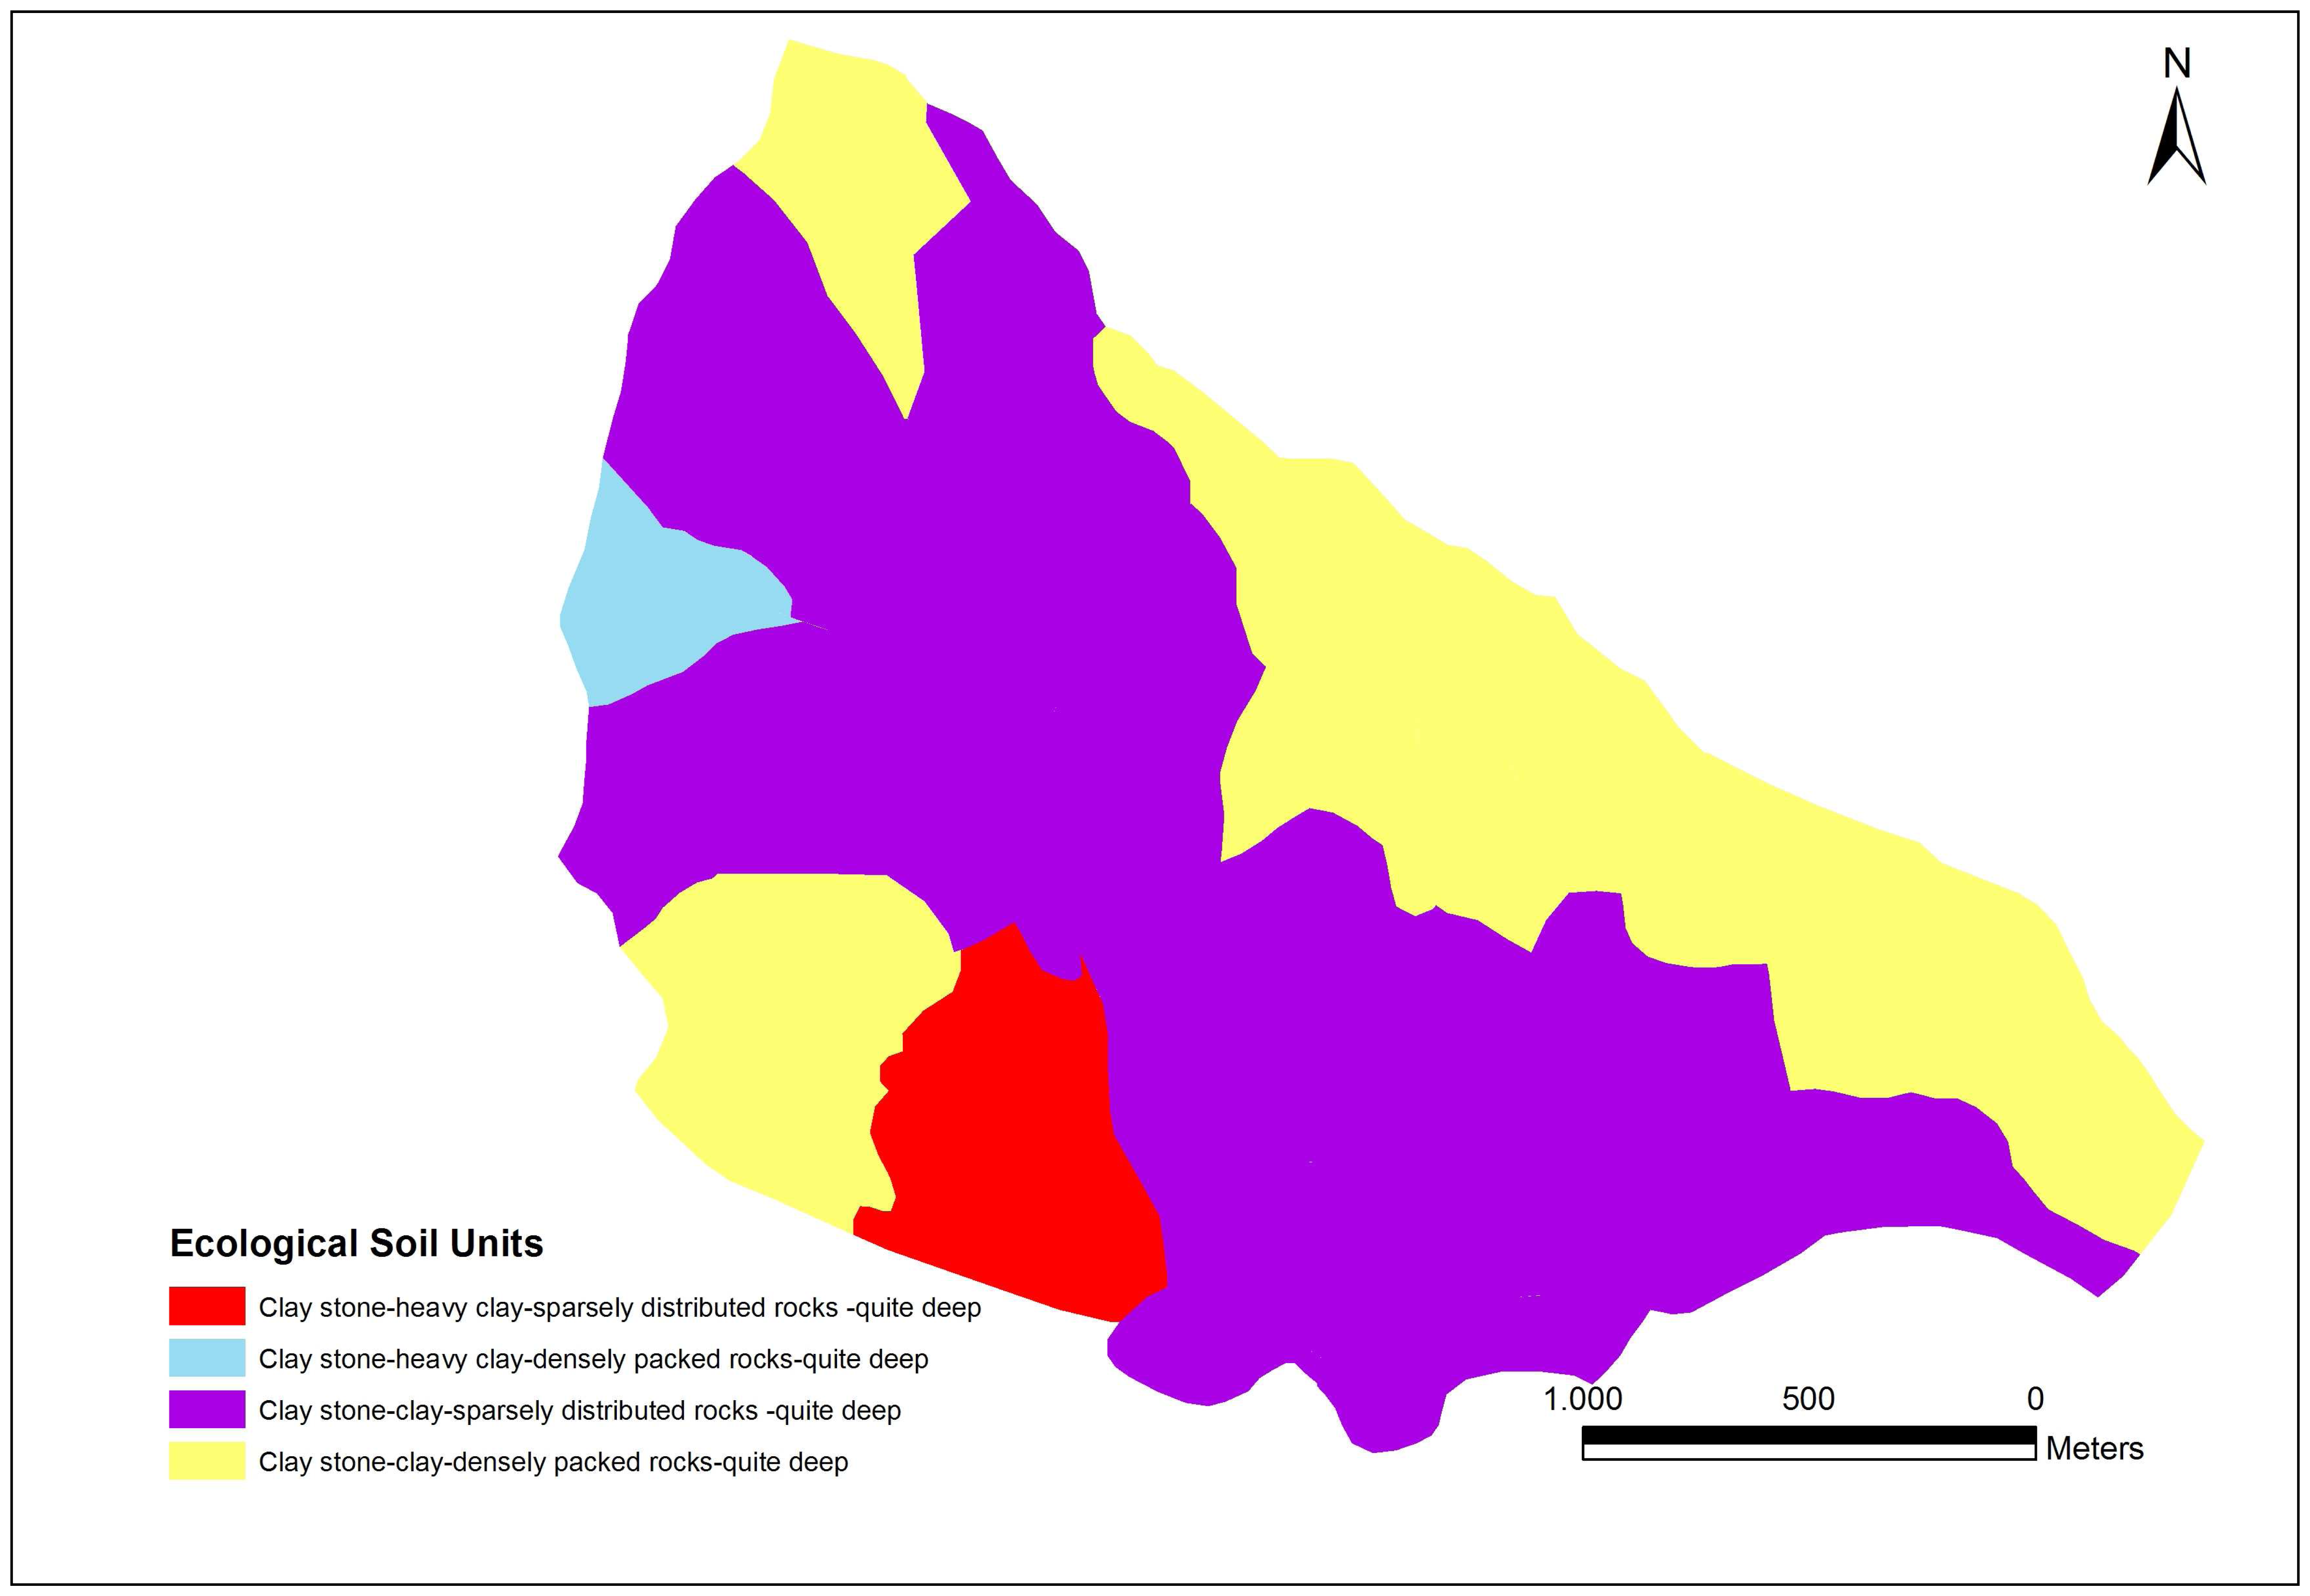
2. Study Area
3. Dataset
4. Methods
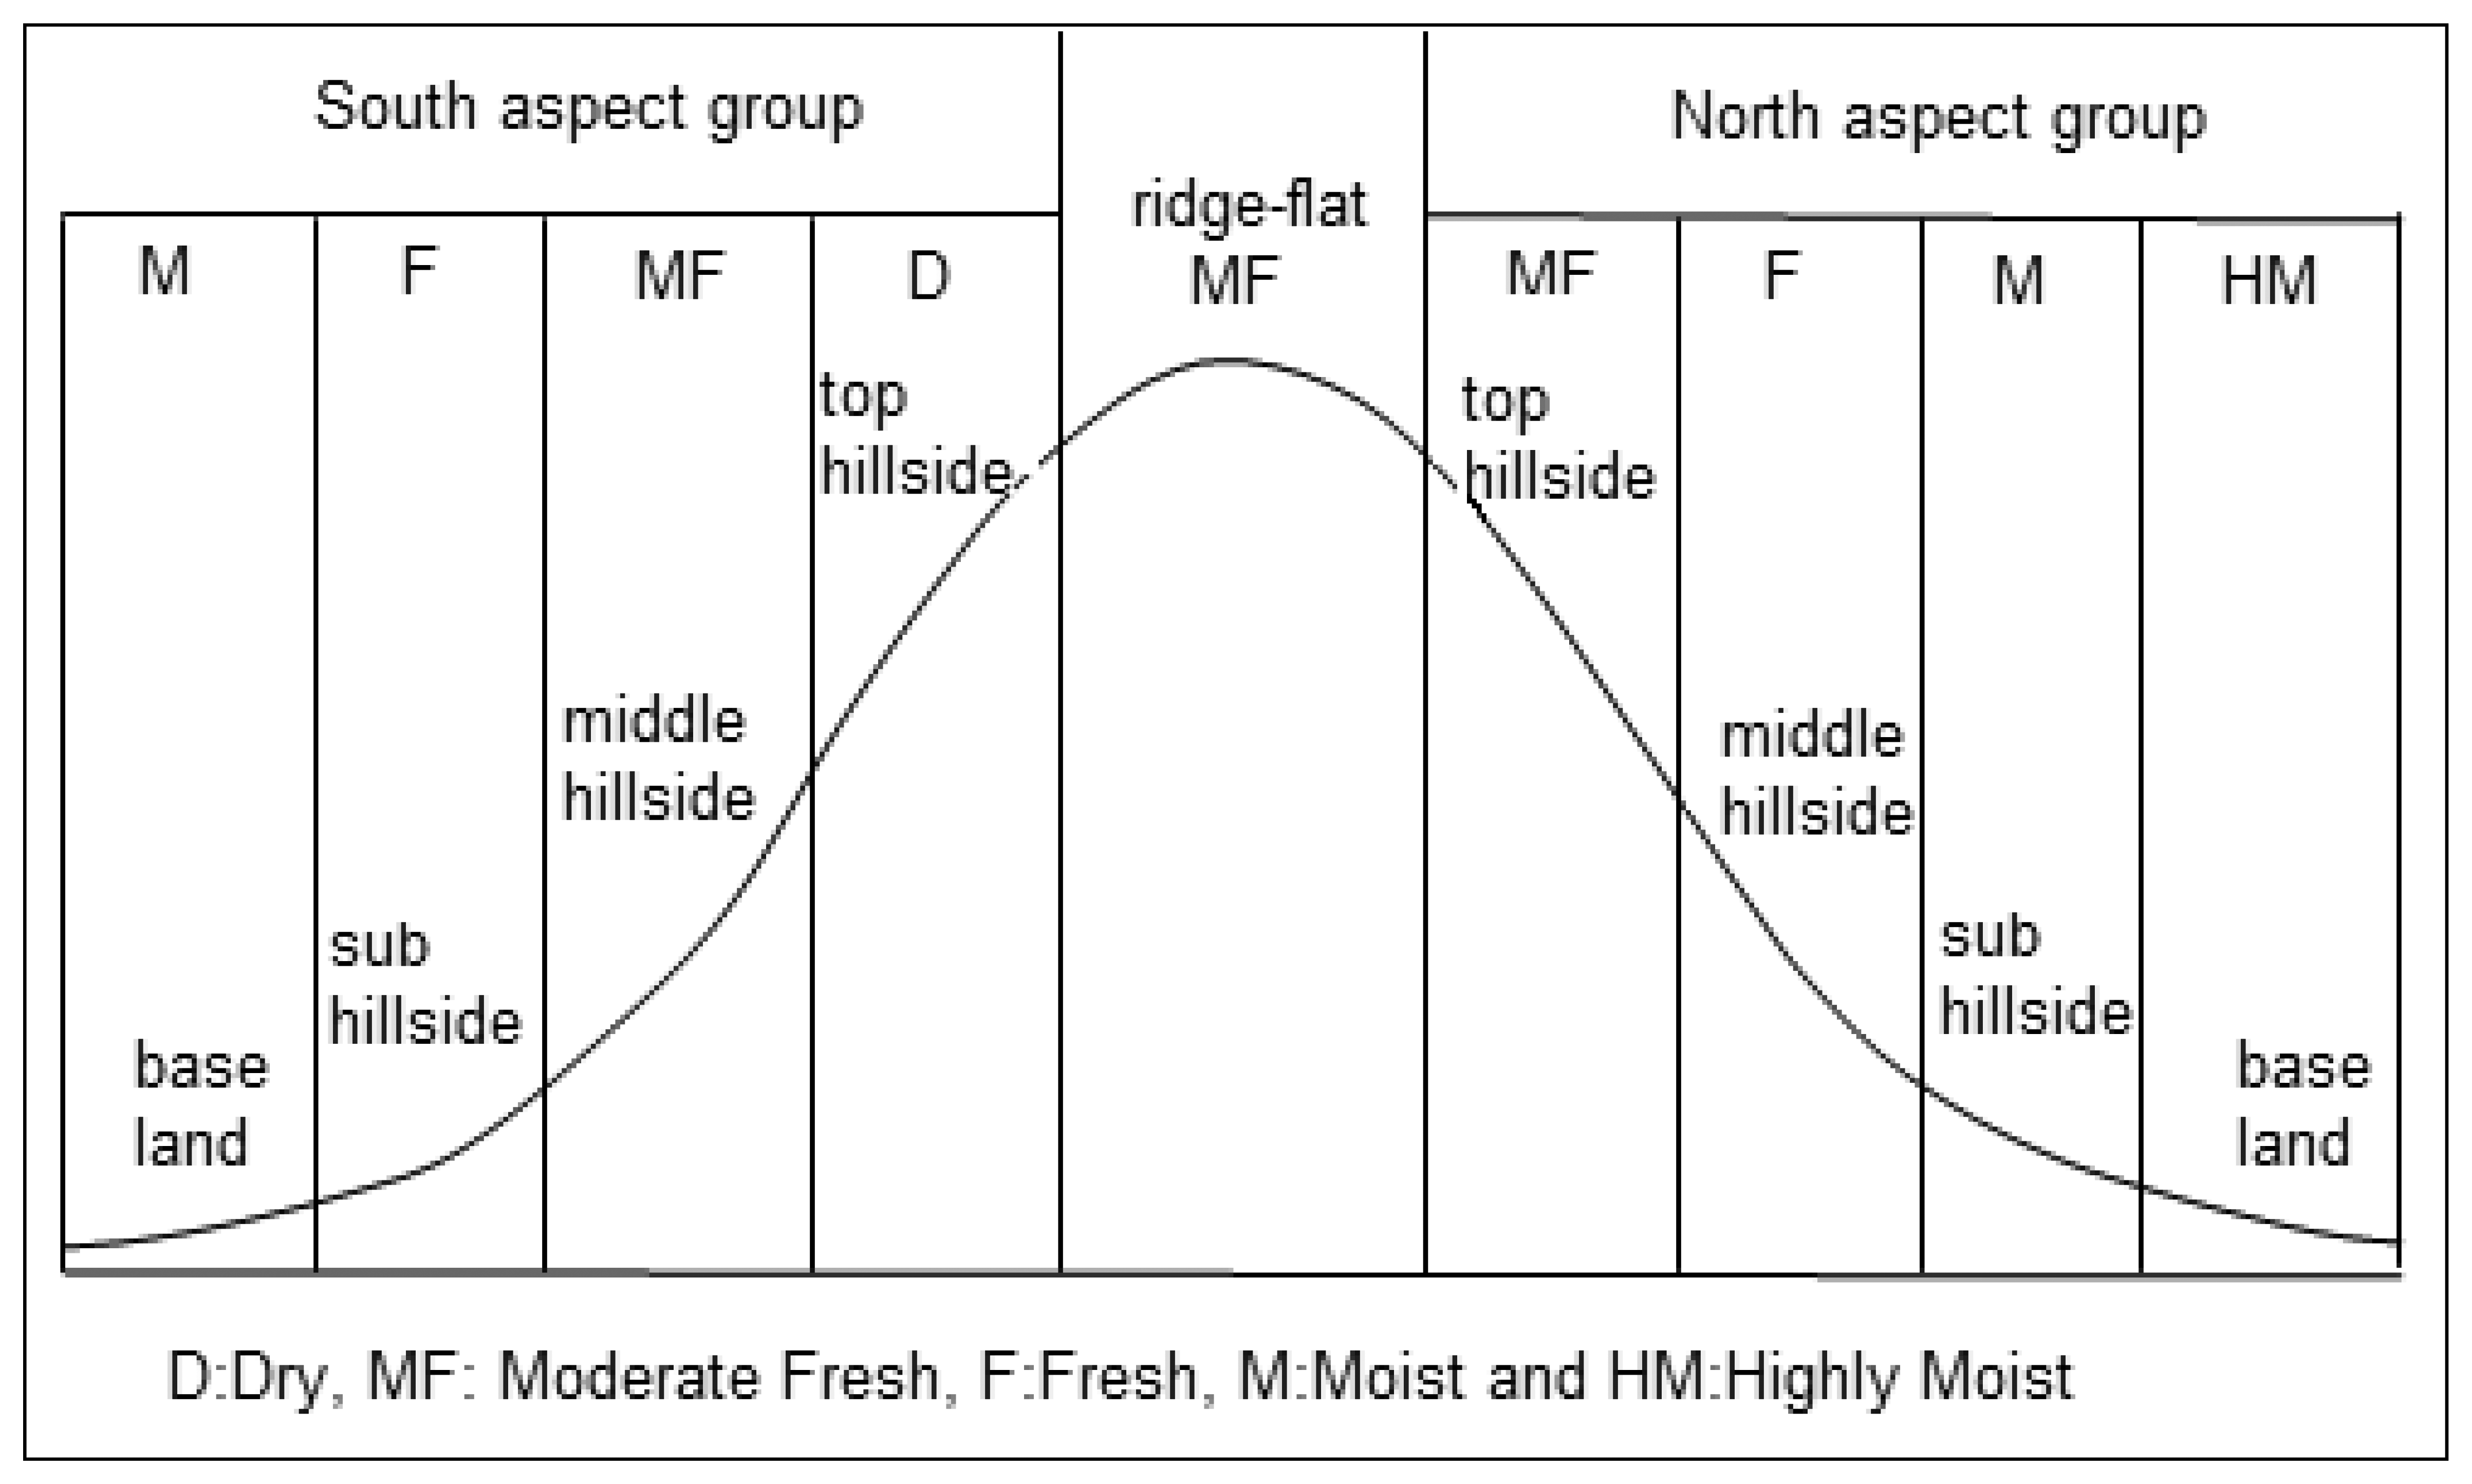
4.1. Direct Method
4.2. Indirect (SI) method
4.3. Remote Sensing Method
4.4. Statistical Analysis
5. Results and Discussion
6. Conclusions
Acknowledgments
References
- Skovsgaard, J.P.; Vanclay, J.K. Forest site productivity: a review of the evolution of dendrometric concepts for even-aged stands. Forestry 2007, 81, 13–31. [Google Scholar]
- Dieguez-Aranda, U.; Grandas-Arias, J.A.; Alvarez-Gonzalez, J.G.; Von Gadow, K. Site quality curves for Birch Stands in North-Western Spain. Silva Fenn. 2006, 40(4), 631–644. [Google Scholar]
- Hägglund, B. Evaluation of forest site productivity. Forestry. Abstr. 1981, 42, 515–527. [Google Scholar]
- Vanclay, J.K. Modelling Forest growth and yield: applications to mixed tropical forests; CAB International: Wallingford, 1994. [Google Scholar]
- Avery, T.E.; Burkhart, H.E. Forest Measurements, 5th edn; McGraw-Hill: New York, 2002. [Google Scholar]
- Skovsgaard, J.P. Forest measurements. Encycl. For. Sci. 2004, 2, 550–566. [Google Scholar]
- Burger, J.A. Soil and its relationship to forest productivity and health. Encycl. For. Sci. 2004, 3, 1189–1195. [Google Scholar]
- Altun, L.; Baskent, E.Z.; Gunlu, A.; Kadiogullari, A.İ. Classification and mapping forest sites using geographic information system (GIS): a case study in Artvin Province. Environ. Monitor. Assess. 2008, 137, 149–161. [Google Scholar]
- Gunlu, A.; Baskent, E.Z.; Kadiogullari, A.İ.; Altun, L. Forest site lassification using Landsat 7 ETM data; A case study of Maçka-Ormanüstü Forest, Turkey. Environ. Monitor. Assess. 2008. In press. [Google Scholar]
- Baskent, E.Z.; Barli, O.; Ayaz, H.; Bilgili, E.; Turna, I.; Ipek, A.; Altun, L. A new approach to restructure Turkish Forest Sector. Part I. Journal of Forest and Prey 2003, 6, 31–38. [Google Scholar]
- Anonymous. Sinop meteorology station climate data.; 2005. [Google Scholar]
- Altun, L. The role of site factors in distinguishing forest sites in Trabzon-Maçka Ormanustu forest. PhD thesis, Karadeniz Technical University, The Graduate School of Natural and Applied Sciences, Trabzon: Turkey, 1995. [Google Scholar]
- Kantarci, M.D. Investigating forest soil types and forest site classification mapping in Belgrad forests. Istanbul University; In Journal of Forestry Faculty; Istanbul: Turkey, 1980; p. 350. [Google Scholar]
- Bakkaloglu, M. Classification and mapping of forest sites in Gumushane-Karanlıkdere Forest District. PhD thesis, Karadeniz Technical University, The Graduate School of Natural and Applied Sciences, Trabzon: Turkey, 2003. [Google Scholar]
- Gunlu, A. A study about distinguishing and mapping forest site in Artvin-Genya mountain, Turkey. MScF thesis, Karadeniz Technical University, The Graduate School of Natural and Applied Sciences, Trabzon: Turkey, 2003. [Google Scholar]
- Cepel, N. Practical base of forest sites introduction and forest site map.; Kurtulmuş Press: Istanbul, Turkey, 1966. [Google Scholar]
- Cepel, N. Forest Ecology; Istanbul University, Faculty of Forestry: Istanbul: Turkey, 1988; p. 536. [Google Scholar]
- Erinc, S. Climatology and methods; Istanbul University, Oceanography and Geography Institute: Istanbul: Turkey, 1984; p. 540. [Google Scholar]
- Kantarci, M.D. Soil Science; Istanbul University, Faculty of Forestry: Istanbul, 2000; p. 420. [Google Scholar]
- Wang, G.G. Is height of dominant trees at a reference diameter an adequate measure of site quality? For. Ecol. Manage. 1998, 80, 95–105. [Google Scholar]
- Davis, L.S.; Johnson, K.N.; Bettinger, P.S.; Howard, T.E. Forest management, to sustain ecological, economic and social valuesMcGraw Hill Series in Forest Resources, 4th ed; New York, 2001. [Google Scholar]
- Carus, S. Increment and growth in even aged beech (Fagus orientalis Lippsky.) forests. Postgraduate Thesis, The Graduate School of Natural and Applied Sciences, Istanbul University, Istanbul, Turkey, 1998. [Google Scholar]
- Clutter, J.L.; Fortson, J.C.; Pienaar, L.V.; Brister, G.H.; Bailey, R.L. Timber Management: A Quantitative Approach; Wiley: New York, 1983. [Google Scholar]
- ESRI. Using ArcMap; Environmental Systems Research Inc.: Redlands, 1999. [Google Scholar]
- Erdas Field Guide, 6th ed; Erdas LLC: Atlanta, Georgia, 2002.
- SPSS Institute Inc. SPSS Base 15.0 User’s Guide; 2007. [Google Scholar]
- Norušis, M.J. Guide to Data Analysis; Prentice-Hall: Upper Saddle River, NJ, 1998. [Google Scholar]
- Siegel, S.; Castellan, N.J. Nonparametric Statistics for the Behavioural Sciences; McGraw-Hill: New York, 1988. [Google Scholar]


| Index value | Forest site classification | Site index |
|---|---|---|
| < 8 | Very Dry (VD) | IV-V |
| 8-15 | Dry (D) | |
| 15-23 | Moderate Fresh (MF) | III |
| 23-40 | Fresh (F) | |
| 40-55 | Humid (H) | I-II |
| >55 | Hygric (Hy) | |
| Direct Method | Total (ha) | RSM (Landsat 7 ETM satellite image) | SI Method** | |||||||||
|---|---|---|---|---|---|---|---|---|---|---|---|---|
| Forest Site* | Forest Site | |||||||||||
| D | MF | F | M | HM | I | II | III | IV | V | ND | ||
| D | 19.0 | 14.9 | 0.8 | 1.9 | 1.4 | - | - | - | - | 19.0 | - | |
| MF | 29.2 | 2.5 | 10.4 | 11.2 | 3.2 | 1.9 | 10.7 | - | 18.5 | - | - | |
| F | 338.8 | 32.8 | 56.7 | 168.1 | 58.7 | 22.5 | 29.6 | 53.3 | 240.5 | - | - | 15.4 |
| M | 171.0 | 15.2 | 30.5 | 55.0 | 55.9 | 14.4 | 125.2 | 24.2 | 21.6 | - | - | |
| HM | 42.0 | 4.0 | 8.0 | 8.6 | 15.0 | 6.4 | 20.4 | - | 21.6 | - | - | |
| Total (ha) | 600.0 | 69.4 | 106.4 | 244.8 | 134.2 | 45.2 | 185.9 | 77.5 | 302.2 | 19.0 | 15.4 | |
| Direct Method | Forest Site | Total (ha) | RSM (Quickbird satellite image) | SI Method | |||||||||
|---|---|---|---|---|---|---|---|---|---|---|---|---|---|
| Forest Site | |||||||||||||
| D | MF | F | M | HM | I | II | III | IV | V | ND | |||
| D | 19.0 | 17.4 | 1.6 | - | - | - | - | - | - | 19.0 | - | ||
| MF | 29.2 | 3.2 | 10.9 | 6.0 | 5.8 | 3.3 | 10.7 | - | 18.5 | - | - | ||
| F | 338.8 | 60.0 | 41.0 | 154.2 | 75.8 | 7.8 | 29.6 | 53.3 | 240.5 | - | - | 15.4 | |
| M | 171.0 | 18.5 | 13.8 | 52.4 | 70.7 | 15.6 | 125.2 | 24.2 | 21.6 | - | - | ||
| HM | 42.0 | - | 6.1 | 5.4 | 19.9 | 10.6 | 20.4 | - | 21.6 | - | - | ||
| Total (ha) | 600.0 | 99.1 | 73.4 | 218.0 | 172.2 | 37.3 | 185.9 | 77.5 | 302.2 | 19.0 | 15.4 | ||
| Direct Method | Total (N) | RSM | SI Method | |||||||||||
|---|---|---|---|---|---|---|---|---|---|---|---|---|---|---|
| Landsat ETM satellite image | Quickbird satellite image | Site Class | ||||||||||||
| Forest Site | Forest Site | |||||||||||||
| D | MF | F | M | HM | D | MF | F | M | HM | Good Site | Moderate Site | Poor Site | ||
| D | 1 | 1 | - | - | - | - | 1 | - | - | - | - | - | - | 1 |
| MF | 22 | 5 | 5 | 3 | 5 | 4 | 1 | 9 | 7 | 4 | 1 | 5 | 3 | 14 |
| F | 5 | 1 | 2 | 2 | - | - | 1 | 1 | 3 | - | - | 1 | 1 | 3 |
| M | 30 | 2 | 8 | 10 | 6 | 4 | - | 4 | 8 | 15 | 3 | 10 | 12 | 8 |
| HM | 12 | 1 | - | 4 | 6 | 1 | - | 1 | 2 | 3 | 6 | 8 | 2 | 2 |
| Total (N) | 70 | 10 | 15 | 19 | 17 | 9 | 3 | 15 | 20 | 22 | 10 | 24 | 18 | 28 |
© 2008 by MDPI (http://www.mdpi.org). Reproduction is permitted for noncommercial purposes.
Share and Cite
Günlü, A.; Baskent, E.Z.; Kadiogullari, A.İ.; Ercanli, İ. Classifying Oriental Beech (Fagus orientalis Lipsky.) Forest Sites Using Direct, Indirect and Remote Sensing Methods: A Case Study from Turkey. Sensors 2008, 8, 2526-2540. https://doi.org/10.3390/s8042526
Günlü A, Baskent EZ, Kadiogullari Aİ, Ercanli İ. Classifying Oriental Beech (Fagus orientalis Lipsky.) Forest Sites Using Direct, Indirect and Remote Sensing Methods: A Case Study from Turkey. Sensors. 2008; 8(4):2526-2540. https://doi.org/10.3390/s8042526
Chicago/Turabian StyleGünlü, Alkan, Emin Zeki Baskent, Ali İhsan Kadiogullari, and İlker Ercanli. 2008. "Classifying Oriental Beech (Fagus orientalis Lipsky.) Forest Sites Using Direct, Indirect and Remote Sensing Methods: A Case Study from Turkey" Sensors 8, no. 4: 2526-2540. https://doi.org/10.3390/s8042526
APA StyleGünlü, A., Baskent, E. Z., Kadiogullari, A. İ., & Ercanli, İ. (2008). Classifying Oriental Beech (Fagus orientalis Lipsky.) Forest Sites Using Direct, Indirect and Remote Sensing Methods: A Case Study from Turkey. Sensors, 8(4), 2526-2540. https://doi.org/10.3390/s8042526