Article

Dependence of Impedance of Embedded Single Cells on Cellular Behaviour

1
Biohybrid Systems, Fraunhofer Institute for Biomedical Engineering, Ensheimer Str. 48 66386 St. Ingbert Germany
2
Nanobioengineering Research Laboratory, Bioengineering Institute of Catalonia, Barcelona Science Park, Josep Samitier 1-5, 08028 Barcelona, Spain
3
Electronics Department, University of Barcelona, Martí i Franquès 1, Planta 2 08028 Barcelona, Spain
*
Authors to whom correspondence should be addressed.
Sensors 2008, 8(2), 1198-1211; https://doi.org/10.3390/s8021198
Submission received: 31 January 2008 / Accepted: 20 February 2007 / Published: 21 February 2008

Abstract

:
Non-invasive single cell analyses are increasingly required for the medical diagnostics of test substances or the development of drugs and therapies on the single cell level. For the non-invasive characterisation of cells, impedance spectroscopy which provides the frequency dependent electrical properties has been used. Recently, microfludic systems have been investigated to manipulate the single cells and to characterise the electrical properties of embedded cells. In this article, the impedance of partially embedded single cells dependent on the cellular behaviour was investigated by using the microcapillary. An analytical equation was derived to relate the impedance of embedded cells with respect to the morphological and physiological change of extracellular interface. The capillary system with impedance measurement showed a feasibility to monitor the impedance change of embedded single cells caused by morphological and physiological change of cell during the addition of DMSO. By fitting the derived equation to the measured impedance of cell embedded at different negative pressure levels, it was able to extrapolate the equivalent gap and gap conductivity between the cell and capillary wall representing the cellular behaviour.

1. Introduction

In biological cell-based biotechnology, single cell analyses are increasingly required to understand the response and behaviour of individual cells to test substances (e.g. DNA, molecule, protein) or to develop the strategic therapies and drugs against disease on the single cell level [1]. Although numerous bio-chemical and physical based analyses are used to investigate the cellular physiology and pathology under various environments, the label-free methods among them are preferred to characterise or to monitor the cells due to the guarantee of cell states [2,3]. As one of non-invasive methods for the characterisation of cells, electrochemical impedance spectroscopy has been used which provides the frequency dependent electrical properties of cells involved with cellular physiology or morphology [4,5]. The electrical properties of single cells have been estimated numerically from the measured impedance of cell suspensions [6,7] or cells embedded in a nuclepore filter [8,9], which assumes that all of used cells are identical in morphology. The micropipette technique with impedance spectroscopy enabled to measure directly the impedance of individual cell membrane, however the method was invasive since the pipette punctured the cell [10,11]. It has been tried to achieve the nondestructive information of individual single cells by using the microfluidic channel with integrated microelectrodes interfacing the cells directly [12-14]. Even though the microelectrode-based methods showed a possibility to distinguish the impedance of cells under different conditions, it was not able to interpret the measured data of single cell contacted with electrodes due to the high contribution of electrode impedance increasing with decrease of electrode size. This inherent problem of electrode-based method is a crucial obstacle to understand the interfacial behaviour of single cells from the measured impedance (e.g. ion channel activity, cellular adhesion, membrane integrity). By using the planar microhole-based structure, it was able to measure the impedance of single cells without the disturbance of electrode polarization [15,16]. However, the microhole-based method also had a limitation for the interpretation due to the difficulty of observing the exact cellular morphology.
The goal of this article is to investigate the impedance of single cells considering the interfacial behaviour of cell by using a microcapillary with aspiration. During the aspiration, the elastic single cells are captured at the tip of capillary, which has a hole with smaller diameter than one of cell, and embedded in the capillary in dependence on the pressure, surface tension, and viscoelasticity of cell [17,18]. When electric fields are applied by using electrodes in and out of the capillary, a low frequency current will flow through the extracellular space between the low conductive cell membrane and capillary wall. Thus, the behaviour of cell at the interface will be sensitively reflected in the impedance measurement. For the research, the impedance of single cells embedded in the capillary tip will be measured. The feasibility of monitoring of the alteration in cell membrane will be tested by using capillary-based impedance measurement with an active substance affecting cell membranes. An analytical solution will be derived to understand the impedance of single cells captured at the capillary tip with respect to the morphological and physiological change of extracellular interface. Finally, the derived solution will be used to extrapolate the parameters representing the cellular behaviour at the interface from the observed cellular morphology and measured impedance.

2. Materials and Methods

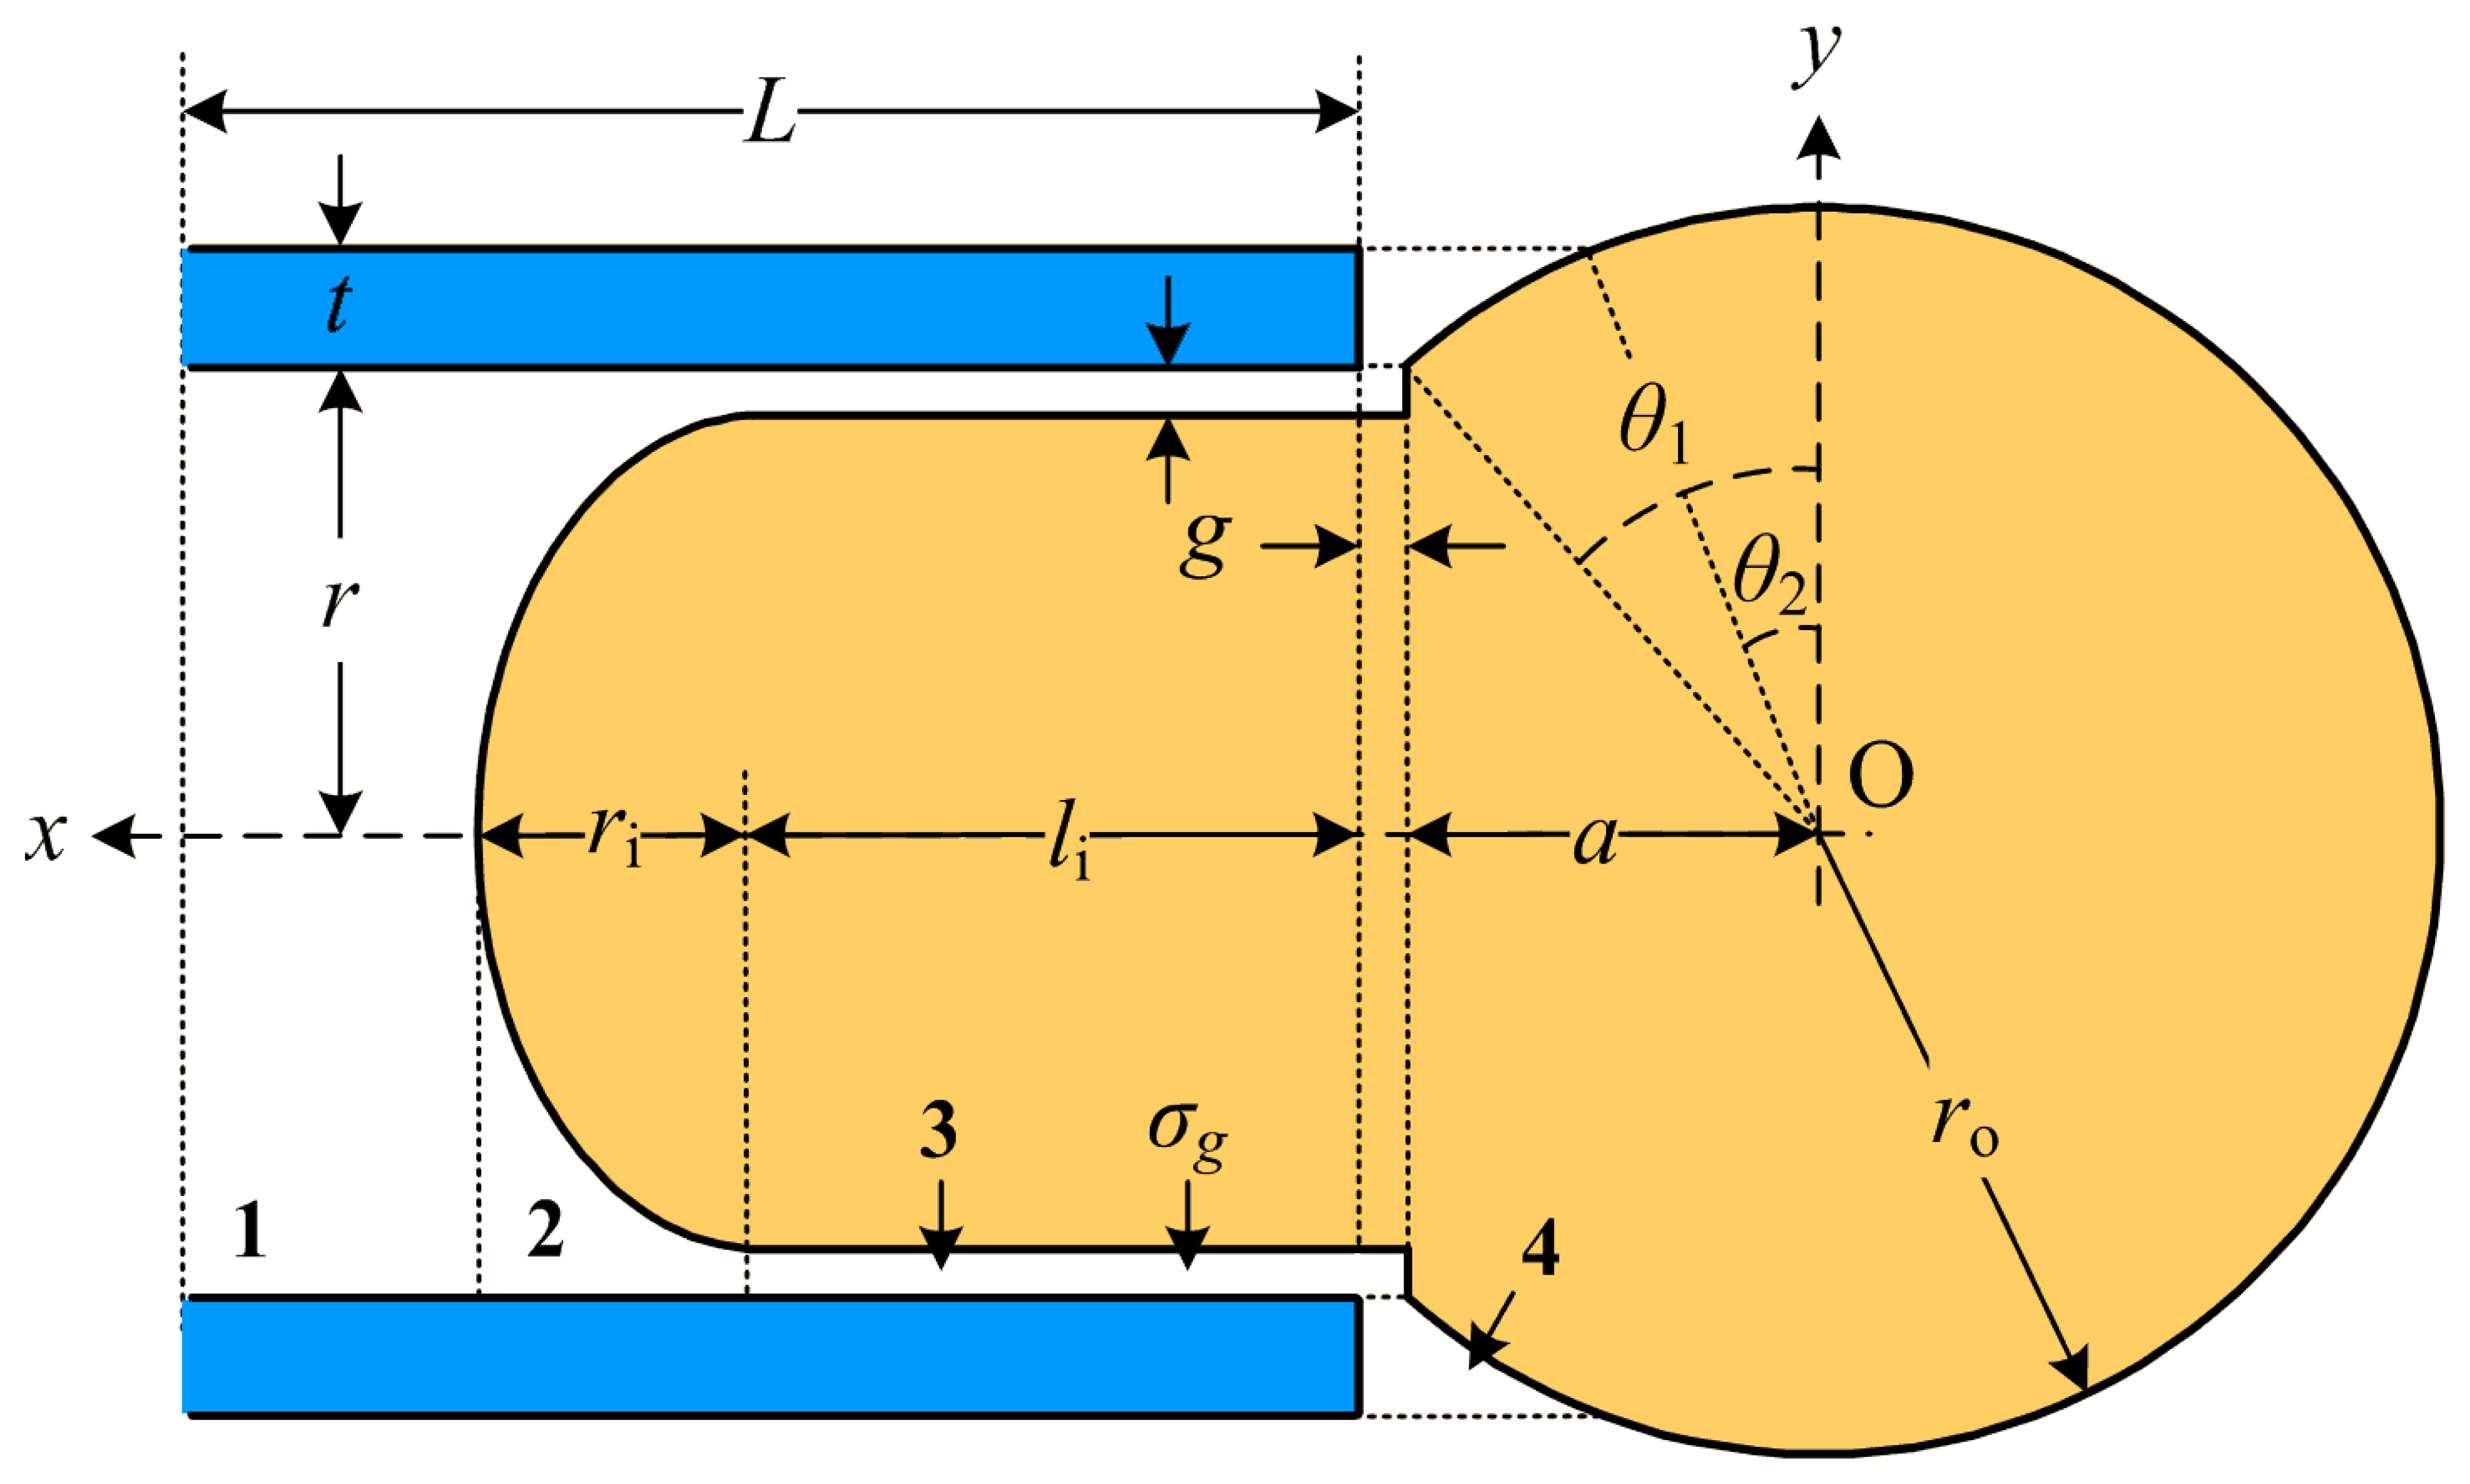
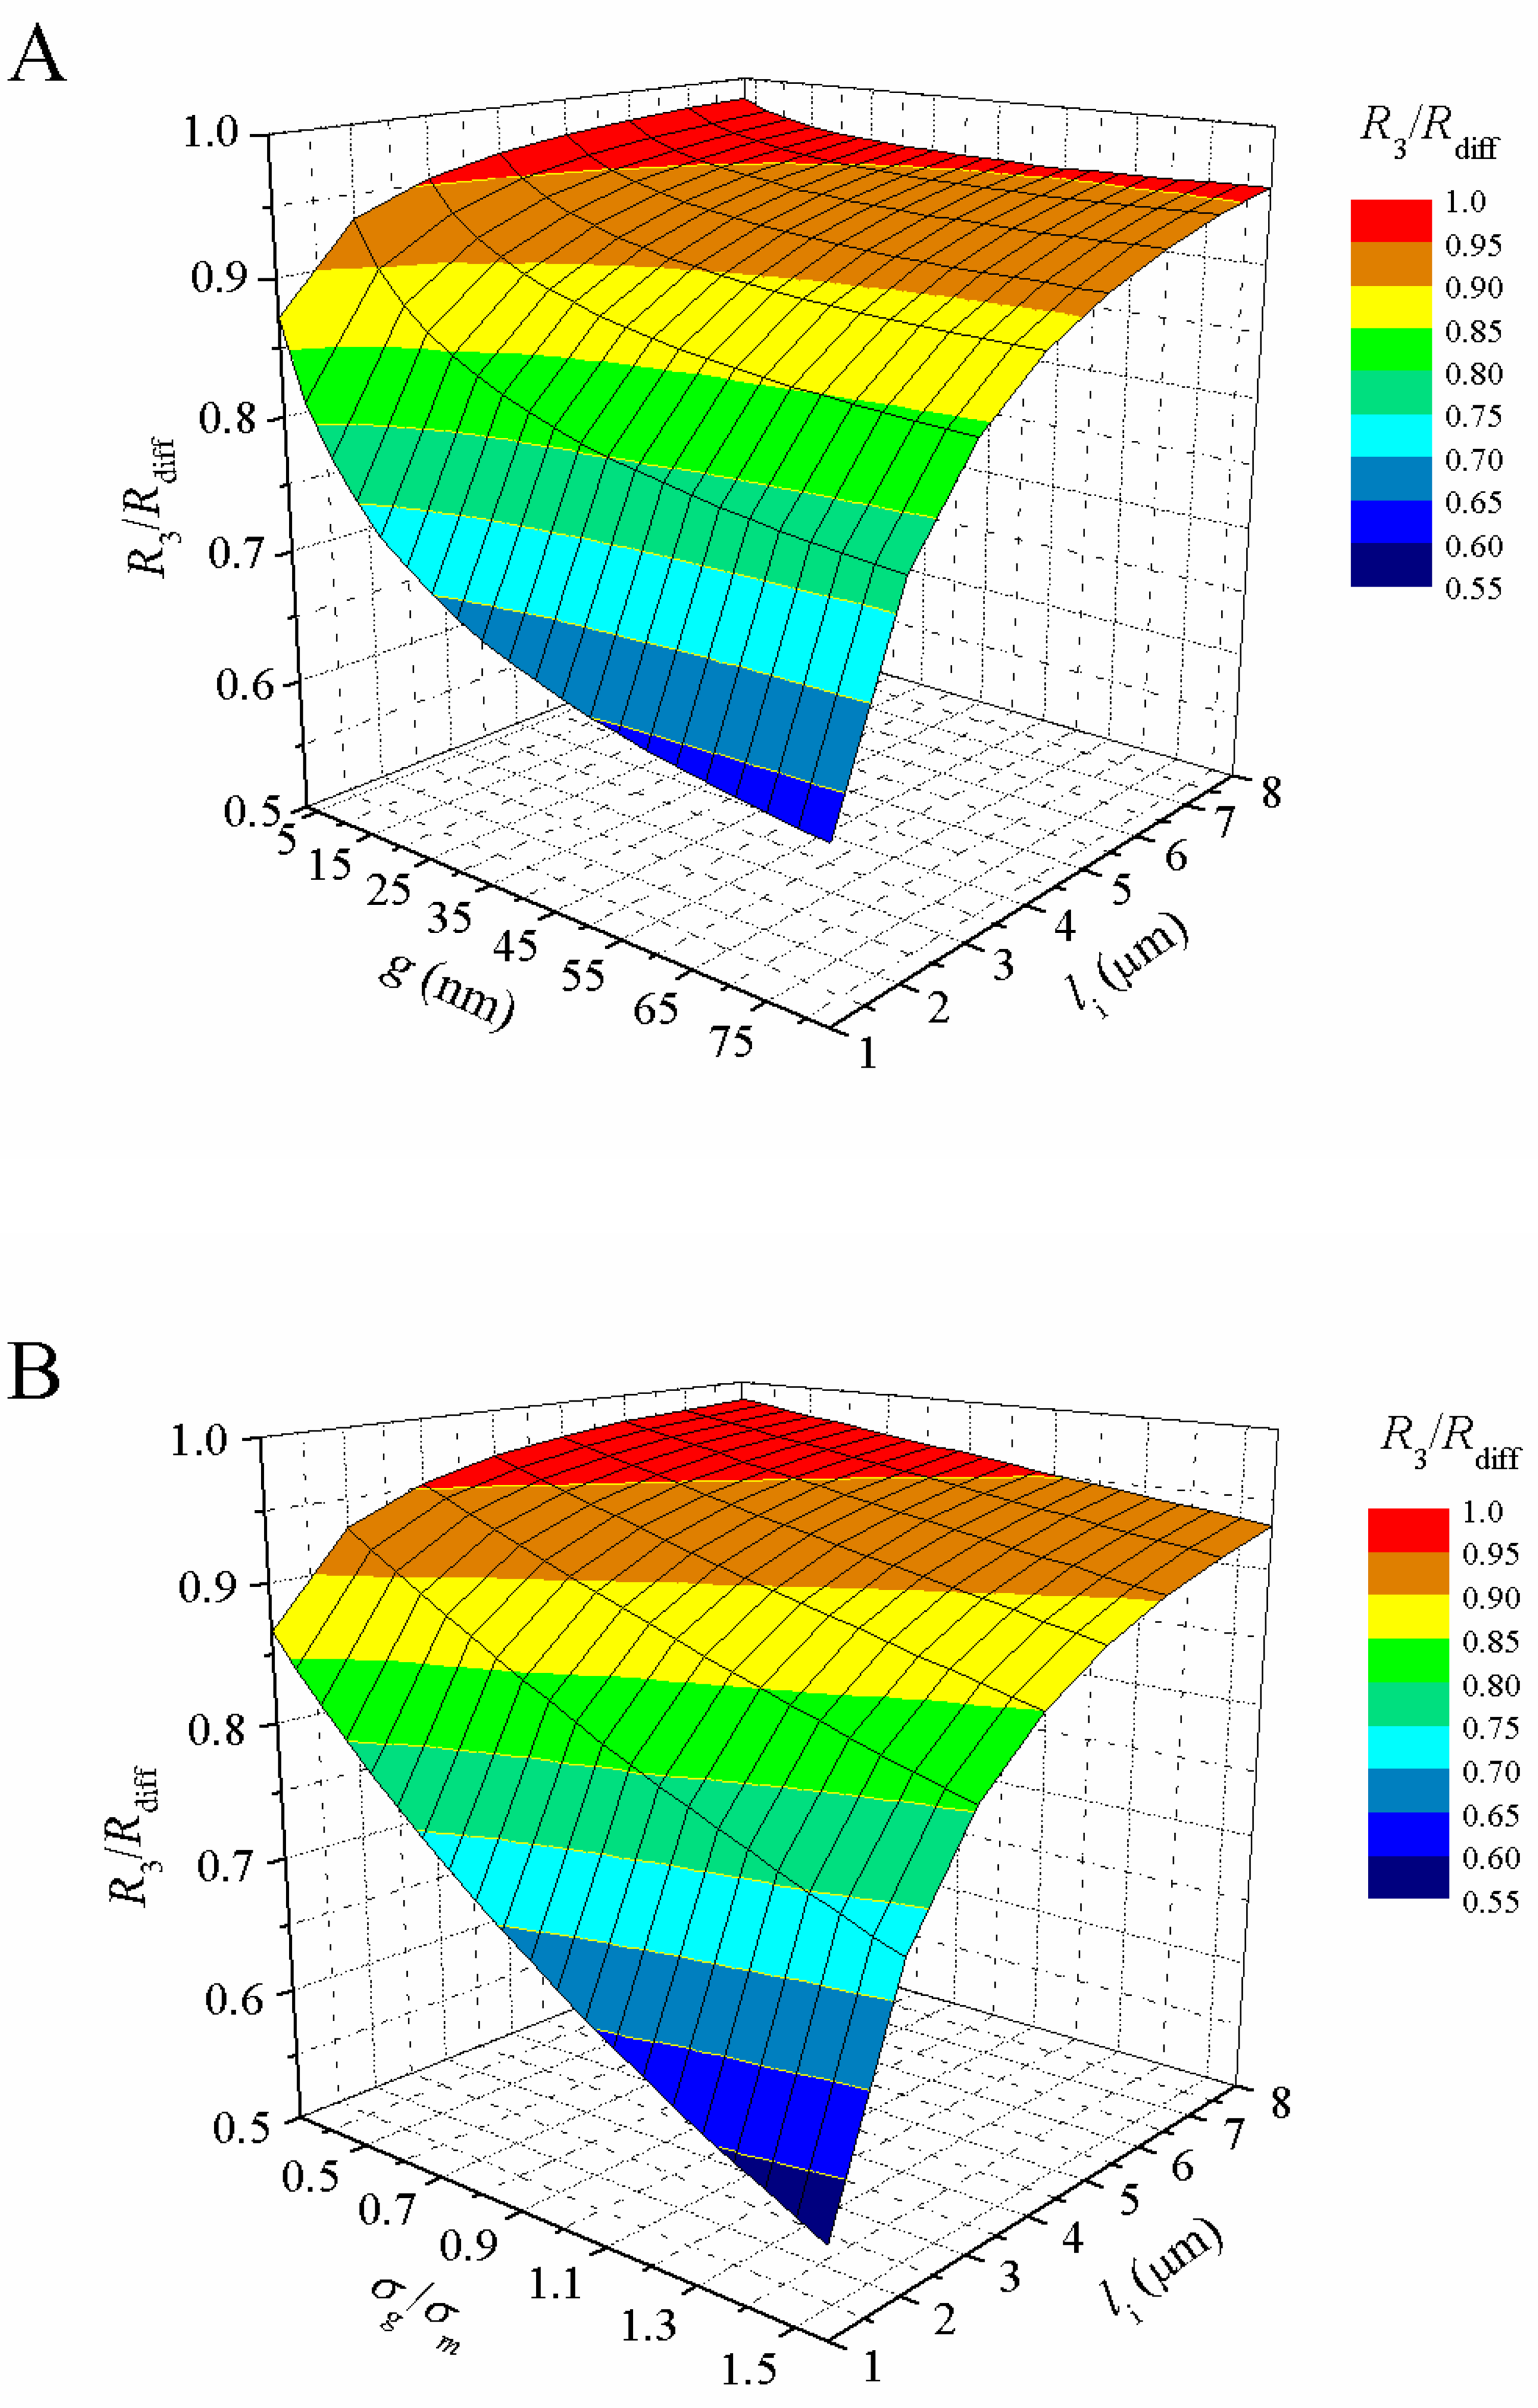
2.1. Analytical Equation for Resistance of Embedded Single Cell

To derive an analytical solution for the interfacial impedance of single cell trapped at the capillary tip, it was assumed that the cell membrane and capillary wall are ideally insulated and that the low frequency current flows only through the extracellular area isotropically and homogenously. In case of no cell in a tubular capillary with length L, thickness t, and inner radius r, the resistance is the sum of resistance in the capillary and spreading resistance [19] external to the capillary entrance.
R ref = L σ m π r 2 + 1 4 σ m r
where σm is the medium conductivity.
Figure 1 shows a schematic model of an elastic single cell with high surface tension of membrane embedded in the capillary tip. The cell external to the capillary entrance is a spherical shape with radius ro. The part of cell attracted into the capillary is set as a cylinder with length li, and the end of cell in the capillary is a semi-eccentric with polar radius ri. Due to the presence of adhesive proteins, transport organelles, and cellular receptors in the cell membrane, cells contact onto the substratum with the gap of several tens to hundreds of nanometres [4-20]. For this, we set an interfacial equivalent gap g between the cell and capillary with conductivity σg. Therefore, when the current flows only through the cross section between the cell and capillary A(x) along x axis and A(θ) along y axis in Figure 1, the total resistance of capillary with embedded single cell (Rcell) is as follows.
R cell = 1 σ ( a L + g + a d x A ( x ) θ 1 θ 2 r o sin θ d θ A ( θ ) )
where σ is the conductivity, a = { r o 2 r 2 } 1 / 2, θ1 = cos−1 (r/ro), θ2 = cos−1 ((r+t)/ro).
In each region 1, 2, 3, and 4 of Figure 1, A(x) and A(θ) are as follows:
A ( x ) = { π r 2 1 π ( r g ) 2 r i 2 [ { x ( l i + g + a ) } 2 + r i 2 { r 2 ( r g ) 2 1 } ] 2 π { r 2 ( r g ) 2 } 3 A ( θ ) = 2 π r o cos θ ( g + a r o sin θ ) 4
From the equation (2) and (3), Rcell is derived as follows.
R cell = 1 σ m a + g + l i + r i L + g + a d x A 1 ( x ) + 1 σ m a + g + l i a + g + l i + r i d x A 2 ( x ) + 1 σ g a a + g + l i d x A 3 ( x ) 1 σ m θ 1 θ 2 r o sin θ d θ A ( θ ) = 1 π ( L ( r i + l i ) σ m r 2 + r i σ m ( r g ) { r 2 ( r g ) 2 } 1 / 2 tan 1 ( r g { r 2 ( r g ) 2 } 1 / 2 ) + l i + g σ g { r 2 ( r g ) 2 } + g + a 2 σ m { ( g + a ) 2 r o 2 } [ ( 1 + r o g + a ) ln ( cos ( θ 2 ) sin ( θ 2 ) ) + ( 1 r o g + a ) ln ( cos ( θ 2 ) + sin ( θ 2 ) ) ln ( g + a r o sin θ ) ] θ 1 θ 2 )
Therefore, the difference of resistance for the capillary tip with captured cell and of resistance for the tip without cell, Rdiff (=RcellRref), is defined as a function of the observable parameters, li, ri, and ro, and the adjustable ones, σgand g, from experimental data. To extrapolate the parameters σgand g, Rdiff was fitted to experimental data (used software: Matlab, The MathWorks Inc., Natick, USA). As shown in Figure 1, the resistance of region 3 (R3) is determined by the parameters of σg, g, and li representing the interfacial behaviour of cells. To investigate how much Rdiff is contributed by R3 with respect to the interfacial parameters σg, g, and li, R3/Rdiff was calculated at different li and g (t = 1 μm, r = 4 μm, ri = 2 μm, ro = 12 μm, σm, σg = 1.6 S/m) or at different li and σg (t = 1 μm, r = 4 μm, ri = 2 μm, ro = 12 μm, g = 40 nm, σm = 1.6 S/m).

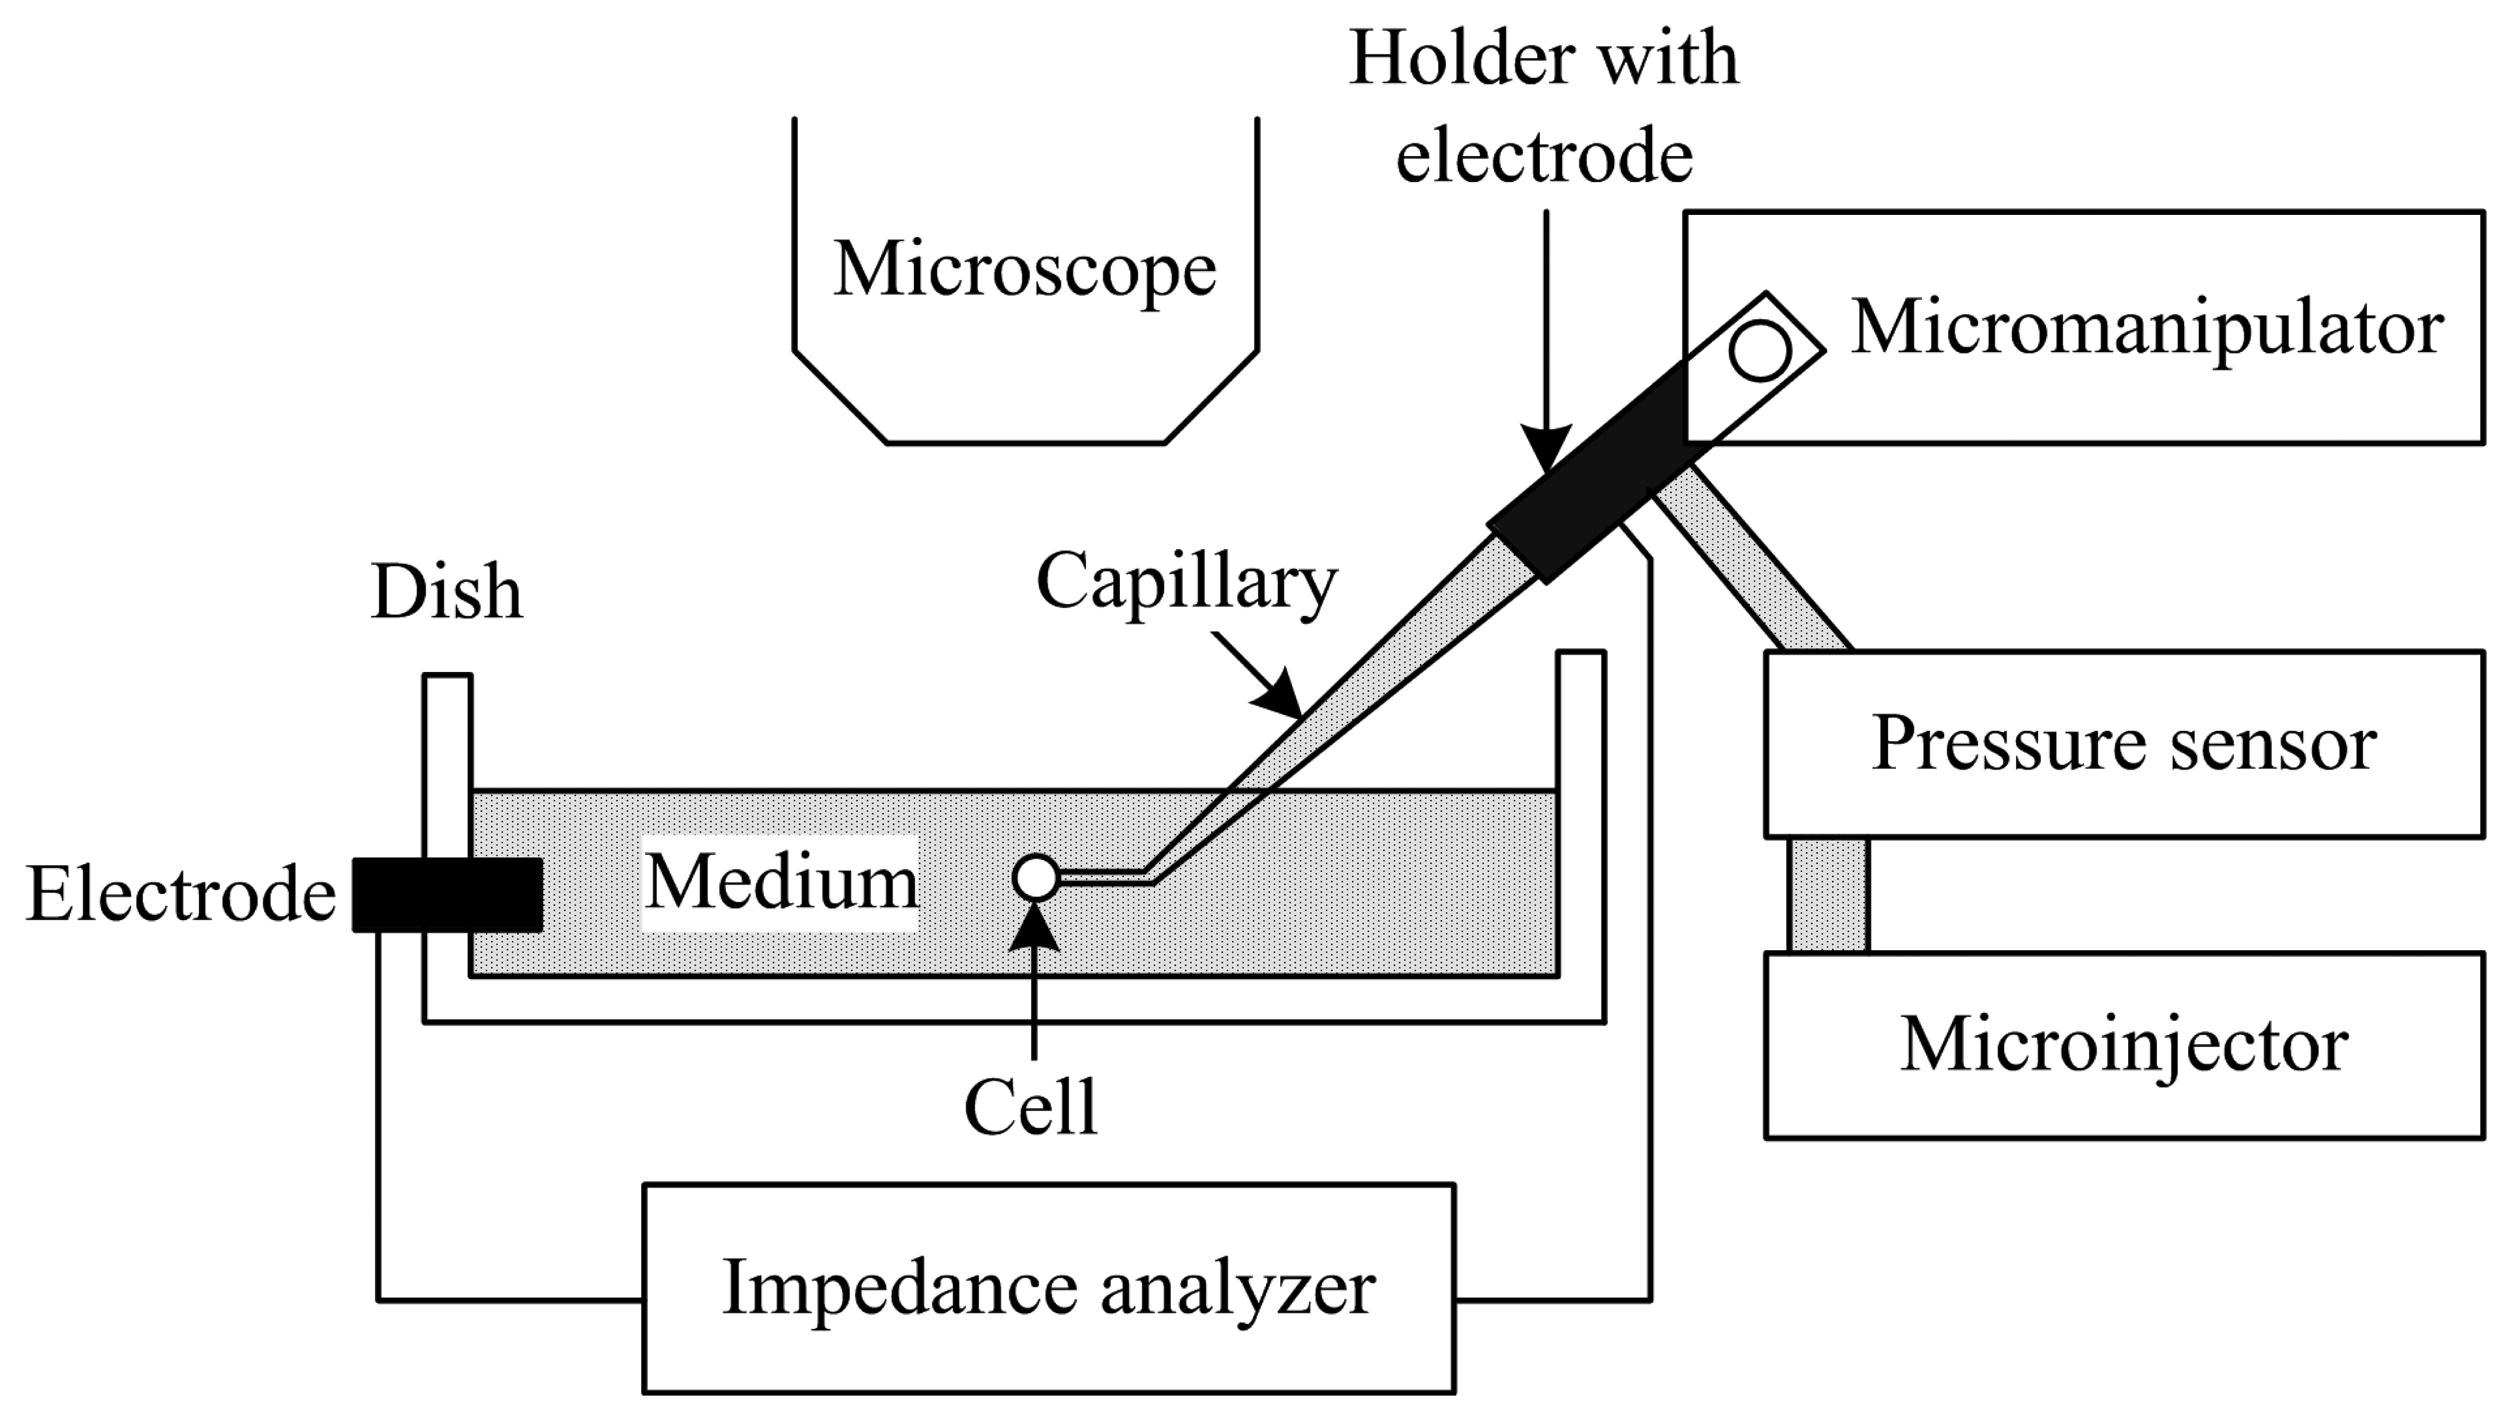
2.2. Impedance Measurement of Single Cells Embedded in Capillary

For the cells, we prepared cultured L929 murine fibroblasts and removed the medium in the culture dish. The cells were washed once with PBS and then trypsinized with 1 ml of 10% Trypsin/EDTA for 3 minutes in an incubator Heraeus BB 6220 (Heraeus-Christ, Hanau, Germany). The cell suspension was transferred into a 15 ml plastic tube (Greiner BIO-ONE, Frickenhausen, Germany) and the cells were centrifuged at 1000 rpm for 5 minutes. After removing the supernatant, the cells were resuspended in culture medium (RPMI 1640, 10% FCS, 0.5% Penicillin/Streptavidin). For the capillary, we purchased insulated borosilicate glass capillaries (Custom Tip Type II, Eppendorf, Hamburg, Germany). Figure 2 shows the schematic of experimental setup for impedance measurement of single cell embedded in the capillary. The tubular pipette tip had the inner radius of 4 μm and the thickness of 1 μm. The capillary with holder was combined with a micromanipulator for the control of movement (PatchMan NP 2, Eppendorf, Hamburg, Germany) and a manual microinjector for the aspiration or release of single cells (CellTram® Oil, Eppendorf, Hamburg, Germany). After filling culture medium (RPMI 1640, 10% FCS, 0.5% Penicillin/Streptavidin) in the capillary and a dish, the cells were put in the dish. For the impedance measurement, an Ag-wire electrode was installed at the heel of capillary and another Pt electrode in the dish. The electrodes were connected to an electrochemical impedance analyzer (1260, Solartron Analytical, Farnborough, UK). The impedances of capillaries with and without a captured cell at the tip was measured in the frequency range from 100 Hz to 100 kHz. The single cell was captured at the tip of capillary by applying a negative pressure. The peak of input potential used for impedance measurement was 100 mV.
To monitor biological relevant effects, we investigated the influence of DMSO used for the cryopreservation of cells or the increase of membrane permeability on a single cell. It is well known that DMSO is polar and easily diffused through the cell membrane where it can replace water molecules associated with cellular constituents [21]. DMSO causes the dehydration of the lipid bilayer and therefore the morphological and physiological changes of cell [22]. Before, while, and after a 100 μl of culture medium including 5% DMSO was applied to the culture dish containing 1 ml cell culture medium, the impedance at 100 Hz was monitored in real time. For the control, non-deformable, insulated, and spherical latex beads with the diameter of 9.6 μm were used (Coulter Corp., Miami, USA). Further, the impedance of single cell was recorded at 100 Hz in real time during the aspiration with different negative pressure to monitor the difference of impedance magnitude of single cell caused by the morphological change of cell.

3. Results and Discussion

3.1. Theoretical Resistance of Embedded Single Cell

Under the assumption that the low frequency current flows only through the extracellular region, the derived equation (4) indicates that the resistance of a single cell embedded in the capillary is determined by cellular morphology and adjustable parameter g and σg. Figure 3 shows the contribution of R3 determined by the interfacial parameters li, g, and σg to Rdiff at different li with g (Figure 3A) or σg/σm (Figure 3B). The other parameters in the equation (4) are given as 2.1. In Figure 3, it is shown that R3 contributes more to Rdiff with increase of li or with decrease of g or σg. The dependence of R3/Rdiff on g or σg is increased with decrease of li. As more as R3 contributes to Rdiff, the impedance measurement of embedded single cell reflects more the cellular behaviour related with the interfacial parameters li, g, and σg. Therefore, the change in ri or ro causes relatively less the change of impedance of embedded cell as R3/Rdiff is higher. From this theoretical investigation, it was estimated how much the impedance measurement on embedded cells reflects the interfacial behaviour of embedded single cells.

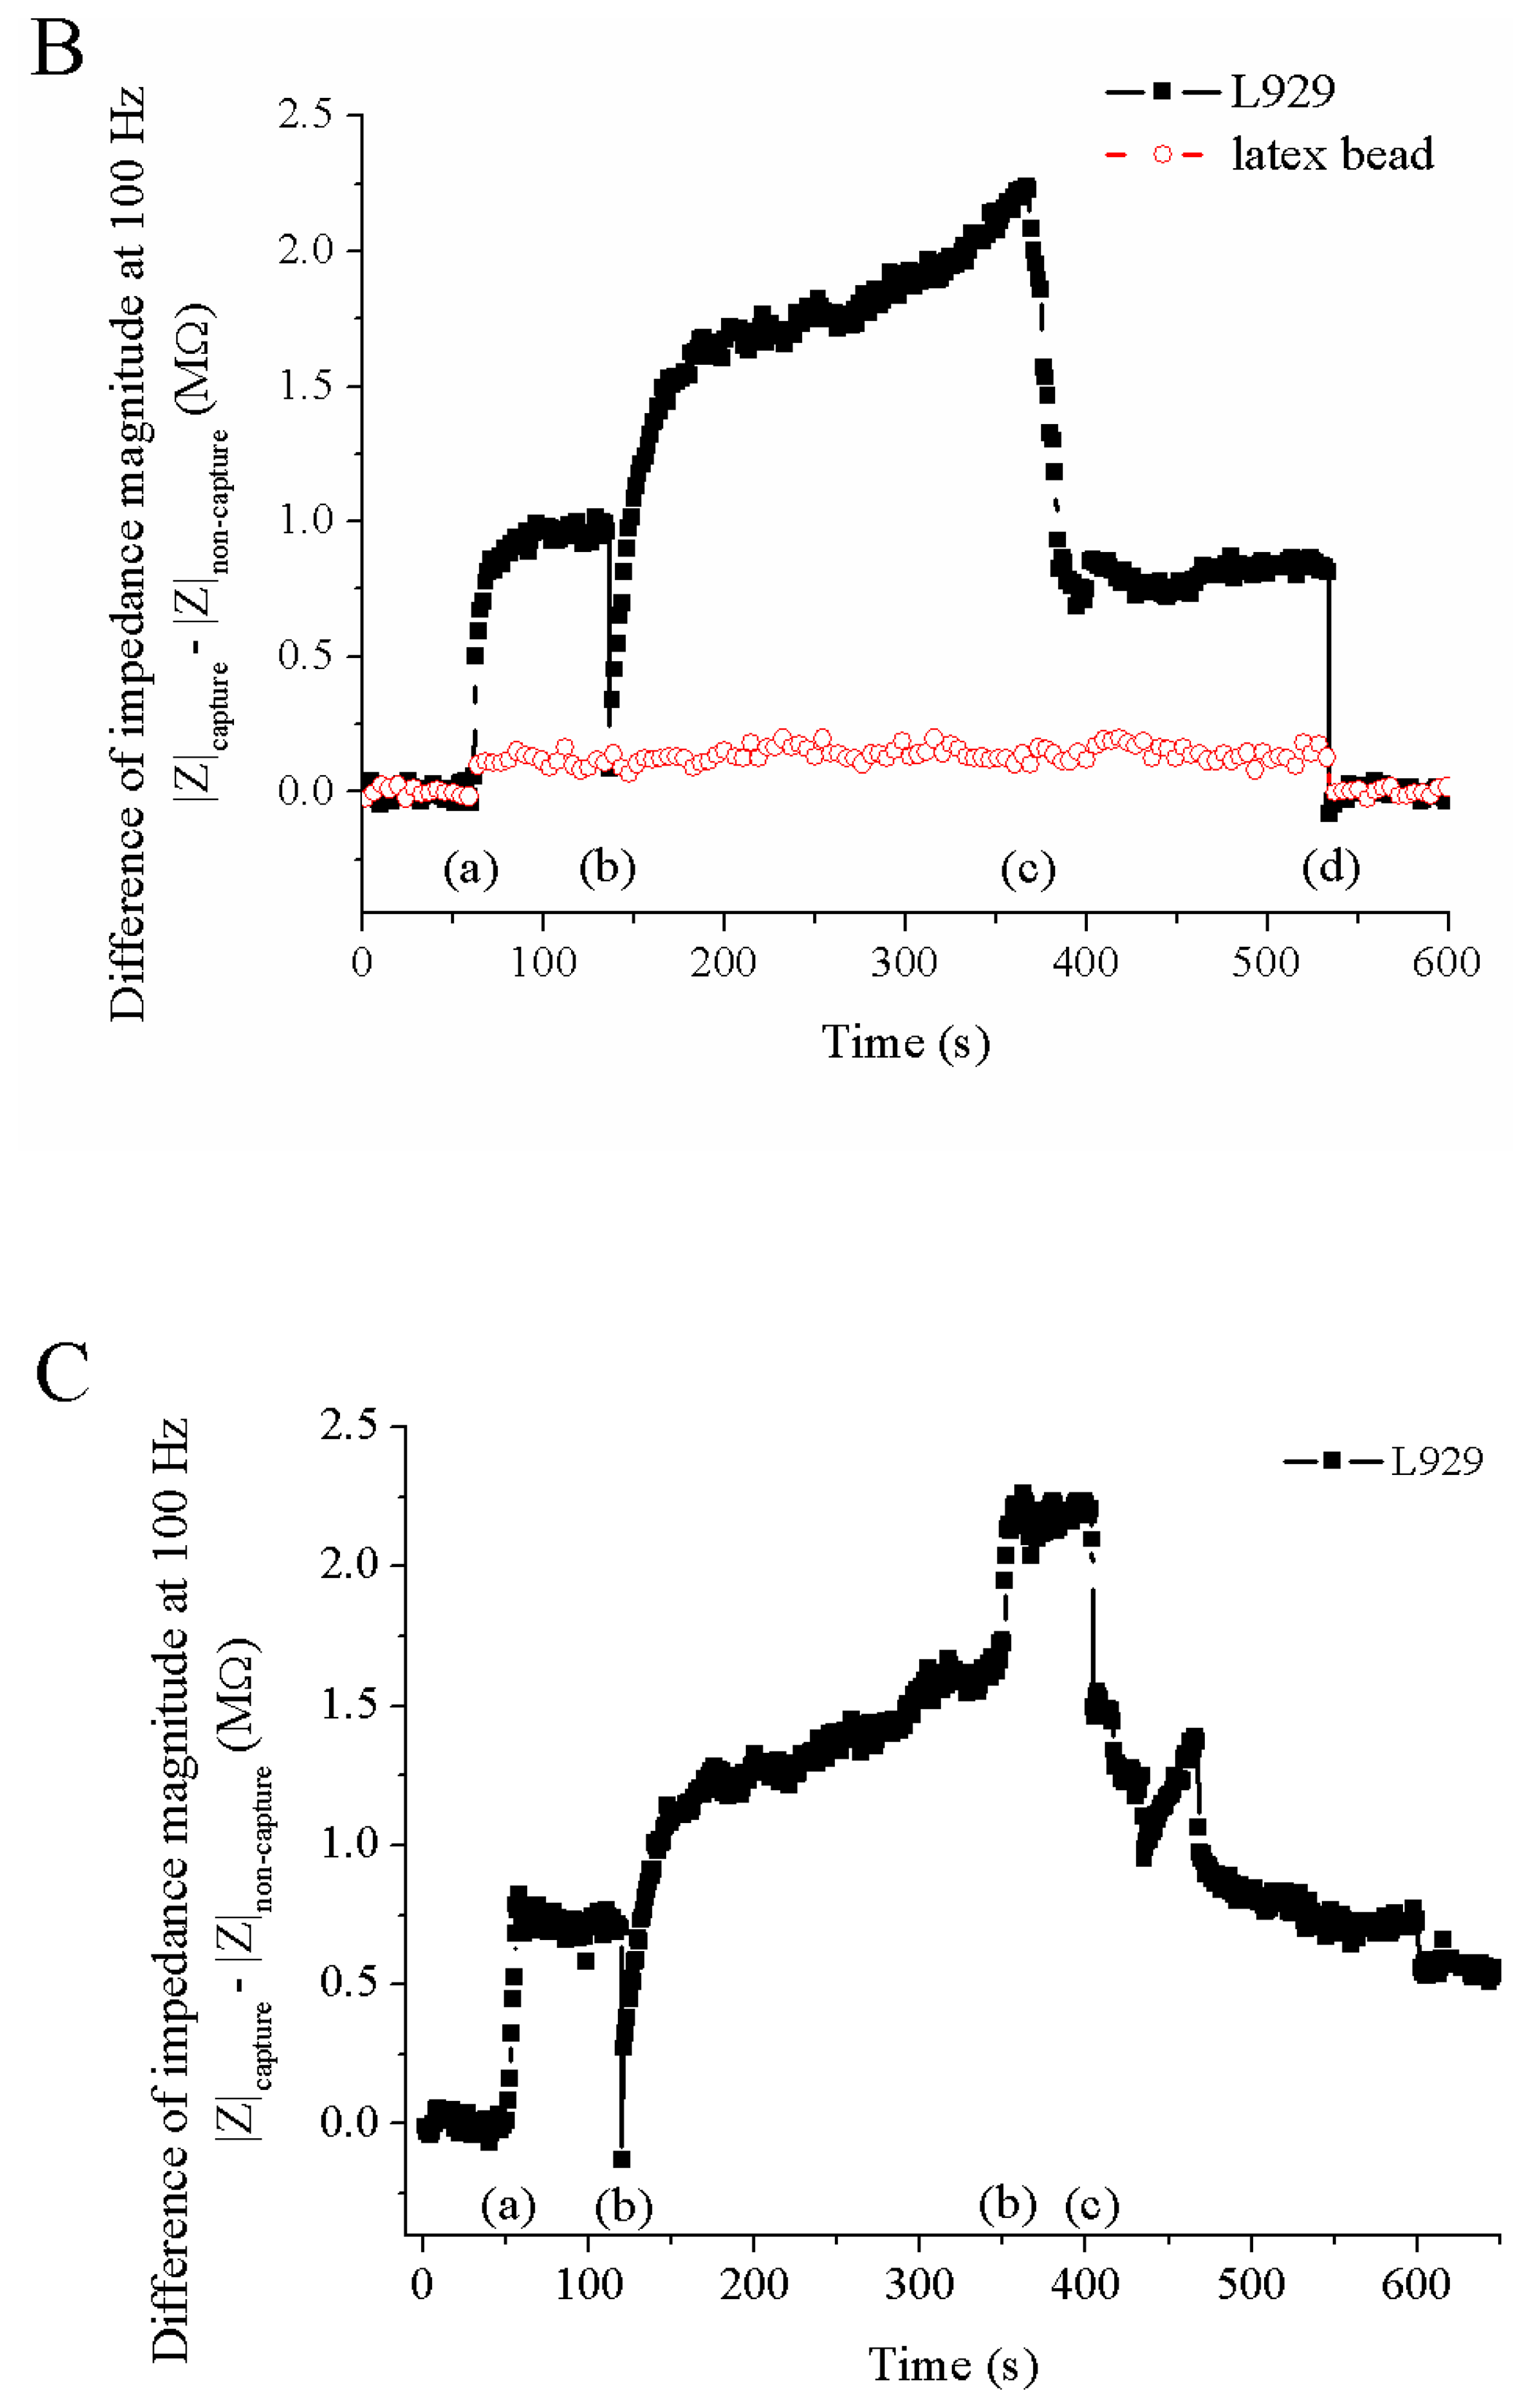
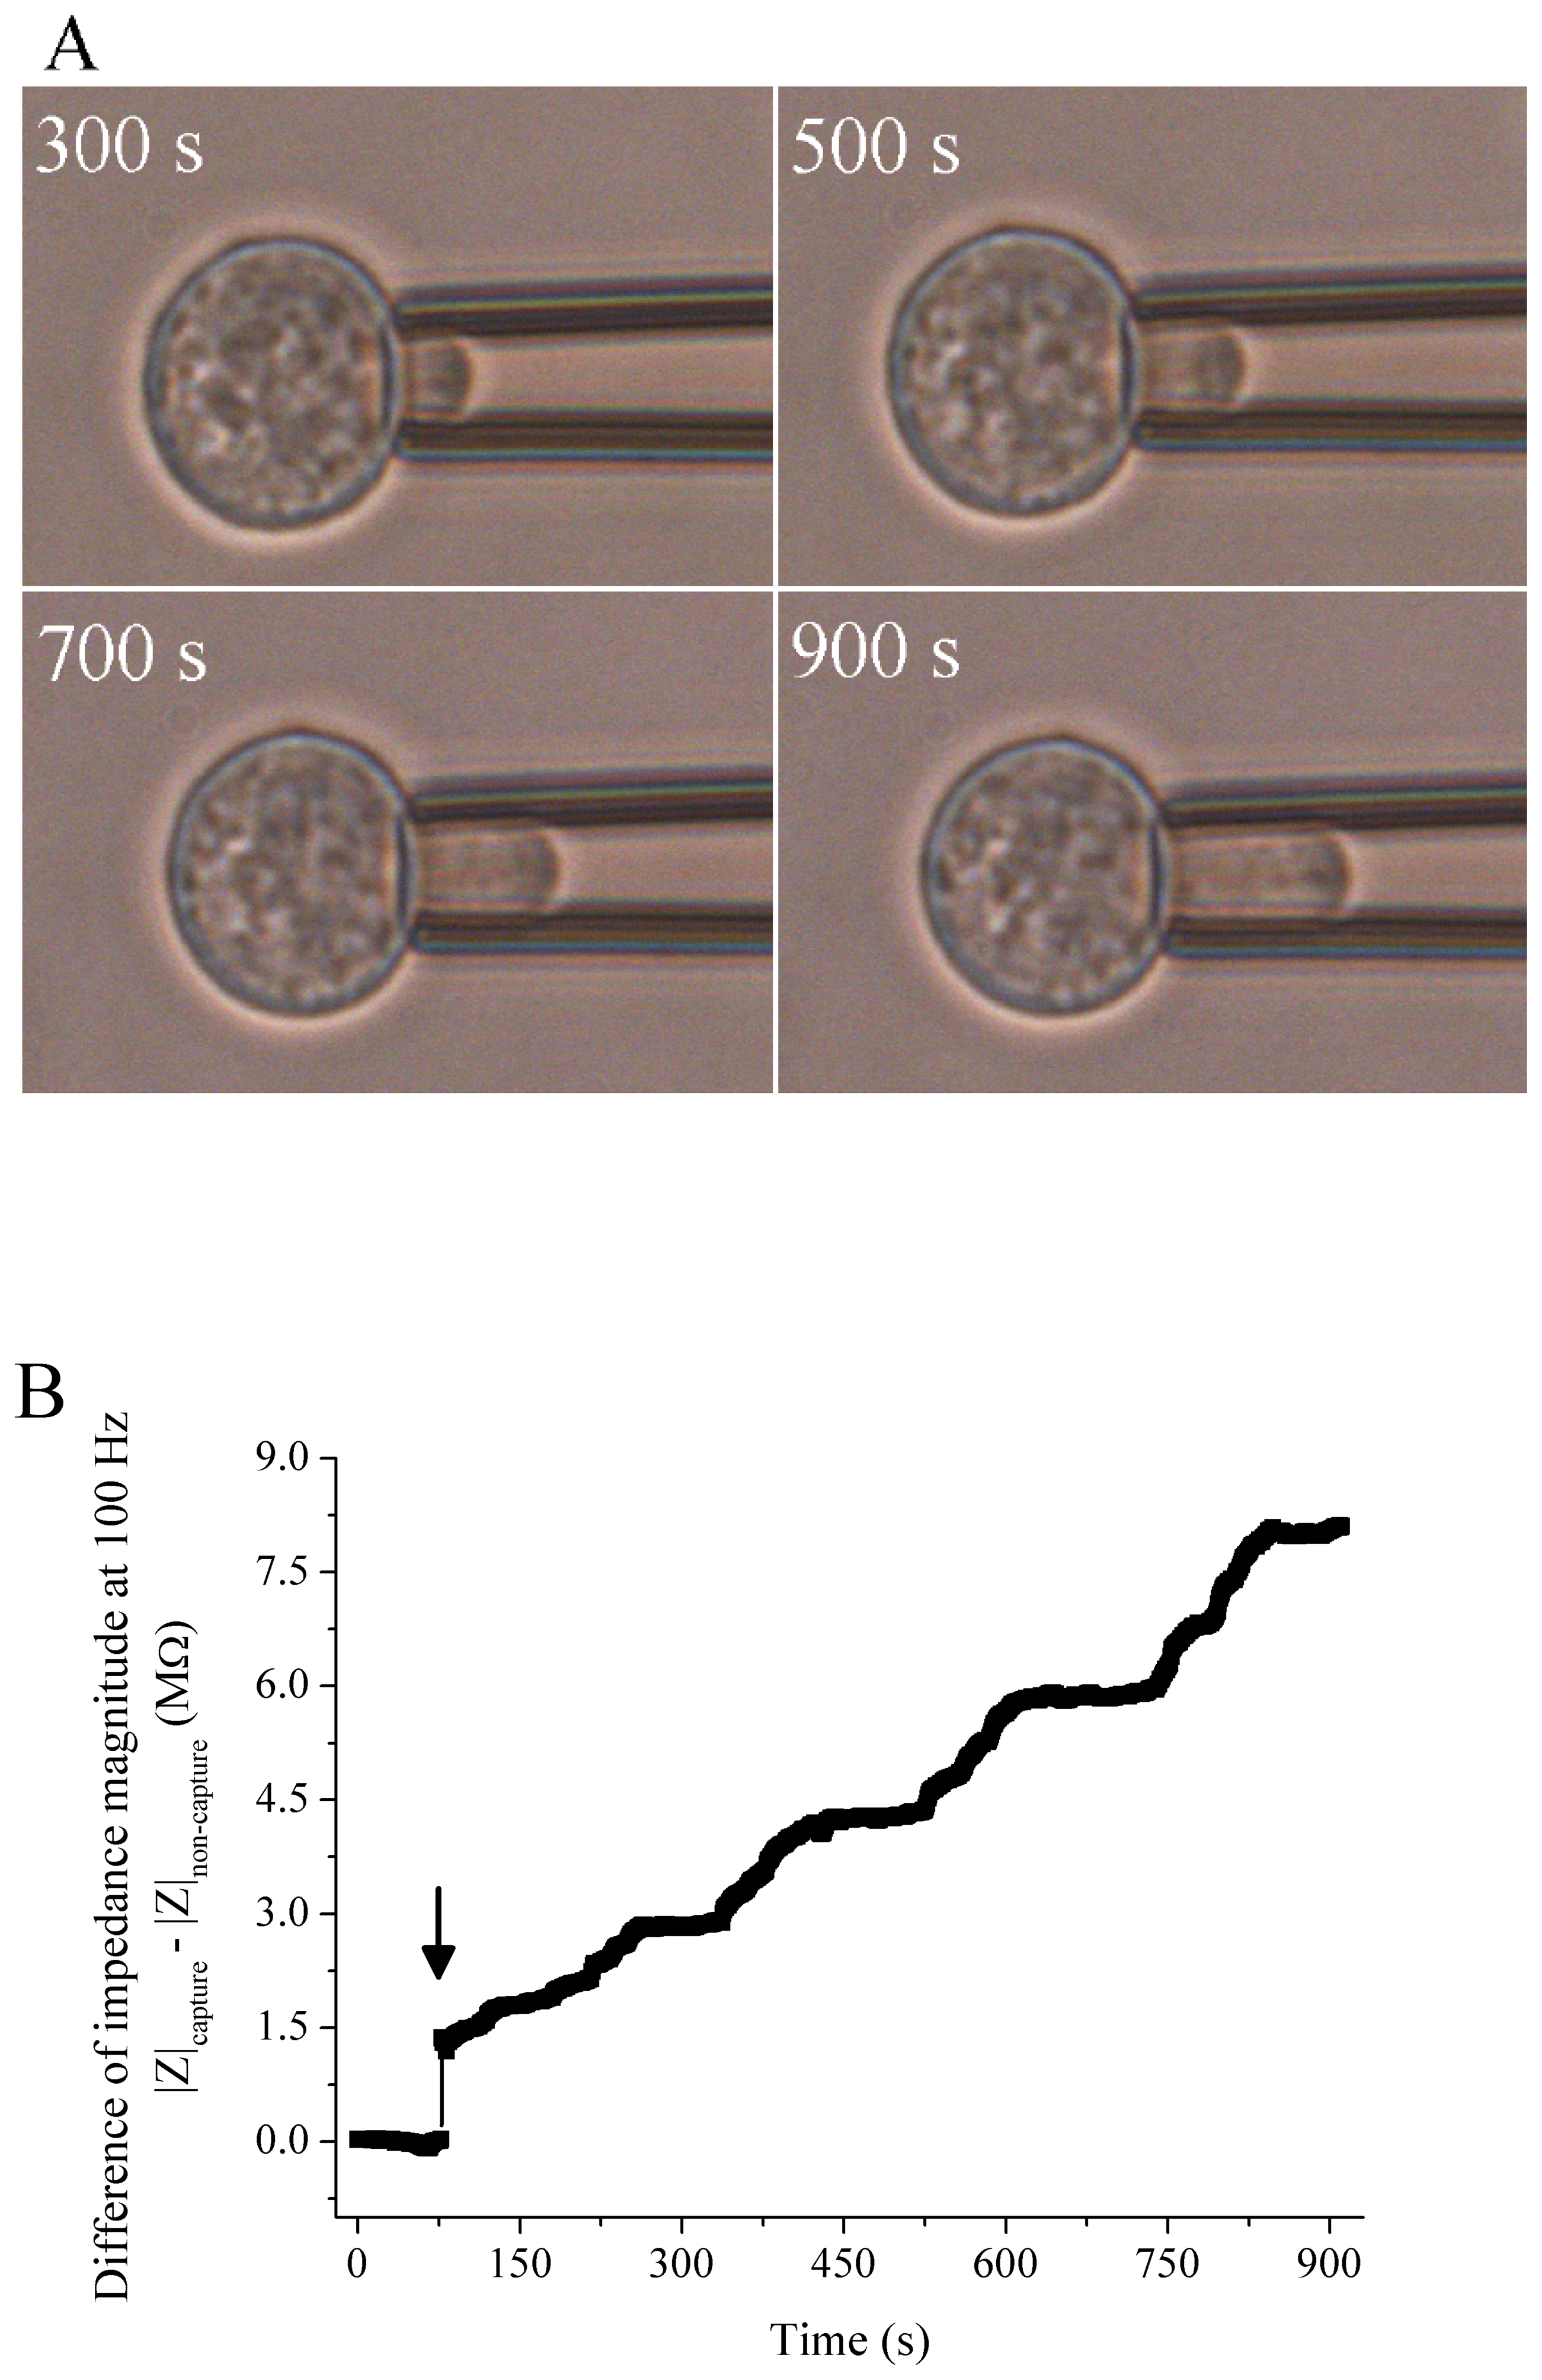
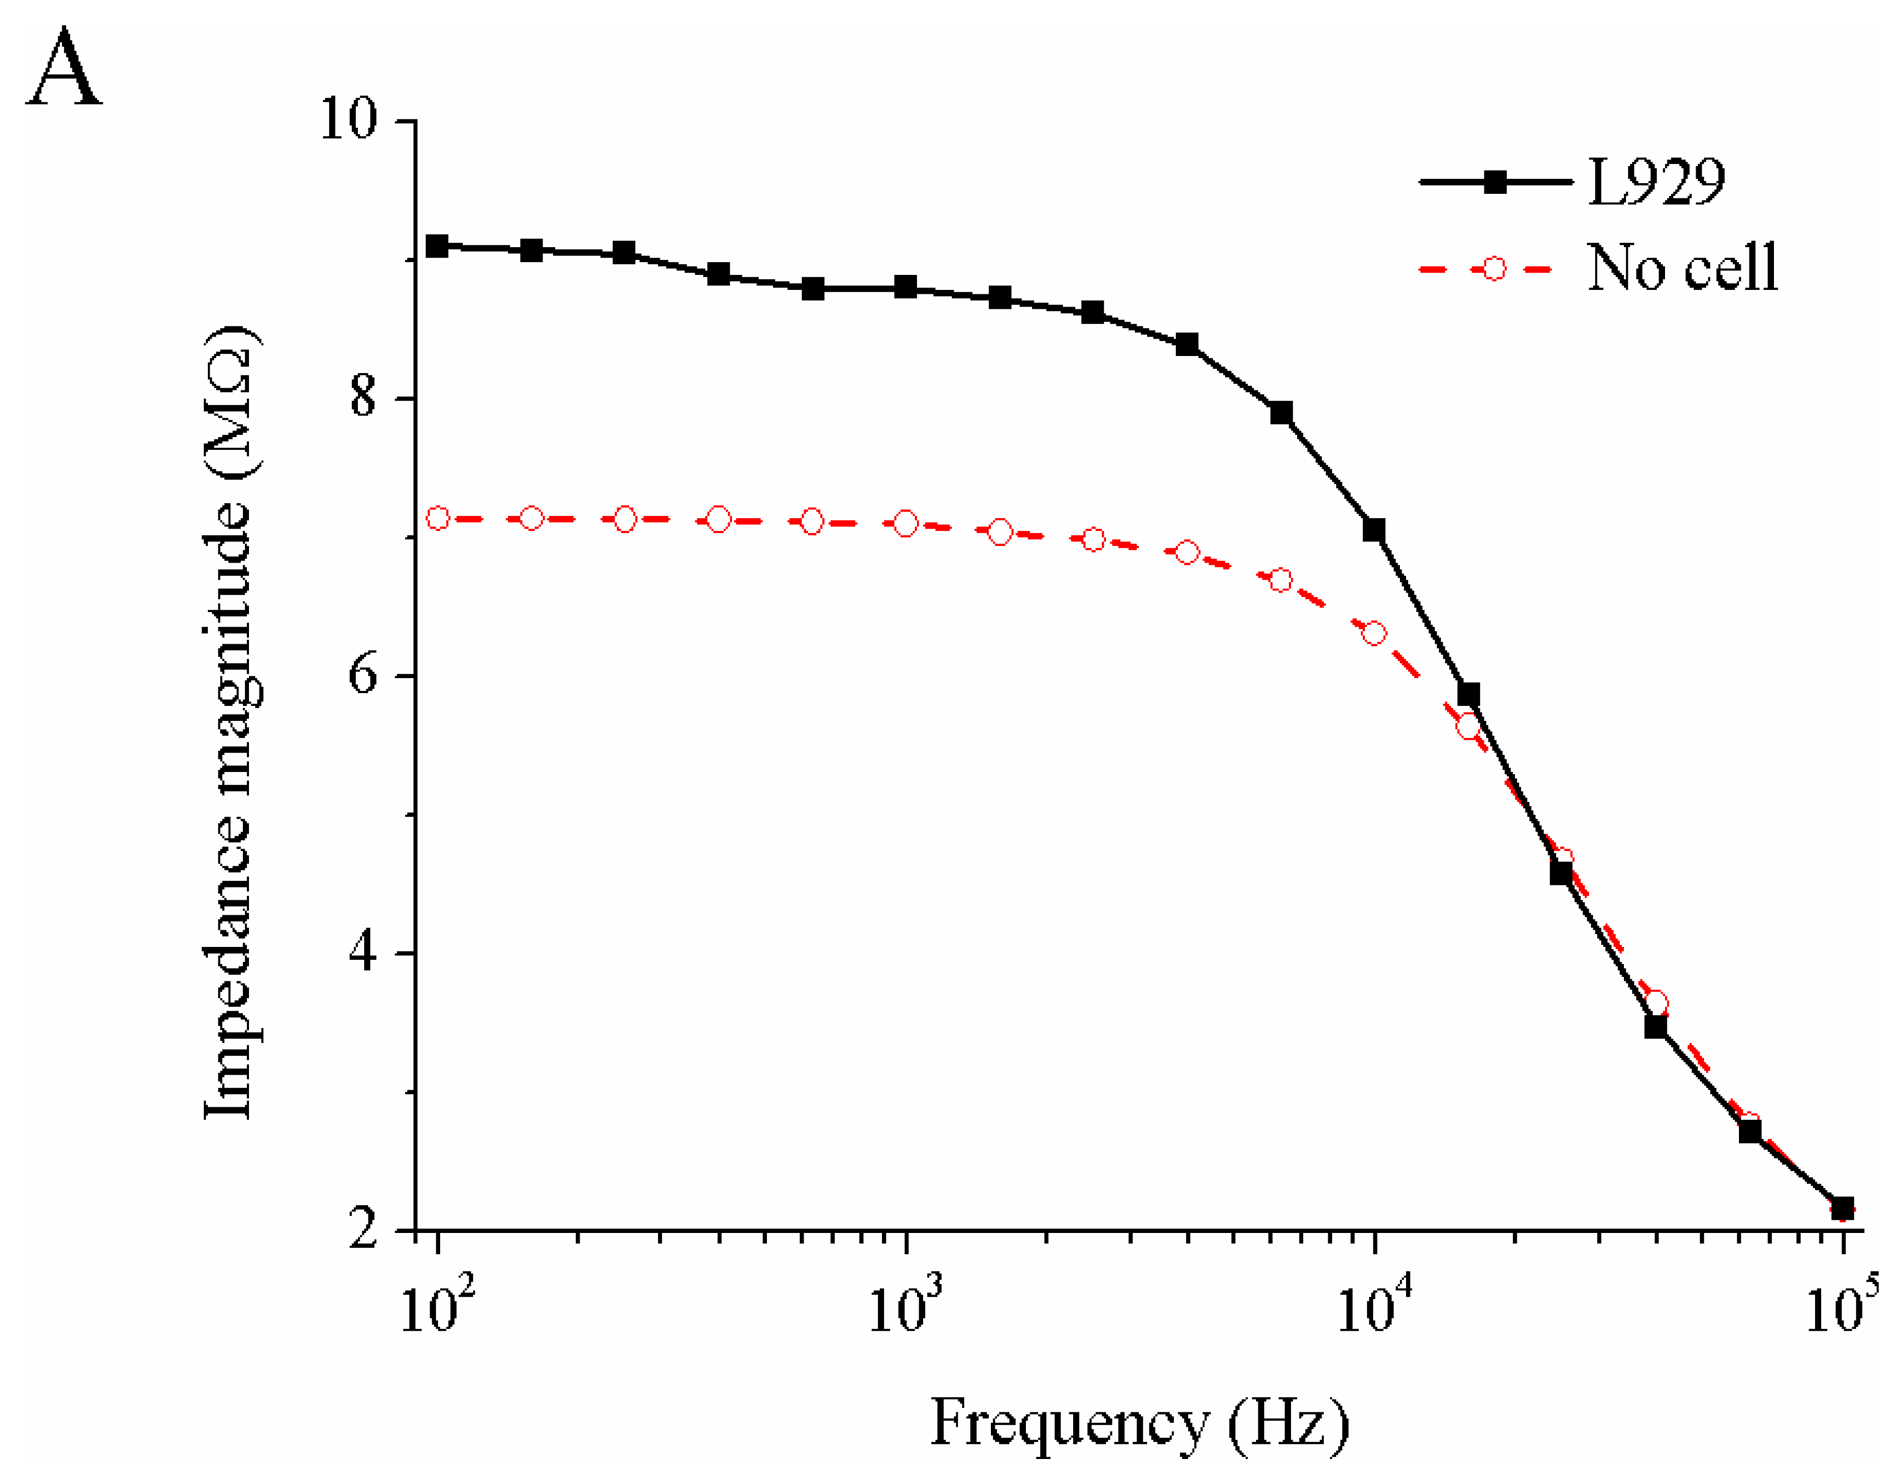
3.2. Measured Impedance of Single Cells Embedded in Capillary

During the aspiration with negative pressure, a L929 cell was moved to the capillary entrance along the fluid and captured at the tip of capillary. Then, a part of elastic cell was expanded in the capillary in dependency on the pressure level. When a single L929 cell was captured at the capillary tip at a negative pressure of 9 mbar, the measured impedance magnitude in the frequency range of 100 Hz to 100 kHz was shown in Figure 4A. In the low frequency range of 100 Hz to 1 kHz, the impedance magnitude and phase were 7.12 ± 0.02 MΩ and − 2.41 ± 0.92° for no capture (No Cell), but 8.95 ± 0.14 MΩ and − 2.58 ± 1.15° for the captured cell (L929), respectively. The phase almost zero at the frequencies below 1 kHz indicates that the low frequency current flows mostly through the extracellular space between the low conductive cell membrane and capillary wall. With increase of frequency, the current is able to penetrate the cell membrane and insulated capillary wall, and therefore the decreases of phase and impedance magnitude are observed. The measured impedance was not distinguished between when the cell is captured and not at the frequencies higher than 20 kHz. Therefore, the capillary with impedance measurement system is proper to measure the impedance of embedded cell in the low frequency range related with extracellular behaviour (e.g. membrane morphology and integrity). It was able to monitor the effect of DMSO causing the membrane alteration on the impedance of embedded cell by using the capillary with impedance measurement system. The following events were reflected in the change of impedance at 100 Hz (Figure 4B and 4C):
a)
capture of a particle (cell or bead)
b)
application of DMSO (100 μl of culture medium including 5% DMSO)
c)
breakdown of cell membrane
d)
release of a particle (cell or bead)
The difference of impedance magnitude for a capillary tip with captured cell and of the magnitude for a capillary tip without cell (|Z|capture − |Z|non-capture) was a suitable parameter for the change of impedance. For the measured data of Figure 4C, the final concentration of DMSO in the medium was about 0.45 % after the first addition of DMSO and 0.83 % after the second addition of DMSO. After the addition of DMSO to the captured cell, there are rapid changes in both the difference of impedance magnitude and the volume/shape of cell. The additional application of DMSO results in the rapid increase of impedance magnitude again. For the non-deformable latex bead, however, the difference of impedance magnitude is increased to 164.80 kΩ after the capture and not changed significantly after the addition of DMSO. From the experiments, it is found that the cellular alteration or response to the test substances can be reflected well in the impedance monitoring of single cells embedded at the tip of capillary.

3.3. Interpretation of Measured Impedance of Embedded Single Cell

Figure 5 shows the dependence of the measured impedance of embedded cell on the morphological change of cell resulted from the aspiration with different negative pressures. Figure 5A is the difference of impedance magnitude recorded at 100 Hz during the artificial aspiration. The arrow in the figure indicates the time of capture. Figure 5B shows the micrographs of an embedded cell. The time in the micrographs of Figure 5B is correspondent to the measurement time. The applied negative pressure was 8.3 mbar at around 300 s, 11 mbar at 500 s, 15.5 mbar at 700 s, and 21.1 mbar at 900 s. From 300 s to 900 s of aspiration, the cell external to the capillary entrance kept the surface tension of membrane. During the period, ro and ri were 11.73 ± 0.17 μm and 1.60 ± 0.22 μm, respectively.However, both li and the difference of impedance magnitude were increased with increase of negative pressure level (li, |Z|capture − |Z|non-capture: 4.3 μm, 2.82 MΩ at 300 s, 7.5 μm, 4.26 MΩ at 500 s, 9.9 μm, 5.83 MΩ at 700 s, 13.0 μm, 8.05 MΩ at 900 s). By fitting the derived equation Rdiff to the difference of impedance magnitude in Figure 5, the adjustable parameters g and σg/σm are extrapolated and shown in Figure 6. For an example, if the gap conductivity is same as one of medium (σg/σm= 1), the gap is 41.5 nm at 300 s, 46.0 nm at 500 s, 44.0 nm at 700 s, and 41.1 nm at 900 s. Thus, the relationship between the interfacial parameters g and σg can be used to explain the behaviour of embedded single cells. If σg is determined by means of using the ion channel blockers, the value of g can be achieved. Based on the investigation, it is expected to monitor the interfacial parameters as the response of embedded single cells under various environments. Further, the derived equation can be adapted to various micro fluidic systems for single cell analyses by impedance spectroscopy.
The results of this article show that the behaviour of a partially embedded cell can be determined by the described methods and that the biological relevant changes of cell membrane can be reflected in measured impedance. These are important preconditions for the development of single cell-based sensors using impedance spectroscopy with microhole interfacing single cells. One example for the cell based-sensor would be a cell chip with microhole array. The advantage of a planar microhole array is that the surface chemistry and geometry of the interface region to the cell can be adapted to the physiologic requirements of the cells. Further, with an array of microholes, statistically relevant data on the single cell level about the effect of active substances or the state of the cells can be derived. Such cell-based sensors will be useful for example to test on the single cell level the toxicity of substances or the condition of cells after treatment (e.g. drug injection, gene transfection).

4. Conclusions

As one precondition for the development of sensor based on the impedance measurement at a cell/microhole interface, the impedance measurement on cells embedded in a microcapillary was investigated. An analytical equation was derived to estimate and to interpret the resistance change of capillary tip with partially embedded single cell by using the interfacial parameters i.e. length of embedded cell, equivalent gap, and gap conductivity. The frequency range in which the capturing of a cell is clearly reflected in an increase of impedance magnitude was experimentally determined by impedance measurement with capillary system. From the impedance monitoring of embedded cell during the addition of DMSO, it was shown that the impedance measurement of capillary tip with partially embedded cell at the low frequency is determined by the morphological and physiological changes of cell. As the length of embedded cell increases during the aspiration, the impedance magnitude at the low frequency was increased correspondingly. By fitting the derived equation to measured impedance of embedded cells deformed at different negative pressure levels, it was able to extrapolate the equivalent gap and gap conductivity related with cellular behaviour. The results of this paper reported important preconditions for the development of single cell-based sensors using impedance measurement with microhole interfacing single cells.

References

  1. Carlo, D.D.; Lee, L. P. Dynamic single-cell analysis for quantitative biology. Analytical Chemistry 2006, 6, 7918–7925. [Google Scholar]
  2. Mack, A.; Thielecke, H.; Robitzki, A. 3D-biohybrid systems: applications in drug screening. TRENDS in Biotechnology 2001, 20, 56–61. [Google Scholar]
  3. Vestergaard, M.; Kerman, K.; Tamiya, E. An overview of label-free electrochemical protein sensors. Sensors 2007, 7, 3442–3458. [Google Scholar]
  4. Giaever, I.; Keese, C.R. A morphological biosensor for mammalian cells. Nature 1993, 366, 591–592. [Google Scholar]
  5. Cho, S.; Becker, S.; Briesen, H.; Thielecke, H. Impedance monitoring of herpes simplex virus-induced cytopathic effect in Vero cells. Sensors and Actuators B: Chemical 2007, 123, 978–982. [Google Scholar]
  6. Schwan, H. P. Advances in Biological and Medical Physics; Lawrence, J. H., Tobias, C. A., Eds.; Academic Press: New York, 1957; pp. 147–209. [Google Scholar]
  7. Schwan, H. P. Physical technique in biological research; Nastuk, W. L., Ed.; Academic Press: New York, 1965; pp. 323–407. [Google Scholar]
  8. Bao, J.Z.; Davis, C. C.; Schmukler, R. E. Frequency domain impedance measurements of erythrocytes-Constant phase angle impedance characteristics and a phase transition. Biophysical Journal 1992, 61, 1427–1434. [Google Scholar]
  9. Bao, J.Z.; Davis, C. C.; Schmukler, R. E. Impedance spectroscopy of human erythrocytes: System calibration and nonlinear modeling. IEEE Transactions on biomedical engineering 1993, 40, 364–378. [Google Scholar]
  10. Takashima, S.; Asami, K.; Takahashi, Y. Frequency domain studies of impedance characteristics of biological cells using micropipette technique. Biophysical Journal 1988, 54, 995–1000. [Google Scholar]
  11. Asami, K.; Takahashi, Y.; Takashima, S. Frequency domain analysis of membrane capacitance of cultured cells (HeLa and myeloma) using the micropipette technique. Biophysical Journal 1990, 58, 143–148. [Google Scholar]
  12. Ayliffe, H.E.; Frazier, A. B.; Rabbitt, R. D. Electric impedance spectroscopy using microchannels with integrated metal electrodes. Journal of Microelectromechanical Systems 1999, 8, 50–57. [Google Scholar]
  13. Han, A.; Frazier, A.B. Ion channel characterization using single cell impedance spectroscopy. Lab on a Chip 2006, 6, 1412–1414. [Google Scholar]
  14. Cho, Y.H.; Yamamoto, T.; Sakai, Y.; Fujii, T.; Kim, B. Development of microfluidic device for electrical/physical characterization of single cell. Journal of Microelectromechanical Systems 2006, 15, 287–295. [Google Scholar]
  15. Diaz-Rivera, R.E.; Rubinsky, B. Electrical and thermal characterization of nanochannels between a cell and a silicon based micro-pore. Biomedical Microdevices 2006, 8, 25–34. [Google Scholar]
  16. Cho, S.; Thielecke, H. Micro hole-based cell chip with impedance spectroscopy. Biosensors and Bioelectronics 2007, 22, 1764–1768. [Google Scholar]
  17. Evans, E.A.; Waugh, R.; Melnik, L. Elastic area compressibility modulus of red cell membrane. Biophysical Journal 1976, 16, 585–595. [Google Scholar]
  18. Needham, D.; Hochmuth, R.M. A sensitive measure of surface stress in the resting neutrophil. Biophysical Journal 1992, 61, 1664–1670. [Google Scholar]
  19. Newman, J. Resistance for flow of current to a disk. Journal of Electrochemical Society 1966, 113, 501–502. [Google Scholar]
  20. Fang, Y. Non-invasive optical biosensor for probing cell. Sensors 2007, 7, 2316–2329. [Google Scholar]
  21. Tokuhiro, T.; Menafra, L.; Szmant, H. H. Contribution of relaxation and chemical shift results to the elucidation of the structure of the water-DMSO liquid system. Journal of Chemical Physics 1974, 61, 2275–2282. [Google Scholar]
  22. Vessey, D.A.; Cunningham, J. M.; Selden, A. C.; Woodman, A. C.; Hodgson, H. J. F. Dimethylsulphoxide induces a reduced growth rate, altered cell morphology and increased epidermal-growth-factor binding in Hep G2 cells. Biochemical Journal 1991, 277, 773–777. [Google Scholar]
Figure 1. Schematic of a single cell with high surface tension of membrane partially embedded in the tip of capillary with length L, thickness t, and inner radius r, g: interfacial equivalent gap between the cell and capillary, li: length of cylindrically shaped cell body in the capillary, ri: polar radius of semi-eccentrically shaped end of cell in the capillary, ro : radius of spherically shaped cell external to the capillary entrance, a = { r o 2 r 2 } 1 / 2, θ1 = cos−1((r + t)/ro).
Sensors 08 01198f1
Figure 2. Schematic of experimental setup for impedance measurement of a single cell at the tip of a capillary.
Sensors 08 01198f2
Figure 3. Contribution of resistance in the region 3 of Figure 1 to the total resistance difference of an embedded cell (R3/Rdiff) at different length of embedded cell li with equivalent gap g (t = 1 μm, r = 4 μm, ri = 2 μm, ro = 12 μm, σm, σg = 1.6 S/m) (A) or with gap conductivity σg (t = 1 μm, r = 4 μm, ri = 2 μm, ro = 12 μm, g = 40 nm, σm = 1.6 S/m) (B).
Sensors 08 01198f3
Figure 4. A: Measured impedance spectra for a L929 cell captured at the tip of capillary and for a capillary without cell, B and C: Change of impedance magnitude (|Z|capture − |Z|non-capture) at 100 Hz in response on the following events: (a) capture, (b) application of DMSO (100 μl of culture medium with 5% DMSO into 1 ml medium in the dish, (c) cell membrane breakdown, and (d) release, In panel B, the impedance for a latex bead captured at the capillary is shown additionally.
Sensors 08 01198f4aSensors 08 01198f4b
Figure 5. Micrographs of an embedded cell when the level of negative pressure is 8.3 mbar at 300 s, 11 mbar at 500 s, 15.5 mbar at 700 s, and 21.1 mbar at 900 s (A), the difference of impedance magnitude at 100 Hz during the aspiration (B), arrow: the time of capture.
Sensors 08 01198f5
Figure 6. Equivalent gap (g) and the ratio of gap conductivity to medium one (σg/σm) extrapolated by fitting the equation Rdiff to the difference of impedance magnitude at 100 Hz of Figure 5.
Sensors 08 01198f6

