Article

Integrated Electrochemical Analysis System with Microfluidic and Sensing Functions

Graduate School of Pure and Applied Sciences, University of Tsukuba, 1-1-1 Tennodai, Tsukuba, Ibaraki 305-8573, Japan
*
Author to whom correspondence should be addressed.
Sensors 2008, 8(2), 1111-1127; https://doi.org/10.3390/s8021111
Submission received: 17 January 2008 / Accepted: 18 February 2008 / Published: 21 February 2008

Abstract

:
An integrated device that carries out the timely transport of solutions and conducts electroanalysis was constructed. The transport of solutions was based on capillary action in overall hydrophilic flow channels and control by valves that operate on the basis of electrowetting. Electrochemical sensors including glucose, lactate, glutamic oxaloacetic transaminase (GOT), glutamic pyruvic transaminase (GPT), pH, ammonia, urea, and creatinine were integrated. An air gap structure was used for the ammonia, urea, and creatinine sensors to realize a rapid response. To enhance the transport of ammonia that existed or was produced by the enzymatic reactions, the pH of the solution was elevated by mixing it with a NaOH solution using a valve based on electrowetting. The sensors for GOT and GPT used a freeze-dried substrate matrix to realize rapid mixing. The sample solution was transported to required sensing sites at desired times. The integrated sensors showed distinct responses when a sample solution reached the respective sensing sites. Linear relationships were observed between the output signals and the concentration or the logarithm of the concentration of the analytes. An interferent, L-ascorbic acid, could be eliminated electrochemically in the sample injection port.

1. Introduction

Over the last decade, μTAS or Lab-on-a-Chip technology has made remarkable progress, and devices of high functionality have been reported for various applications [1, 2]. Although many possibilities have been considered with regard to the application and combination of functions, one possible direction will be to integrate many biochemical sensors along with a microfluidic transport function such as electronic integrated circuits. The advance of electronic device technology has realized very highly integrated intelligent devices with high functionality. On the other hand, the integration of the microfluidic function has discouragingly lagged behind, although micro-chemical sensor technology has advanced over the last two decades [3, 4]. This may be because of the complexity of mechanical parts, such as micropumps [5-8], and/or the optical detection on which the majority of the previous microanalysis systems depend. When we take a look at basic components in electronic devices such as transistors, resistors, and capacitors, we notice that their structure and function are very simple. The same rule indeed applies to biochemical microsystems, particularly, to microfluidic transport.
In systems of microscopic scale, surface effects are dominant. Therefore, it is reasonable to use such effects to realize efficient microfluidic transport. In our device, in particular, we took advantage of capillary action and electrowetting because the structure and function of the device can be simplified. Electrowetting is a technique to change the wettability of the surface of a metal electrode or a dielectric on an electrode by controlling the electrode potential [9-11]; it has already been used in microfluidic systems in various forms [12-18]. We have already developed such electrowetting-based microfluidic transport systems and succeeded in the integration of functions, including microfluidic transport, mixing, and sensing [13, 15]. In the systems, solutions were transported on elongated working electrodes that could be made hydrophilic by switching. However, if a motive force for the liquid column is generated in a hydrophilic flow channel by capillary action and the electrode to cause electrowetting is used as a short valve, more efficient transport will be realized. The advantages of the capillary action have already been demonstrated in previous research [2, 19]. The most attractive feature is that no external energy is needed.
If a microfluidic system that can realize efficient handling of solutions becomes feasible, microsystems for bio / chemical analyses will become possible. Many applications have been considered, including the analysis of DNAs and proteins; for this study, we chose critical analytes for blood analysis. This is because we can test various major and optional technologies on the integrated chip. As shown by the progress made over the last two decades [3], electrochemical sensors are very advantageous for miniaturization. Since the metals used for microfluidic transport and sensing are almost the same, patterns of electrodes can be formed by the same process. Moreover, other optional functions, including the mixing of solutions and separation of a gas, could be incorporated along with the microfluidic and sensing functions. In this study, the fabrication and performance of a microfluidic transport system and the realization of a highly sophisticated electrochemical analysis system will be presented.

2. Experimental

2.1. Reagents and materials

The materials and reagents used for fabrication and experiments were obtained from the following commercial sources: glass wafers (#7740, diameter: 3″, 500 μm thick), from Corning Japan (Tokyo, Japan); thick-film photoresist, SU-8, from MicroChem (MA, U.S.A.); precursor solutions of PDMS, KE-1300T, and CAT-1300, from Shin-Etsu Chemical (Tokyo, Japan); precursor solution of PVA-SbQ (SPP-H-13), from Toyo Gosei Kogyo (Chiba, Japan); glucose oxidase (GOD, EC 1.1.3.4, from a microorganism), GOT (also called aspartate aminotransferase, EC 2.6.1.1, from pig heart), GPT (also called alanine aminotransferase, EC 2.6.1.2, from pig heart), and urease (EC 3.5.1.5, from jack bean), from Wako Pure Chemical Industries (Osaka, Japan); lactate oxidase (LOD, EC 1.1.3.2, from pediococcus species) and bovine serum albumin (BSA), from Sigma-Aldrich Corporation (MO, U.S.A.); and creatinine deiminase (EC 3.5.4.21, from Bacillus sp.), from Toyobo (Osaka, Japan). L-glutamate oxidase (L-GlOx, EC 1.4.3.11, from Streptomyces sp.) was a gift from Yamasa (Chiba, Japan). Other reagents were obtained from Wako Pure Chemical Industries (Osaka, Japan). All other reagents were of reagent grade and used without purification. Solutions were prepared with distilled deionized water. For comparative experiments, analysis kits for absorption spectroscopy were obtained from the following commercial sources: Test-Wako (glucose CII, transaminase CII, ammonia, creatinine, and urea nitrogen B) from Wako Pure Chemical Industries (Osaka, Japan); and determiner LA (lactic acid), from Kyowa Medex (Tokyo, Japan).

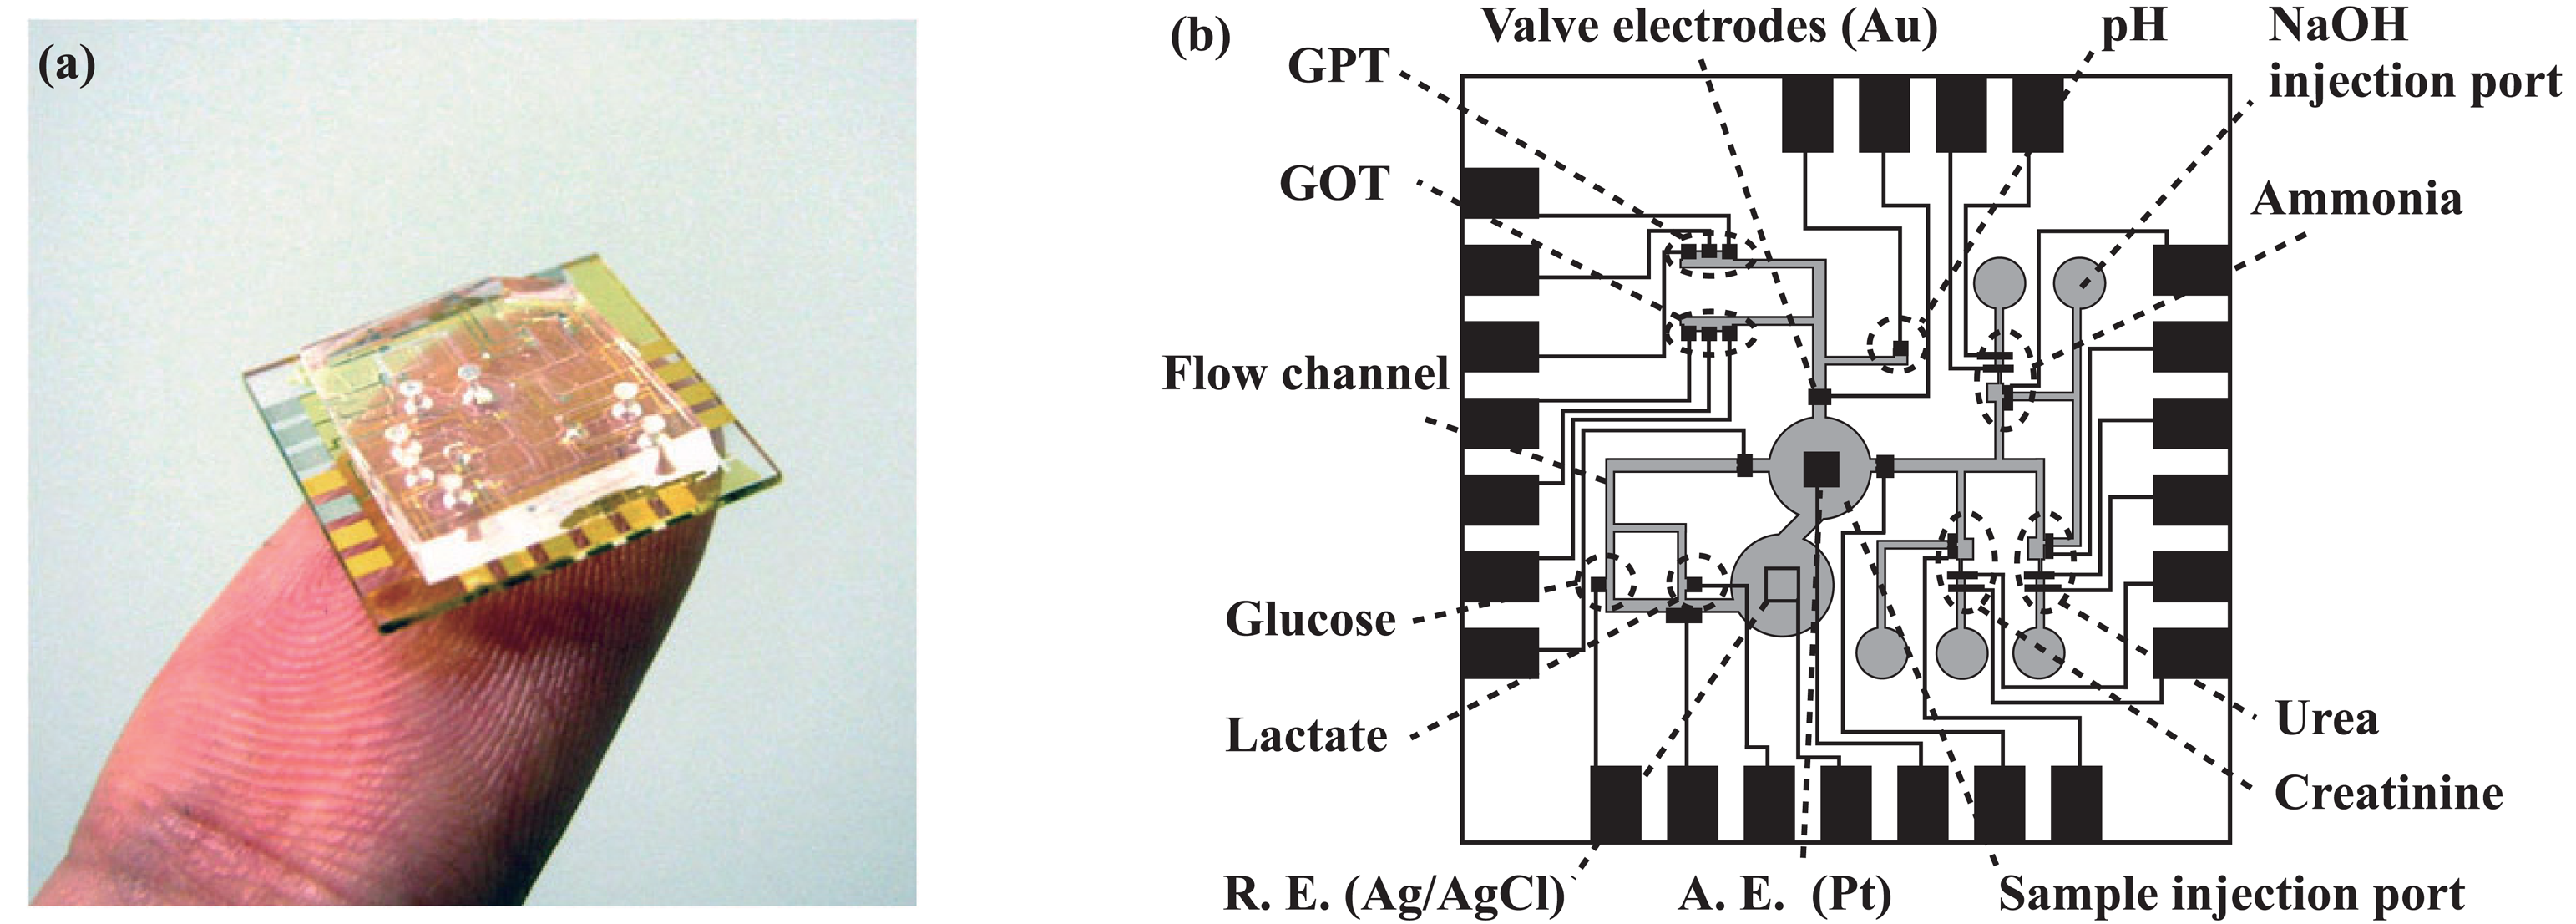
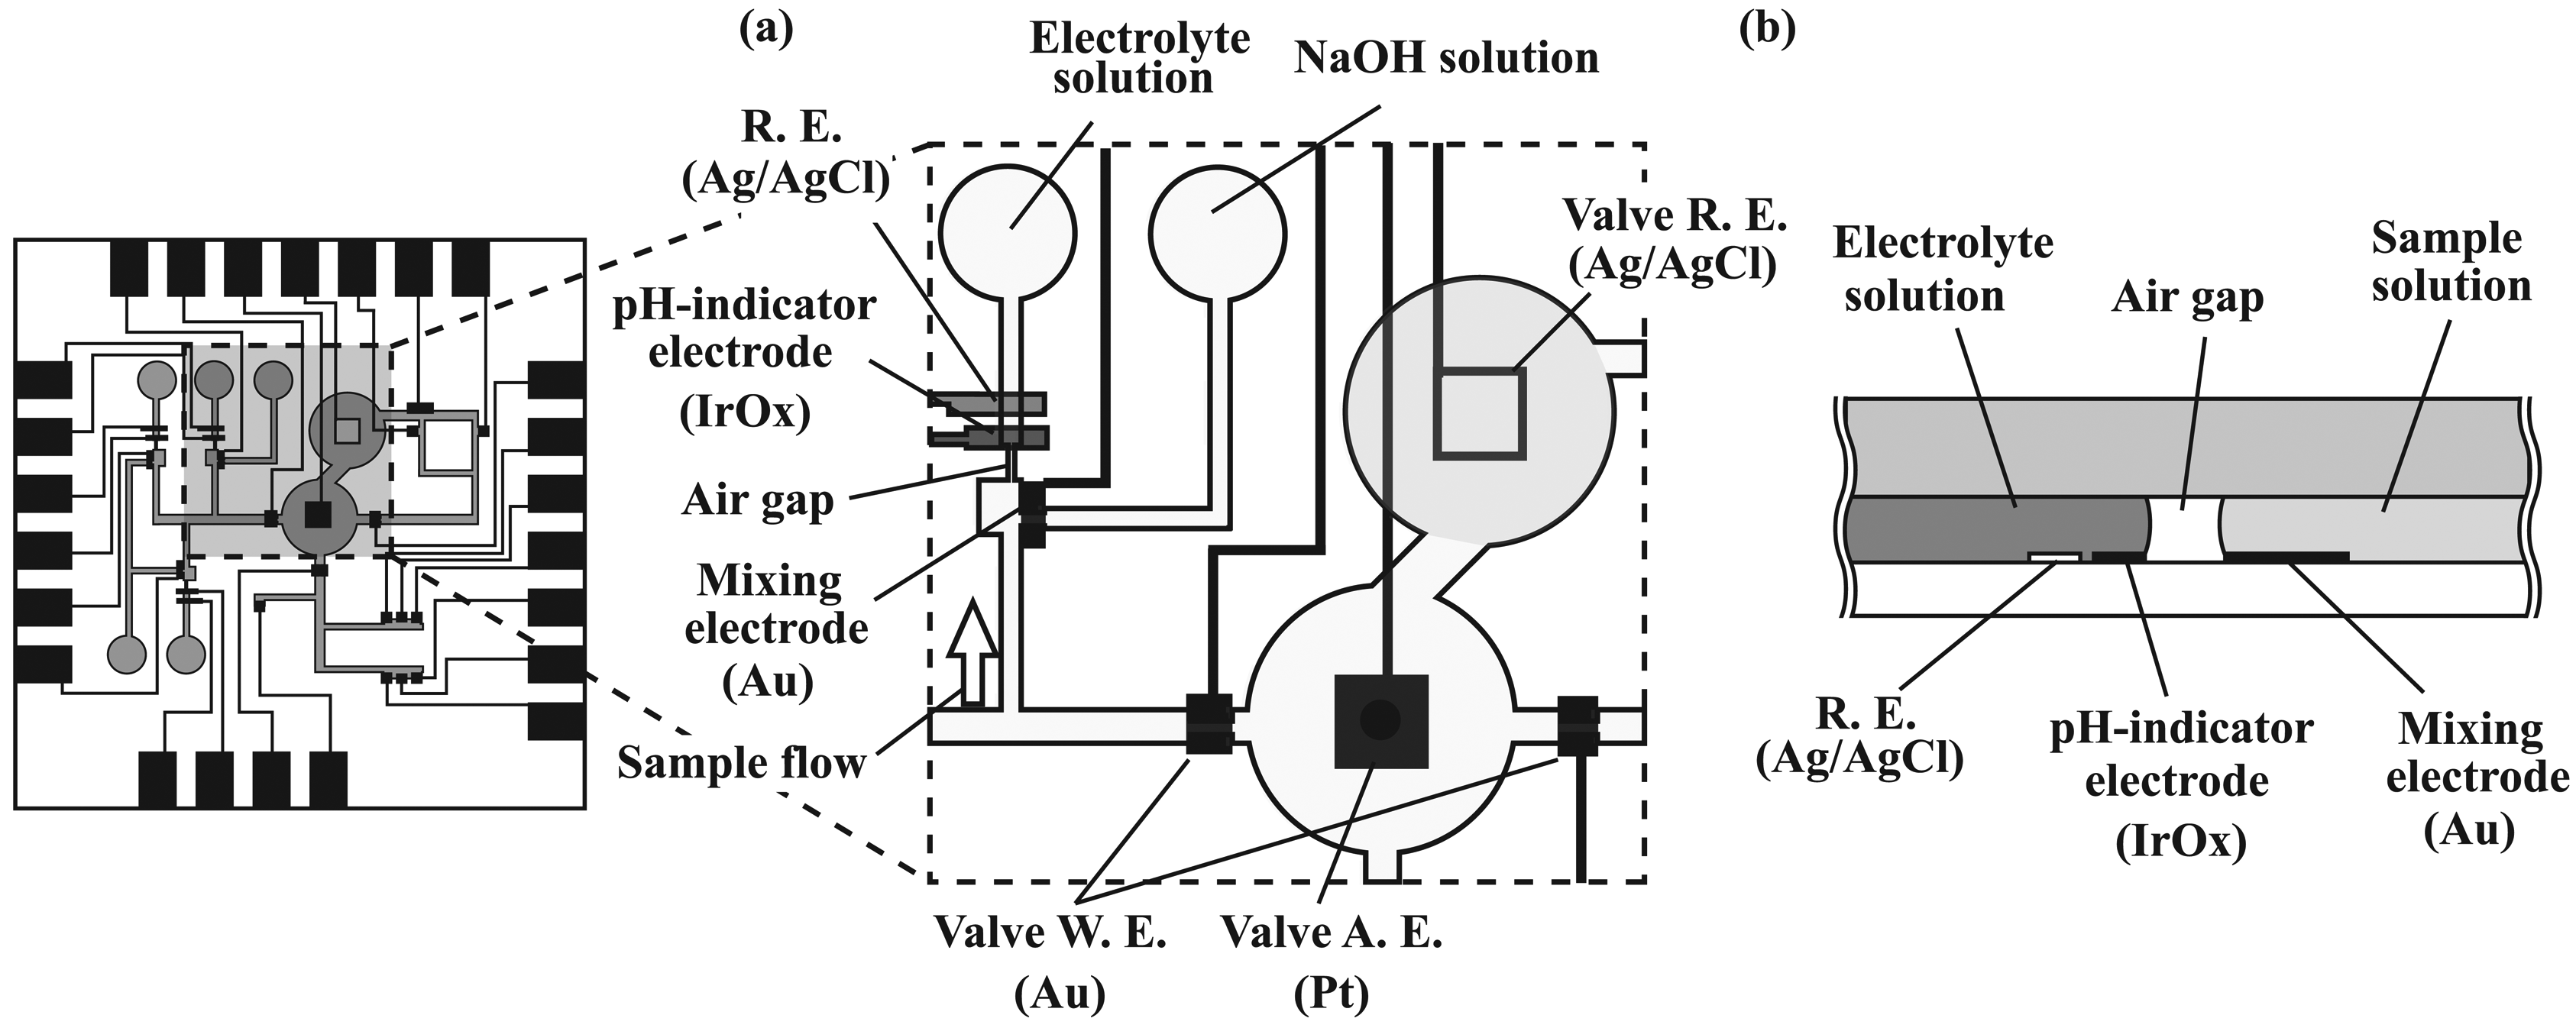
2.2. Overall structure of the microsystem

The dimensions of the fabricated device were 15 mm × 15 mm [Figure 1 (a)]. The major components were a glass substrate with electrodes and a PDMS substrate with sensing compartments, flow channels, and injection ports.
The injection ports were formed for a sample solution, a NaOH solution, and electrolyte solutions for the ammonia, urea, and creatinine sensors. A sample injection port was formed at the center, and three main flow channels extended from there to deliver a sample solution to the respective sensing sites [Figure 1(b)]. The height of the flow channels was 40 μm. The width of the main flow channel, branched flow channels to sensing areas, and valve areas was 300 μm, 150 μm, and 100 μm, respectively. One of the flow channels extended to the glucose- and lactate-sensing areas. The second flow channel extended to the pH-, GOT-, and GPT-sensing areas. The third flow channel was connected to the ammonia-, urea-, and creatinine-sensing areas. For the last three sensors, additional valves were formed to mix the sample solutions with a NaOH solution to change the pH. Valves were formed next to the sample injection port to transport the solution only to desired sensing sites at required times. The driving electrodes for the valves consisted of three-electrode systems, each of which consisted of a gold working electrode that functioned as a valve, a liquid junction Ag/AgCl reference electrode connected to the sample injection port, which was filled with a PVA-SbQ gel containing a 0.1 M KCl solution, and a platinum auxiliary electrode in the sample injection port. The valves were placed at the indicated positions in view of the possibility of carrying out preprocessing, such as the elimination of interferents and separation of blood cells in the sample injection port or an additional module connected at that location.

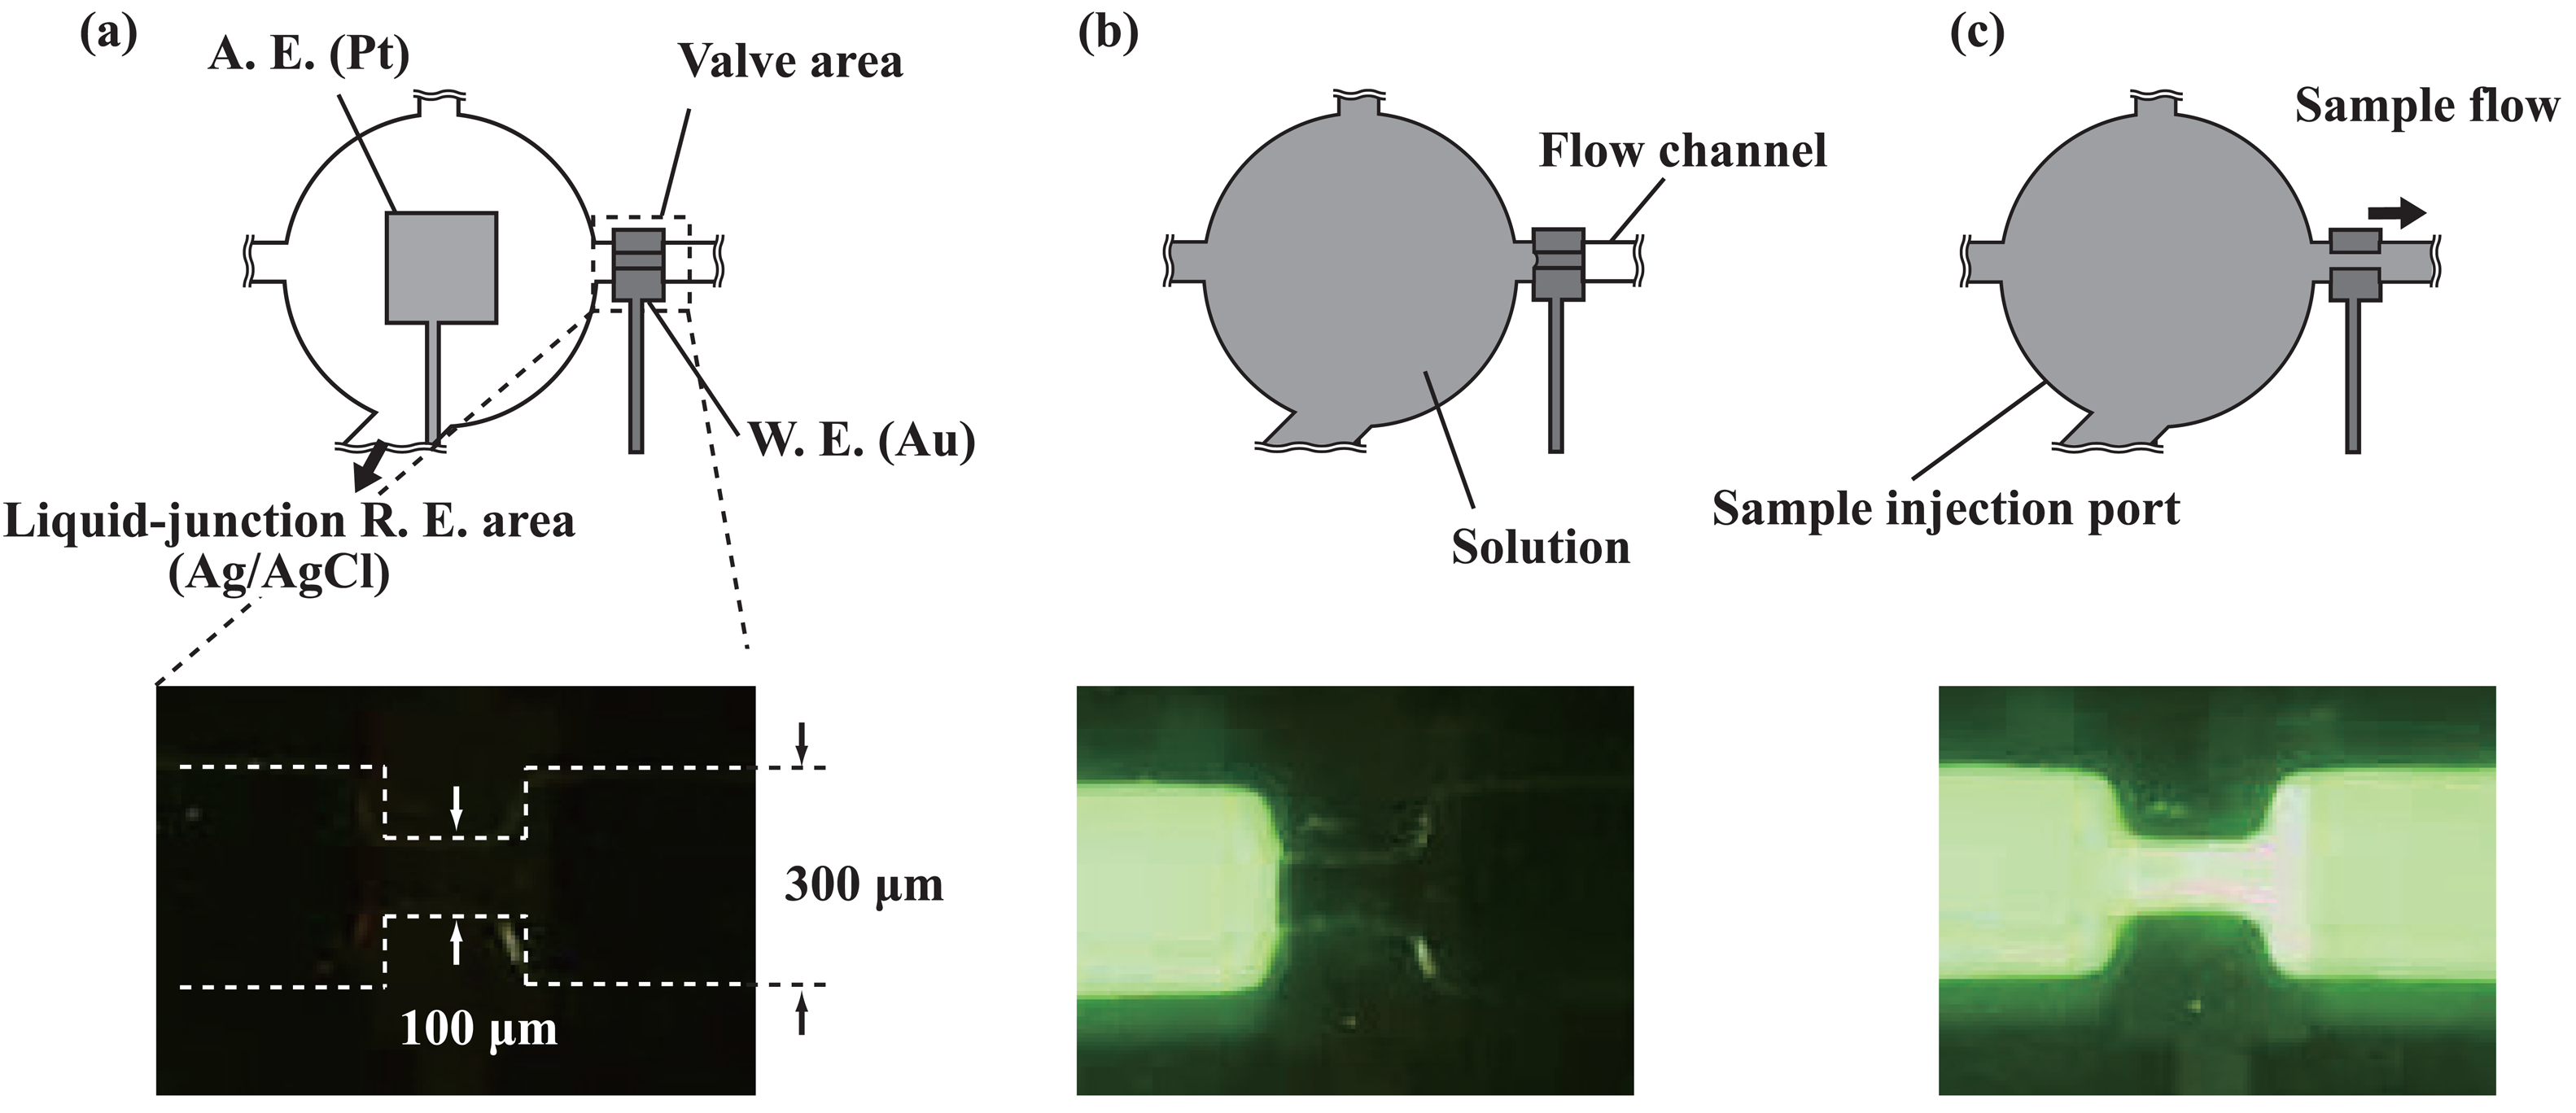
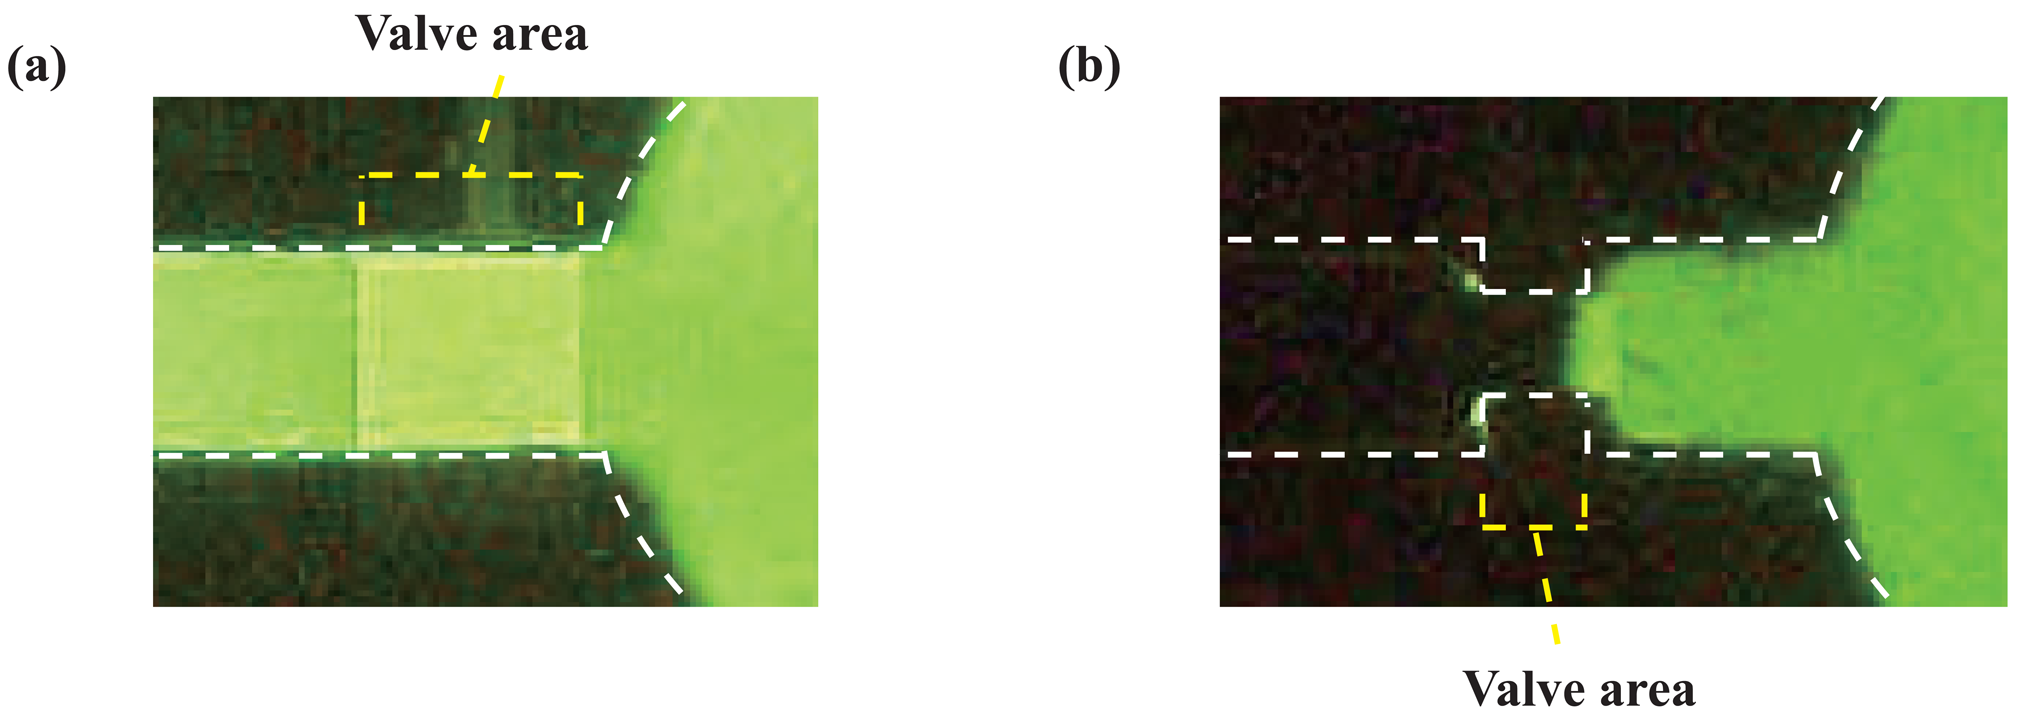
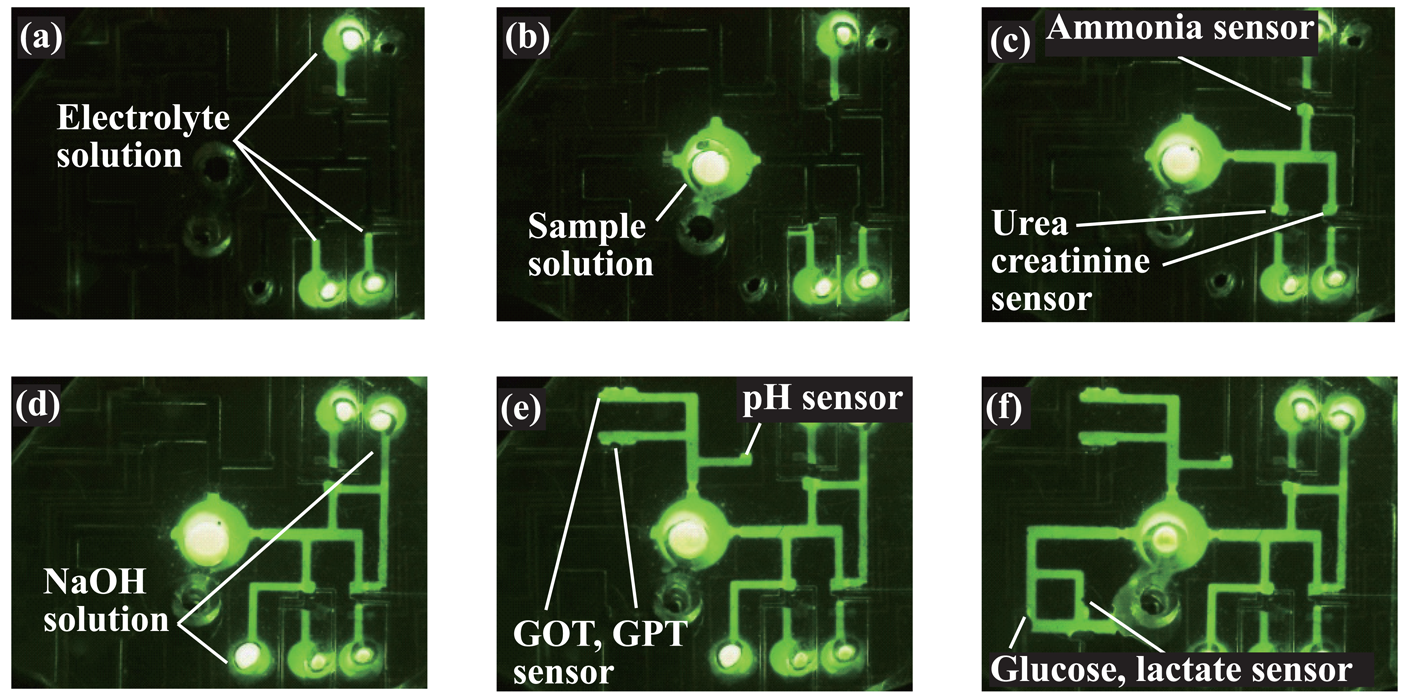
2.3. Transport of solutions

The transport of solutions in the flow channels was based on the spontaneous movement of a solution by capillary action and the timely opening of the valves. Capillary action became effective in the micrometer scale and provided an efficient means for microfluidic transport [2]. Since the bottom of the flow channel (glass) on the device was hydrophilic, the motive force was sufficiently strong to mobilize the liquid columns. The flow velocity in the micro-flow channels is satisfactorily explained by Washburn's model [20]. The flow velocity depends on the geometry and wettability of the flow channel, as follows [21-24]:
ν = γ LV 8 η x ( h w h + w ) 2 [ 2 cos θ PDMS w + cos θ PDMS + cos θ Glass h h ]
Here, v is the averaged flow velocity, h, the height of the flow channel, w, the width of the flow channel, η, the viscosity of the solution, x, the distance from the inlet of the flow channel to the meniscus of the moving liquid column, γLV, the interfacial tension between the solution and the capillary wall, and θPDMS and θGlass, the contact angles on PDMS and glass, respectively. As anticipated from this equation, v decreases as the solution moves forward. The movement of the solution in the valve area can also be described by replacing θGlass with the contact angle on the gold electrode, θAu. To make the valves function more effectively, the portion of the flow channel at the valve area was narrowed. The stopping ability of valves of various geometries can be checked using an equation similar to Eq. (1) [24]. With appropriate combinations of h, w, θPDMS, and θAu, the solution does not proceed to the valve area unless a potential is applied.
Figure 2 shows the structure of one of the valve areas, including the sample injection port, and the procedure for the transport of solutions. Here, the valve was operated using the electrodes, including the auxiliary electrode in the injection port and the Ag/AgCl reference electrode next to the injection port [Figure 2 (a)]. First, a solution is filled in the injection port. The solution stops at the valve area [Figure 2 (b)]. At this moment, the electrodes are connected with the solution. When the potential is applied to the working electrode, the surface of the gold valve electrode becomes hydrophilic. Following this change, the solution passes the valve area and moves spontaneously in the overall hydrophilic flow channel [Figure 2 (c)].

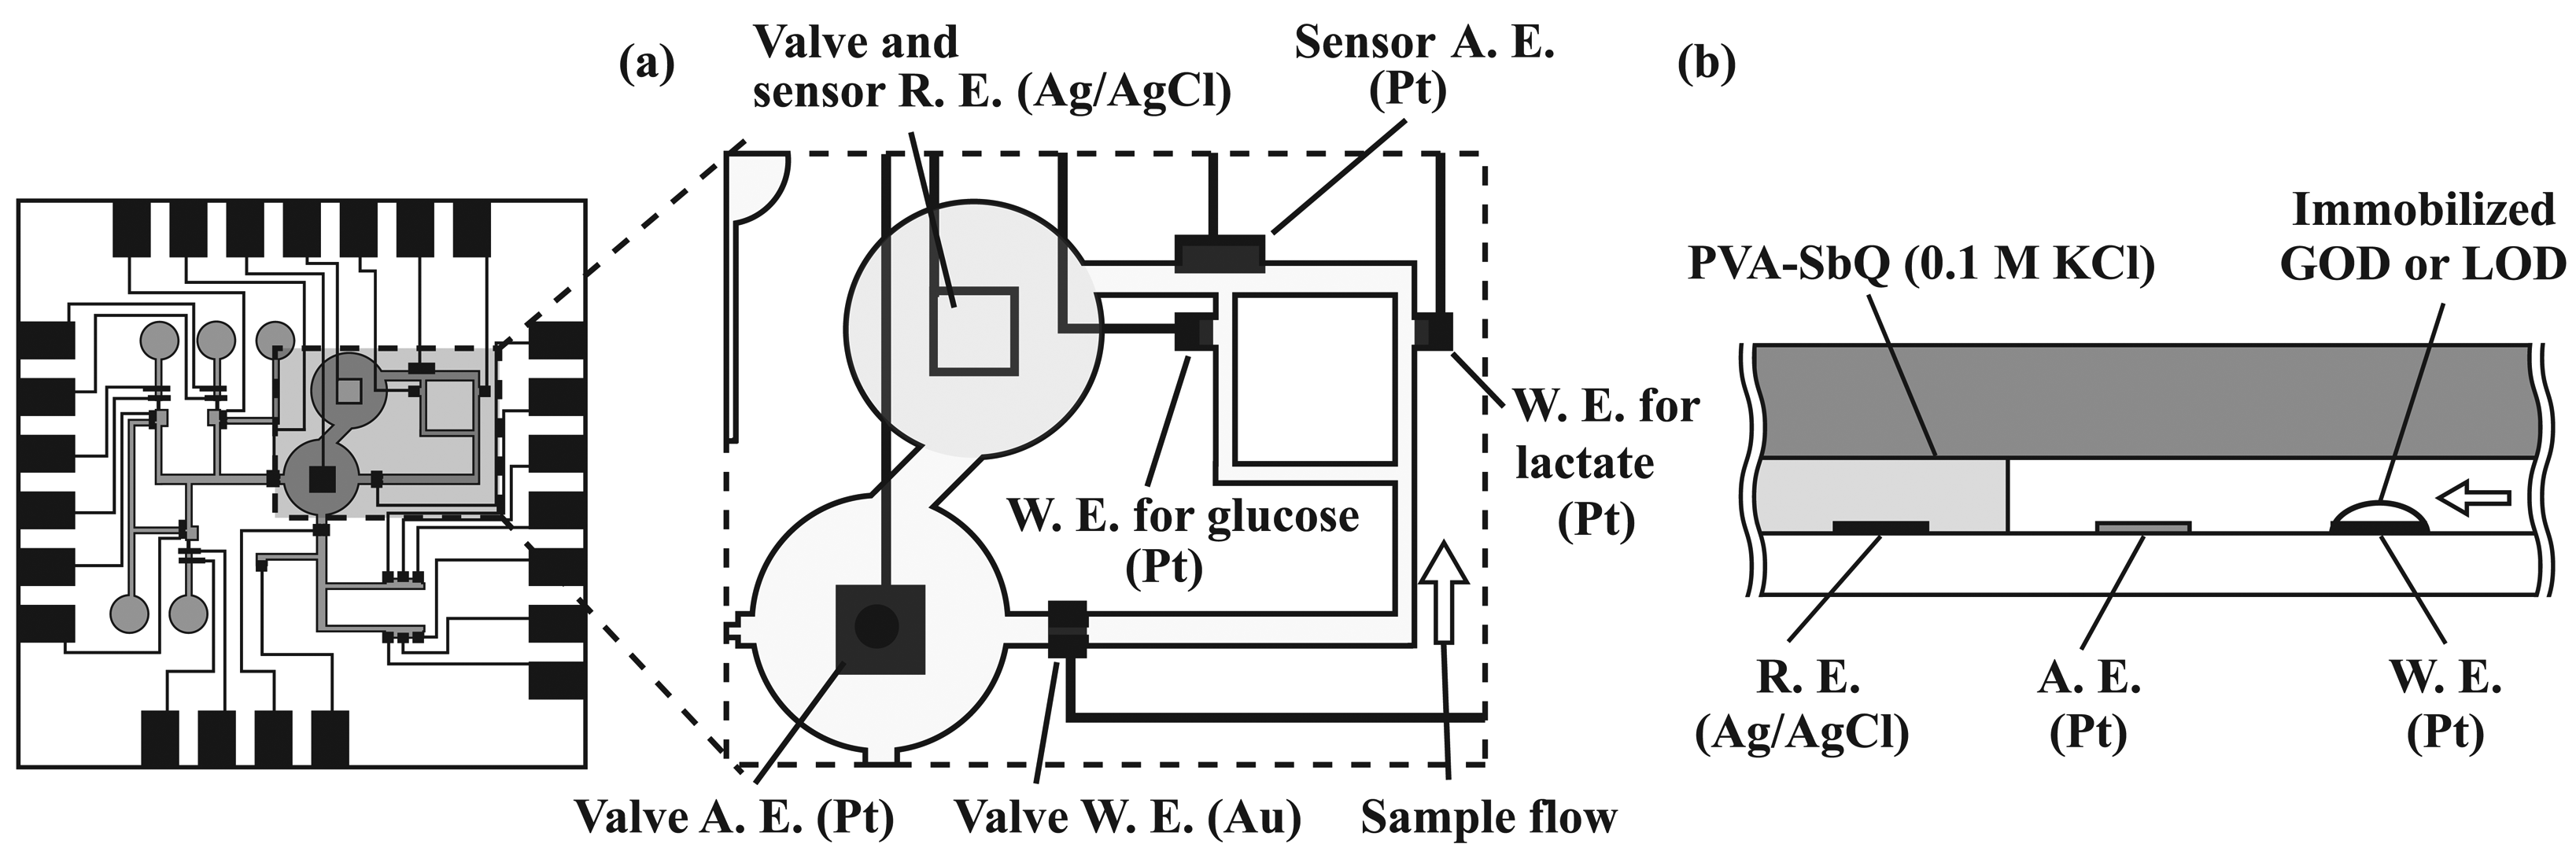
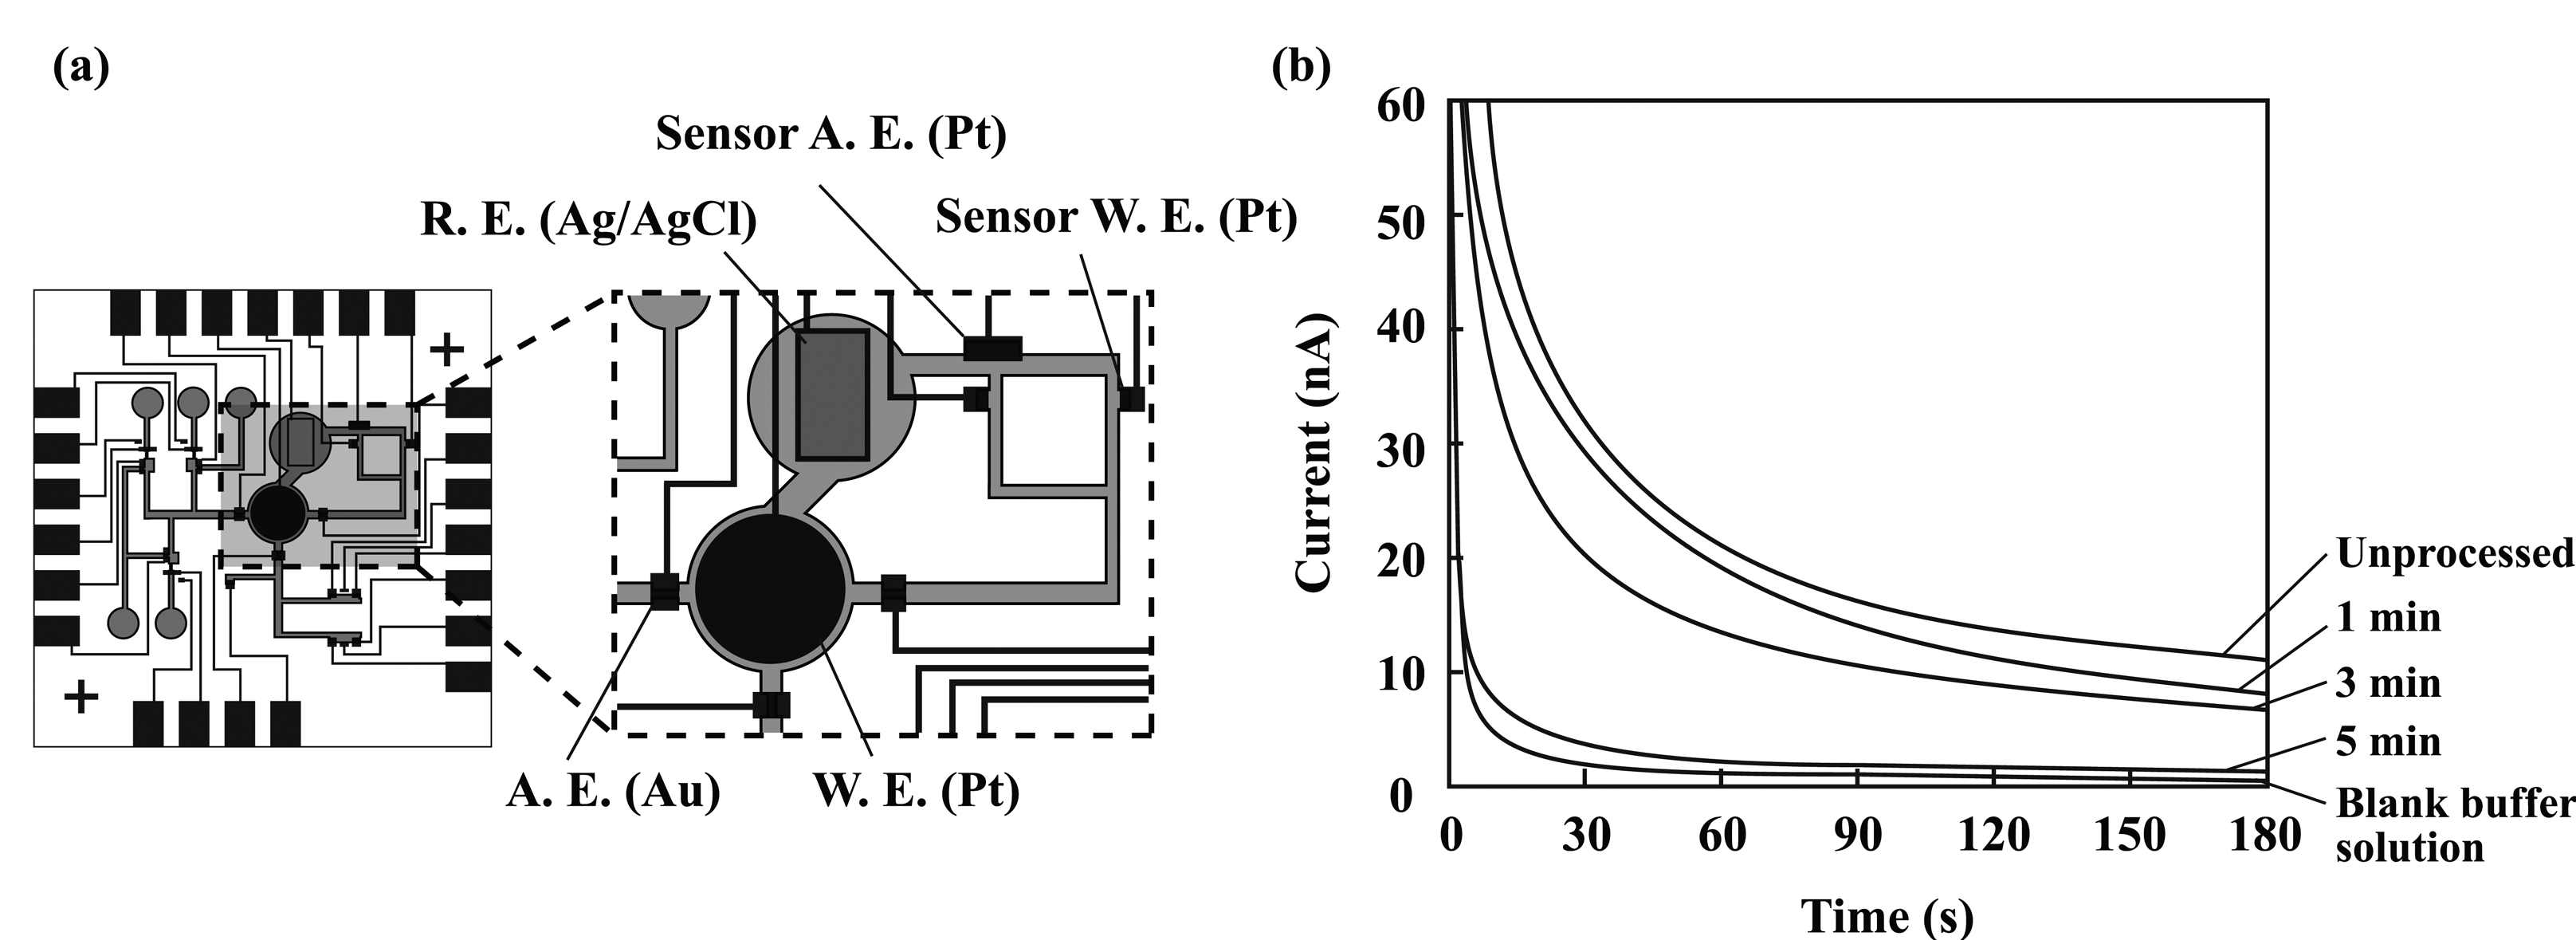
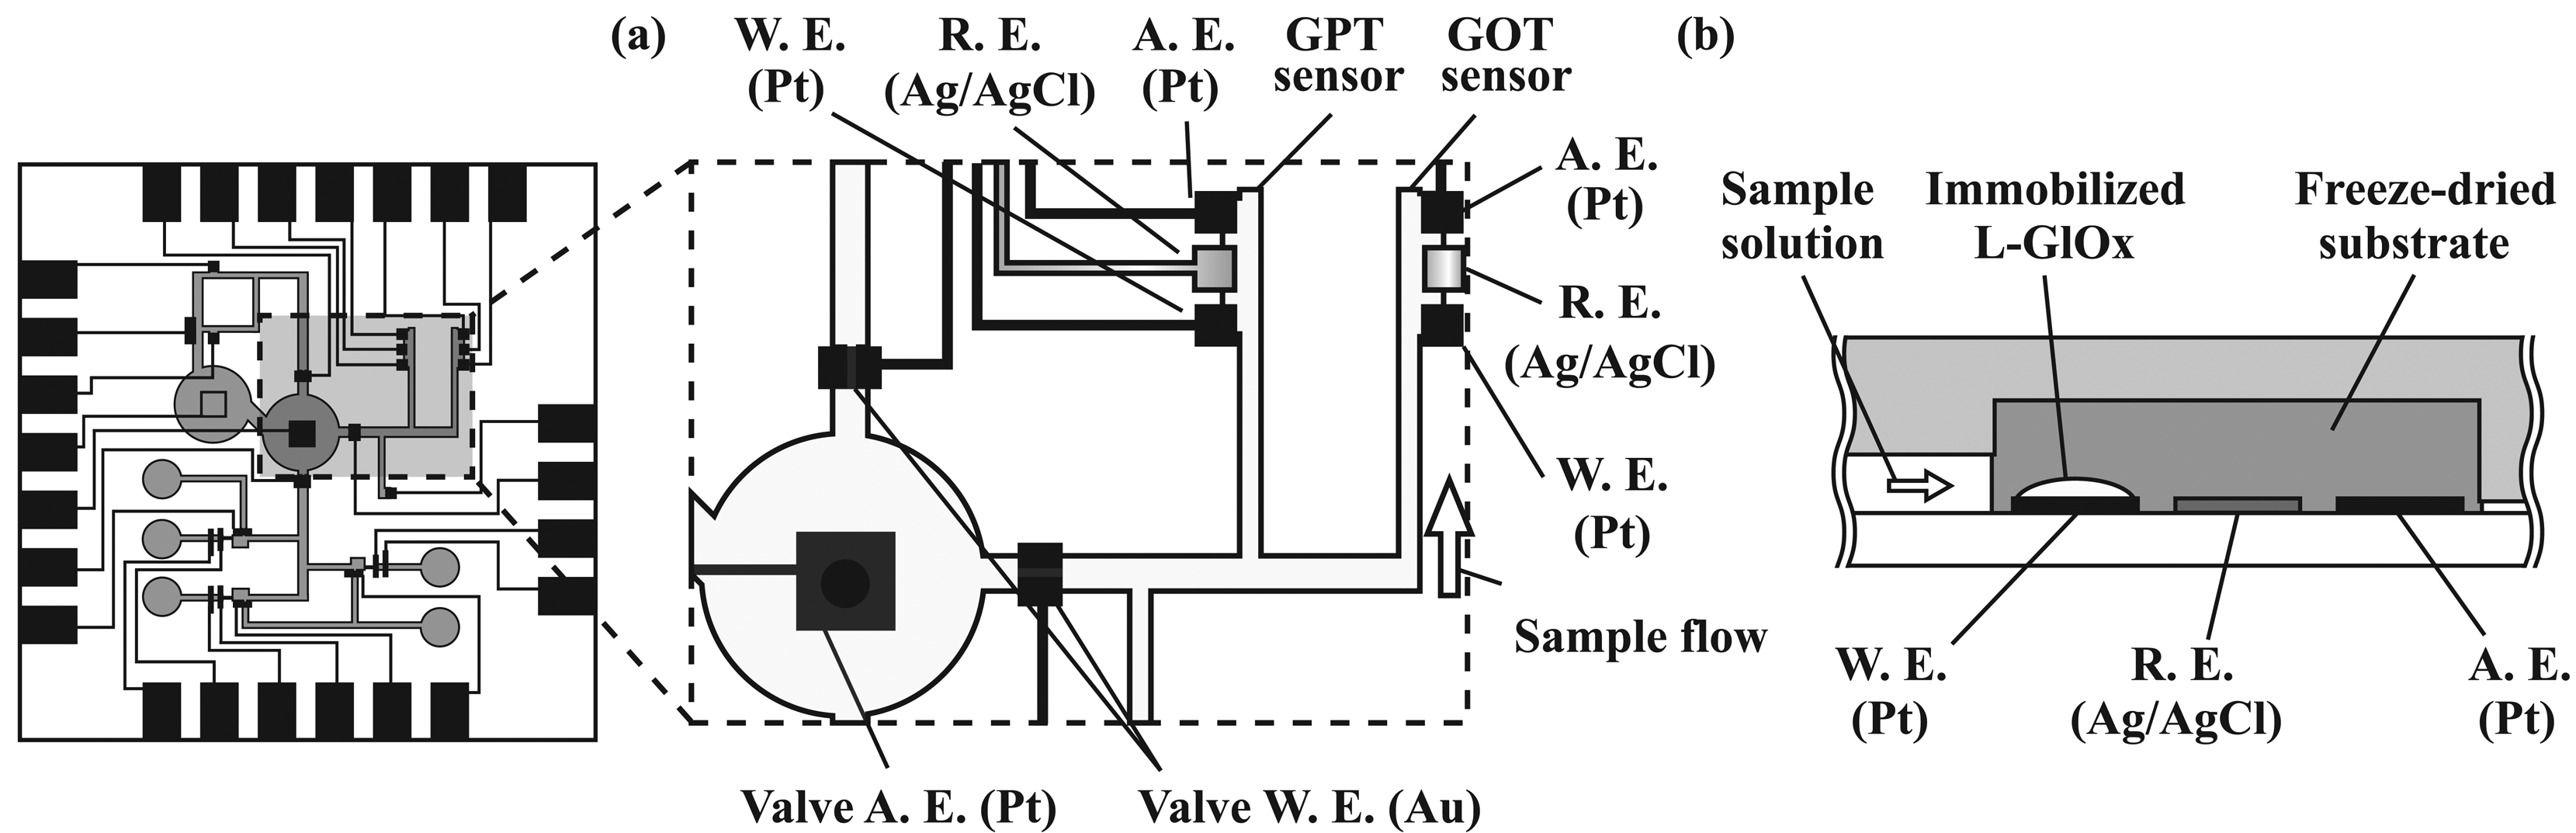
2.4. Formation of amperometric sensors

The sensors for glucose, lactate, GOT, and GPT were amperometric, whereas those for pH, ammonia, urea, and creatinine were potentiometric. Electrode patterns were formed by sputtering followed by chemical etching or lift-off after patterning of a photoresist. For biosensing, the enzymes listed in Table 1 were used.
For the amperometric sensors, three-electrode systems were formed. A platinum working electrode (200 μm × 150 μm) was used for each three-electrode system, and the corresponding enzyme was immobilized there (Figure 3). For the glucose and lactate sensors, a large reference electrode connected to the injection port was used. A platinum electrode in the corresponding connecting flow channel was used as an auxiliary electrode. The dimensions of the auxiliary electrode and the reference electrode were 600 μm × 150 μm and 0.75 mm × 0.75 mm, respectively. For the sensing of glucose and lactate, enzymatic reactions of GOD and LOD were used, and one of the reaction products, H2O2, was detected on the platinum working electrodes under a polarized condition (+0.7 V (vs. Ag/AgCl)). The current was generated in proportion to the concentration of the analyte.
The GOT and GPT sensors used a reference electrode formed near the working electrode. To detect a final reaction product, L-glutamate, an L-glutamate sensor was formed by immobilizing L-glutamate oxidase on the platinum working electrode (Figure 4). Here, the mixing of a substrate solution and a sample solution that contains the enzymes presents a problem. To demonstrate one possibility for the mixing of components, enzyme substrates were freeze-dried in a bovine serum albumin (BSA) matrix and packed in the sensing area [25]. To form the freeze-dried substrates, 100 μl of a solution containing the substrates was well mixed with 50 μl of a 10 wt.% BSA solution and 50 μl of a 0.1 wt.% glutaraldehyde solution. The mixed solution was then filled in the corresponding flow channels before the PDMS substrate was attached to the glass substrate, frozen at -25 °C for one hour, and freeze-dried for 30 min using a freeze-drier (FDU-1200, Tokyo Rikakikai, Tokyo, Japan). To measure the enzyme activities, the following combinations of substrates were used: L-aspartate and α-ketoglutarate for GOT, and L-alanine and α-ketoglutarate for GPT. The rate of current increase was related with the activity of the enzymes.

2.5. Formation of potentiometric sensors

For pH sensing, iridium oxide was used for the pH-indicator electrode (200 μm × 150 μm). pH sensing was carried out by measuring the potential of the pH-indicator electrode with respect to the on-chip liquid-junction reference electrode connected to the injection port. Iridium oxide was grown by cycling the electrode potential between -0.9 V and 1.1 V in a 1 M LiClO4 solution [26]. For the liquid-junction reference electrode, an electrolyte solution containing 0.1 M KCl was impregnated in a PVA-SbQ gel to avoid contact with the sample solution. A silver layer was covered with a negative photoresist layer, and AgCl layers were formed from four square pinholes of 50 μm × 50 μm. The detection using the other potentiometric sensors was also based on the measurement of the pH. The sensing of ammonia was based on the measurement of the pH change caused by the dissolution of ammonia into the electrolyte solution (Figure 5). For each sensor, a pH-indicator electrode (150 μm × 150 μm) and a Ag/AgCl electrode were formed in the same flow channel filled with an electrolyte solution containing 0.1 M NH4Cl and 0.1 M KCl. In order to promote the production of gaseous ammonia, a mixing valve was formed to mix the sample solution with a NaOH solution. Furthermore, to realize a fast response, an air gap was formed between the flow channel for the sample solution and that for the electrolyte solution [27].
Other than the sensing of pH and ammonia, enzyme reactions were used to form biosensors (Table 1). For the urea and creatinine sensors, urease or creatinine deiminase was immobilized at the end of the sample flow channels. To sense ammonia, urea, and creatinine, ammonia dissolved in the sample solutions was diffused out of them by elevating the pH. The procedure was carried out by mixing the sample solution with a 50 mM NaOH solution by opening a valve between the corresponding flow channels. The structure of the electrodes and flow channels used for this procedure is shown in Figure 6. Three flow channels for a sample solution, the electrolyte solution, and a NaOH solution were placed in close proximity. A working electrode for mixing was formed between the flow channels for the sample solution and a NaOH solution. First, the electrolyte solution was filled in the sensing area (Fig. 6 (a), (a')). Then, the two solutions were transported [Figure 6 (b), (b')]. In this status, the solutions were confined within the respective flow channels. When the potential was applied to the mixing electrode, the electrode became more hydrophilic, and the two solutions were mixed [Figure 6 (c), (c')].

2.6. Immobilization of enzymes

Enzymes were immobilized on the working electrodes for the amperometric sensors. To this end, each enzyme was dissolved in a 50 wt.% PVA-SbQ solution and mixed well. In the case of GOD and LOD, one μL of the mixed solution was carefully placed on the working electrode. Urease and creatinine deiminase were immobilized on the ceiling of the PDMS flow channel at the sensing sites.
Each of the solutions was cured under a UV-light. Our priority was the realization of the integrated analysis system. Although some practical issues, such as the influence of interferents and the adjustment of the linear range of the calibration plot, were not resolved, we did not use special membranes or structures to avoid complication in the fabrication. Concerning the elimination of electroactive interferents for amperometric sensors, a trial was made to eliminate them electrochemically in the sample injection port, which will be discussed later.

2.7. Procedures and instruments

Performance characterization of the sensors was carried out using 0.1 M phosphate buffer solutions (pH 7.4) containing 0.1 M KCl and the analytes for the sensors. Potentiostats / galvanostats (HA-151, Hokuto-Denko, Tokyo, Japan) were used for the fabrication of the device and the operation of the amperometric sensors. The potential of the potentiometric sensors was measured using an electrometer (HE-104, Hokuto-Denko). The movement of the solution was observed with a fluorescent microscope (VB-7010, Keyence, Osaka, Japan). For the comparative experiments, a microplate absorbance reader (Sunrise, Tecan, Männedorf, Switzerland) and a pH meter (pH 5000, Eutech Instruments Pte, Ayer Rajah Crescent, Singapore) were used. All experiments were conducted at room temperature.

3. Results and discussion

3.1. Microfluidic transport

The control of microfluidic transport using the valves realized the timely transport of solutions to desired directions as well as the mixing of solutions. The motive force in the flow channel was the capillary force generated mainly on the hydrophilic glass substrate. Although the flow channels were surrounded by the hydrophobic walls of PDMS, the force was sufficiently strong to mobilize liquid columns. The time required for the solution to reach the sensing sites, which were 4.5 ∼ 8 mm from the injection valves, was 3 ∼ 4 s. Although the values estimated from the Washburn model were 2.8 s, the mismatch can be explained by the surface state of the glass substrate. The glass substrate was subjected to patterning with a photoresist, and the process made the surface less hydrophilic because of the contamination. Recovery to the original clean surface will make the transport of the solution more rapid.
The flow velocity depended on the geometry and wettability of the flow channel, which also affected the ability to stop a moving solution at the valve area. When the valve electrode was formed in the straight flow channel, the valve could not stop the intruding solution even if the gold electrode was not switched on [Figure 7 (a)]. To circumvent the problem, the valve area of the flow channel was narrowed to 100 μm. The structure stopped the moving liquid column effectively when the valve was under the off state (Figure 7 (b)].
Figure 8 shows the movement of a fluorescein solution in the flow channels following the opening of the valves. First, the solution was filled in the injection port and mobilized to the sensing sites for ammonia, urea, and creatinine [Figure 8 (a)]. Then, a sample solution was introduced into the sample injection port. The solution remained there until the potential was applied to the valve working electrodes [Figure 8 (b)].
When the potential was applied to a valve electrode, the solution passed the valve area and was transported to the ammonia-, urea-, and creatinine-sensing sites [Figure 8 (c)]. Then, NaOH solutions were injected to the respective reservoirs, transported to the sensing site, and mixed using the mixing valve [Figure 8 (d)]. As the same procedure, the sample solution was transported to the pH- and the GOT/GPT activity-sensing sites [Figure 8 (e)]. Finally, the sample solution was transported to the glucose- and lactate-sensing sites [Figure 8 (f)].

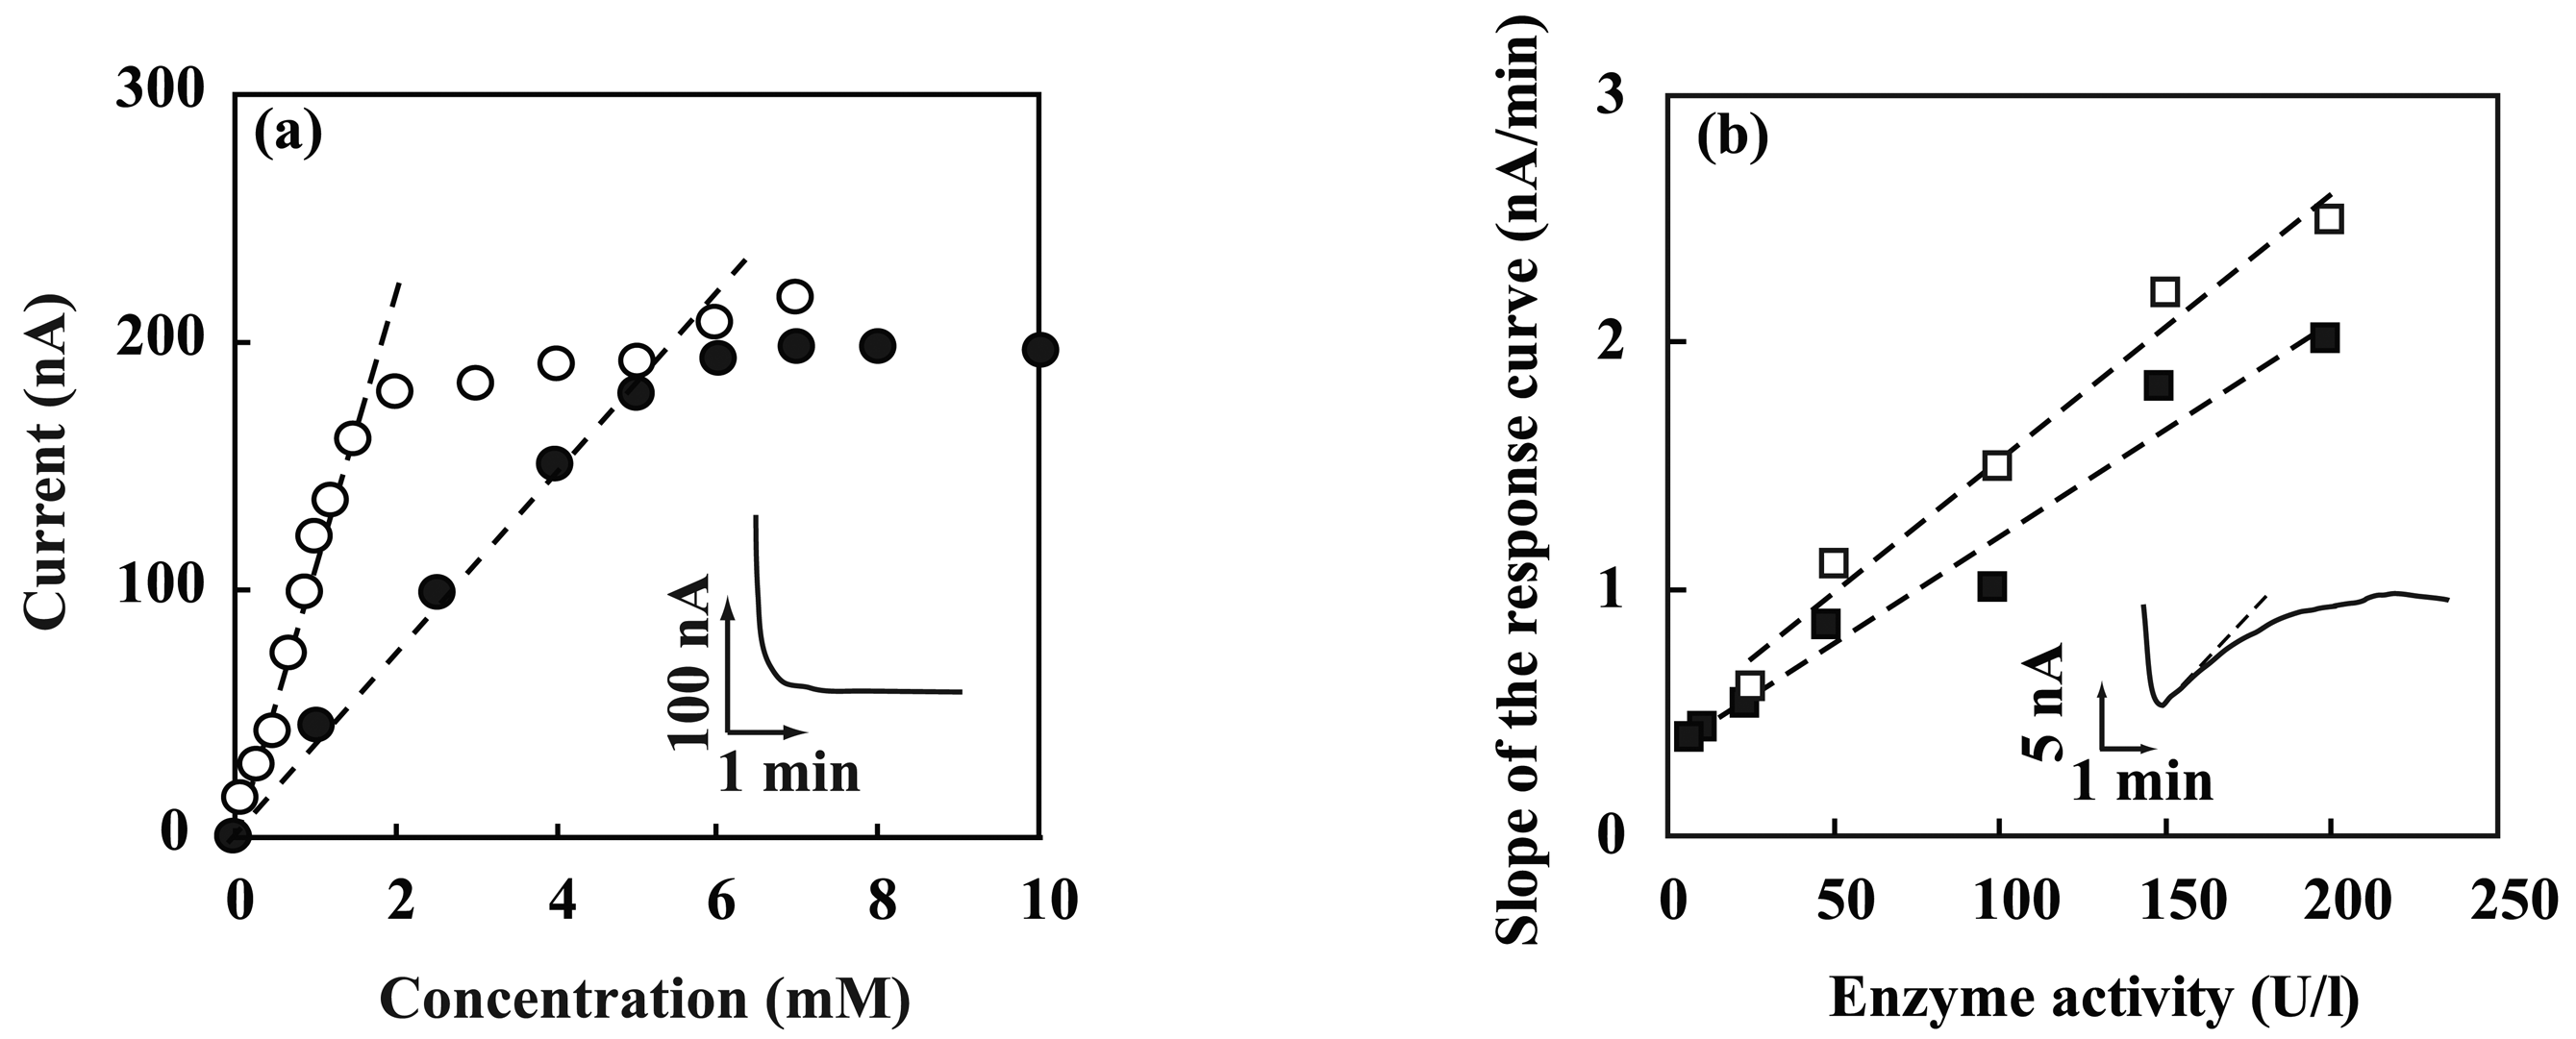
3.2. Performance characterization of amperometric sensors

Since there is no flushing function in the device, the present system is not suitable for repetitive use. Therefore, the performance of the integrated sensors was characterized by repeating the procedure, including transporting a standard solution, sensing it, decomposing the device, rinsing it with distilled deionized water, drying it, and reconstructing it. When using amperometric sensors, it may be preferable to stabilize the current output prior to injecting the sample solution. Although such a procedure is possible by adding injection ports with control valves, we tested a different method in the present study. The potentiostats used for the sensors were switched on in a dry state prior to the injection of solutions. Then, the solution was introduced. As in the time course of the generated current (Figure 9, inset), a charging current flowed when the solution made contact with the sensing electrodes. However, the current stabilized at a level within one minute. Figure 9 (a) shows the calibration plots for the glucose and lactate sensors obtained by plotting the stabilized current. Linear relationships were observed up to 6 mM and 2 mM, respectively.
A unique point is that the current saturates at higher concentrations. Deviation from linearity is usually observed with an amperometric biosensor that uses an oxidase and is based on the detection of hydrogen peroxide. However, the observed tendency was extreme: the calibration plots were completely flat at higher concentrations. This result indicated that the activities of immobilized GOD and LOD were not enough to measure the high concentration range. The range of detection could be improved by optimizing the activity of the immobilized enzyme.
Figure 9 (b) shows the dependence of the initial slope of the response curve plotted with respect to the GOT and GPT activity. When a solution containing GOT was transported to the sensing area where the freeze-dried substrates were packed, the solution penetrated the flow channel, and the enzyme substrates dissolved rapidly [25]. A distinct current increase was observed following the series of enzymatic reactions involving GOT. A linear relationship was observed up to 200 U/l. The same tendency could be observed when the GPT activity was measured. The lower detection limit was 25 U/l for GOT and 10 U/l for GTP.

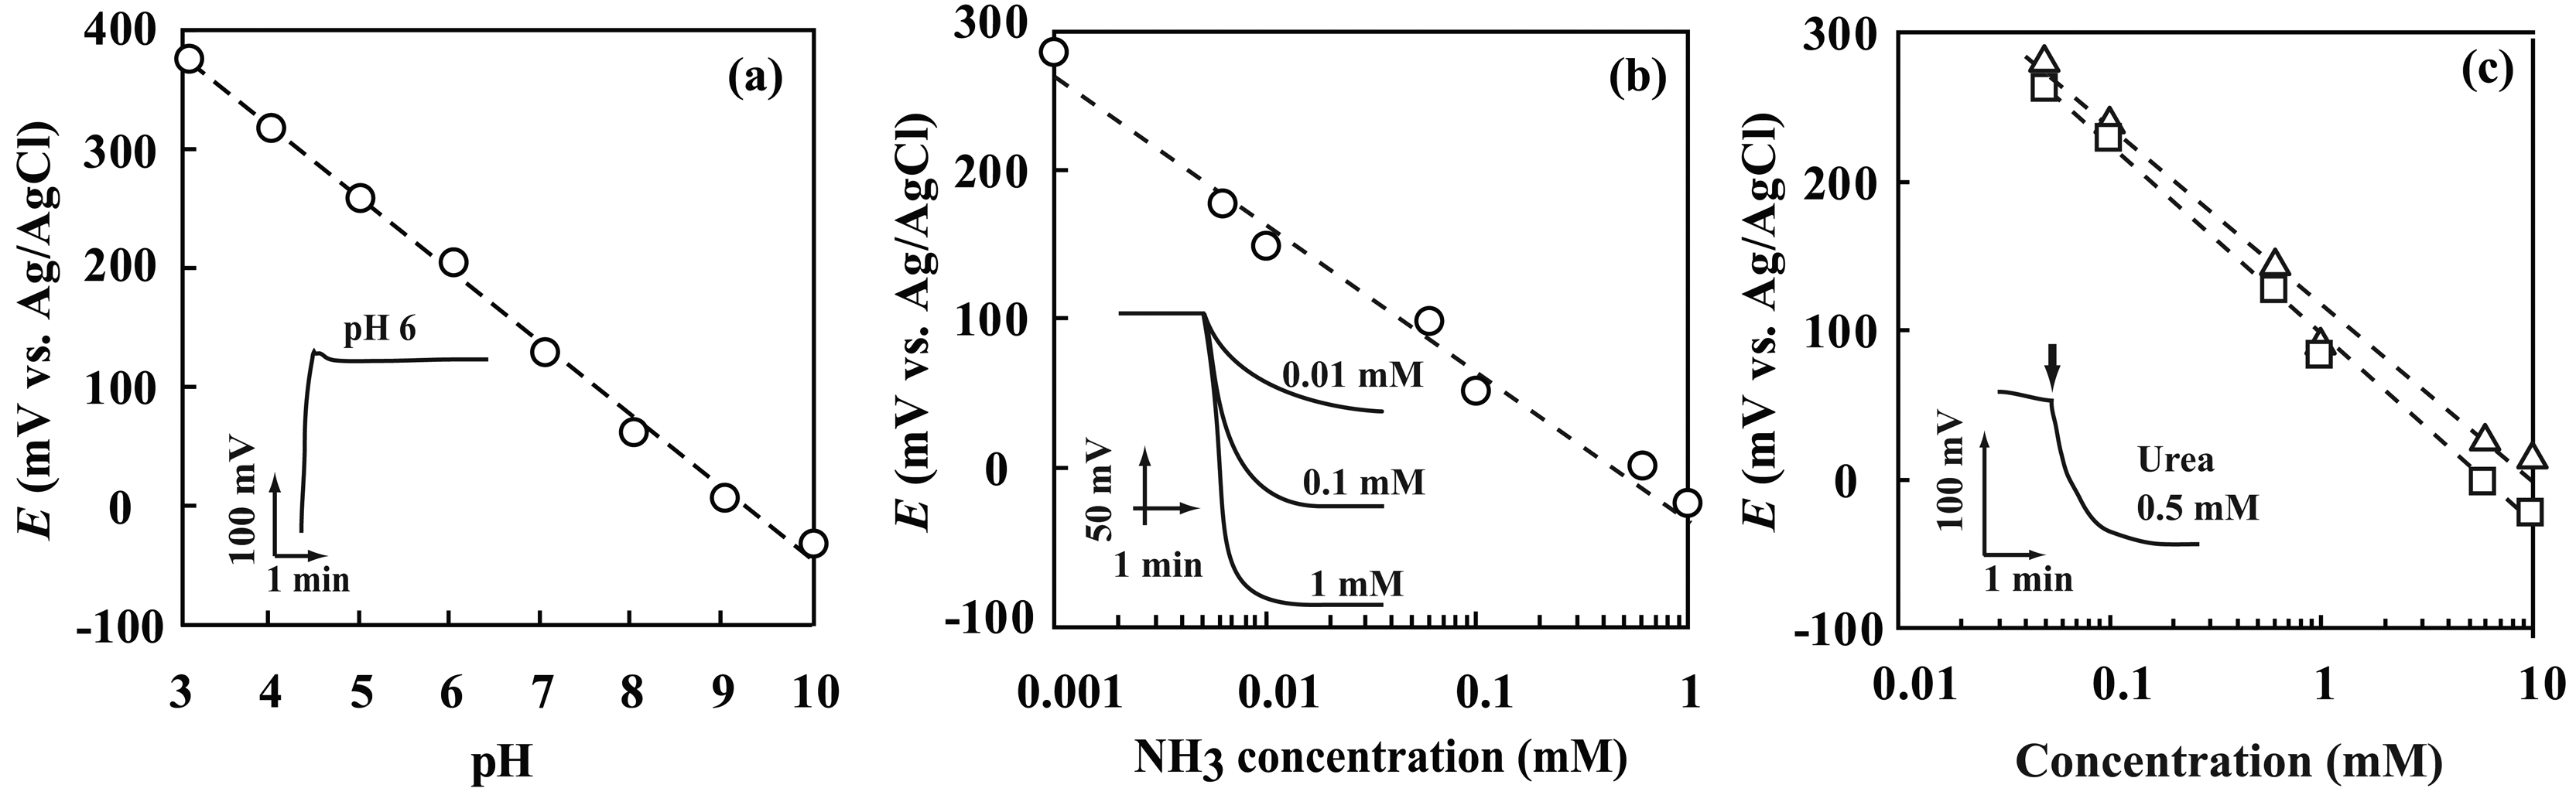
3.3. Performance characterization of potentiometric sensors

Figure 10 (a) shows the calibration plot for the pH sensor. When a sample solution arrived at the pH indicator electrode, the potential settled at a level corresponding to the solution pH. A linear relationship was observed between the potential of the pH-indicator electrode and the pH of the solution. In a potentiometric sensor, both the indicator electrode and the reference electrode play a critical role. The small scattering of the data points suggests that the liquid-junction reference electrode produced a stable potential. After a sample solution containing ammonium ions and the NaOH solution were mixed, gaseous ammonia was produced. When the diffused ammonia dissolved into the electrolyte solution, the potential of the pH-indicator electrode of the ammonia sensor changed immediately and stabilized at a level. Figure 10 (b) shows the dependence of the potential of the ammonia sensor on the concentration of ammonia. A linear relationship was observed between the indicator electrode potential and the logarithm of the ammonia concentration. The lower detection limit was 1 μM. For the determination of urea and creatinine, the enzymatic reactions were allowed to proceed, and the same procedure was followed. Linear relationships were observed in the calibration plot for both cases [Figure 10 (c)].

3.4. Comparison between the on-chip measurement and the conventional method

When applying the device to the analysis of real samples, the transport and sensing of viscous solutions that contain a significant amount of proteins are a concern. To examine this issue, the analysis of components was carried out using a serum sample and calibrated sensors on a chip. The solution contained BSA (4 g/dL) and analytes for the sensors (Table 2) dissolved in a 10 mM phosphate buffer solution (pH 7.4). The concentrations were also measured with commercial analysis kits based on absorption spectroscopy or with a pH meter. The values obtained using the device were, overall, close to those obtained by absorption spectroscopy (Table 2). In the determination of urea and creatinine, endogenous ammonia can be an interferent. In this device, the three analytes were measured independently at the different sites. Therefore, the contribution of endogenous ammonia to the output of the urea and creatinine sensors could be extracted numerically. The measured urea concentration obtained based on this strategy was relatively close to that with absorption spectroscopy.

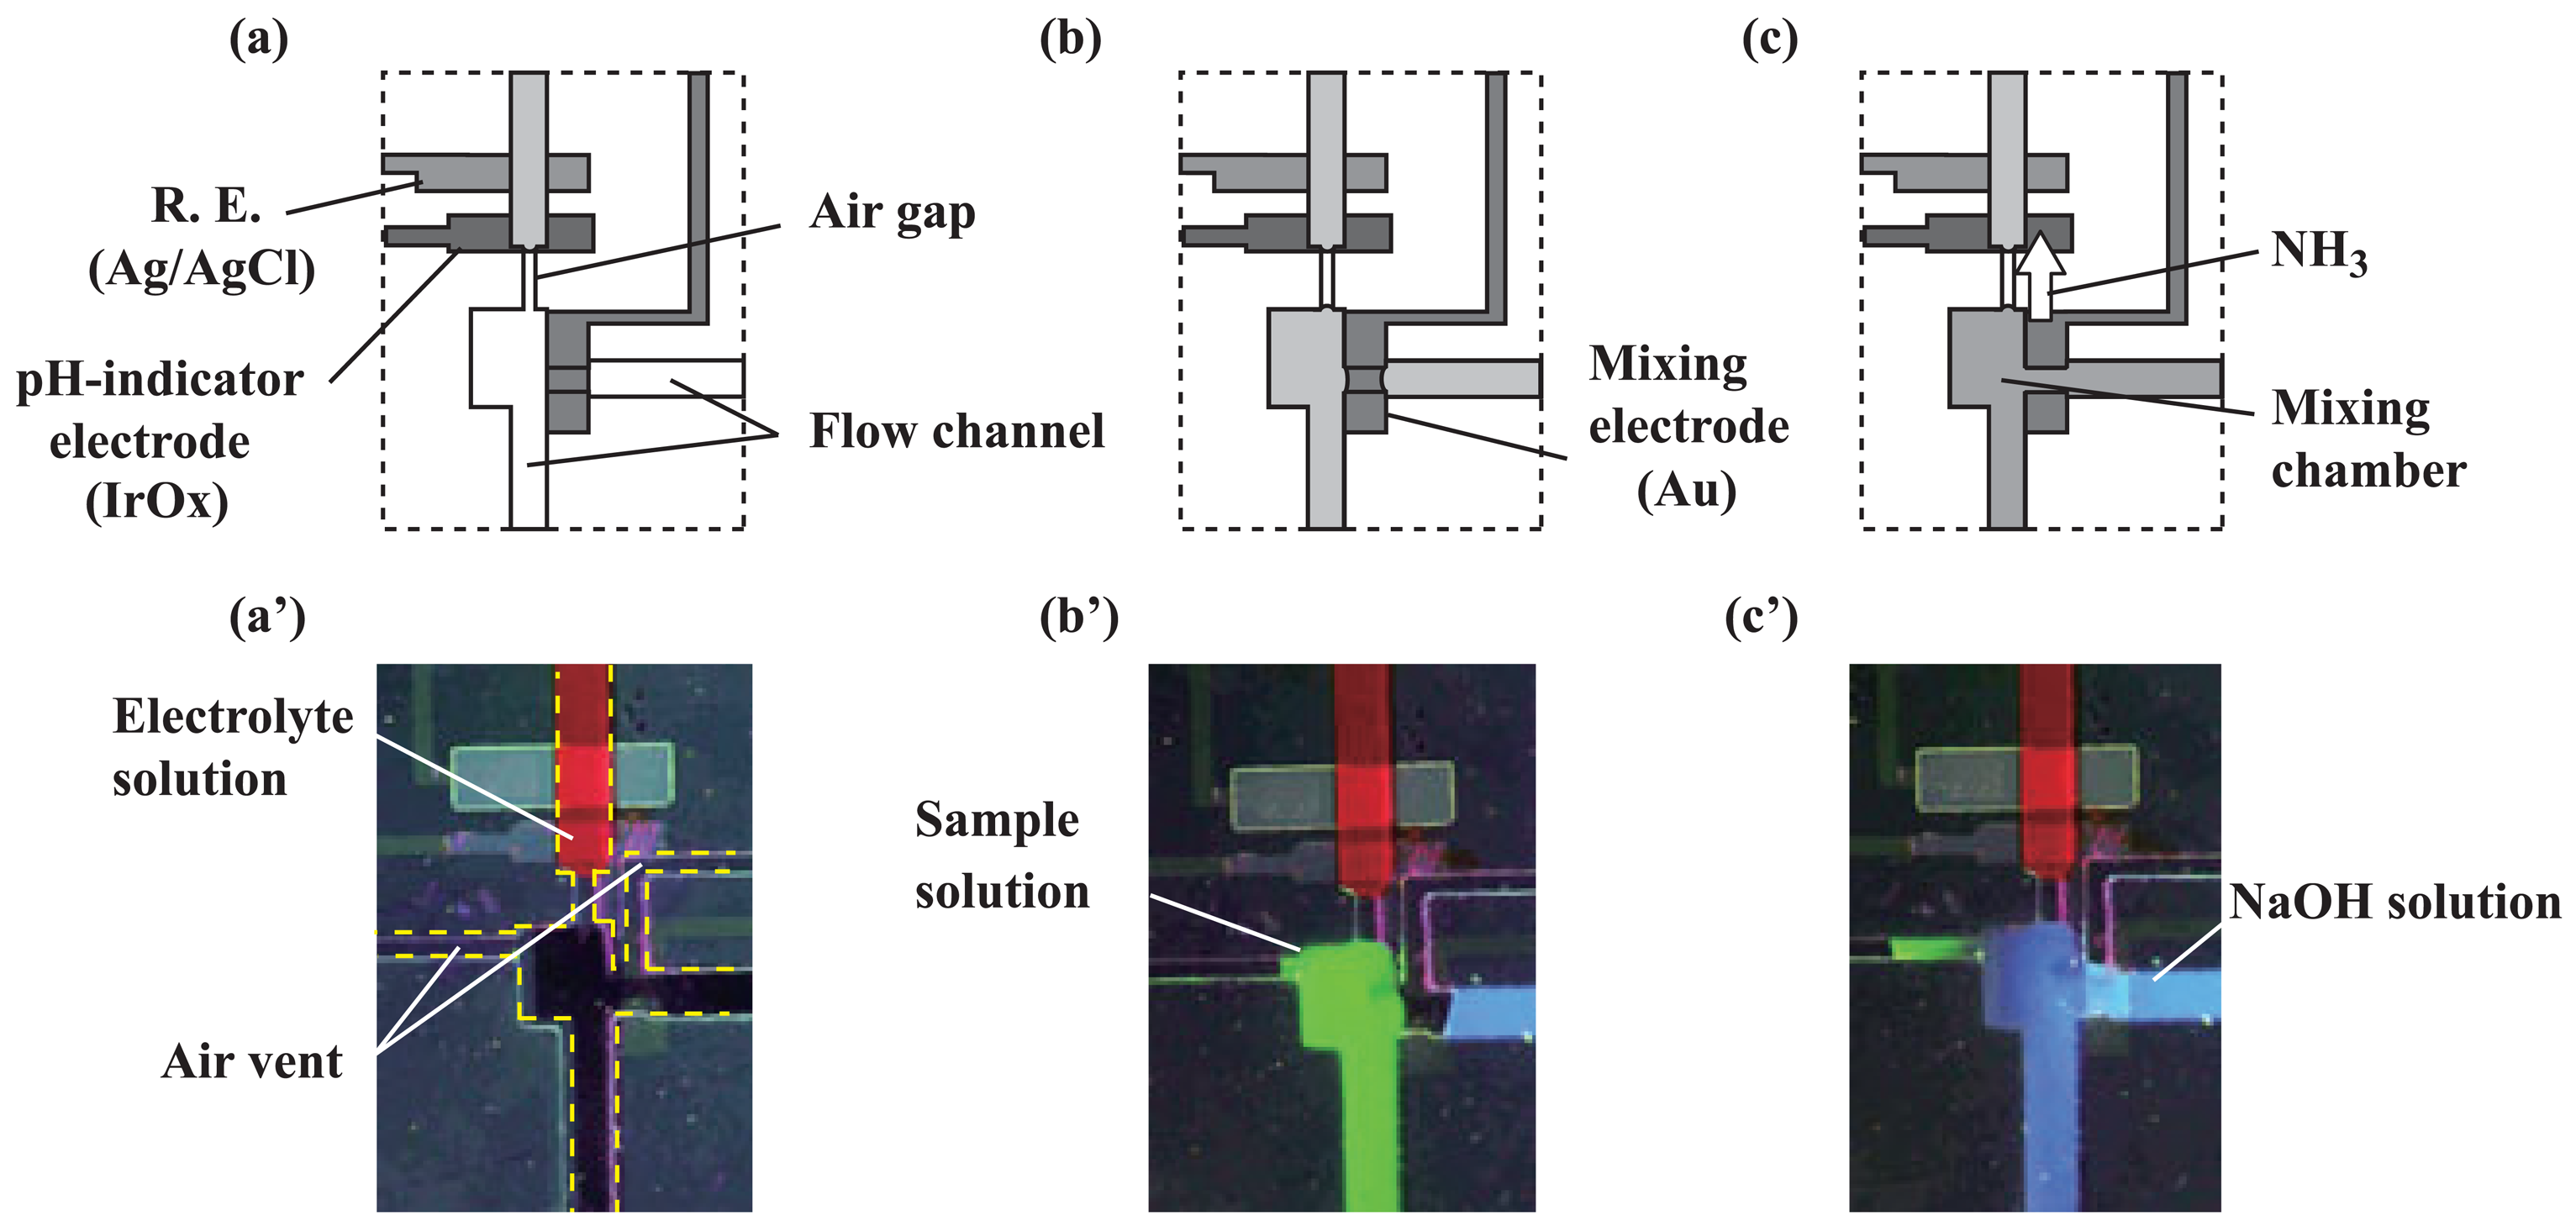
3.5. Preprocessing in the sample injection port

In previous analyses, the sample injection port was used only as a reservoir to deliver a solution to the respective sensing sites. However, the port can also be used for preprocessing or to connect other modules for specific purposes. Here, we tested whether L-ascorbic acid could be eliminated in the sample injection port before the solution was delivered. L-Ascorbic acid is a representative interferent to amperometric sensors, and it is found in physiological fluids. To this end, the platinum electrode in the sample injection port, the Ag/AgCl electrode next to the sample injection port, and one of the gold valve electrodes were used as the working, reference, and auxiliary electrode, respectively [Figure 11 (a)]. The platinum electrode used for the elimination of L-ascorbic acid was the same shape and size as the sample injection port (diameter, 1.8 mm). A solution containing 0.1 mM L-ascorbic acid was dissolved in a 0.1 M phosphate buffer solution (pH 7.4) containing 0.1 M KCl and injected into the sample injection port, and +0.8 V was applied to the working electrode for a predetermined time. Then, the solution was transported to the glucose sensing site, and +0.7 V was applied to the working electrode for the sensor; subsequently, the generated current was measured. In this experiment, the enzyme was not immobilized, and L-ascorbic acid was directly oxidized on the working electrode.
Figure 11 shows changes in the current measured using the working electrode at the sensing site. Here, several cases are shown with different processing times in the injection port. Although the current decreases gradually as a result of the depletion of L-ascorbic acid, an unnegligible current was observed even after 3 min. However, with the increase in the processing time, the current markedly decreased. When the solution was processed for 5 min, the measured current was close to that of a blank buffer solution that did not contain L-ascorbic acid. In this experiment, electrodes used for other purposes were used, and their size was not optimized. By improving this point, the elimination efficiency should be improved. The result provides a realistic solution to process real samples. To remove the influence of the interferents, the application of a mediator or a perm-selective membrane is a simple solution. However, with preprocessing, the structure and formation of the respective sensors can be simplified.

Conclusions

In constructing a highly integrated system, the structure and function of the components should be as simple as possible. To this end, microfluidic components and microsensors based on electrochemical principles can be key components because they can be realized in the form of electrode patterns. An efficient microfluidic transport can be realized by using capillary action and controlling the movement of solutions using valves based on electrowetting. Various electrochemical sensors can be integrated, including those for glucose, lactate, GOT, GPT, pH, ammonia, urea, and creatinine. Mixing of components can be carried out using an electrowetting-based valve or a freeze-dried matrix. The characterization of the sensors revealed that many sensors gave reproducible data. However, depending on the application, detection near the present detection limits is required. Although we integrated the sensors for analytes found in physiological fluids, the analytes to be detected can be changed depending on the purpose. In a possible form, metabolites from cells placed in a chamber may be delivered to sensing sites and analyzed, which is a realistic application with the technology used in this device.

Acknowledgments

This study was supported by Grants-in-Aid for Scientific Research on Priority Areas and by the 21 st Century COE Program, both of which are under the Ministry of Education, Culture, Sports, Science, and Technology.

References and Notes

  1. Song, H.; Chen, D.L.; Ismagilov, R. F. Reactions in droplets in microfluidic channels. Angew. Chem. Int. Ed. 2006, 45, 7336–7356. [Google Scholar]
  2. Delamarche, E.; Juncker, D.; Schmid, H. Microfluidics for processing surfaces and miniaturizing biological assays. Adv. Mater. 2005, 17, 2911–2933. [Google Scholar]
  3. Suzuki, H. Advances in the microfabrication of electrochemical sensors and systems. Electroanalysis 2000, 12, 703–715. [Google Scholar]
  4. Suzuki, H.; Upadhyay, S.; Loughran, M. Microfabrication of electrochemical sensors. In Encyclopedia of Sensors; Grimes, C. A., Dickey, E. C., Pishko, M. V., Eds.; American Scientific Publishers: Stevenson Ranch, 2006; Volume 6, pp. 161–187. [Google Scholar]
  5. Gravesen, P.; Branebjerg, J.; Jensen, O.S. Microfluidics - a review. J. Micromech. Microeng. 1993, 3, 168–182. [Google Scholar]
  6. Shoji, S.; Esashi, M. Microflow devices and systems. J. Micromech. Microeng. 1994, 4, 157–171. [Google Scholar]
  7. Laser, D.J.; Santiago, J. G. A review of micropumps. J. Micromech. Microeng. 2004, 14, R35–R64. [Google Scholar]
  8. Woias, P. Micropumps - past, progress and future prospects. Sensor. Actuat. B 2005, 105, 28–38. [Google Scholar]
  9. Bockris, J. O. M.; Reddy, A. K. N.; Gamboa-Aldeco, M. Modern Electrochemistry; Kluwer Academic/Plenum Publishers: New York, 2000. [Google Scholar]
  10. Quilliet, C.; Berge, B. Electrowetting: a recent outbreak. Curr. Opin. Colloid Interface Sci. 2001, 6, 34–39. [Google Scholar]
  11. Mugele, F.; Baret, J.-C. Electrowetting: from basics to applications. J. Phys.: Condens. Matter 2005, 17, R705–774. [Google Scholar]
  12. Cheng, J.-Y.; Hsiung, L.-C. Electrowetting (EW)-based valve combined with hydrophilic Teflon microfluidic guidance in controlling continuous fluid flow. Biomed. Microdevices 2004, 6, 341–347. [Google Scholar]
  13. Satoh, W.; Loughran, M.; Suzuki, H. Microfluidic transport based on direct electrowetting. J. Appl. Phys. 2004, 96, 835–841. [Google Scholar]
  14. Shiu, J.-Y.; Chen, P. Active patterning using an addressable microfluidic network. Adv. Mater. 2005, 17, 1866–1869. [Google Scholar]
  15. Satoh, W.; Hosono, H.; Suzuki, H. On-chip microfluidic transport and mixing using electrowetting and incorporation of sensing functions. Anal. Chem. 2005, 77, 6857–6863. [Google Scholar]
  16. Morimoto, K.; Suzuki, H. Micro analysis system for pH and protease activities with an integrated sample injection mechanism. Biosens. Bioelectron. 2006, 22, 86–93. [Google Scholar]
  17. Nashida, N.; Satoh, W.; Fukuda, J.; Suzuki, H. Electrochemical immunoassay on a microfluidic device with sequential injection and flushing functions. Biosens. Bioelectron. 2007, 22, 3167–3173. [Google Scholar]
  18. Srinivasan, V.; Pamula, V.K.; Fair, R. B. An integrated digital microfluidic lab-on-a-chip for clinical diagnosis on human physiological fluids. Lab Chip 2004, 4, 310–315. [Google Scholar]
  19. Chung, K.H.; Hong, J. W.; Lee, D.-S.; Yoon, H. C. Microfluidic chip accomplishing self-fluid replacement using only capillary force and its bioanalytical application. Anal. Chim. Acta. 2007, 585, 1–10. [Google Scholar]
  20. Washburn, E.W. The dynamics of capillary flow. Phys. Rev. 1921, 17, 273–283. [Google Scholar]
  21. Kim, E.; Xia, Y.; Whitesides, G.M. Polymer microstructures formed by moulding in capillaries. Nature 1995, 376, 581–584. [Google Scholar]
  22. Delamarche, E.; Bernard, A.; Schmid, H.; Bietsch, A.; Michel, B.; Biebuyck, H. Microfluidic networks for chemical patterning of substrates: design and application to bioassays. J. Am. Chem. Soc. 1998, 120, 500–508. [Google Scholar]
  23. Janshoff, A.; Künneke, S. Micropatterned solid-supported membranes formed by micromolding in capillaries. Eur. Biophys. J. 2000, 29, 549–554. [Google Scholar]
  24. Satoh, W.; Yokomaku, H.; Hosono, H.; Ohnishi, N.; Suzuki, H. Electrowetting-based valve for the control of the capillary flow. J. Appl. Phys. 2008, 103, 034903. [Google Scholar]
  25. Morimoto, K.; Upadhyay, S.; Higashiyama, T.; Ohgami, N.; Kusakabe, H.; Fukuda, J.; Suzuki, H. Electrochemical microsystem with porous matrix packed-beds for enzyme analysis. Sensor. Actuat. B 2007, 124, 477–485. [Google Scholar]
  26. Suzuki, H.; Shiroishi, H.; Sasaki, S.; Karube, I. Microfabricated liquid junction Ag/AgCl reference electrode and its application to a one-chip potentiometric sensor. Anal. Chem. 1999, 71, 5069–5075. [Google Scholar]
  27. Suzuki, H.; Matsugi, Y. Microfabricated flow system for ammonia and creatinine with an air-gap structure. Sensor. Actuat. B 2004, 98, 101–111. [Google Scholar]
Figure 1. Integrated chip with microfluidic and sensing functions. (a) Completed chip on a finger. (b) Layout of the flow channels and sensors showing mutual relations. R. E., reference electrode; A. E., auxiliary electrode.
Sensors 08 01111f1
Figure 2. Switching of the valves at the sample injection port. The upper figures show the area including one of the valves and the injection port. The lower figures show the movement of a fluorescein solution through the valve. (a) Before injecting a solution. (b) A solution is filled in the sample injection port. (c) The solution passes the valve area when the potential is applied to the valve working electrode. W. E., working electrode; R. E., reference electrode; A. E., auxiliary electrode.
Sensors 08 01111f2
Figure 3. Magnified view of the sensing area for glucose and lactate. (a) Top view. (b) Cross section. W. E., working electrode; R. E., reference electrode; A. E., auxiliary electrode.
Sensors 08 01111f3
Figure 4. Magnified view of the sensing area for the activity of GOT and GPT. (a) Top view. (b) Cross section. W. E., working electrode; R. E., reference electrode; A. E., auxiliary electrode.
Sensors 08 01111f4
Figure 5. Magnified view of the sensing area for ammonia, urea, and creatinine. (a) Top view. (b) Cross section. W. E., working electrode electrode.; R. E., reference electrode; A. E., auxiliary.
Sensors 08 01111f5
Figure 6. Procedure for mixing solutions in the ammonia-, urea-, and creatinine-sensing sites. (a) The electrolyte solution fills the sensing area. (b) A sample solution and a NaOH solution are transported to the mixing area. (c) The two solutions are mixed when the potential is applied to the mixing electrode. (a& prime;) ∼ (c& prime;) show a series of photographs of transports of dyed solutions.
Sensors 08 01111f6
Figure 7. Control of the solution. (a) The solution passed the straight valve area. (b) The solution stopped effectively at the narrow-valve area.
Sensors 08 01111f7
Figure 8. Transport of a fluorescein solution in the network of flow channels. (a) Solutions for the ammonia, urea, and creatinine sensors were injected and filled in the sensing area. (b) Another solution was filled in the sample injection port. (c) The solution was transported to the respective sensing areas of ammonia, urea, and creatinine. (d) NaOH solutions were mixed. (e) The solution was transported to the sensing area of GOT and GPT. (f) The solution was filled in the glucose- and lactate-sensing areas.
Sensors 08 01111f8
Figure 9. Calibration plots. (a) Dependence of the output current on the concentration of glucose ○ and lactate ●. (b) Dependence of the slope of the response curve on the activity of GOT and GPT. □, GOT; ■, GPT. The insets in (a) and (b) show typical response curves to glucose (1 mM; and GOT (100 U/L;.
Sensors 08 01111f9
Figure 10. Calibration plots for the pH (a), ammonia (b), urea (c, □), and creatinine (c, △; sensors. The insets are typical response curves to the analytes of the corresponding concentrations.
Sensors 08 01111f10
Figure 11. Elimination of L-ascorbic acid. (a) Used electrodes. (b) Time course of the current generated on the working electrode. W. E., working electrode; R. E., reference electrode; A. E., auxiliary electrode.
Sensors 08 01111f11
Table 1. Enzymes and reactions used for biosensing.
AnalyteEnzymeReaction
GlucoseGlucose oxidase (GOD), EC 1.1.3.4, from a microorganism Glucose + O 2 GOD gluconolactone + H 2 O 2
LactateLactate oxidase (LOD), EC 1.1.3.2, from pediococcus species Lactate + O 2 LOD pyruvate + H 2 O 2
GOTGlutamic oxaloacetic transaminase (GOT), EC 2.6.1.1, from a pig heart L alanine + α ketoglutarate GOT pyruvate + L glutamate
GPTGlutamic pyruvic transaminase (GPT), EC 2.6.1.2, from a pig heart L aspartate + α ketoglutarate GPT oxaloacetate + L glutamate
UreaUrease, EC 3.5.1.5, from jack bean Urea + H 2 O Urease H 2 CO 3 + OH + 2 NH 4 +
CreatinineCreatinine deiminase, EC 3.5.4.21, from Bacillus sp. Creatinine + 2 H 2 O Creatinine deiminase N methylhydantoin + OH + NH 4
Table 2. Comparison of measured concentration values obtained by on-chip measurements and conventional methods
On-chip measurementConventional methodAdjusted concentration

Glucose5.3 mM5.6 mM6.0 mM
Lactate1.7 mM2.2 mM2.0 mM
GOT activity27 U/L32 U/L30 U/L
GPT activity27 U/L28 U/L30 U/L
pH7.37.47.4
Ammonia58 μM61 μM50 μM
Urea6.4 mM6.9 mM7.0 mM
Creatinine89 μM94 μM100 μM

