Arc-Welding Spectroscopic Monitoring based on Feature Selection and Neural Networks


Abstract
:
1. Introduction
- -
- When analyzing an unknown spectrum it is necessary to measure all the original features or spectral bands in order to perform the compression prior to its classification.
- -
- The interpretation of the results becomes a complex task given that the obtained features can not be associated with any of the spectral bands of the compounds under test.
- -
- The obtained results can not be extended to other classifiers.
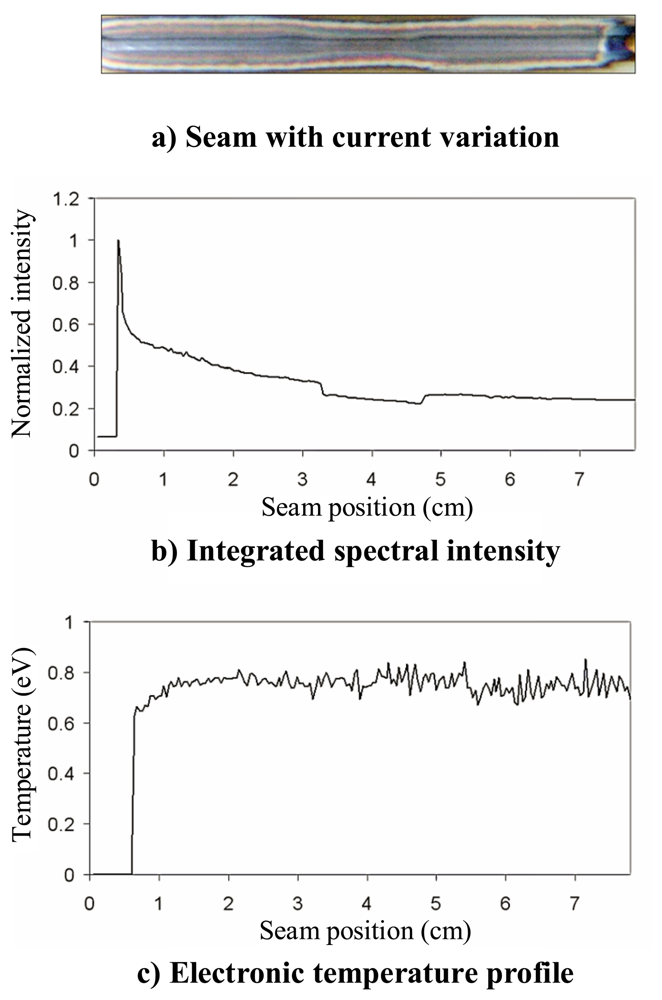
2. Plasma optical spectroscopy
3. Data analysis
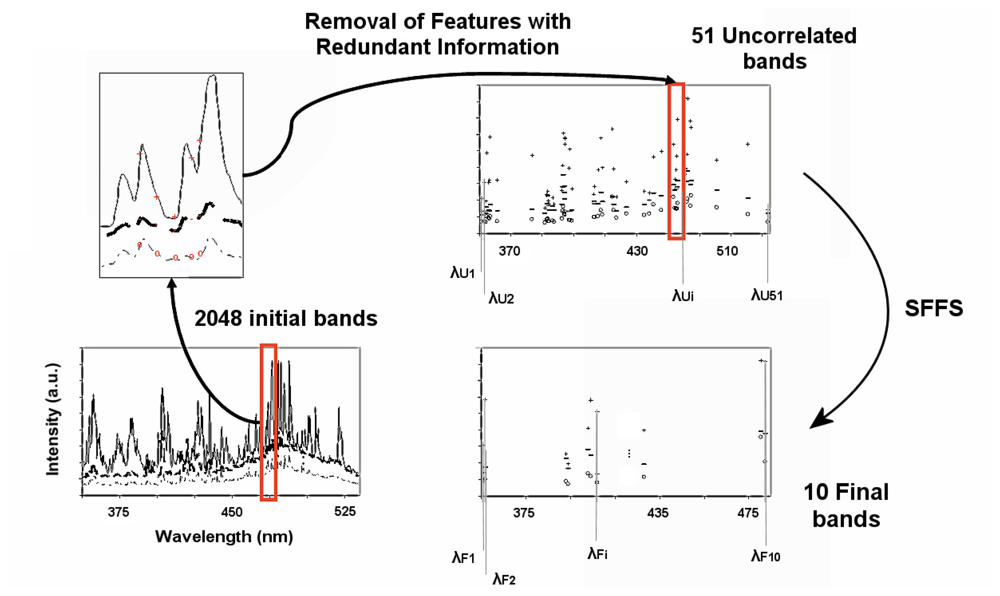
3.1. Sequential Floating Forward Selection
1. Redundancy reduction
2. Feature Selection
3.2. Clasification
4. Experimental issues
5. Conclusions
Acknowledgments
References and Notes
- Wu, C.S.; Ushio, M.; Tanaka, M. Analysis of the TIG welding arc behaviour. Computat. Mater. Sci. 1997, 7, 308–314. [Google Scholar]
- Chin, B.A.; Madsen, N.H.; Goodling, J.S. Infrared thermography for sensing the arc welding process. Weld. J. 1983, 62, 229–234. [Google Scholar]
- Zhang, G.J.; Yan, Z.H.; Wu, L. Visual sensing of weld pool in variable polarity TIG welding of aluminium alloy. Trans. Nonferrous Met. Soc. China (English Edition) 2006, 16, 522–526. [Google Scholar]
- Tam, A.S.; Hardt, D.E. Weld pool impedance for pool geometry measurement: Stationary and nonstationary pools. J. Dyn. Syst. Meas. Control 1989, 111, 545–53. [Google Scholar]
- Wang, Y.; Zhao, P. Noncontact acoustic analysis monitoring of plasma arc welding. International Int. J. Press. Ves. Piping 2001, 78, 43–47. [Google Scholar]
- Ferrara, M.; Ancona, A.; Lugara, P.M.; Sibillano, M. On-line quality monitoring of welding processes by means of plasma optical spectroscopy. Proc. SPIE 2000, 3888, 750–758. [Google Scholar]
- Mirapeix, J.; Cobo, A.; Conde, O.M.; Jaúregui, C.; López-Higuera, J.M. Fast algorithm for spectral processing with application to on-line welding quality assurance. Meas. Sci. Technol. 2006, 17, 2623–2629. [Google Scholar]
- Ancona, A.; Lugara, P.M.; Ottonelli, F.; Catalano, I.M. A sensing torch for the on-line monitoring of the gas tungsten arc welding process of steel pipes. Meas. Sci. Technol. 2004, 15, 2412–2418. [Google Scholar]
- Mirapeix, J.; Cobo, A.; Quintela, A.; López-Higuera, J.M. Embedded spectroscopic fiber sensor for on-line arc-welding analysis. Appl. Optics 2007, 16, 3215–3220. [Google Scholar]
- Mirapeix, J.; García-Allende, P.B.; Cobo, A.; Conde, O.M.; López-Higuera, J.M. Real-time arc-welding defect detection and classification with Principal Component Analysis and Artificial Neural Networks. NDT E Int. 2007, 40, 315–323. [Google Scholar]
- Gomez-Chova, L.; Calpe, J.; Camps-Valls, G.; Martin, J.D.; Soria, E.; Vila, J.; Alonso-Chorda, L.; Moreno, J. Feature selection of hyperspectral data through local correlation and SFFS for crop classification. IEEE Int. Geosci. Remote Sens.Symp. Proc. 2003, 1, 555–557. [Google Scholar]
- Ferri, F.; Pudil, P.; Hatef, M.; Kittler, J. Comparative study of techniques for large-scale feature selection. In Pattern Recognition in Practice IV: Multiple Paradigms, Comparative Studies, and Hybrid Systems; Gelsema, E.S., Kanal, L.N., Eds.; Elsevier Science Inc.: New York, NY, USA, 1994; pp. 403–413. [Google Scholar]
- Marotta, A. Determination of axial thermal plasma temperatures without Abel inversion. J. Phys. D-Appl. Phys. 1993, 27, 268–272. [Google Scholar]
- Griem, H.R. Principles of Plasma Spectroscopy; Cambridge University Press, 1997. [Google Scholar]
- Sforza, P.; de Blasiis, D. On-line optical monitoring system for arc welding. NDT E Int. 2002, 35, 37–43. [Google Scholar]
- Di, L.; Srikanthan, T.; Chandel, R.S.; Katsunori, I. Neural-network-based self-organized fuzzy logic control for arc welding. Eng. Appl. Artif. Intell. 2001, 14, 115–124. [Google Scholar]
- Hong, L.; Hao, Z.; Lunji, H.; Xiyuan, H.; Zhude, Z. Application of artificial neural network in laser welding defect diagnosis. J. Mater. Process. Technol. 2005, 170, 403–411. [Google Scholar]
- Chen, C.H. Fuzzy Logic and Neural Networks Handbook; McGraw-Hill: New York, 1996. [Google Scholar]
- Girosi, F.; Makhoul, J.; Manolakos, E.; Wilson, E. Neural Networks for Signal Processing V, Proc. 1995 IEEE Workshop; IEEE Press: New York, 1995. [Google Scholar]
- Moeslund, T.B. Principal Component Analysis. An Introduction; Technical Report CVMT 01-02; Aalborg University: Aalborg, Denmark, 2001. [Google Scholar]


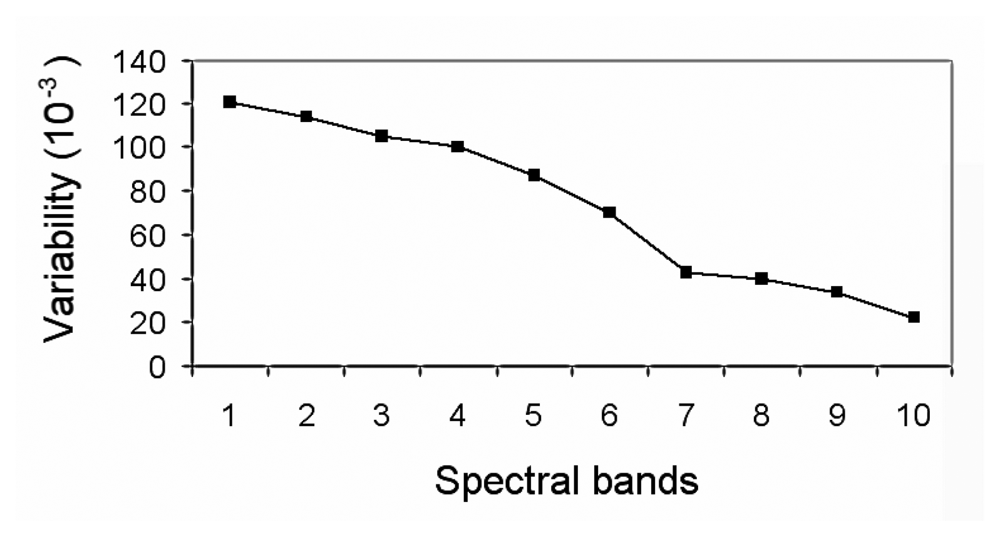
| Band N° | λ (nm) | Variability | Emission Line |
|---|---|---|---|
| 1 | 407.22 | 1.21E-02 | Fe I |
| 2 | 404.30 | 1.14E-02 | Mn I |
| 3 | 482.43 | 1.05E-02 | Mn I |
| 4 | 356.92 | 1.00E-02 | Ni I |
| 5 | 402.84 | 8.73E-03 | Mn I |
| 6 | 428.09 | 7.00E-03 | Ar II |
| 7 | 356.08 | 4.24E-03 | Ar II |
| 8 | 394.02 | 4.01E-03 | Cr I |
| 9 | 393.20 | 3.38E-03 | Fe I |
| 10 | 480.63 | 2.22E-03 | Ar II |
© 2008 by the authors; license Molecular Diversity Preservation International, Basel, Switzerland. This article is an open-access article distributed under the terms and conditions of the Creative Commons Attribution license (http://creativecommons.org/licenses/by/3.0/).
Share and Cite
Garcia-Allende, P.B.; Mirapeix, J.; Conde, O.M.; Cobo, A.; Lopez- Higuera, J.M. Arc-Welding Spectroscopic Monitoring based on Feature Selection and Neural Networks. Sensors 2008, 8, 6496-6506. https://doi.org/10.3390/s8106496
Garcia-Allende PB, Mirapeix J, Conde OM, Cobo A, Lopez- Higuera JM. Arc-Welding Spectroscopic Monitoring based on Feature Selection and Neural Networks. Sensors. 2008; 8(10):6496-6506. https://doi.org/10.3390/s8106496
Chicago/Turabian StyleGarcia-Allende, P. Beatriz, Jesus Mirapeix, Olga M. Conde, Adolfo Cobo, and Jose M. Lopez- Higuera. 2008. "Arc-Welding Spectroscopic Monitoring based on Feature Selection and Neural Networks" Sensors 8, no. 10: 6496-6506. https://doi.org/10.3390/s8106496
APA StyleGarcia-Allende, P. B., Mirapeix, J., Conde, O. M., Cobo, A., & Lopez- Higuera, J. M. (2008). Arc-Welding Spectroscopic Monitoring based on Feature Selection and Neural Networks. Sensors, 8(10), 6496-6506. https://doi.org/10.3390/s8106496