A Complex Permittivity Based Sensor for the Electrical Characterization of High-Voltage Transformer Oils

Abstract
:1. Introduction
1.1 Service-life estimation based on complex permittivity
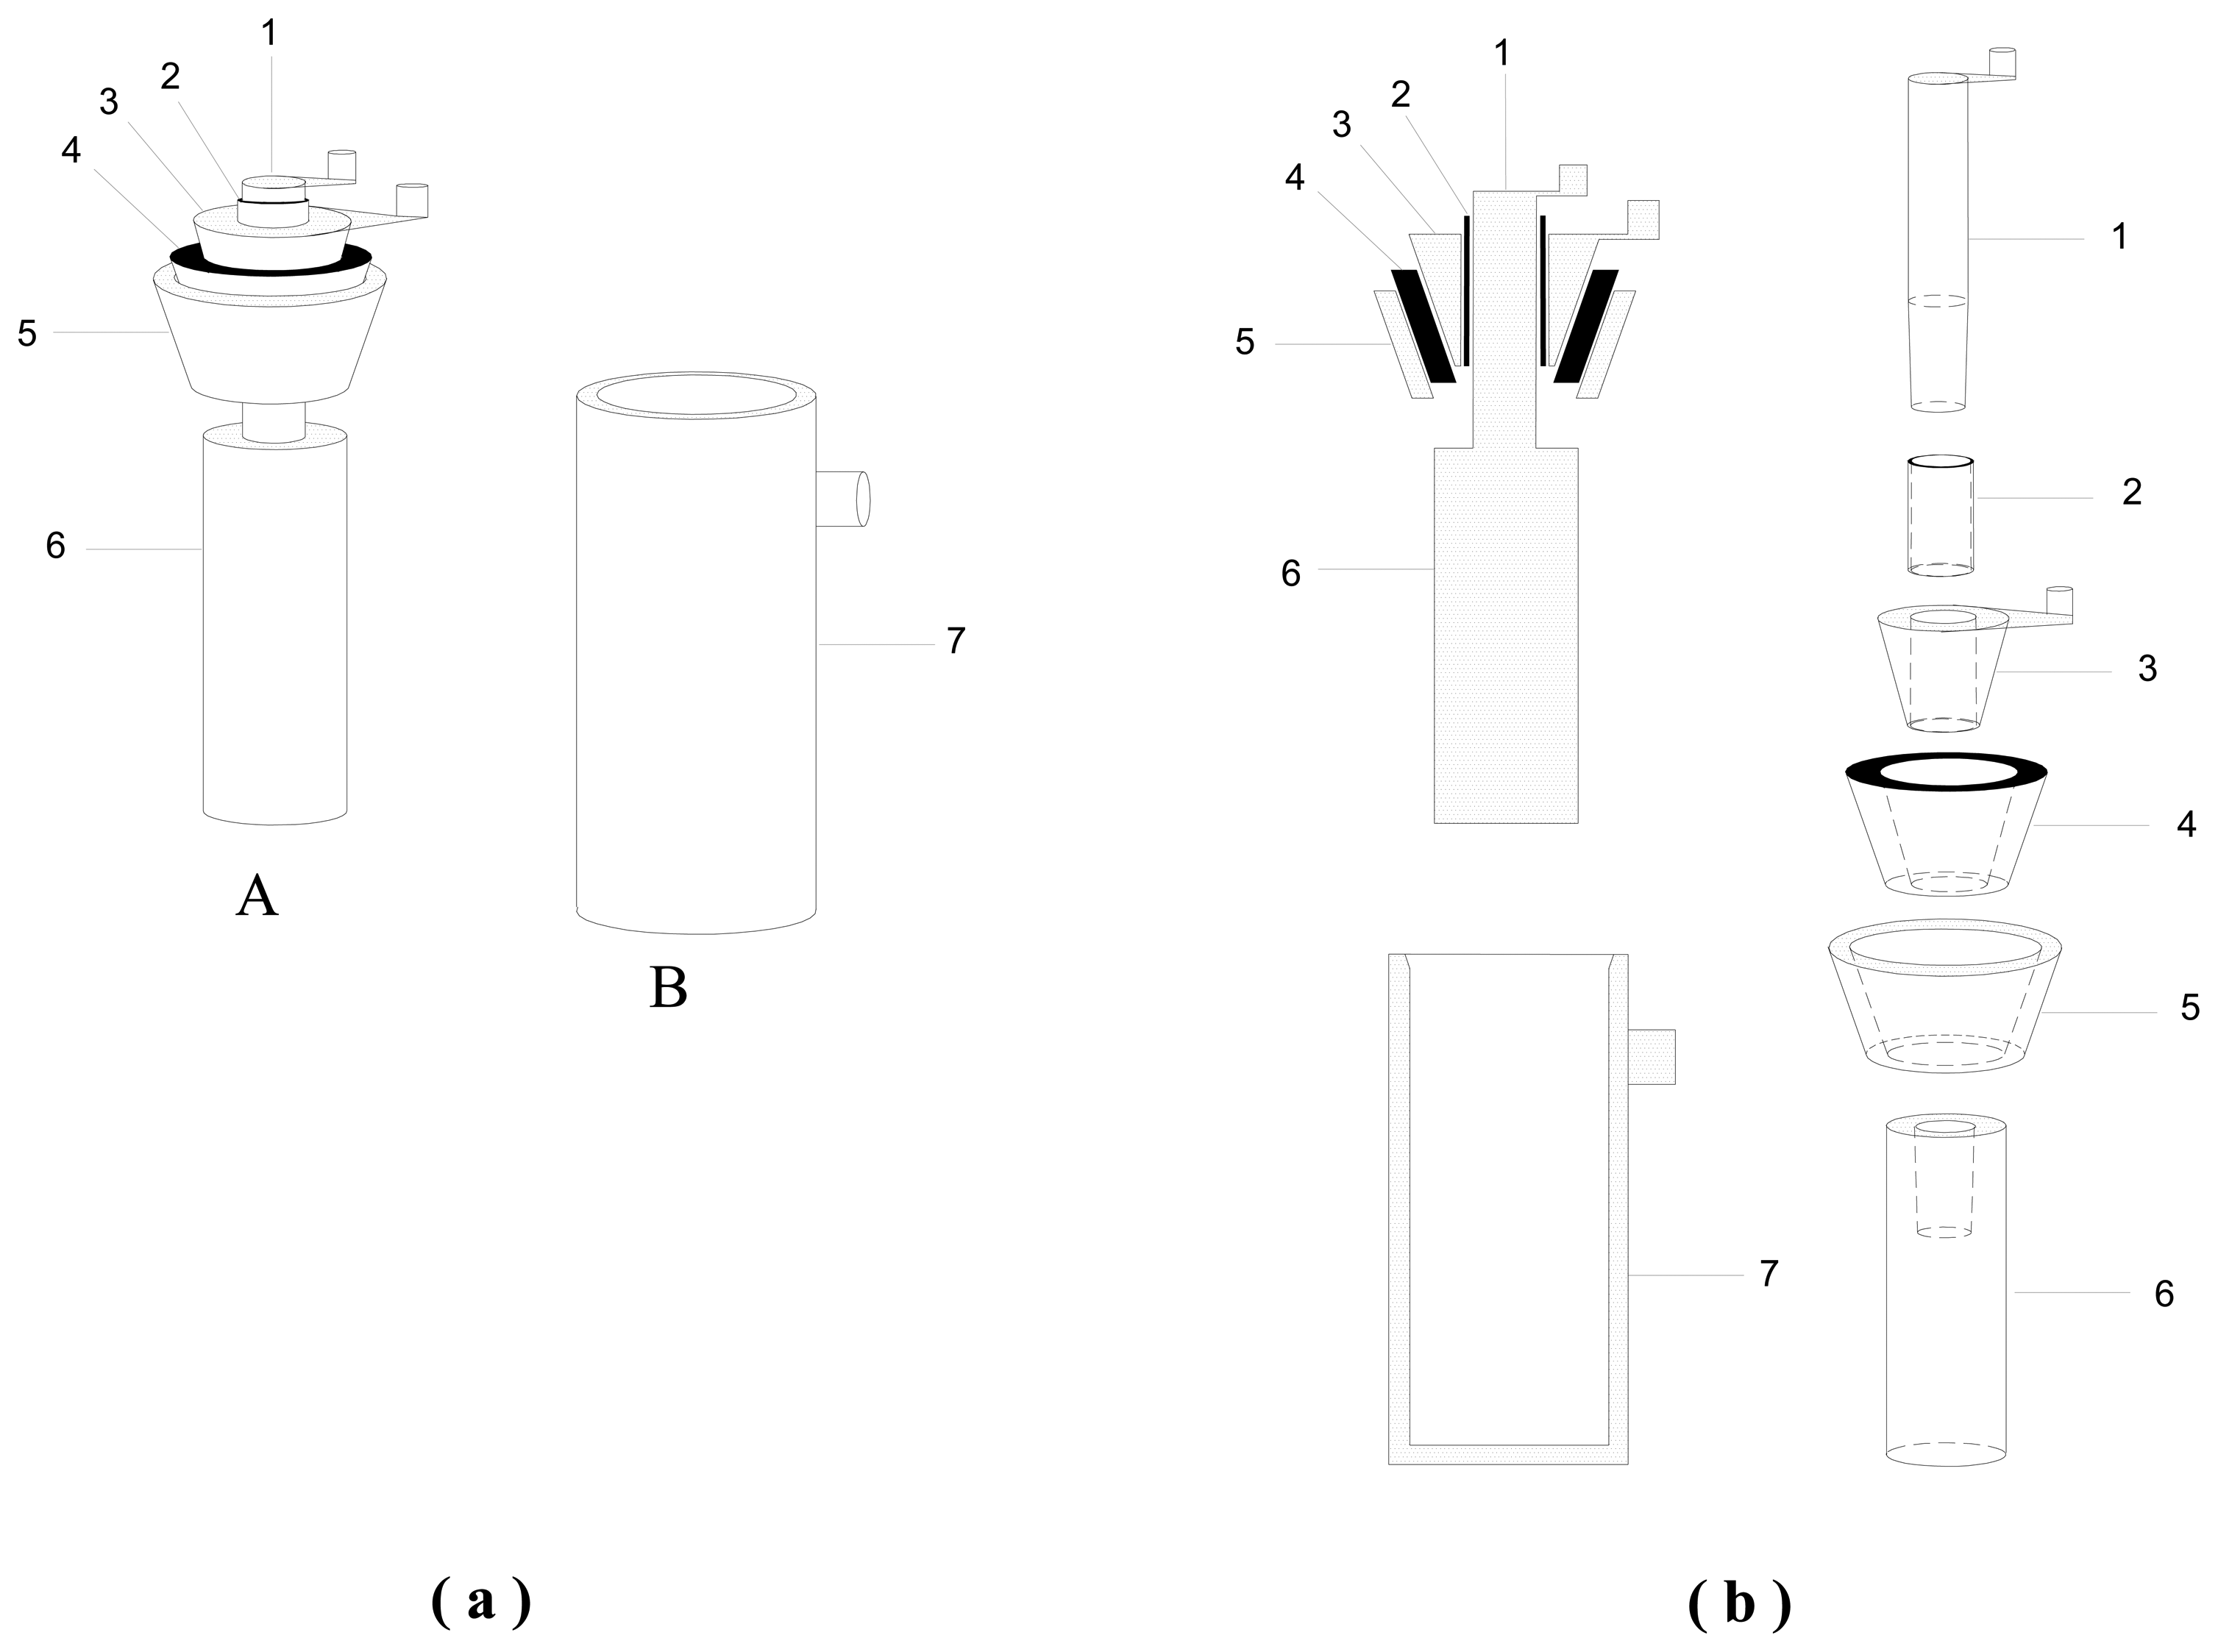
2. Experimental Setup
3. Results and Discussion
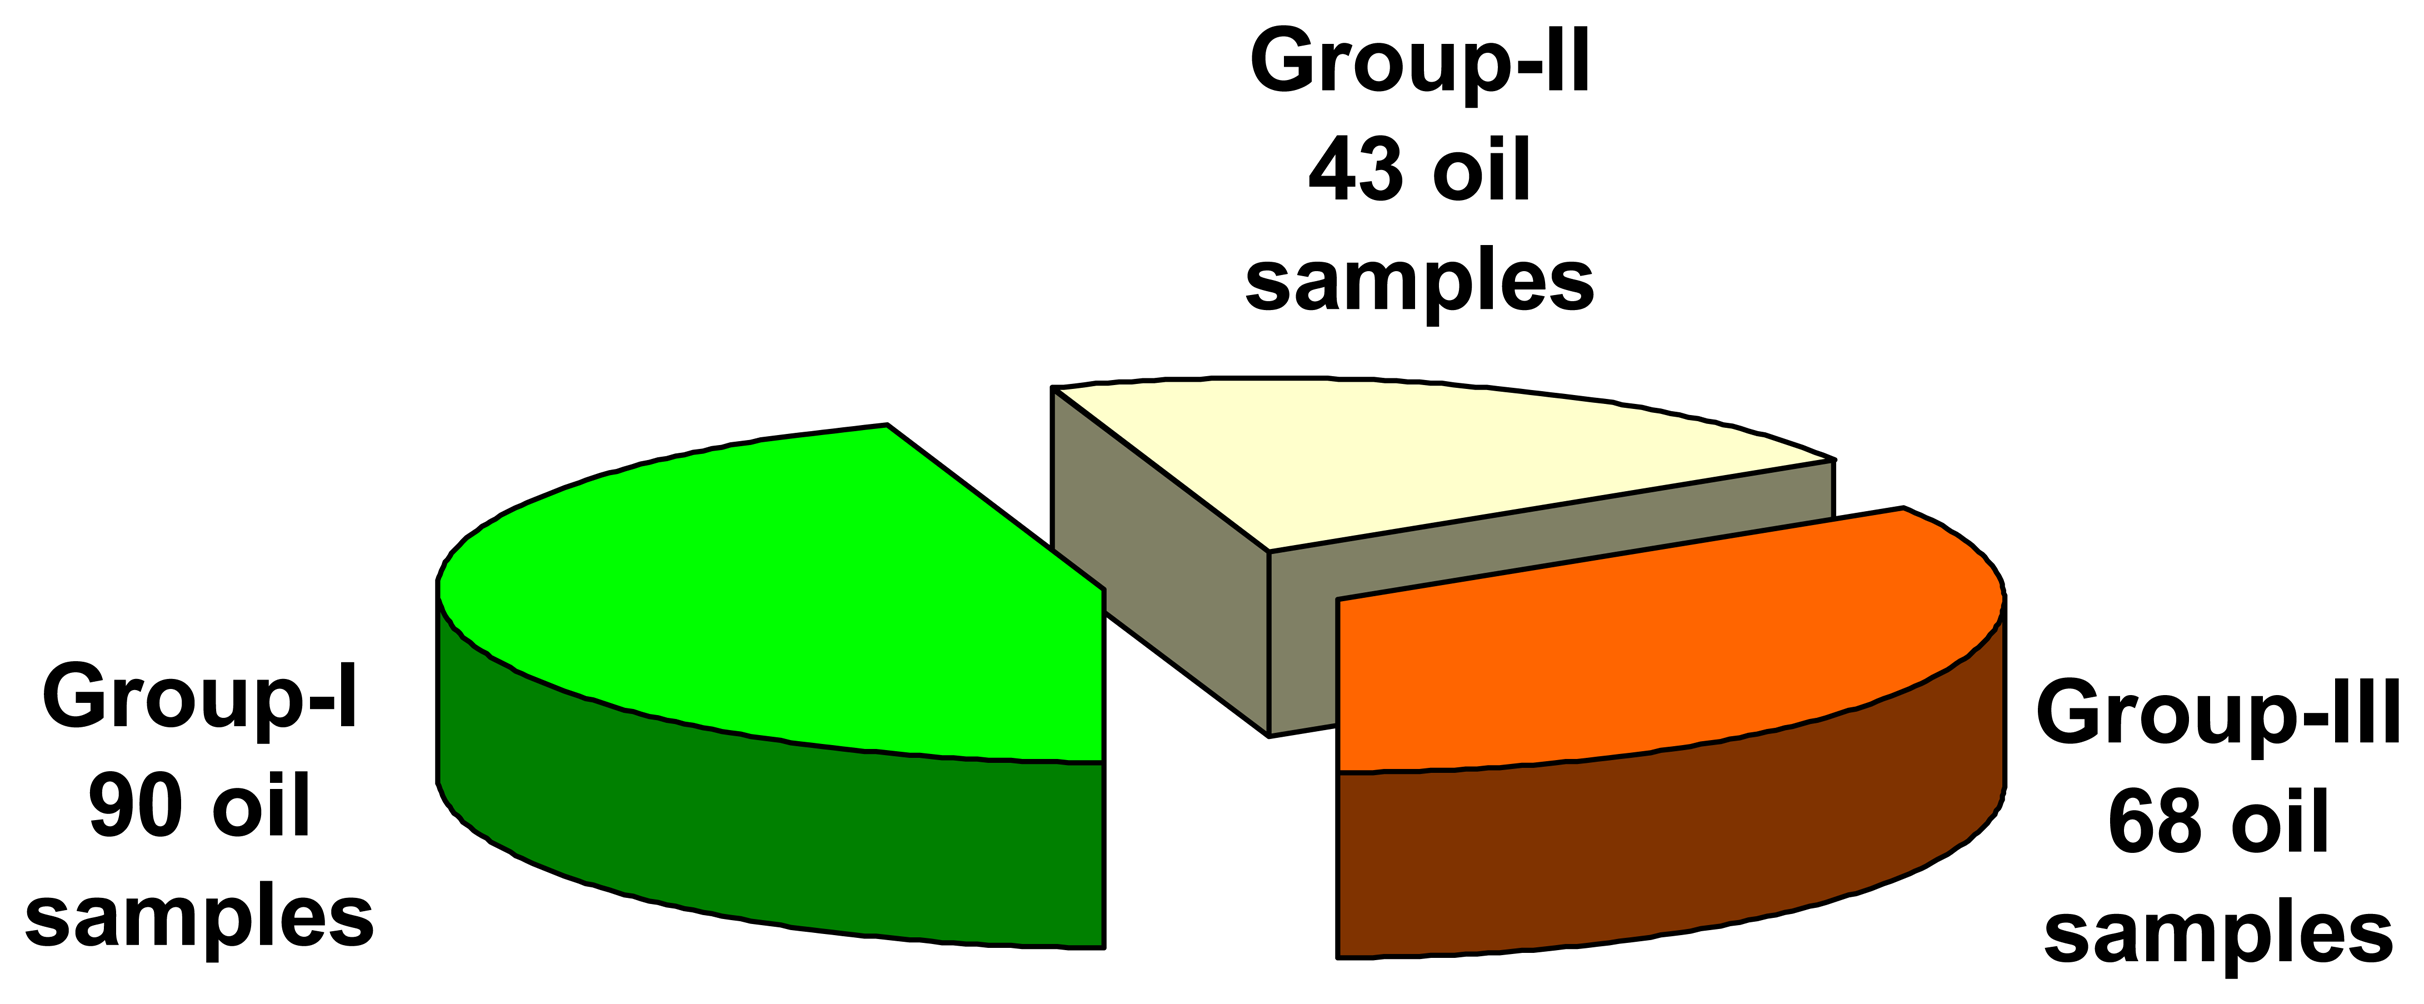
3.1. The examined samples
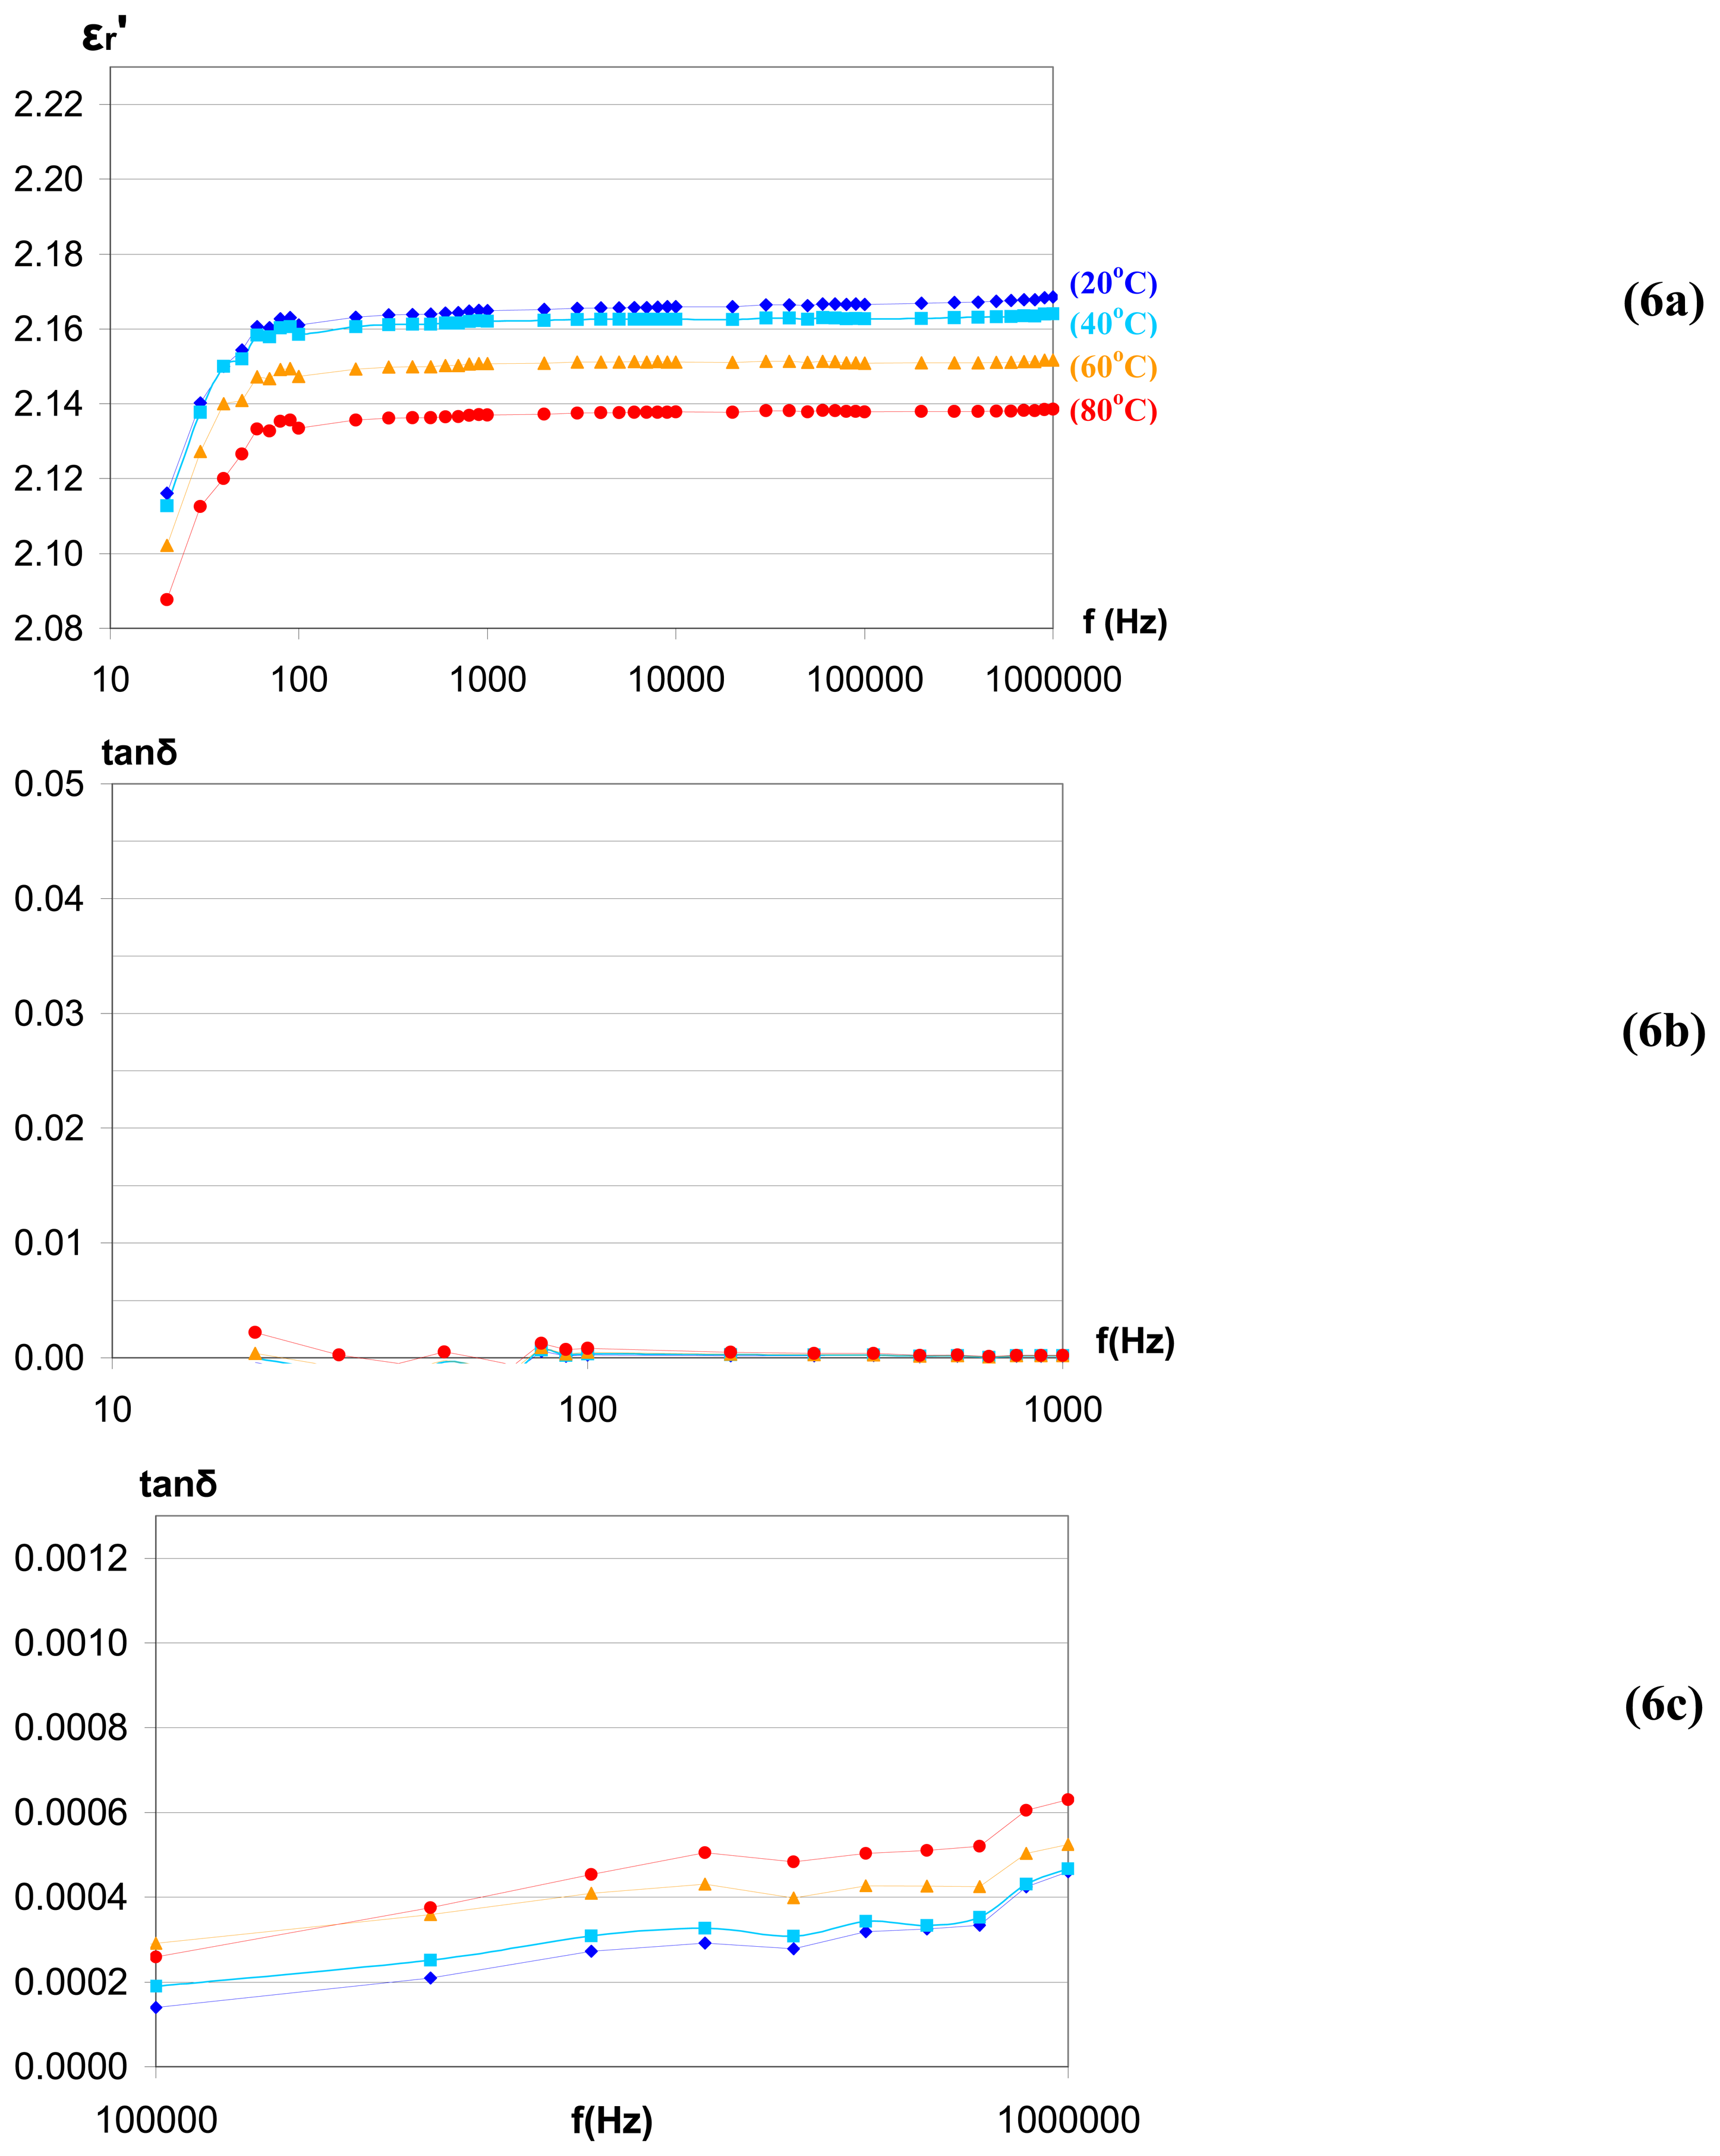
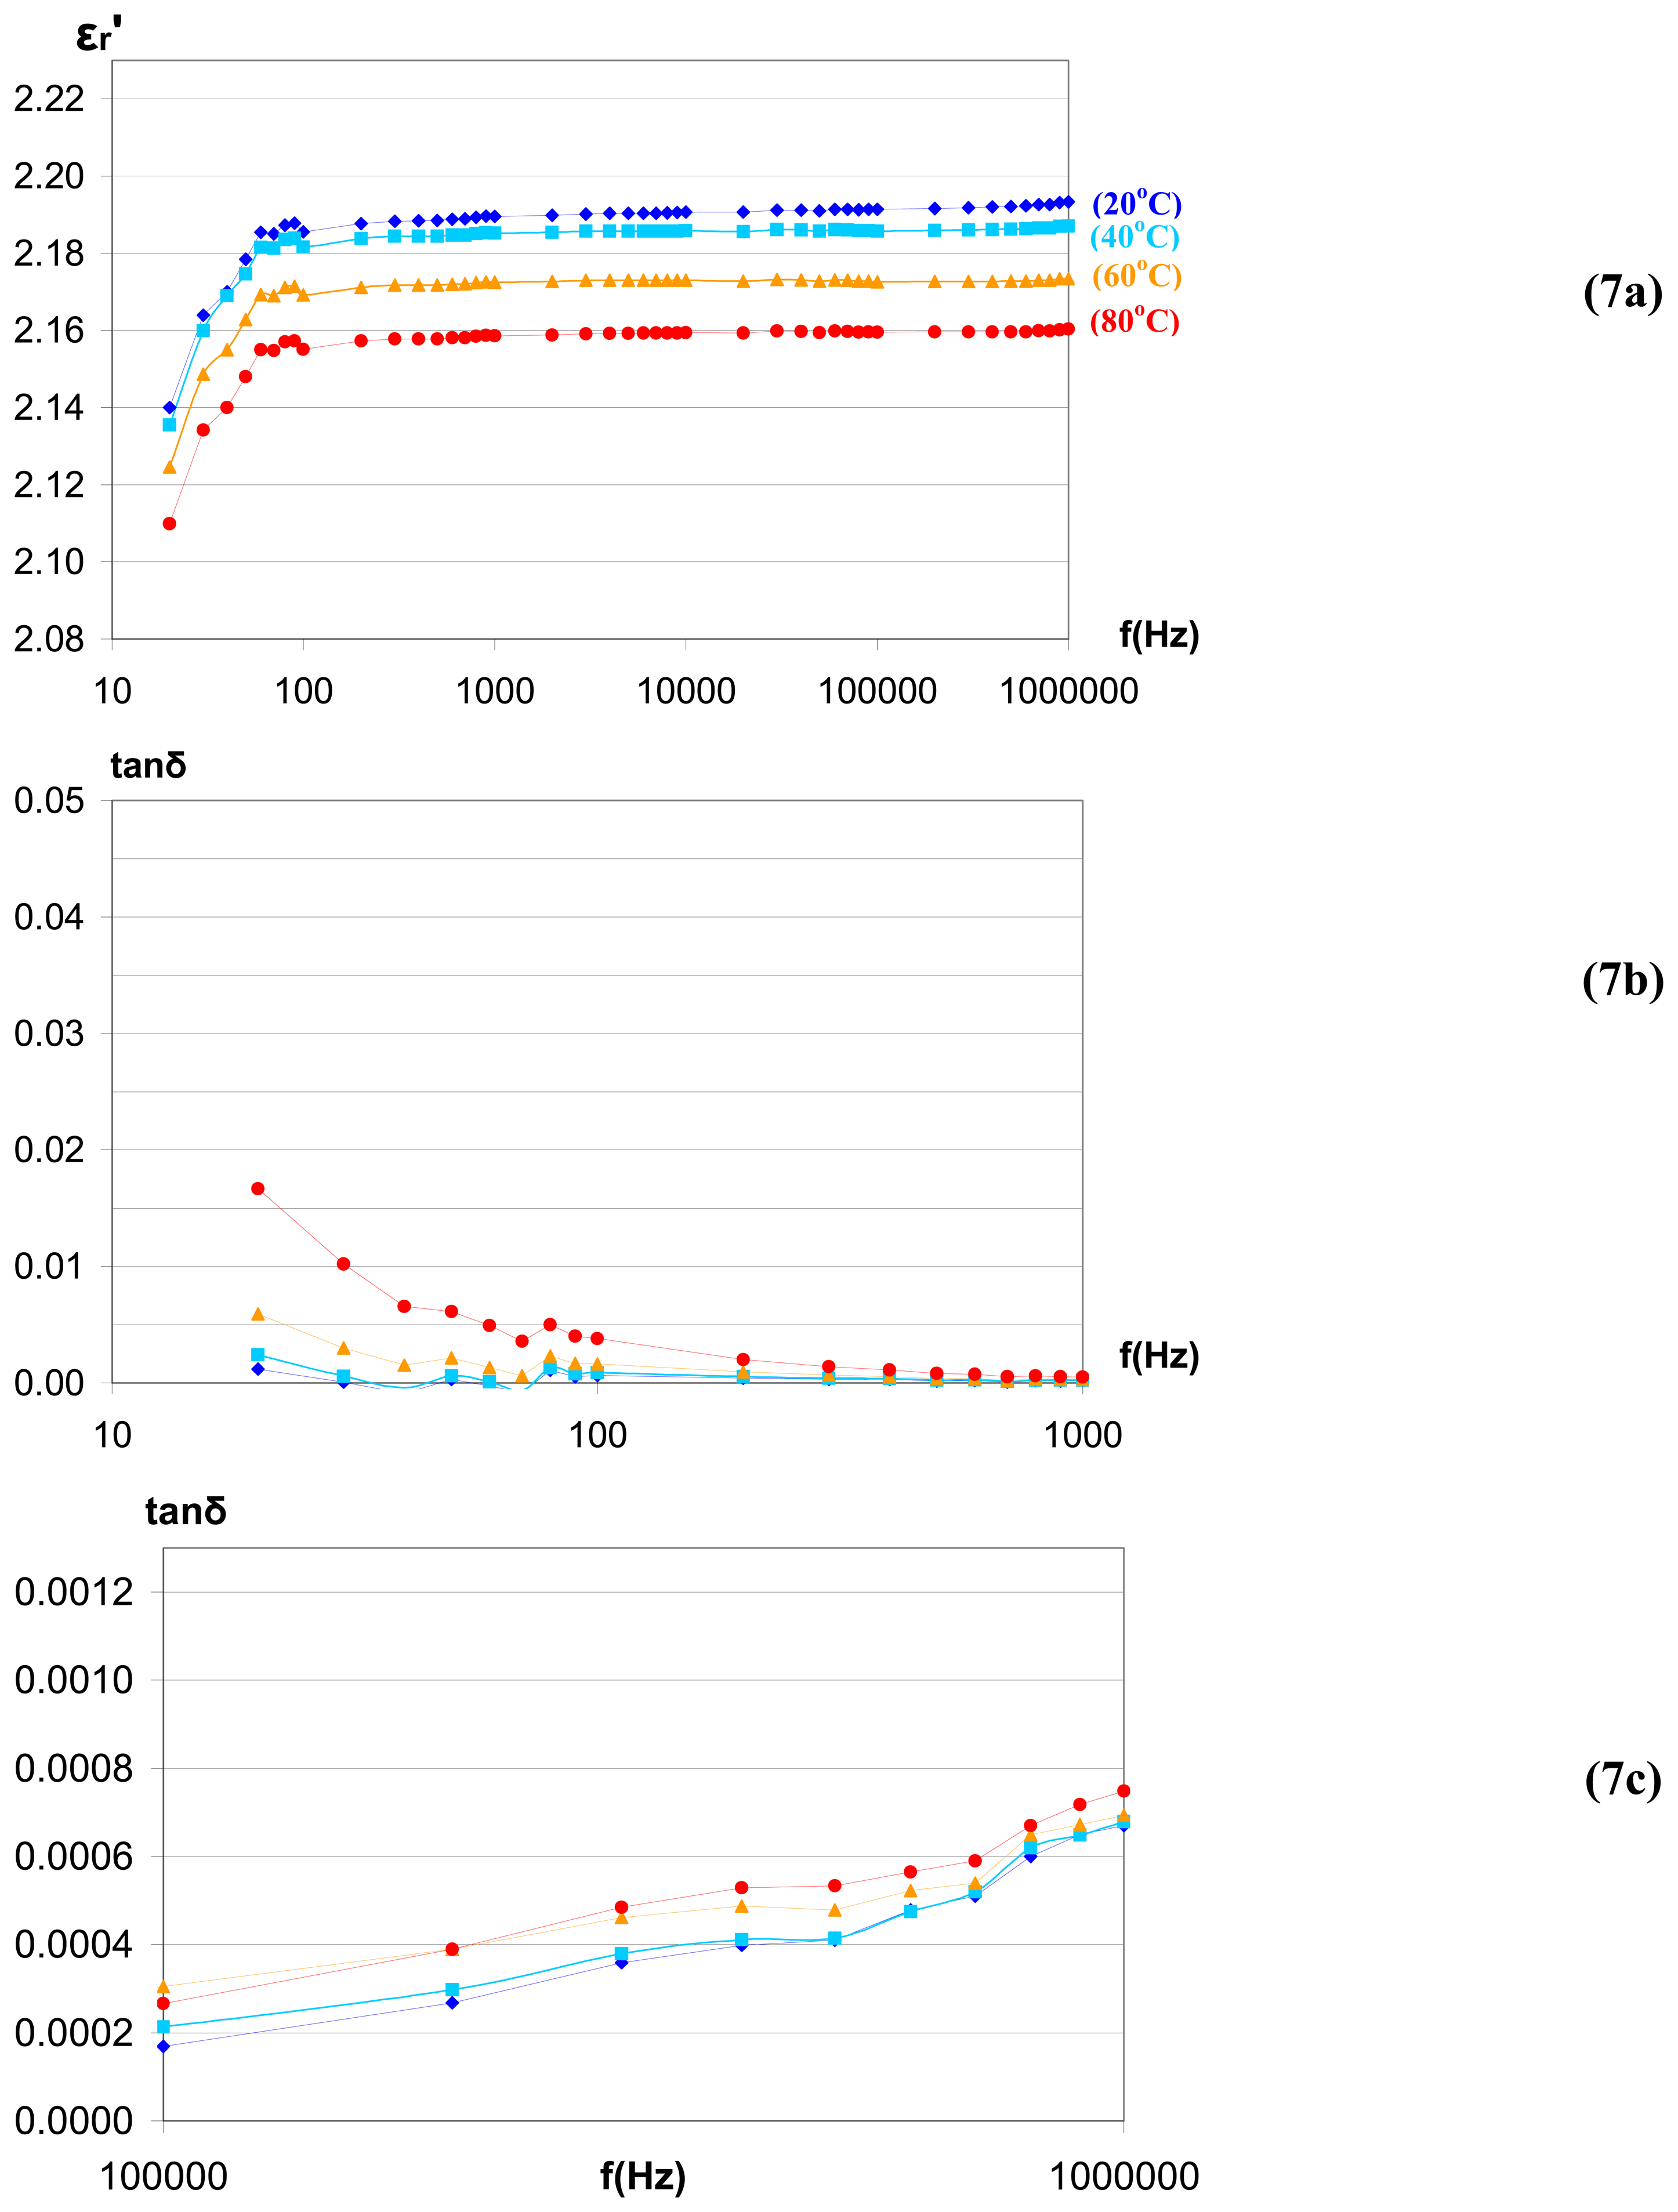
3.2. Typical dielectric spectroscopy results
3.2.a. Group-I: Oils that are in satisfactory condition for continued usage
3.2.b. Group-II: Oils that may require reconditioning (dehydration/filtration) to ensure a prolonged and reliable service
3.2.c. Group-III: Oil samples in poor condition
3.3. The corresponding physicochemical results
4. Conclusions
Acknowledgments
References
- Morgan, V.T. Effects of frequency, temperature, compression, and air pressure on the dielectric properties of a multilayer stack of dry kraft paper. IEEE Trans. on Dielectrics and Elec. Insul. 1998, 5, 125–131. [Google Scholar]
- Ferguson, R.; Lobeiras, A.; Sabau, J. Suspended particles in the liquid insulation of aging power transformers. IEEE Electrical Insulation Magazine 2002, 18, 17–23. [Google Scholar]
- Borsi, H. Esterfluessigkeit Midel 7131 als Ersatz fuer Mineraloel in Transformatoren. Elektrizitaetswirtschaft, Jg. 93. 1994, 24, 1523–1528. [Google Scholar]
- Kanno, M.; Oota, N.; Suzuki, T.; Ishii, T. Changes in ECT and dielectric dissipation factor of insulating oils due to aging in oxygen. IEEE Trans. Dielectrics and Elec. Insul. 2001, 8, 1048–1053. [Google Scholar]
- Duval, M.; DePablo, A. Interpretation of gas-in-oil analysis using new IEC publication 60599 and IEC TC 10 databases. IEEE Electrical Insulation Magazine. 2001, 17, 31–41. [Google Scholar]
- Arakelian, V.G. Effective diagnostics for oil-filled electrical equipment. IEEE Electrical Insulation Magazine 2002, 18, 26–38. [Google Scholar]
- Goetz, M.P. Permittivity measurements of frequency dependent electronic materials; Hewlett-Packard Application Note 5964-1506E: CA, USA, 1995. [Google Scholar]
- American Standards for Testing Materials, ASTM D150. Test methods for A-C loss characteristics and permittivity (dielectric constant) of solid electrical insulation materials. 1998.
- Agilent 16452A Liquid Test Fixture. Operating and Service Manual, 3rd Edition ed; Japan, 2000. [Google Scholar]
- Zaengl, W. S. Dielectric Spectroscopy in Time and Frequency Domain for HV Power Equipment, Part I: Theoretical Considerations. IEEE Electrical Insulation Magazine 2003, 19, 5–19. [Google Scholar]
- CIGRE Task Force 15.01.09. Dielectric response methods for diagnostics of power transformers. IEEE Electrical Insulation Magazine. 2003, 19, 12–18. [Google Scholar]
- Dervos, C.T.; Vassiliou, P.; Skafidas, P.; Paraskevas, Ch. Service life estimation of transformer oil. Proc. Intern. Conf. on Protection and Restoration of the Environment VI, Skiathos; 2002; pp. 1239–1246. [Google Scholar]
- Dervos, C.T.; Paraskevas, Ch.D.; Skafidas, P.; Vassiliou, P. Dielectric characterization of power transformer oils as a diagnostic life prediction method. IEEE Electrical Insulation Magazine. 2005, 21, 11–19. [Google Scholar]
- Castle, J.E.; Whitfield, T.B.; Ali, M. The transport of copper through oil impregnated paper insulation in electrical current transformers and bushings. IEEE Electrical Insulation Magazine 2003, 19, 25–29. [Google Scholar]


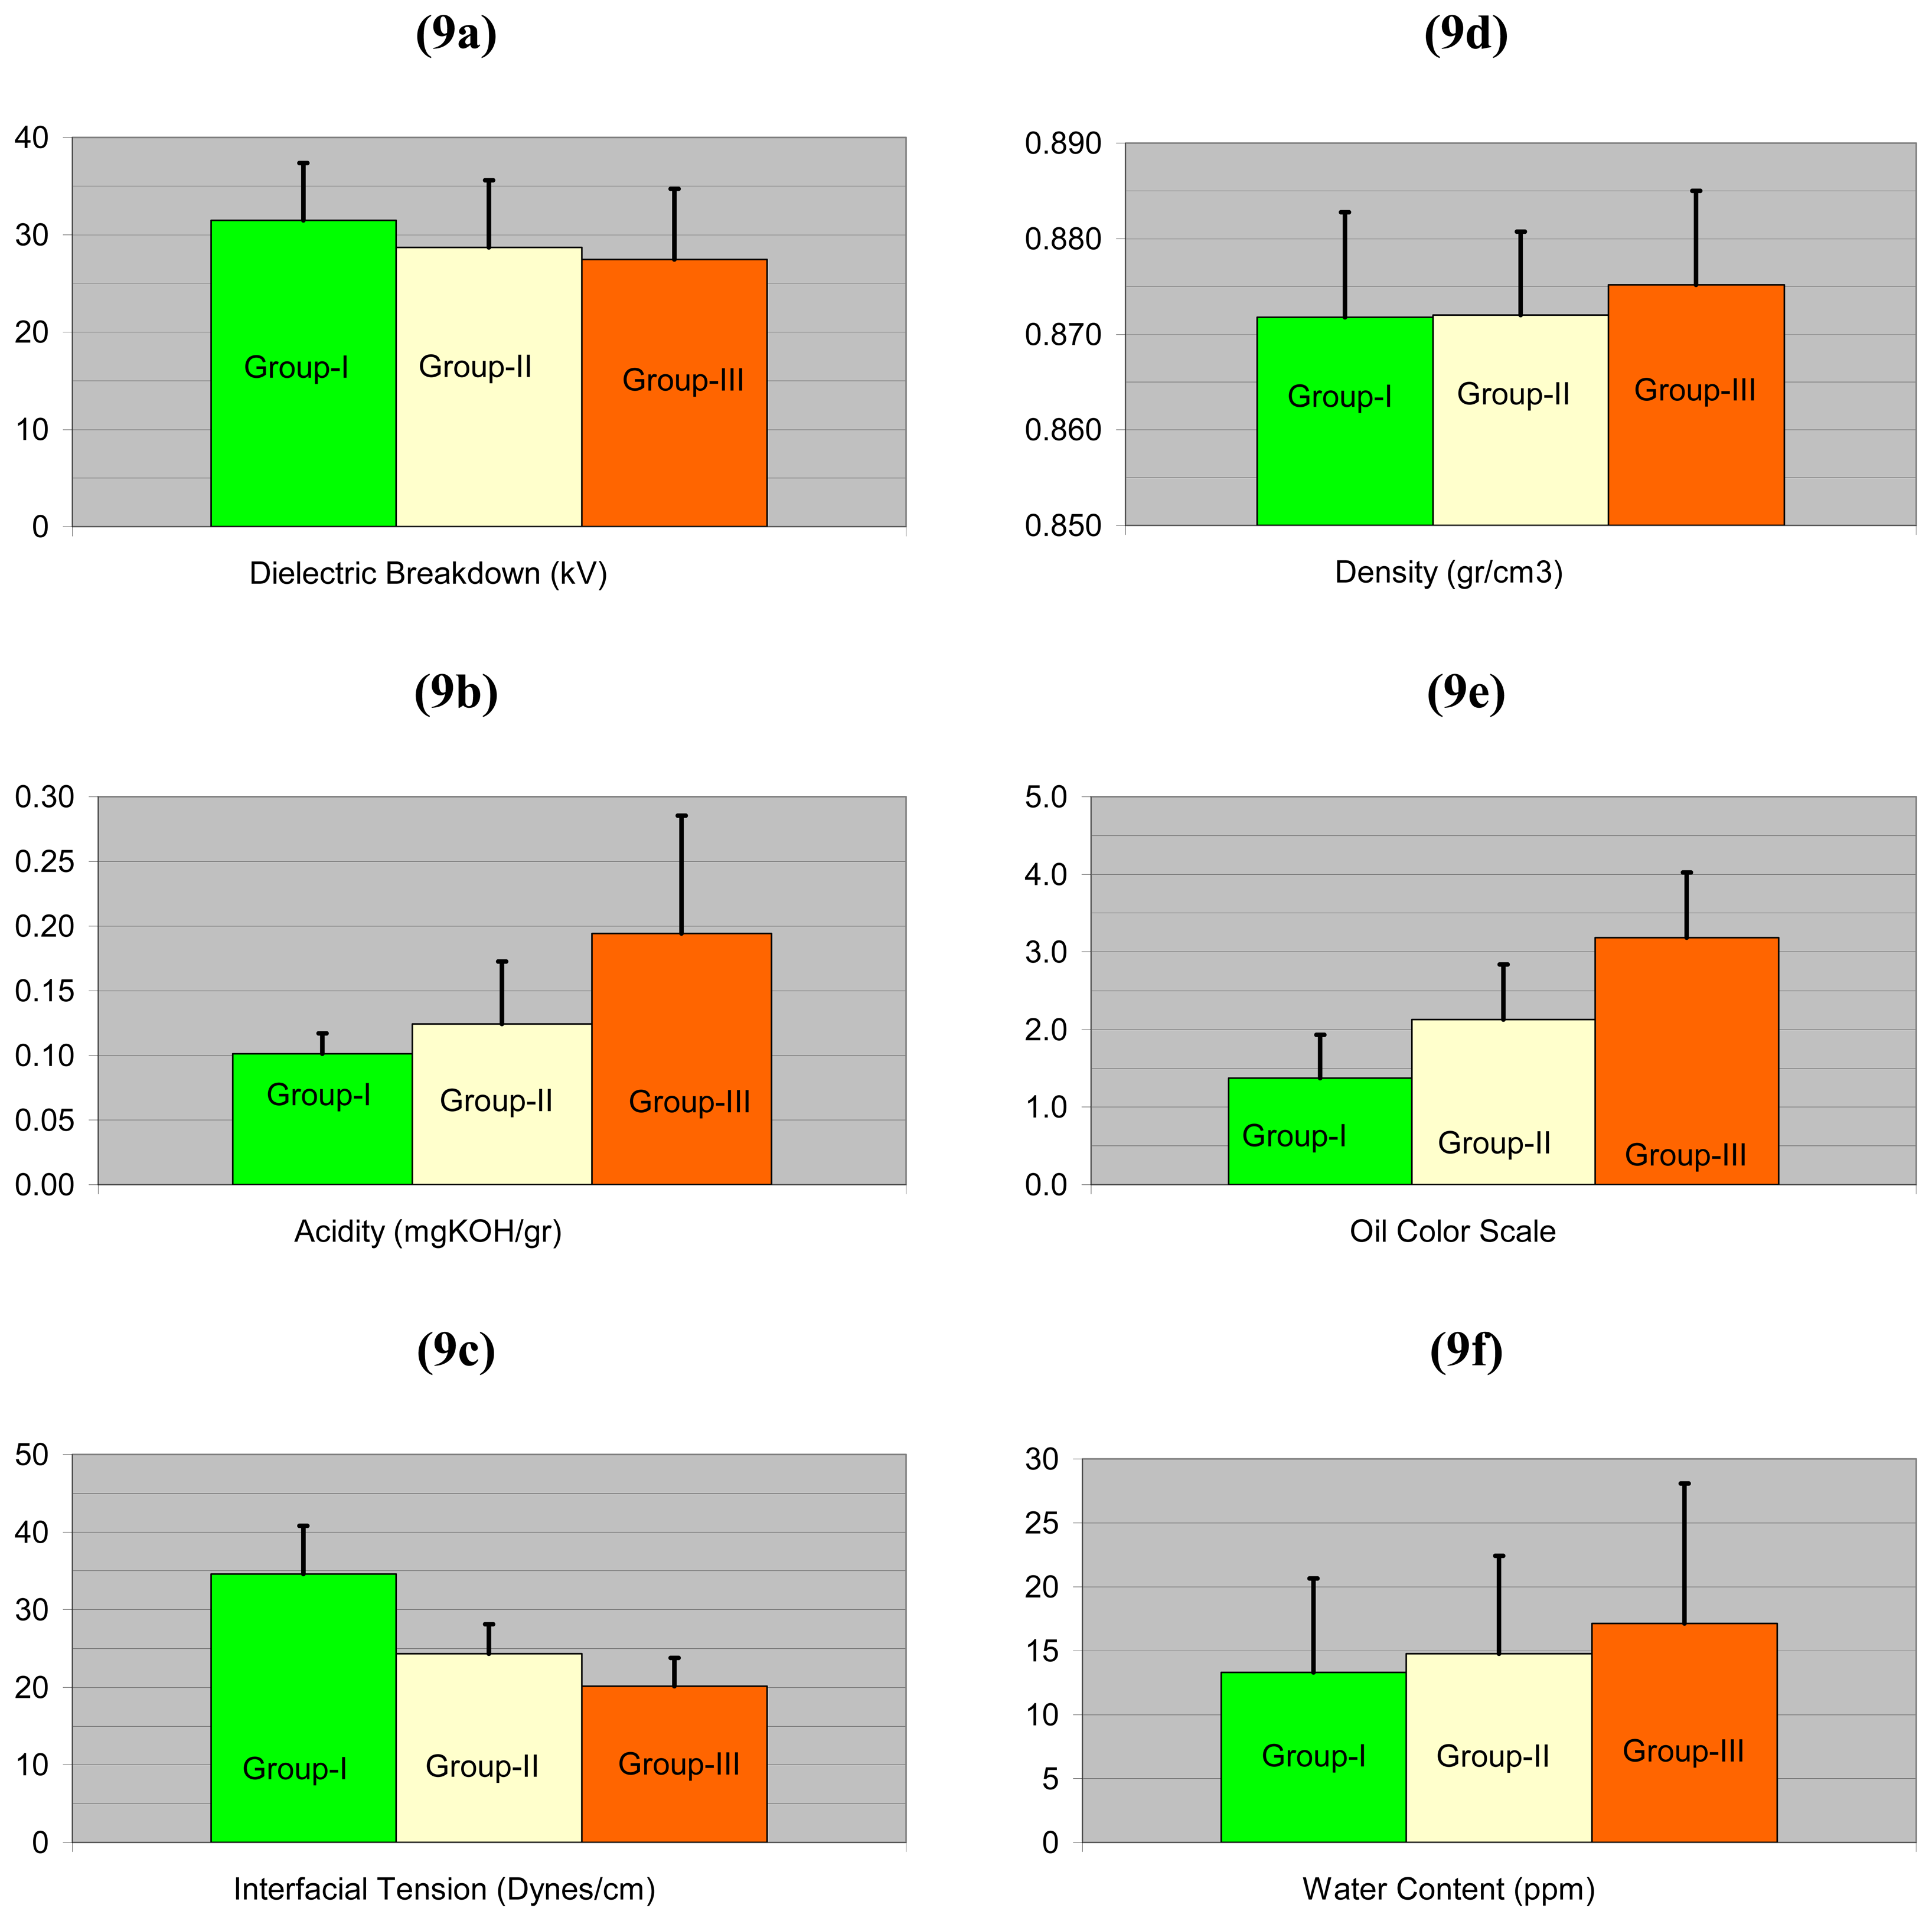
- (a)
- The average breakdown voltage values (kV).
- (b)
- The acidity, average neutralization values (m KOH/oil g).
- (c)
- The average interfacial tension values (dynes/cm).
- (d)
- The average relative density values (as compared to water density).
- (e)
- The average oil color number values (0.5-8.0) according to ASTM D1500.
- (f)
- The water concentration in oil (ppm max.).


| Test | Mineral oils | |||
|---|---|---|---|---|
| ASTM Method | Aged oils in electrical equipment * | |||
| 69 kV and Below | Above 69 kV through 288 kV | 345 kV and Above | ||
| Dielectric breakdown, (kV min.) | D877 | 26 | 26 | 26 |
| Interfacial tension, (dynes/cm min.) | D971 | 24 | 26 | 30 |
| Neutralization number, (mg KOH/g max.) | D974 | 0.2 | 0.2 | 0.1 |
| Water content, (ppm max.) | D1533 | 35 | 25 | 20 |
| Relative density | D1298 | 0.840 – 0.900** | ||
| Color | D1500 | 0.5 – 8 | ||
| Description / Assessment | |
| Group-I | Oils that are in satisfactory condition for continued usage. |
| Group-II | Oils that may need reconditioning (dehydration/filtration) to ensure prolonged and reliable service. |
| Group-III | Oils in poor condition. Such oils should be either reclaimed for possible reconditioning, or disposed. Components may require frequent inspection and decision has to be taken in order to undergo servicing, depending on economic considerations. |
© 2005 by MDPI ( http://www.mdpi.org). Reproduction is permitted for noncommercial purposes.
Share and Cite
Dervos, C.T.; Paraskevas, C.D.; Skafidas, P.D.; Vassiliou, P. A Complex Permittivity Based Sensor for the Electrical Characterization of High-Voltage Transformer Oils. Sensors 2005, 5, 302-316. https://doi.org/10.3390/s5040302
Dervos CT, Paraskevas CD, Skafidas PD, Vassiliou P. A Complex Permittivity Based Sensor for the Electrical Characterization of High-Voltage Transformer Oils. Sensors. 2005; 5(4):302-316. https://doi.org/10.3390/s5040302
Chicago/Turabian StyleDervos, Constantine T., Christos D. Paraskevas, Panayotis D. Skafidas, and Panayota Vassiliou. 2005. "A Complex Permittivity Based Sensor for the Electrical Characterization of High-Voltage Transformer Oils" Sensors 5, no. 4: 302-316. https://doi.org/10.3390/s5040302
APA StyleDervos, C. T., Paraskevas, C. D., Skafidas, P. D., & Vassiliou, P. (2005). A Complex Permittivity Based Sensor for the Electrical Characterization of High-Voltage Transformer Oils. Sensors, 5(4), 302-316. https://doi.org/10.3390/s5040302