Long-Term Monitoring of Brain Dopamine Metabolism In Vivo with Carbon Paste Electrodes

Abstract
:Introduction
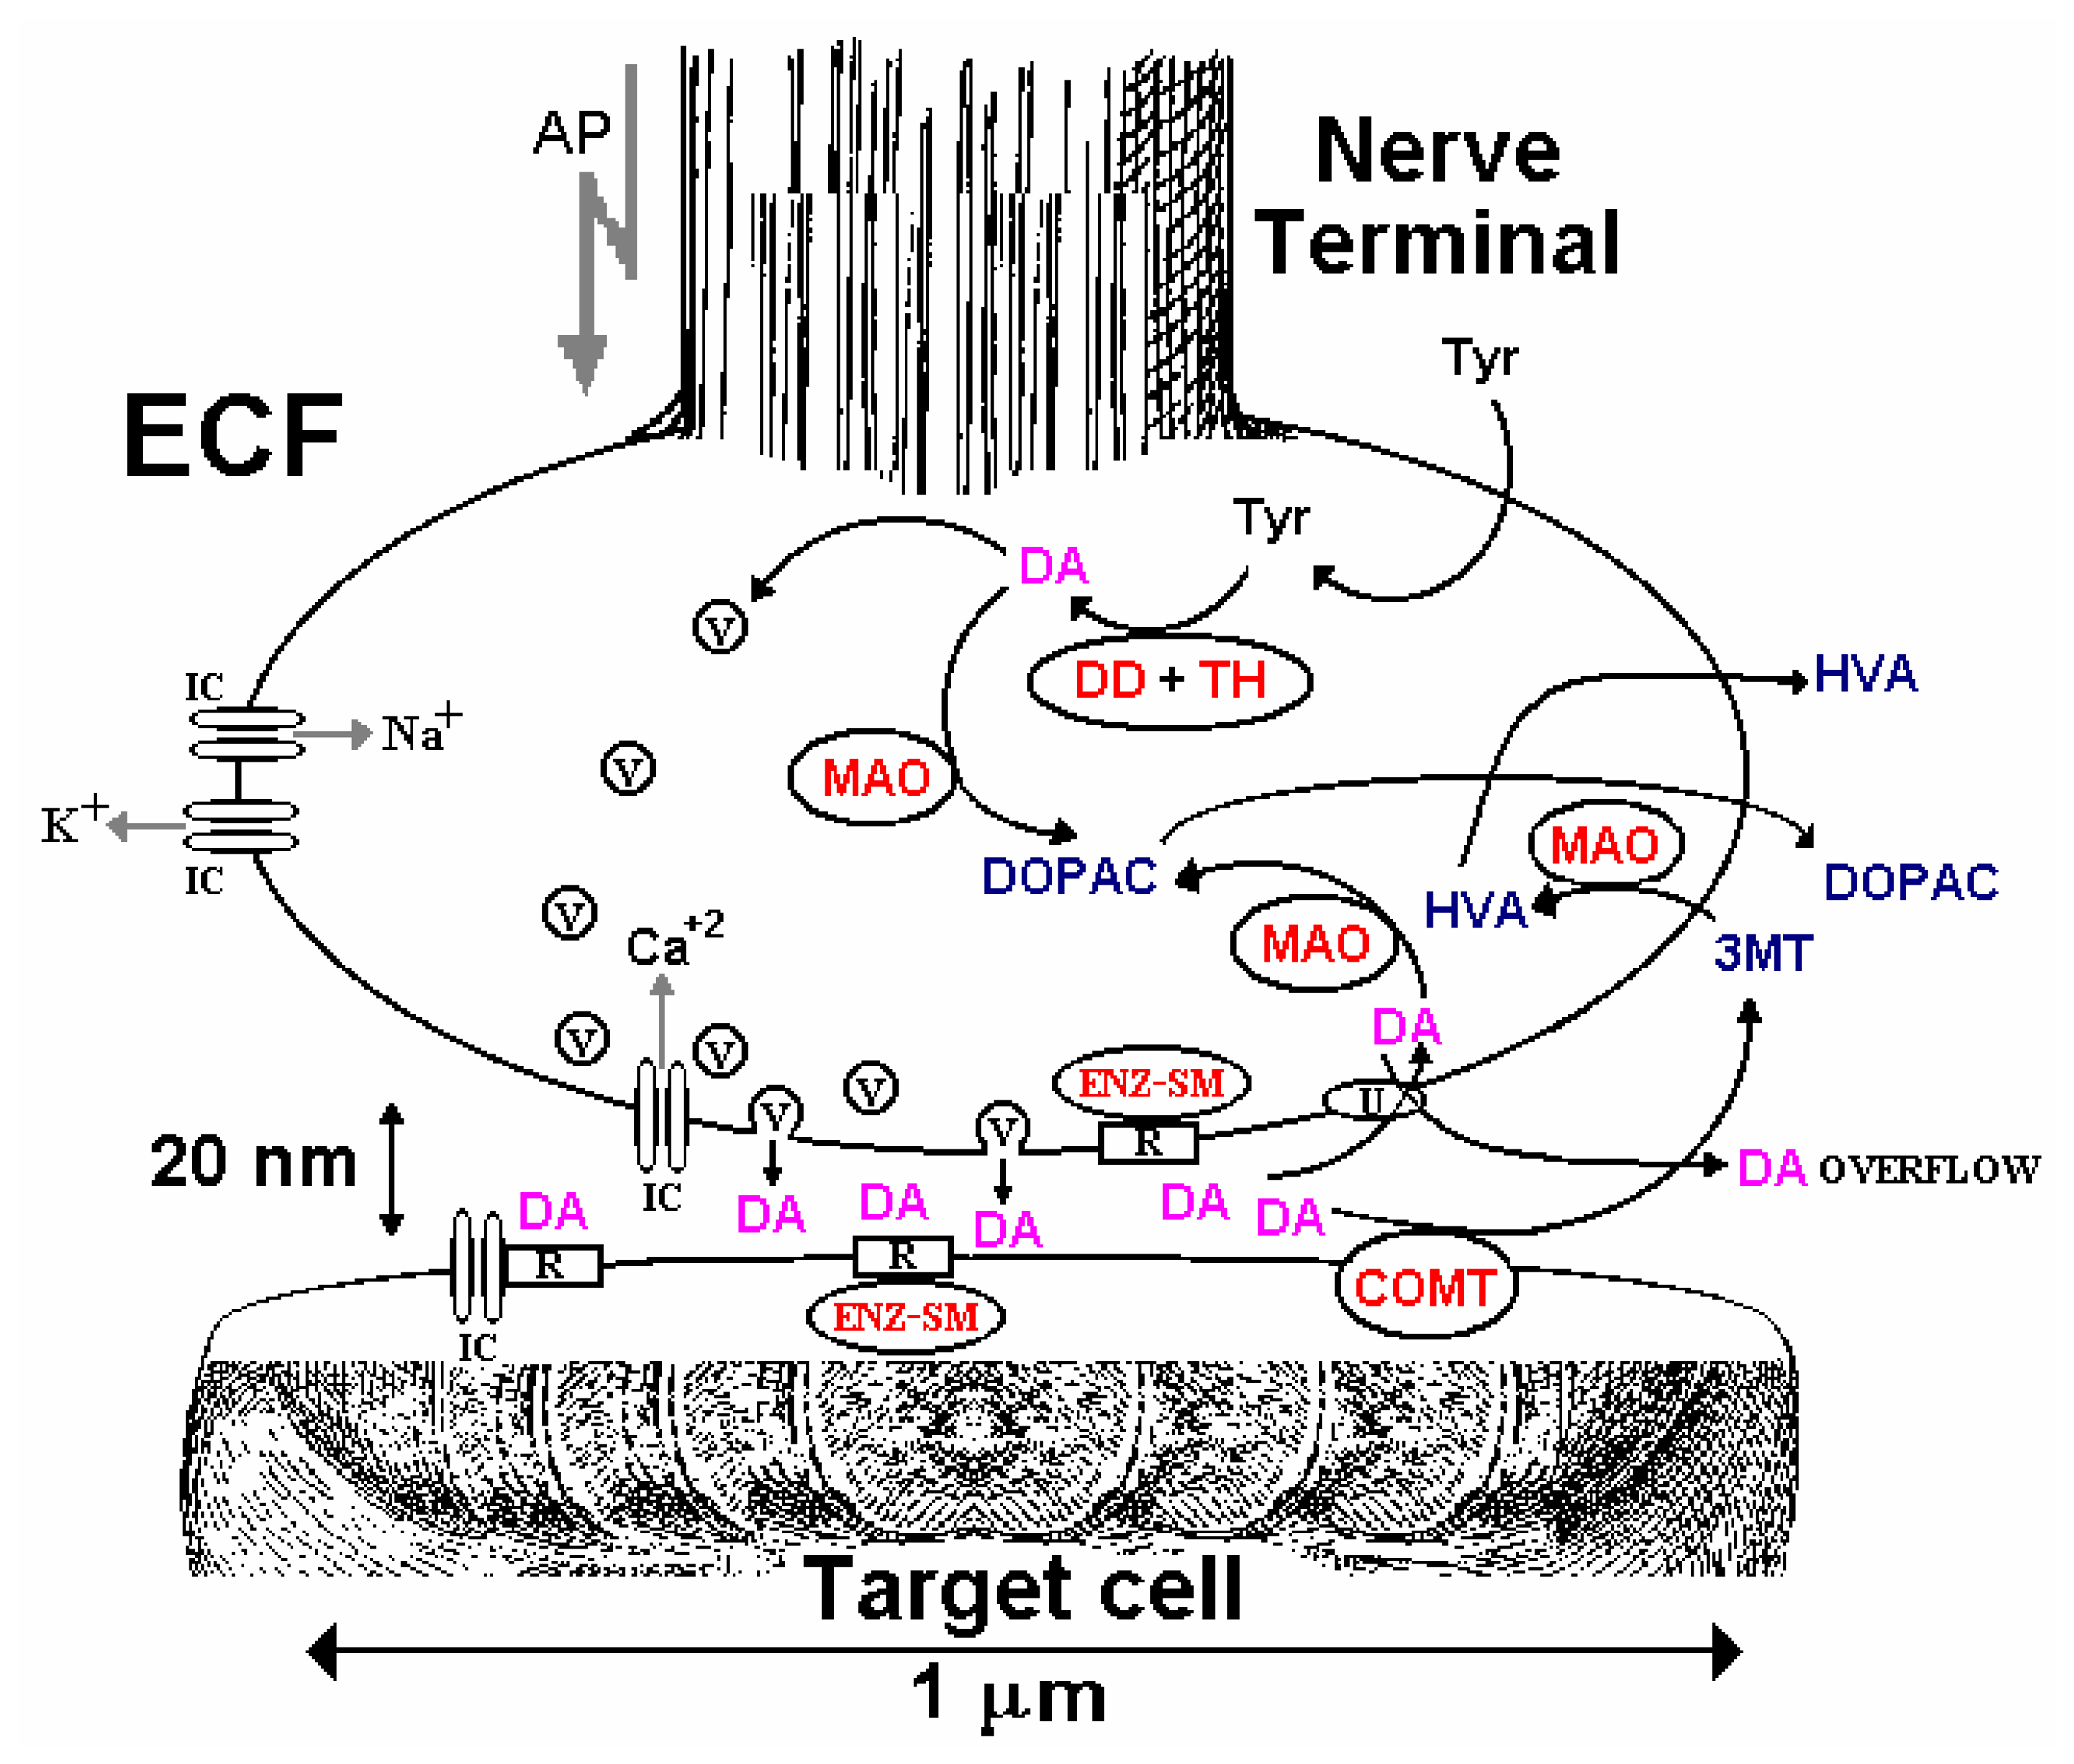
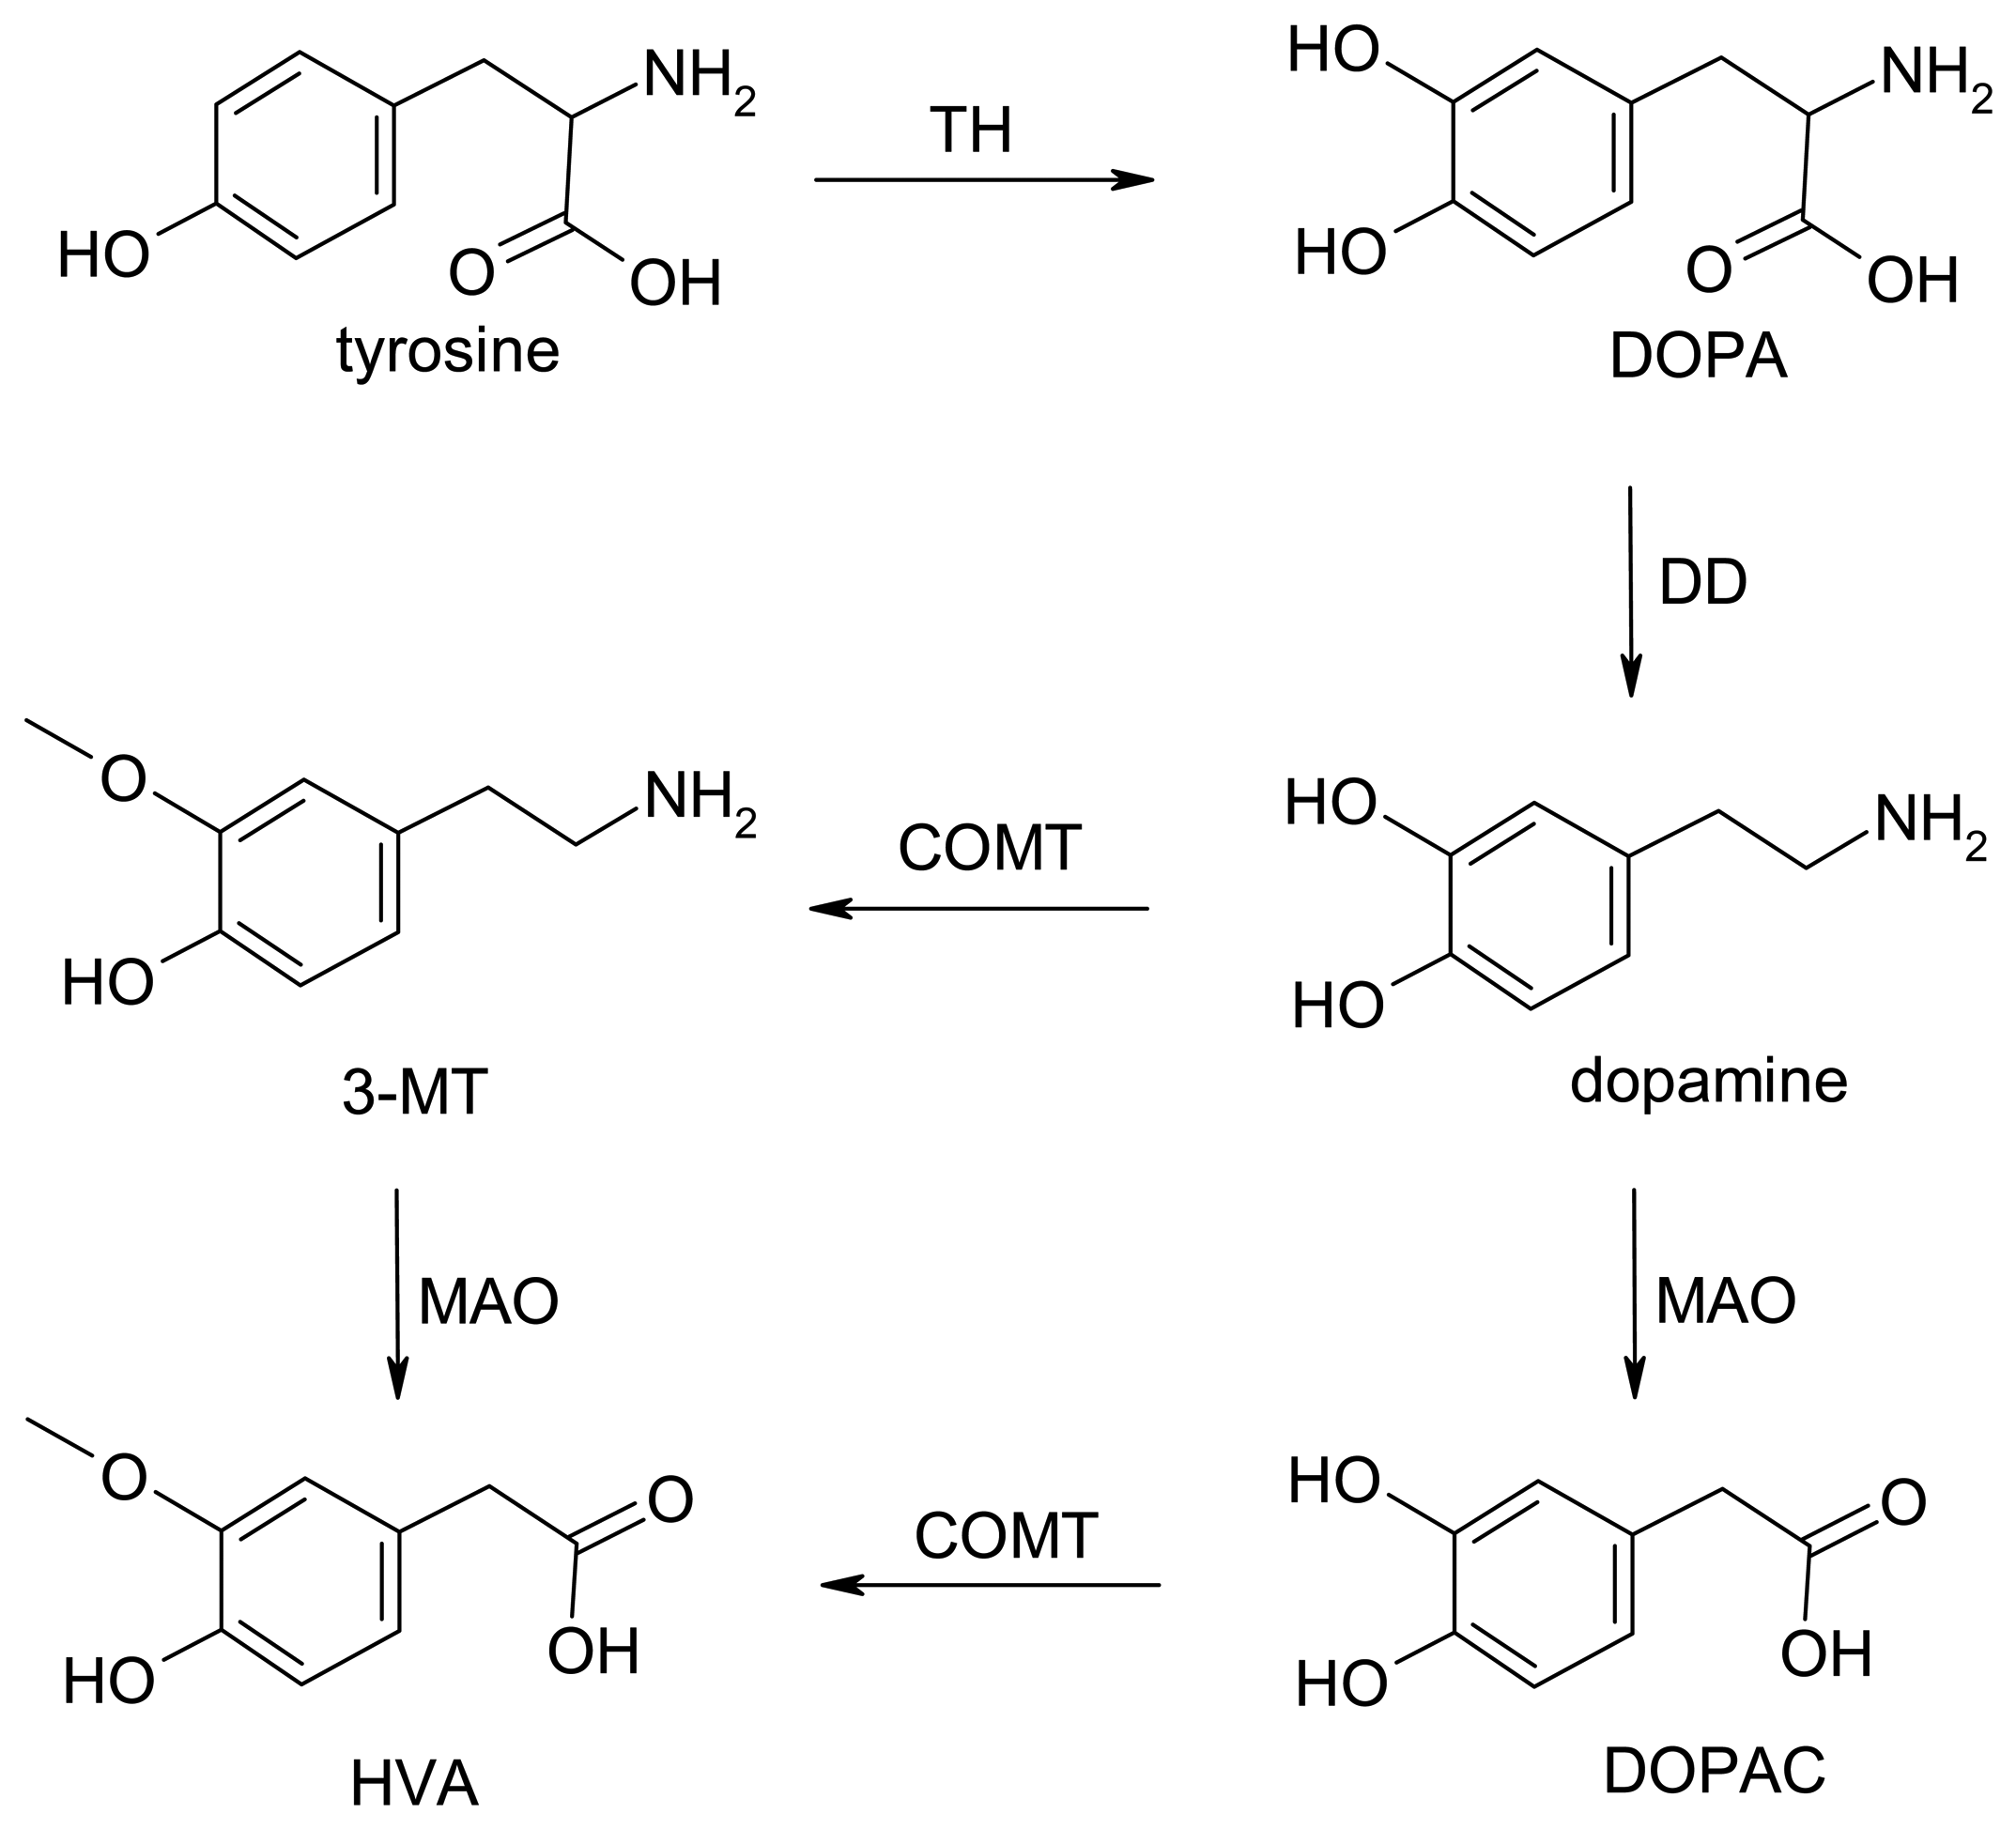
Dopamine Biochemistry
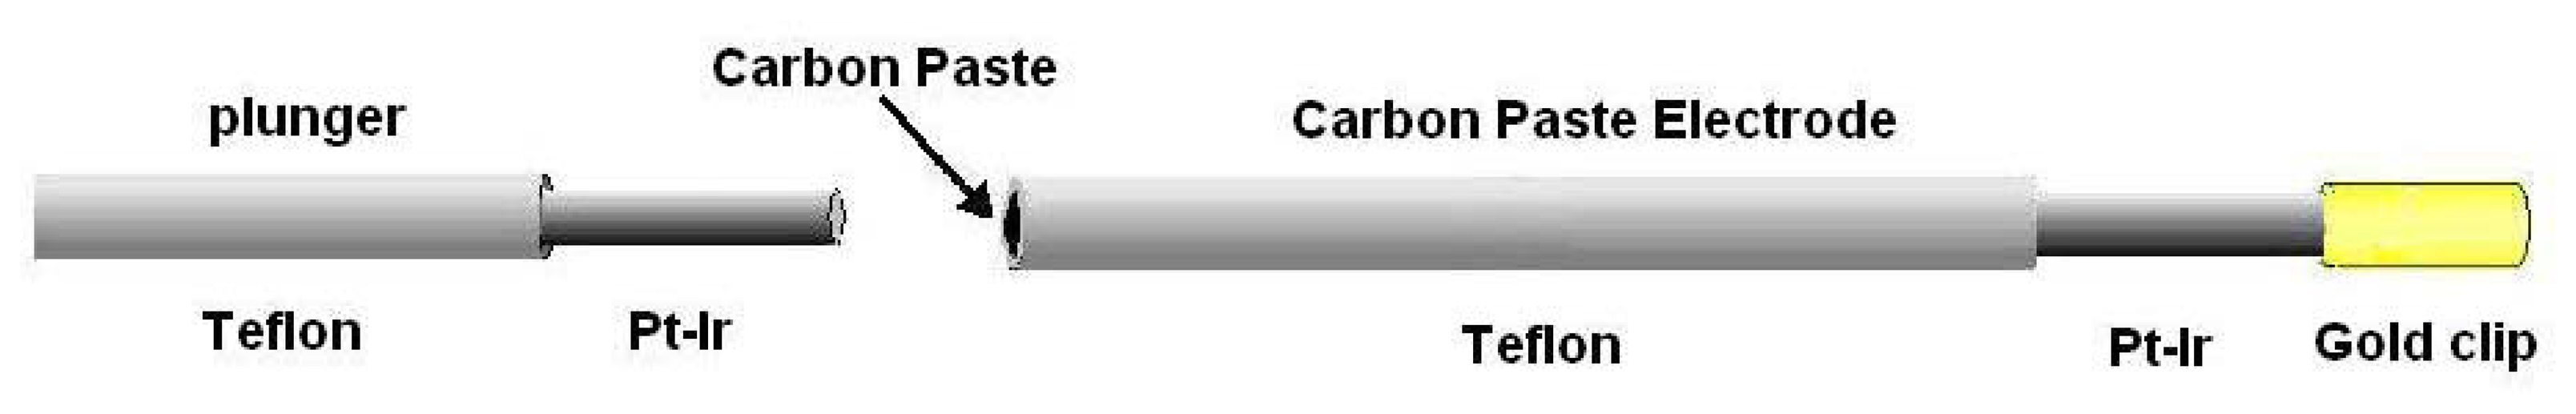
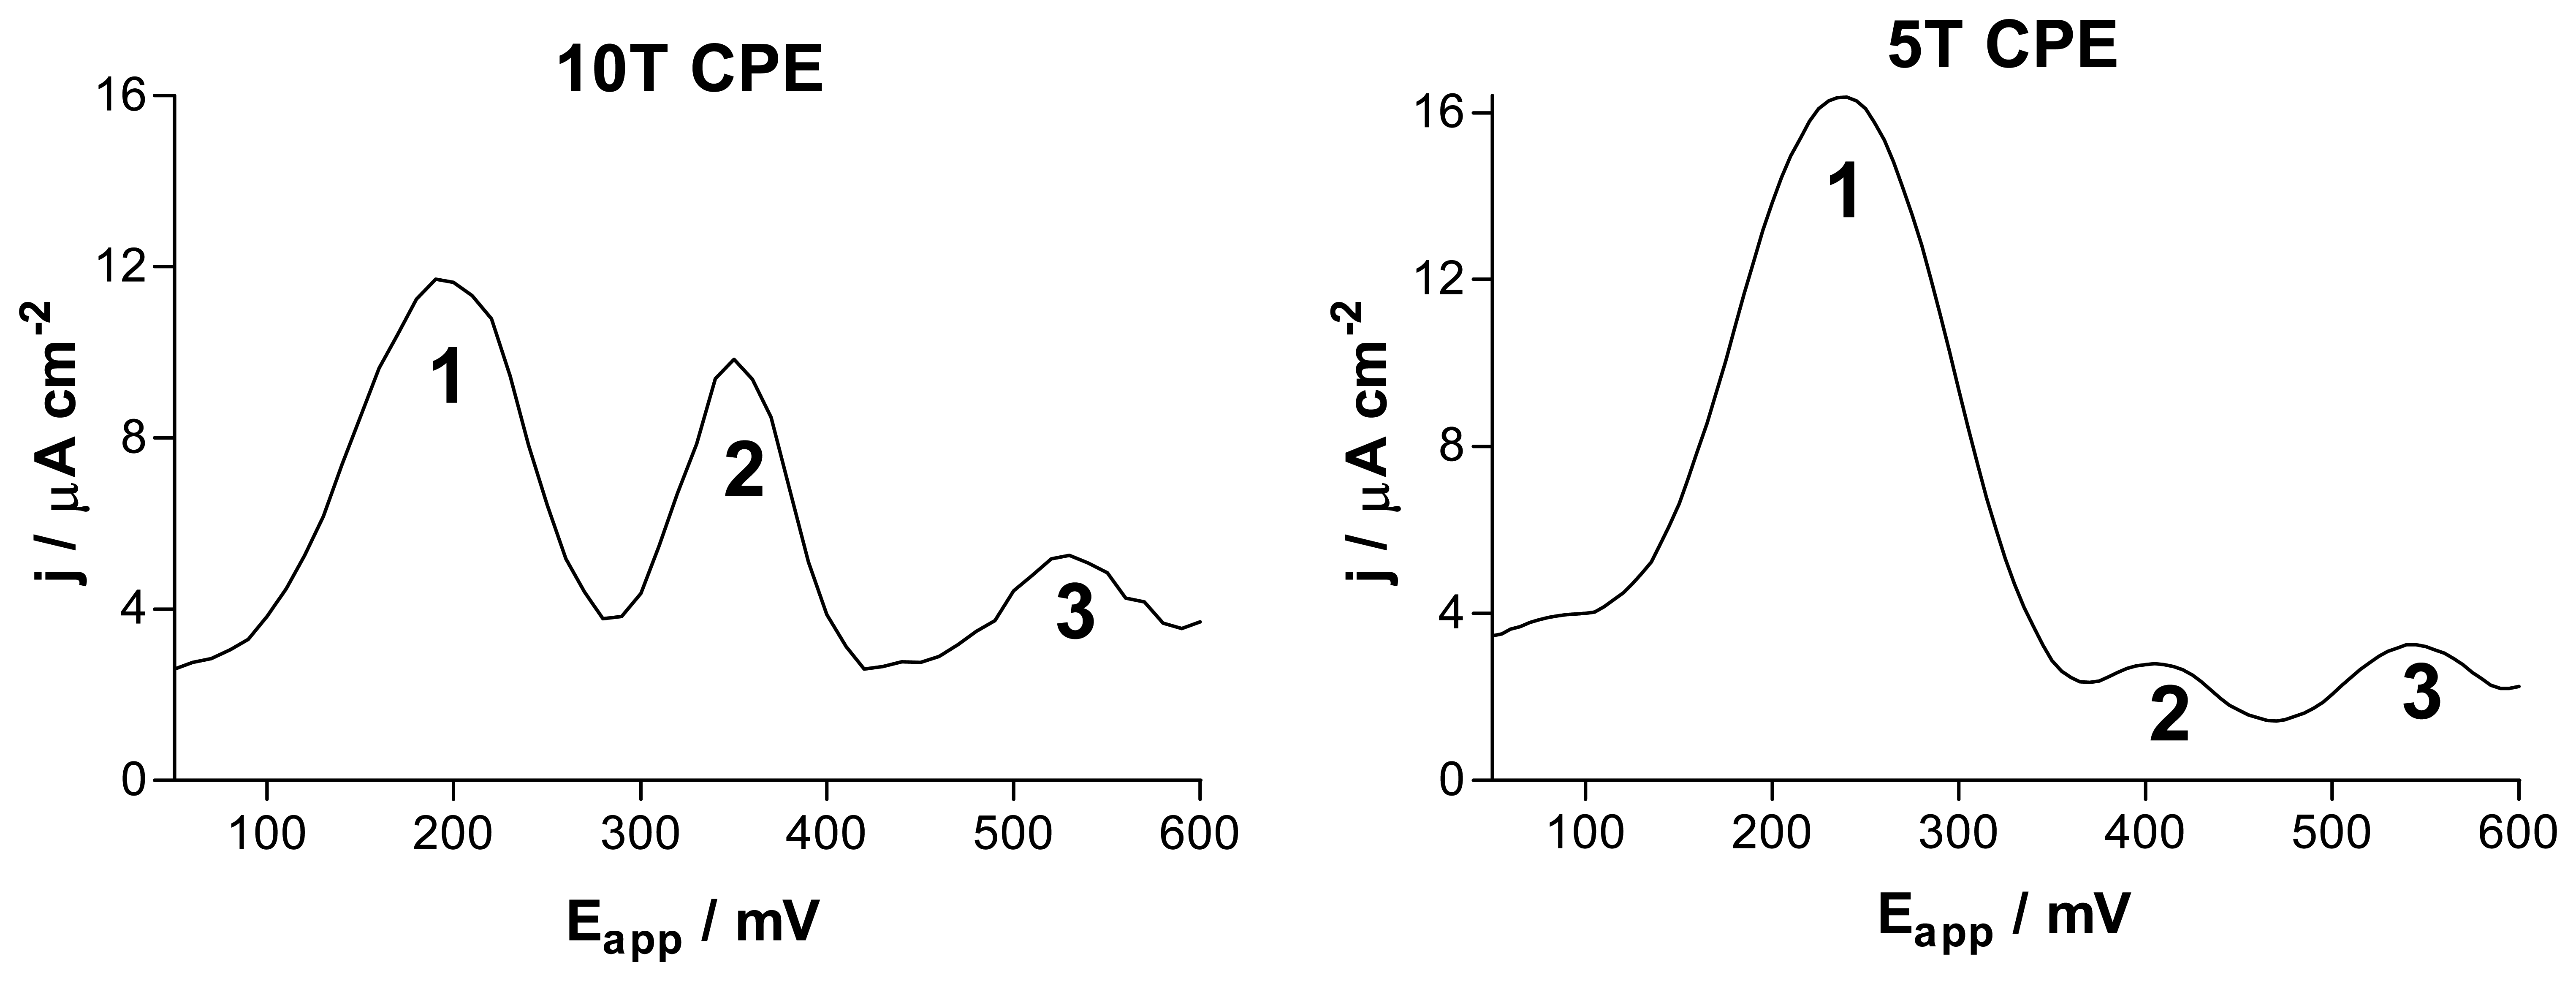
Carbon Paste Electrodes for In-Vivo Voltammetry
Pharmacological Studies
Behavioral Studies
Conclusions
Acknowledgments
References
- Montague, P.R.; Hyman, S.E.; Cohen, J.D. Computational roles for dopamine in behavioural control. Nature 2004, 431, 760–767. [Google Scholar]
- Pezze, M.A.; Feldon, J. Mesolimbic dopaminergic pathways in fear conditioning. Prog. Neurobiol. 2004, 74, 301–320. [Google Scholar]
- Rye, D.B. The two faces of Eve - Dopamine's modulation of wakefulness and sleep. Neurology 2004, 63, S2–S7. [Google Scholar]
- Gluck, M.R.; Santana, L.A.; Granson, H.; Yahr, M.D. Novel dopamine releasing response of an anti-convulsant agent with possible anti-Parkinson's activity. J. Neural Trans. 2004, 111, 713–724. [Google Scholar]
- Cools, R.; Robbins, T.W. Chemistry of the adaptive mind. Phil. Trans. Roy. Soc. Lond. Ser. A - Math. Phys. Engin. Sci. 2004, 362, 2871–2888. [Google Scholar]
- Leng, A.; Feldon, J.; Ferger, B. Long-term social isolation and medial prefrontal cortex: dopaminergic and cholinergic neurotransmission. Pharmacol. Biochem. Behav. 2004, 77, 371–379. [Google Scholar]
- Lynel, J.; Kelly, B.D.; O'Connor, W.T. Schizophrenia: a review of neuropharmacology. Irish J. Med. Sci. 2004, 173, 155–159. [Google Scholar]
- Palsson, E.; Klamer, D.; Wass, C.; Archer, T.; Engel, J.A.; Svensson, L. The effects of phencyclidine on latent inhibition in taste aversion conditioning: differential effects of preexposure and conditioning. Behav. Brain Res. 2005, 157, 139–146. [Google Scholar]
- Zhang, J.H.; Engel, J.A.; Soderpalm, B.; Svensson, L. Repeated administration of amphetamine induces sensitisation to its disruptive effect on prepulse inhibition in the rat. Psychopharmacology 1998, 135, 401–406. [Google Scholar]
- Garris, P.A.; Kilpatrick, M.; Bunin, M.A.; Michael, D.; Walker, Q.D.; Wightman, R.M. Dissociation of dopamine release in the nucleus accumbens from intracranial self-stimulation. Nature 1999, 398, 67–69. [Google Scholar]
- Reynolds, J.N.J.; Hyland, B.I.; Wickens, J.R. A cellular mechanism of reward-related learning. Nature 2001, 413, 67–70. [Google Scholar]
- Antelman, S.M.; Szechtman, H.; Chin, P.; Fisher, A.E. Tail pinch-induced eating, gnawing and licking behavior in rats: dependence on the nigrostriatal dopamine system. Brain Res. 1975, 99, 319–337. [Google Scholar]
- Roitman, M.F.; Stuber, G.D.; Phillips, P.E.M.; Wightman, R.M.; Carelli, R.M. Dopamine operates as a subsecond modulator of food seeking. J. Neurosci. 2004, 24, 1265–1271. [Google Scholar]
- Ahlenius, S.; Carlsson, A.; Hillegaart, V. Region-selective activation of brain monoamine synthesis by sexual activity in the male rat. Eur. J. Pharmacol. 1987, 144, 77–82. [Google Scholar]
- Mas, M. Neurobiological correlates of masculine sexual behavior. Neurosci. Biobehav. Rev. 1995, 19, 261–277. [Google Scholar]
- Phillips, P.E.M.; Stuber, G.D.; Heien, M.L.A.V.; Wightman, R.M.; Carelli, R.M. Subsecond dopamine release promotes cocaine seeking. Nature 2003, 422, 614–618. [Google Scholar]
- Ferguson, S.A.; Gough, B.J.; Cada, A.M. In vivo basal and amphetamine-induced striatal dopamine and metabolite levels are similar in the spontaneously hypertensive, Wistar-Kyoto and Sprague-Dawley male rats. Physiol. Behav. 2003, 80, 109–114. [Google Scholar]
- Sprague, J.E.; Everman, S.L.; Nichols, D.E. An integrated hypothesis for the serotonergic axonal loss induced by 3,4-methylenedioxymethamphetamine. Neurotoxicology 1998, 19, 427–441. [Google Scholar]
- Parkin, M.C.; Hopwood, S.E.; Strong, A.J.; Boutelle, M.G. Resolving dynamic changes in brain metabolism using biosensors and on-line microdialysis. Trends Anal. Chem. 2003, 22, 487–497. [Google Scholar]
- Bungay, P.M.; Newton-Vinson, P.; Isele, W.; Garris, P.A.; Justice, J.B. Microdialysis of dopamine interpreted with quantitative model incorporating probe implantation trauma. J. Neurochem. 2003, 86, 932–946. [Google Scholar]
- Crespi, F.; Croce, A.C.; Fiorani, S.; Masala, B.; Heidbreder, C.; Bottiroli, G. Autofluorescence spectrofluorometry of central nervous system (CNS) neuromediators. Lasers in Surgery and Medicine 2004, 34, 39–47. [Google Scholar]
- Burmeister, J.J.; Palmer, M.; Gerhardt, G.A. Ceramic-based multisite microelectrode array for rapid choline measures in brain tissue. Anal. Chim. Acta 2003, 481, 65–74. [Google Scholar]
- O'Neill, R.D.; Chang, S.C.; Lowry, J.P.; McNeil, C.J. Comparisons of platinum, gold, palladium and glassy carbon as electrode materials in the design of biosensors for glutamate. Biosensors Bioelectron. 2004, 19, 1521–1528. [Google Scholar]
- Marsden, C.A.; Joseph, M.H.; Kruk, Z.L.; Maidment, N.T.; O'Neill, R.D.; Schenk, J.O.; Stamford, J.A. In vivo voltammetry - Present electrodes and methods. Neuroscience 1988, 25, 389–400. [Google Scholar]
- Stamford, J.A. In vivo voltammetry - prospects for the next decade. Trends Neurosci. 1989, 12, 407–412. [Google Scholar]
- Adams, R.N. In vivo electrochemical measurements in the CNS. Prog. Neurobiol. 1990, 35, 297–311. [Google Scholar]
- Ewing, A.G.; Strein, T.G.; Yi, L. Analytical chemistry in microenvironments: Single nerve cells. Accounts Chem. Res. 1992, 25R, 440–447. [Google Scholar]
- Kawagoe, K.T.; Zimmerman, J.B.; Wightman, R.M. Principles of voltammetry and microelectrode surface states. J. Neurosci. Methods 1993, 48, 225–240. [Google Scholar]
- O'Neill, R.D. Microvoltammetric techniques and sensors for monitoring neurochemical dynamics in vivo - a review. Analyst 1994, 119, 767–779. [Google Scholar]
- Boulton, A.A.; Baker, G.B.; Adams, R.N. Voltammetric Methods in Brain Systems; Humana Press: New Jersey, 1995. [Google Scholar]
- Kruk, Z.L.; O'Connor, J.J. Fast electrochemical studies in isolated tissues. Trends Pharmacol. Sci. 1995, 16, 145–149. [Google Scholar]
- Pantano, P.; Kuhr, W.G. Enzyme-modified microelectrodes for in vivo neurochemical measurements. Electroanalysis 1995, 7, 405–416. [Google Scholar]
- Blaha, C.D.; Phillips, A.G. A critical assessment of electrochemical procedures applied to the measurement of dopamine and its metabolites during drug-induced and species-typical behaviours. Behav. Pharmacol. 1996, 7, 675–708. [Google Scholar]
- Stamford, J.A.; Justice, J.B. Probing brain chemistry. Anal. Chem. 1996, 68, A359–A363. [Google Scholar]
- O'Neill, R.D. Neurochemical analysis using sensors. In Biosensors in the Body: Continuous In Vivo Monitoring; Fraser, D.M., Ed.; John Wiley & Sons: Chichester, 1997; pp. 171–196. [Google Scholar]
- O'Neill, R.D.; Lowry, J.P.; Mas, M. Monitoring brain chemistry in vivo: voltammetric techniques, sensors and behavioral applications. Crit. Rev. Neurobiol. 1998, 12, 69–127. [Google Scholar]
- Michael, D.J.; Wightman, R.M. Electrochemical monitoring of biogenic amine neurotransmission in real time. J. Pharmaceut. Biomed. Anal. 1999, 19, 33–46. [Google Scholar]
- Hutchinson, P.J.; O'Connell, M.T.; Kirkpatrick, P.J.; Pickard, J.D. How can we measure substrate, metabolite and neurotransmitter concentrations in the human brain? 23, R75–R109.
- Troyer, K.P.; Heien, M.L.A.V.; Venton, B.J.; Wightman, R.M. Neurochemistry and electroanalytical probes. Curr. Opin. Chem. Biol. 2002, 6, 696–703. [Google Scholar]
- O'Neill, R.D. Sensor-tissue interactions in neurochemical analysis with carbon paste electrodes in vivo. Analyst 1993, 118, 433–438. [Google Scholar]
- Ormonde, D.E.; O'Neill, R.D. The oxidation of ascorbic acid at carbon paste electrodes. Modified response following contact with surfactant, lipid and brain tissue. J. Electroanal. Chem. 1990, 279, 109–121. [Google Scholar]
- Lyne, P.D.; O'Neill, R.D. Stearate-modified carbon paste electrodes for detecting dopamine in vivo: decrease in selectivity caused by lipids and other surface-active agents. Anal. Chem. 1990, 62, 2347–2351. [Google Scholar]
- Cheng, H.Y.; Schenk, J.; Huff, R.; Adams, R.N. In vivo electrochemistry: behaviour of micro electrodes in brain tissue. J. Electroanal. Chem. 1979, 100, 23–31. [Google Scholar]
- Dayton, M.A.; Ewing, A.G.; Wightman, R.M. Diffusion processes measured at microvoltammetric electrodes in brain tissue. J. Electroanal. Chem. 1983, 146, 189–200. [Google Scholar]
- Amatore, C.; Kelly, R.S.; Kristensen, E.W.; Kuhr, W.G.; Wightman, R.M. Effects of restricted diffusion at ultramicroelectrodes in brain tissue. The pool model: theory and experiment for chronoamperometry. J. Electroanal. Chem. 1986, 213, 31–42. [Google Scholar]
- Nicholson, C.; Sykova, E. Extracellular space structure revealed by diffusion analysis. Trends Neurosci. 1998, 21, 207–215. [Google Scholar]
- Kane, D.A.; O'Neill, R.D. Major differences in the behaviour of carbon paste and carbon fibre electrodes in a protein-lipid matrix: implications for voltammetry in vivo. Analyst 1998, 123, 2899–2903. [Google Scholar]
- Wiedemann, D.J.; Basse-Tomusk, A.; Wilson, R.L.; Rebec, G.V.; Wightman, R.M. Interference by DOPAC and ascorbate during attempts to measure drug-induced changes in neostriatal dopamine with Nafion-coated, carbon-fiber electrodes. J. Neurosci. Methods 1990, 35, 9–18. [Google Scholar]
- Khan, A.S.; Michael, A.C. Invasive consequences of using micro-electrodes and microdialysis probes in the brain. Trends Anal. Chem. 2003, 22, 503–508. [Google Scholar]
- Phillips, P.E.M.; Wightman, R.M. Critical guidelines for validation of the selectivity of in-vivo chemical microsensors. Trends Anal. Chem. 2003, 22, 509–514. [Google Scholar]
- Sabatini, B.L.; Regehr, W.G. Timing of neurotransmission at fast synapses in the mammalian brain. Nature 1996, 384, 170–172. [Google Scholar]
- Meiergerd, S.M.; Schenk, J.O. Striatal transporter for dopamine: Catechol structure-activity studies and susceptibility to chemical modification. J. Neurochem. 1994, 62, 998–1008. [Google Scholar]
- Vulto, A.G.; Westenberg, H.G.M.; Meijer, L.B.A.; Versteeg, D.H.G. The dopamine metabolite 3-methoxytyramine is not a suitable indicator of dopamine release in the rat brain. J. Neurochem. 1986, 47, 1387–1393. [Google Scholar]
- Kissinger, P.T.; Hart, J.B.; Adams, R.N. Voltammetry in brain tissue - a new neurophysiological measurement. Brain Res. 1973, 55, 209–213. [Google Scholar]
- Wu, Q.; Reith, M.E.A.; Wightman, R.M.; Kawagoe, K.T.; Garris, P.A. Determination of release and uptake parameters from electrically evoked dopamine dynamics measured by real-time voltammetry. J. Neurosci. Methods 2001, 112, 119–133. [Google Scholar]
- Garris, P.A.; Budygin, E.A.; Phillips, P.E.M.; Venton, B.J.; Robinson, D.L.; Bergstrom, B.P.; Rebec, G.V.; Wightman, R.M. A role for presynaptic mechanisms in the actions of nomifensine and haloperidol. Neuroscience 2003, 118, 819–829. [Google Scholar]
- Ottersen, O.P.; Landsend, A.S. Organization of glutamate receptors at the synapse. Eur. J. Neurosci. 1997, 9, 2219–2224. [Google Scholar]
- Kullmann, D.M.; Asztely, F. Extrasynaptic glutamate spillover in the hippocampus: evidence and implications. Trends Neurosci. 1998, 21, 8–14. [Google Scholar]
- O'Neill, R.D.; Fillenz, M. Detection of homovanillic acid in vivo using microcomputer-controlled voltammetry: simultaneous monitoring of rat motor activity and striatal dopamine release. Neuroscience 1985, 14, 753–763. [Google Scholar]
- Kalen, P.; Strecker, R.E.; Rosengren, E.; Bjorklund, A. Endogenous release of neuronal serotonin and 5-hydroxyindoleacetic acid in the caudate-putamen of the rat as revealed by intracerebral dialysis coupled to high performance liquid chromatography with fluorimetric detection. J. Neurochem. 1988, 51, 1422–1435. [Google Scholar]
- Zetterstrom, T.; Sharp, T.; Collin, A.K.; Ungerstedt, U. In vivo measurement of extracellular dopamine and DOPAC in rat striatum after various dopamine-releasing drugs; implications for the origin of extracellular DOPAC. Eur. J. Pharmacol. 1988, 148, 327–334. [Google Scholar]
- Adams, R.N. Carbon paste electrodes. Anal. Chem. 1958, 30, 1576. [Google Scholar]
- Kulys, J.; Gorton, L.; Dominguez, E.; Emneus, J.; Jarskog, H. Electrochemical characterization of carbon pastes modified with proteins and polycations. J. Electroanal. Chem. 1994, 372, 49–55. [Google Scholar]
- Kalcher, K. Chemically modified carbon paste electrodes in voltammetric analysis. Electroanalysis 1990, 2, 419–433. [Google Scholar]
- Svancara, I.; Vytras, K.I.; Barek, J.; Zima, J. Carbon paste electrodes in modern electroanalysis. Crit. Rev. Anal. Chem. 2001, 31, 311–345. [Google Scholar]
- Tomcik, P.; Banks, C.E.; Davies, T.J.; Compton, R.G. A self-catalytic carbon paste electrode for the detection of vitamin B-12. Anal. Chem. 2004, 76, 161–165. [Google Scholar]
- Wang, J.; Chen, L.; Liu, J. Critical comparison of metallized and mediator-based carbon paste glucose biosensors. Electroanalysis 1997, 9, 298–301. [Google Scholar]
- Zima, J.; Barek, J.; Muck, A. Monitoring of environmentally and biologically important organic substances at carbon paste electrodes. Rev. Chim. 2004, 55, 657–661. [Google Scholar]
- Hanrahan, G.; Patil, D.G.; Wang, J. Electrochemical sensors for environmental monitoring: design, development and applications. J. Environ. Monit. 2004, 6, 657–664. [Google Scholar]
- El Maali, N.A. Voltammetric analysis of drugs. Bioelectrochemistry 2004, 64, 99–107. [Google Scholar]
- Radi, A.; Wassel, A.A.; El Ries, M.A. Adsorptive behaviour and voltammetric analysis of propranolol at carbon paste electrode. Chem. Anal. 2004, 49, 51–58. [Google Scholar]
- Farghaly, O.A.; Mohamed, N.A.L. Voltammetric determination of azithromycin at the carbon paste electrode. Talanta 2004, 62, 531–538. [Google Scholar]
- Li, J.N.; Liu, S.M.; Mao, X.; Gao, P.; Yan, Z.H. Trace determination of rare earths by adsorption voltammetry at a carbon paste electrode. J. Electroanal. Chem. 2004, 561, 137–142. [Google Scholar]
- Ferancova, A.; Korgova, E.; Labuda, J.; Zima, J.; Barek, J. Cyclodextrin modified carbon paste based electrodes as sensors for the determination of carcinogenic polycyclic aromatic amines. Electroanalysis 2002, 14, 1668–1673. [Google Scholar]
- Wang, J.; Zhang, X.J.; Prakash, M. Glucose microsensors based on carbon paste enzyme electrodes modified with cupric hexacyanoferrate. Anal. Chim. Acta 1999, 395, 11–16. [Google Scholar]
- Kulys, J. The carbon paste electrode encrusted with a microreactor as glucose biosensor. Biosens. Bioelectron. 1999, 14, 473–479. [Google Scholar]
- Miscoria, S.A.; Barrera, G.D.; Rivas, G.A. Analytical performance of a glucose biosensor prepared by immobilization of glucose oxidase and different metals into a carbon paste electrode. Electroanalysis 2002, 14, 981–987. [Google Scholar]
- Vidal, J.C.; Garcia, E.; Mendez, S.; Yarnoz, P.; Castillo, J.R. Three approaches to the development of selective bilayer amperometric biosensors for glucose by in situ electropolymerization. Analyst 1999, 124, 319–324. [Google Scholar]
- Rajendran, V.; Csoregi, E.; Okamoto, Y.; Gorton, L. Amperometric peroxide sensor based on horseradish peroxidase and toluidine blue o-acrylamide polymer in carbon paste. Anal. Chim. Acta 1998, 373, 241–251. [Google Scholar]
- Diego, E.; Agui, L.; Gonzalez-Cortes, A.; Yanezsedeno, P.; Pingarron, J.M.; Kauffmann, J.M. Critical comparison of paraffin carbon paste and graphite-poly(tetrafluorethylene) composite electrodes concerning the electroanalytical behavior of various antioxidants of different hydrophobicity. Electroanalysis 1998, 10, 33–38. [Google Scholar]
- Brainina, K.Z.; Malakhova, N.A.; Stojko, N.Y. Stripping voltammetry in environmental and food analysis. Fresenius J. Anal. Chem. 2000, 368, 307–325. [Google Scholar]
- O'Neill, R.D.; Grunewald, R.A.; Fillenz, M.; Albery, W.J. Linear sweep voltammetry with carbon paste electrodes in the rat striatum. Neuroscience 1982, 7, 1945–1954. [Google Scholar]
- Lane, R.F.; Hubbard, A.T.; Blaha, C.D. Application of semi-derivative electroanalysis to studies of neurotransmitters in the central nervous system. J. Electroanal. Chem. 1979, 95, 117–122. [Google Scholar]
- O'Neill, R.D.; Fillenz, M.; Albery, W.J.; Goddard, N.J. The monitoring of ascorbate and monoamine transmitter metabolites in the striatum of unanaesthetised rats using microprocessor-based voltammetry. Neuroscience 1983, 9, 87–93. [Google Scholar]
- O'Neill, R.D.; Fillenz, M.; Albery, W.J. The development of linear sweep voltammetry with carbon paste electrodes in vivo. J. Neurosci. Methods 1983, 8, 263–273. [Google Scholar]
- Duff, A.; O'Neill, R.D. The importance of probe size in monitoring neurochemical signals in behaving animals. Behav. Brain Res. 1995, 71, 41–42. [Google Scholar]
- Duff, A.; O'Neill, R.D. Effect of probe size on the concentration of brain extracellular uric acid monitored with carbon paste electrodes. J. Neurochem. 1994, 62, 1496–1502. [Google Scholar]
- O'Neill, R.D.; Gonzalez-Mora, J.L.; Boutelle, M.G.; Ormonde, D.E.; Lowry, J.P.; Duff, A.; Fumero, B.; Fillenz, M.; Mas, M. Anomalously high concentrations of brain extracellular uric acid detected with chronically implanted probes: implications for in vivo sampling techniques. J. Neurochem. 1991, 57, 22–29. [Google Scholar]
- O'Neill, R.D.; Lowry, J.P. On the significance of brain extracellular uric acid detected with in-vivo monitoring techniques: A review. Behav. Brain Res. 1995, 71, 33–49. [Google Scholar]
- Cheng, H.Y. Compartment model for chronoamperometric measurement in vivo. J. Electroanal. Chem. 1982, 135, 145–151. [Google Scholar]
- Albery, W.J.; Fillenz, M.; O'Neill, R.D. The compartment model for chronically implanted voltammetric electrodes in the rat brain. Neurosci. Lett. 1983, 38, 175–180. [Google Scholar]
- Joseph, M.H.; Hodges, H.; Gray, J.A. Lever pressing for food reward and in vivo voltammetry: evidence for increases in extracellular homovanillic acid, the dopamine metabolite, and uric acid in the rat caudate nucleus. Neuroscience 1989, 32, 195–201. [Google Scholar]
- O'Neill, R.D.; Fillenz, M.; Grunewald, R.A.; Bloomfield, M.R.; Albery, W.J.; Jamieson, C.M.; Williams, J.H.; Gray, J.A. Voltammetric carbon paste electrodes monitor uric acid and not 5HIAA at the 5-hydroxyindole potential in the rat brain. Neurosci. Lett. 1984, 45, 39–46. [Google Scholar]
- Mueller, K.; Palmour, R.; Andrews, C.D.; Knott, P.J. In vivo voltammetric evidence of production of uric acid by rat caudate. Brain Res. 1985, 335, 231–235. [Google Scholar]
- Boutelle, M.G.; Svensson, L.; Fillenz, M. Rapid changes in striatal ascorbate in response to tail-pinch monitored by constant potential voltammetry. Neuroscience 1989, 30, 11–17. [Google Scholar]
- O'Neill, R.D.; Grunewald, R.A.; Fillenz, M.; Albery, W.J. The effect of unilateral cortical lesions on the circadian changes in rat striatal ascorbate and homovanillic acid levels measured in vivo using voltammetry. Neurosci. Lett. 1983, 42, 105–110. [Google Scholar]
- Joseph, M.H.; Young, A.M.J. Pharmacological evidence, using in vivo dialysis, that substances additional to ascorbic acid, uric acid and homovanillic acid contribute to the voltammetric signals obtained in unrestrained rats from chronically implanted carbon paste electrodes. J. Neurosci. Methods 1991, 36, 209–218. [Google Scholar]
- Slivka, A.; Brannan, T.S.; Weinberger, J.; Knott, P.J.; Cohen, G. Increase in extracellular dopamine in the striatum during cerebral ischemia: a study utilizing cerebral microdialysis. J. Neurochem. 1988, 50, 1714–1718. [Google Scholar]
- Vulto, A.G.; Sharp, T.; Ungerstedt, U.; Versteeg, D.H.G. Rapid postmortem increase in extracellular dopamine in the rat brain as assessed by brain microdialysis. J. Neurochem. 1988, 51, 746–749. [Google Scholar]
- Gonzalez-Mora, J.L.; Maidment, N.T.; Guadalupe, T.; Mas, M. Post-mortem dopamine dynamics assessed by voltammetry and microdialysis. Brain Res. Bull. 1989, 23, 323–327. [Google Scholar]
- Kawagoe, K.T.; Garris, P.A.; Wiedemann, D.J.; Wightman, R.M. Regulation of transient dopamine concentration gradients in the microenvironment surrounding nerve terminals in the rat striatum. Neuroscience 1992, 51, 55–64. [Google Scholar]
- Gonzalez-Mora, J.L.; Sanchez-Bruno, J.A.; Mas, M. Concurrent on-line analysis of striatal ascorbate, dopamine and dihydroxyphenylacetic acid concentrations by in vivo voltammetry. Neurosci. Lett. 1988, 86, 61–66. [Google Scholar]
- Church, W.H.; Justice, J.B., Jr. Rapid sampling and determination of extracellular dopamine in vivo. Anal. Chem. 1987, 59, 712–716. [Google Scholar]
- Rice, M.E.; Galus, Z.; Adams, R.N. Graphite paste electrodes. Effects of paste composition and surface states on electron transfer rates. J. Electroanal. Chem. 1983, 143, 89–102. [Google Scholar]
- Lyne, P.D.; O'Neill, R.D. Selectivity of stearate-modified carbon paste electrodes for dopamine and ascorbic acid. Anal. Chem. 1989, 61, 2323–2324. [Google Scholar]
- Blaha, C.D.; Jung, M.E. Electrochemical evaluation of stearate-modified graphite paste electrode: selective detection of dopamine is maintained after exposure to brain tissue. J. Electroanal. Chem. 1991, 310, 317–334. [Google Scholar]
- Ormonde, D.E.; O'Neill, R.D. Altered response of carbon paste electrodes after contact with brain tissue. Implications for modified electrode use in vivo. J. Electroanal. Chem. 1989, 261, 463–469. [Google Scholar]
- Albahadily, F.N.; Mottola, H.A. Improved rsponse of carbon-paste electrodes for electrochemical detection in flow systems by pretreatment with surfactants. Anal. Chem. 1987, 59, 958–962. [Google Scholar]
- Digua, K.; Kauffmann, J.M.; Delplancke, J.L. Surfactant modified carbon paste electrode. 1. Electrochemical and microscopic characterization. Electroanalysis 1994, 6, 451–458. [Google Scholar]
- Blaha, C.D.; Lane, R.F. Chemically modified electrode for in vivo monitoring of brain catecholamines. Brain Res. Bull. 1983, 10, 861–864. [Google Scholar]
- Broderick, P.A. State-of-the-art microelectrodes for in vivo voltammetry. Electroanalysis 1990, 2, 241–251. [Google Scholar]
- Clemens, J.A.; Phebus, L.A. Changes in brain chemistry produced by dopaminergic agents: in vivo electrochemical monitoring reveals opposite changes in anaesthetized vs unanaesthetized rats. Brain Res. 1983, 267, 183–186. [Google Scholar]
- Mueller, K.; Haskett, C. Effects of haloperidol on amphetamine-induced increases in ascorbic acid and uric acid as determined by voltammetry in vivo. Pharmacol. Biochem. Behav. 1987, 27, 231–234. [Google Scholar]
- Boutelle, M.G.; Svensson, L.; Fillenz, M. Effect of diazepam on behaviour and associated changes in ascorbate concentration in rat brain areas: striatum, n. accumbens and hippocampus. Psychopharmacology 1990, 100, 230–236. [Google Scholar]
- Mueller, K. Repeated administration of high doses of amphetamine increases release of ascorbic acid in caudate but not nucleus accumbens. Brain Res. 1989, 494, 30–35. [Google Scholar]
- Brazell, M.P.; Mitchell, S.N.; Joseph, M.H.; Gray, J.A. Acute administration of nicotine increases the in vivo extracellular levels of dopamine, 3,4-dihydroxyphenylacetic acid and ascorbic acid preferentially in the nucleus accumbens of the rat: Comparison with caudate-putamen. Neuropharmacology 1990, 29, 1177–1185. [Google Scholar]
- O'Neill, R.D.; Fillenz, M. Simultaneous monitoring of dopamine release in rat frontal cortex, nucleus accumbens and striatum: effect of drugs, circadian changes and correlations with motor activity. Neuroscience 1985, 16, 49–55. [Google Scholar]
- Mueller, K.; Kunko, P.M. The effects of amphetamine and pilocarpine on the release of ascorbic and uric acid in several rat brain areas. Pharmacol. Biochem. Behav. 1990, 35, 871–876. [Google Scholar]
- Haskett, C.; Mueller, K. The effects of serotonin depletion on the voltammetric response to amphetamine. Pharmacol. Biochem. Behav. 1987, 28, 381–384. [Google Scholar]
- O'Neill, R.D.; Fillenz, M.; Sundstrom, L.; Rawlins, J.N.P. Voltammetrically monitored brain ascorbate as an index of excitatory amino acid release in the unrestrained rat. Neurosci. Lett. 1984, 52, 227–233. [Google Scholar]
- Lowry, J.P.; Miele, M.; O'Neill, R.D.; Boutelle, M.G.; Fillenz, M. An amperometric glucose-oxidase/poly(o-phenylenediamine) biosensor for monitoring brain extracellular glucose: in vivo characterisation in the striatum of freely-moving rats. J. Neurosci. Methods 1998, 79, 65–74. [Google Scholar]
- Miele, M.; Fillenz, M. Changes in extracellular brain ascorbate in rat striatum in response to administration of non-volatile anaesthetic agents. Br. J. Anaesth. 1997, 78, 588–590. [Google Scholar]
- Lowry, J.P.; Boutelle, M.G.; O'Neill, R.D.; Fillenz, M. Characterization of carbon paste electrodes in vitro for simultaneous amperometric measurement of changes in oxygen and ascorbic acid concentrations in vivo. Analyst 1996, 121, 761–766. [Google Scholar]
- Miele, M.; Fillenz, M. In vivo determination of extracellular brain ascorbate. J. Neurosci. Methods 1996, 70, 15–19. [Google Scholar]
- Mueller, K. The effects of haloperidol and amphetamine on ascorbic acid and uric acid in caudate and nucleus accumbens of rats as measured by voltammetry in vivo. Life Sci. 1990, 47, 735–742. [Google Scholar]
- Brose, N.; O'Neill, R.D.; Boutelle, M.G.; Fillenz, M. The effects of anxiolytic and anxiogenic benzodiazepine receptor ligands on motor activity and levels of ascorbic acid in the nucleus accumbens and striatum of the rat. Neuropharmacology 1989, 28, 509–514. [Google Scholar]
- O'Neill, R.D.; Fillenz, M. Circadian changes in extracellular ascorbate in rat cortex, accumbens, striatum and hippocampus: correlations with motor activity. Neurosci. Lett. 1985, 60, 331–336. [Google Scholar]
- Rebec, G.V.; Witowski, S.R.; Sandstrom, M.I.; Rostand, R.D.; Kennedy, R.T. Extracellular ascorbate modulates cortically evoked glutamate dynamics in rat striatum. Neurosci. Lett. 2005, 378, 166–170. [Google Scholar]
- Song, J.H.; Shin, S.H.; Chung, M.I. Effects of glutamate on dehydroascorbate uptake and its enhanced vulnerability to the peroxidation in cerebral cortical slices. Exp. Mol. Med. 2002, 34, 419–425. [Google Scholar]
- Liu, J.; Wu, C.F.; Zhang, H.L.; Li, C.L. Involvement of the corticostriatal glutamatergic pathway in ethanol-induced ascorbic acid release in rat striatum. Addict. Biol. 1999, 4, 273–281. [Google Scholar]
- Enrico, P.; Mura, M.A.; Esposito, G.; Serra, P.; Migheli, R.; De Natale, G.; Desole, M.S.; Miele, M.; Miele, E. Effect of naloxone on morphine-induced changes in striatal dopamine metabolism and glutamate, ascorbic acid and uric acid release in freely moving rats. Brain Res. 1998, 797, 94–102. [Google Scholar]
- O'Neill, R.D. The measurement of brain ascorbate in vivo and its link with excitatory amino acid neurotransmission. In Voltammetric Methods in Brain Systems; Boulton, A.A., Baker, G.B., Adams, R.N., Eds.; Humana Press: New Jersey, 1995; pp. 221–268. [Google Scholar]
- Rebec, G.V.; Pierce, R.C. A vitamin as neuromodulator: Ascorbate release into the extracellular fluid of the brain regulates dopaminergic and glutamatergic transmission. Prog. Neurobiol. 1994, 43, 537–565. [Google Scholar]
- Grunewald, R.A. Ascorbic acid in the brain. Brain Res. Rev. 1993, 18, 123–133. [Google Scholar]
- Joseph, M.H.; Hodges, H. Lever pressing for food reward and changes in dopamine turnover and uric acid in rat caudate and nucleus accumbens studied chronically by in vivo voltammetry. J. Neurosci. Methods 1990, 34, 143–149. [Google Scholar]
- Joseph, M.H. Lever pressing for food reward and changes in dopamine turnover and uric acid in rat caudate and n. accumbens studied chronically by in vivo voltammetry. J. Neurosci. Methods 1989, 29, 276. [Google Scholar]
- Mueller, K. Voltammetric evidence in vivo of cholinergic modulation of extracellular ascorbic acid and uric acid in rat striatum. Brain Res. 1987, 408, 313–316. [Google Scholar]
- Lowry, J.P.; Boutelle, M.G.; Fillenz, M. Measurement of brain tissue oxygen at a carbon paste electrode can serve as an index of increases in regional cerebral blood flow. J. Neurosci. Methods 1997, 71, 177–182. [Google Scholar]
- Dixon, B.M.; Lowry, J.P.; O'Neill, R.D. Characterization in vitro and in vivo of the oxygen dependence of an enzyme/polymer biosensor for monitoring brain glucose. J. Neurosci. Methods 2002, 119, 135–142. [Google Scholar]
- Lowry, J.P.; Fillenz, M. Real-time monitoring of brain energy metabolism in vivo using microelectrochemical sensors: the effects of anesthesia. Bioelectrochemistry 2001, 54, 39–47. [Google Scholar]
- Gonon, F.; Buda, M.; Cespuglio, R.; Jouvet, M.; Pujol, J.F. In vivo electrical detection of catechols in the rat neostriatum: dopamine or DOPAC? Nature 1980, 286, 902–904. [Google Scholar]
- Gonon, F.; Buda, M.; Cespuglio, R.; Jouvet, M.; Pujol, J.F. Voltammetry in the striatum of chronic freely moving rats: detection of catechols and ascorbic acid. Brain Res. 1981, 223, 69–80. [Google Scholar]
- Marcenac, F.; Gonon, F. Fast in vivo monitoring of dopamine release in the rat brain with differential pulse amperometry. Anal. Chem. 1985, 57, 1778–1779. [Google Scholar]
- Oh, C.; Gardiner, T.W.; Rebec, G.V. Blockade of both D1- and D2-dopamine receptors inhibits amphetamine-induced ascorbate release in the neostriatum. Brain Res. 1989, 480, 184–189. [Google Scholar]
- Cahill, P.S.; Wightman, R.M. Simultaneous amperometric measurement of ascorbate and catecholamine secretion from individual bovine adrenal medullary cells. Anal. Chem. 1995, 67, 2599–2605. [Google Scholar]
- Mas, M.; Gonzalez-Mora, J.L.; Louilot, A.; Sole, C.; Guadalupe, T. Increased dopamine release in the nucleus accumbens of copulating male rats as evidenced by in vivo voltammetry. Neurosci. Lett. 1990, 110, 303–308. [Google Scholar]
- Venton, B.J.; Wightman, R.M. Psychoanalytical electrochemistry: Dopamine and behavior. Anal. Chem. 2003, 75, 414A–421A. [Google Scholar]
- Yavich, L.; Tiihonen, J. In vivo voltammetry with removable carbon fibre electrodes in freely-moving mice: dopamine release during intracranial self-stimulation. J. Neurosci. Methods 2000, 104, 55–63. [Google Scholar]
- Rebec, G.V.; Langley, P.E.; Pierce, R.C.; Wang, Z.; Heidenreich, B.A. A simple micromanipulator for multiple uses in freely moving rats: Electrophysiology, voltammetry, and simultaneous intracerebral infusions. J. Neurosci. Methods 1993, 47, 53–59. [Google Scholar]
- Yavich, L.; Tiihonen, J. Patterns of dopamine overflow in mouse nucleus accumbens during intracranial self-stimulation. Neurosci. Lett. 2000, 293, 41–44. [Google Scholar]
- Lane, R.F.; Hubbard, A.T.; Blaha, C.D. Brain dopaminergic neurons: in vivo electrochemical information concerning storage, metabolism and release processes. Bioelectrochem. Bioenerg. 1978, 5, 504–525. [Google Scholar]
- Brose, N.; O'Neill, R.D.; Boutelle, M.G.; Anderson, S.M.P.; Fillenz, M. Effects of an anxiogenic benzodiazepine receptor ligand on rat motor activity and dopamine release in nucleus accumbens and striatum. J. Neurosci. 1987, 7, 2917–2926. [Google Scholar]
- Brose, N.; O'Neill, R.D.; Boutelle, M.G.; Fillenz, M. Dopamine in the basal ganglia and benzodiazepine-induced sedation. Neuropharmacology 1988, 27, 589–595. [Google Scholar]
- Fillenz, M.; O'Neill, R.D. Differences in feed-back regulation of dopamine release in the striatum and frontal cortex in the rat. J. Physiol. (London) 1983, 349, 11P. [Google Scholar]
- Ungerstedt, U.; Butcher, L.L.; Butcher, S.G.; Anden, N.E.; Fuxe, K. Direct chemical stimulation of dopaminergic mechanisms in the neostriatum of the rat. Brain Res. 1969, 14, 461–471. [Google Scholar]
- Kelly, P.H.; Seviour, P.W.; Iversen, S.D. Amphetamine and apomorphine responses in the rat following 6OHDA lesions of the nucleus accumbens septi and corpus striatum. Brain Res. 1975, 94, 507–522. [Google Scholar]
- Costall, B.; Naylor, R.J.; Nohria, V. Hyperactivity response to apomorphine and amphetamine in the mouse: the importance of the nucleus accumbens and caudate-putamen. J. Pharm. Pharmacol. 1979, 31, 259–261. [Google Scholar]
- Iversen, S.D.; Wilkinson, S.; Simpson, B. Enhanced amphetamine responses after frontal cortex lesions in the rat. Eur. J. Pharmacol. 1971, 13, 387–390. [Google Scholar]
- Pijnenburg, A.J.J.; Woodruff, G.N.; Van Rossum, J.M. Ergometrine induced locomotor activity following intracerebral injection into the nucleus accumbens. Brain Res. 1973, 59, 289–302. [Google Scholar]
- Andrews, D.W.; Patrick, K.L.; Barchas, J.D. The effects of 5-HTP and 5-HT on dopamine release and synthesis in rat brain striatal synaptosomes. J. Neurochem. 1978, 30, 465–470. [Google Scholar]
- De Belleroche, J.S.; Bradford, H.T. Presynaptic control of the synthesis and release of dopamine from striatal synaptosomes: a comparison between the effects of 5-hydroxytryptamine, acetylcholine and glutamate. J. Neurochem. 1980, 35, 1227–1234. [Google Scholar]
- Westerink, B.H.C.; Damsma, G.; Rollema, H.; de Vries, J.B.; Horn, A.S. Scope and limitations of in vivo brain dialysis: a comparison of its application to various neurotransmitter systems. Life Sci. 1987, 41, 1763–1776. [Google Scholar]
- Benveniste, H.; Huettemeier, P.C. Microdialysis - Theory and application. Prog. Neurobiol. 1990, 35, 195–215. [Google Scholar]
- Di Chiara, G. Brain dialysis of neurotransmitters: A commentary. J. Neurosci. Methods 1990, 34, 29–34. [Google Scholar]
- Hamberger, A.; Jacobson, I.; Nystroem, B.; Sandberg, M. Microdialysis sampling of the neuronal environment in basic and clinical research. J. Intern. Med. 1991, 230, 375–380. [Google Scholar]
- Loennroth, P. Microdialysis - A new and promising method in clinical medicine. J. Intern. Med. 1991, 230, 363–364. [Google Scholar]
- Ungerstedt, U. Microdialysis - Principles and applications for studies in animals and man. J. Intern. Med. 1991, 230, 365–373. [Google Scholar]
- Justice, J.B., Jr. Quantitative microdialysis of neurotransmitters. J. Neurosci. Methods 1993, 48, 263–276. [Google Scholar]
- Robinson, J.E. Microdialysis: A novel tool for research in the reproductive system. Biol. Reprod. 1995, 52, 237–245. [Google Scholar]
- Timmerman, W.; Westerink, B.H.C. Brain microdialysis of GABA and glutamate: What does it signify? Synapse 1997, 27, 242–261. [Google Scholar]
- Mas, M.; Gonzalez-Mora, J.L.; Hernandez, L. In vivo monitoring of brain neurotransmitter release for the assessment of neuroendocrine interactions. Cell. Mol. Neurobiol. 1996, 16, 383–396. [Google Scholar]
- Fumero, B.; Guadalupe, T.; Valladares, F.; Mora, F.; O'Neill, R.D.; Mas, M.; Gonzalez-Mora, J.L. Fixed versus removable microdialysis probes for in vivo neurochemical analysis: Implications for behavioral studies. J. Neurochem. 1994, 63, 1407–1415. [Google Scholar]
- Peters, J.L.; Yang, H.; Michael, A.C. Quantitative aspects of brain microdialysis. Anal. Chim. Acta 2000, 412, 1–12. [Google Scholar]
- Davies, M.I. A review of microdialysis sampling for pharmacokinetic applications. Anal. Chim. Acta 1999, 379, 227–249. [Google Scholar]
- Stenken, J.A. Methods and issues in microdialysis calibration. Anal. Chim. Acta 1999, 379, 337–358. [Google Scholar]
- O'Neill, R.D.; Lowry, J.P. Encyclopedia of Analytical Chemistry; Meyers, R., Ed.; John Wiley & Sons Ltd.: Chichester, 2000; pp. 676–709. [Google Scholar]
- Wilson, G.S.; Hu, Y.B. Enzyme based biosensors for in vivo measurements. Chem. Rev. 2000, 100, 2693–2704. [Google Scholar]
- Koepp, M.J.; Gunn, R.N.; Lawrence, A.D.; Cunningham, V.J.; Dagher, A.; Jones, T.; Brooks, D.J.; Bench, C.J.; Grasby, P.M. Evidence for striatal dopamine release during a video game. Nature 1998, 393, 266–268. [Google Scholar]
- Freed, C.R.; Yamamoto, B.K. Regional brain dopamine metabolism: A marker for the speed, direction and posture of moving animals. Science 1985, 229, 62–65. [Google Scholar]
- Fillenz, M.; O'Neill, R.D. Effects of light reversal on the circadian pattern of motor activity and voltammetric signals recorded in rat forebrain. J. Physiol. (London) 1986, 374, 91–101. [Google Scholar]
- Walsh, J.K. Pharmacologic management of insomnia. J. Clin. Psychiat. 2004, 65, 41–45. [Google Scholar]


© 2005 by MDPI ( http://www.mdpi.org). Reproduction is permitted for noncommercial purposes.
Share and Cite
O’Neill, R.D. Long-Term Monitoring of Brain Dopamine Metabolism In Vivo with Carbon Paste Electrodes. Sensors 2005, 5, 317-342. https://doi.org/10.3390/s5060317
O’Neill RD. Long-Term Monitoring of Brain Dopamine Metabolism In Vivo with Carbon Paste Electrodes. Sensors. 2005; 5(6):317-342. https://doi.org/10.3390/s5060317
Chicago/Turabian StyleO’Neill, Robert D. 2005. "Long-Term Monitoring of Brain Dopamine Metabolism In Vivo with Carbon Paste Electrodes" Sensors 5, no. 6: 317-342. https://doi.org/10.3390/s5060317
APA StyleO’Neill, R. D. (2005). Long-Term Monitoring of Brain Dopamine Metabolism In Vivo with Carbon Paste Electrodes. Sensors, 5(6), 317-342. https://doi.org/10.3390/s5060317