Article

Multivariate Timing and Granger Causality Analysis of Spontaneous Facial Mimicry in Response to Android Dynamic Facial Expressions

1
Psychological Process Research Team, Guardian Robot Project, RIKEN, Soraku-gun, Kyoto 619-0288, Japan
2
Division of Psychology and Language Sciences, University College London, London WC1H 0AP, UK
3
Graduate School of Informatics, Kyoto University, Yoshida-Honmachi, Sakyo, Kyoto 606-8501, Japan
4
Interactive Robot Research Team, Guardian Robot Project, RIKEN, Soraku-gun, Kyoto 619-0288, Japan
*
Authors to whom correspondence should be addressed.
Sensors 2026, 26(6), 1881; https://doi.org/10.3390/s26061881
Submission received: 28 January 2026 / Revised: 11 March 2026 / Accepted: 15 March 2026 / Published: 17 March 2026

Abstract

Although evidence exists for android-induced spontaneous facial mimicry, the timing and temporal precedence (Granger causality) of this effect remain uncertain. We used the Facial Action Coding System (FACS) to analyze simultaneous dyadic facial video recordings of participants observing android Nikola’s negative (frowning) and positive (smiling) dynamic facial expressions. Principal component analysis of Nikola’s expressions indicated that, in addition to the action units (AUs) 04 (brow lowerer) and 12 (lip-corner puller), AUs 25 (lips part) and 26 (jaw drop) contributed significantly to Nikola’s facial expressions. Cross-correlation analysis revealed AU04 mimicry of negative expressions and AU12 mimicry of positive expressions from 400 ms onwards. AU25 and AU26 mimicry occurred faster, starting at around 200 ms. Multilevel vector autoregression incorporated the android and participant AUs and quantified the temporal evolution of the Granger causality for the first time. In addition to paired android–human AU04, 12, 25, and 26 effects, significant Granger causality was found between different android–human AU combinations, such as from android AU04 to participant AU25 in the negative condition, and from android AU25 to participant AU12 in the positive condition. These results suggest that the spontaneous facial responses to Nikola’s expressions involved not only motor copying, but also higher-level goal emulation and motor planning in the mirror mechanism, supporting the reliability of the social function of android facial expressions. Cross-correlation and Granger causality analysis can be valuable when further investigating behavioral matching in real-life contexts.

1. Introduction

Spontaneous facial mimicry is a form of behavior matching [1] that commonly occurs during face observation and facilitates emotion contagion [2] and affective empathy [3,4]. Advances in robotics have enabled androids to produce human-like facial expressions [5,6]. Previous studies have demonstrated that humans can respond to an android’s facial expressions with spontaneous facial mimicry [6,7]. Classical approaches have relied on facial electromyography (EMG) to record muscle activation patterns that resemble presented facial stimuli [8,9,10,11,12]. Alternatively, facial action patterns of participants on video recordings have been manually or automatically coded to detect mimicry using the Facial Action Coding System (FACS) [13,14,15,16,17,18], which analyzes facial movements in terms of anatomically based action units (AUs) [19,20,21] and was designed for manual coding by human observers. Over the past decade, advances in computer vision and machine learning have enabled automated FACS coding.
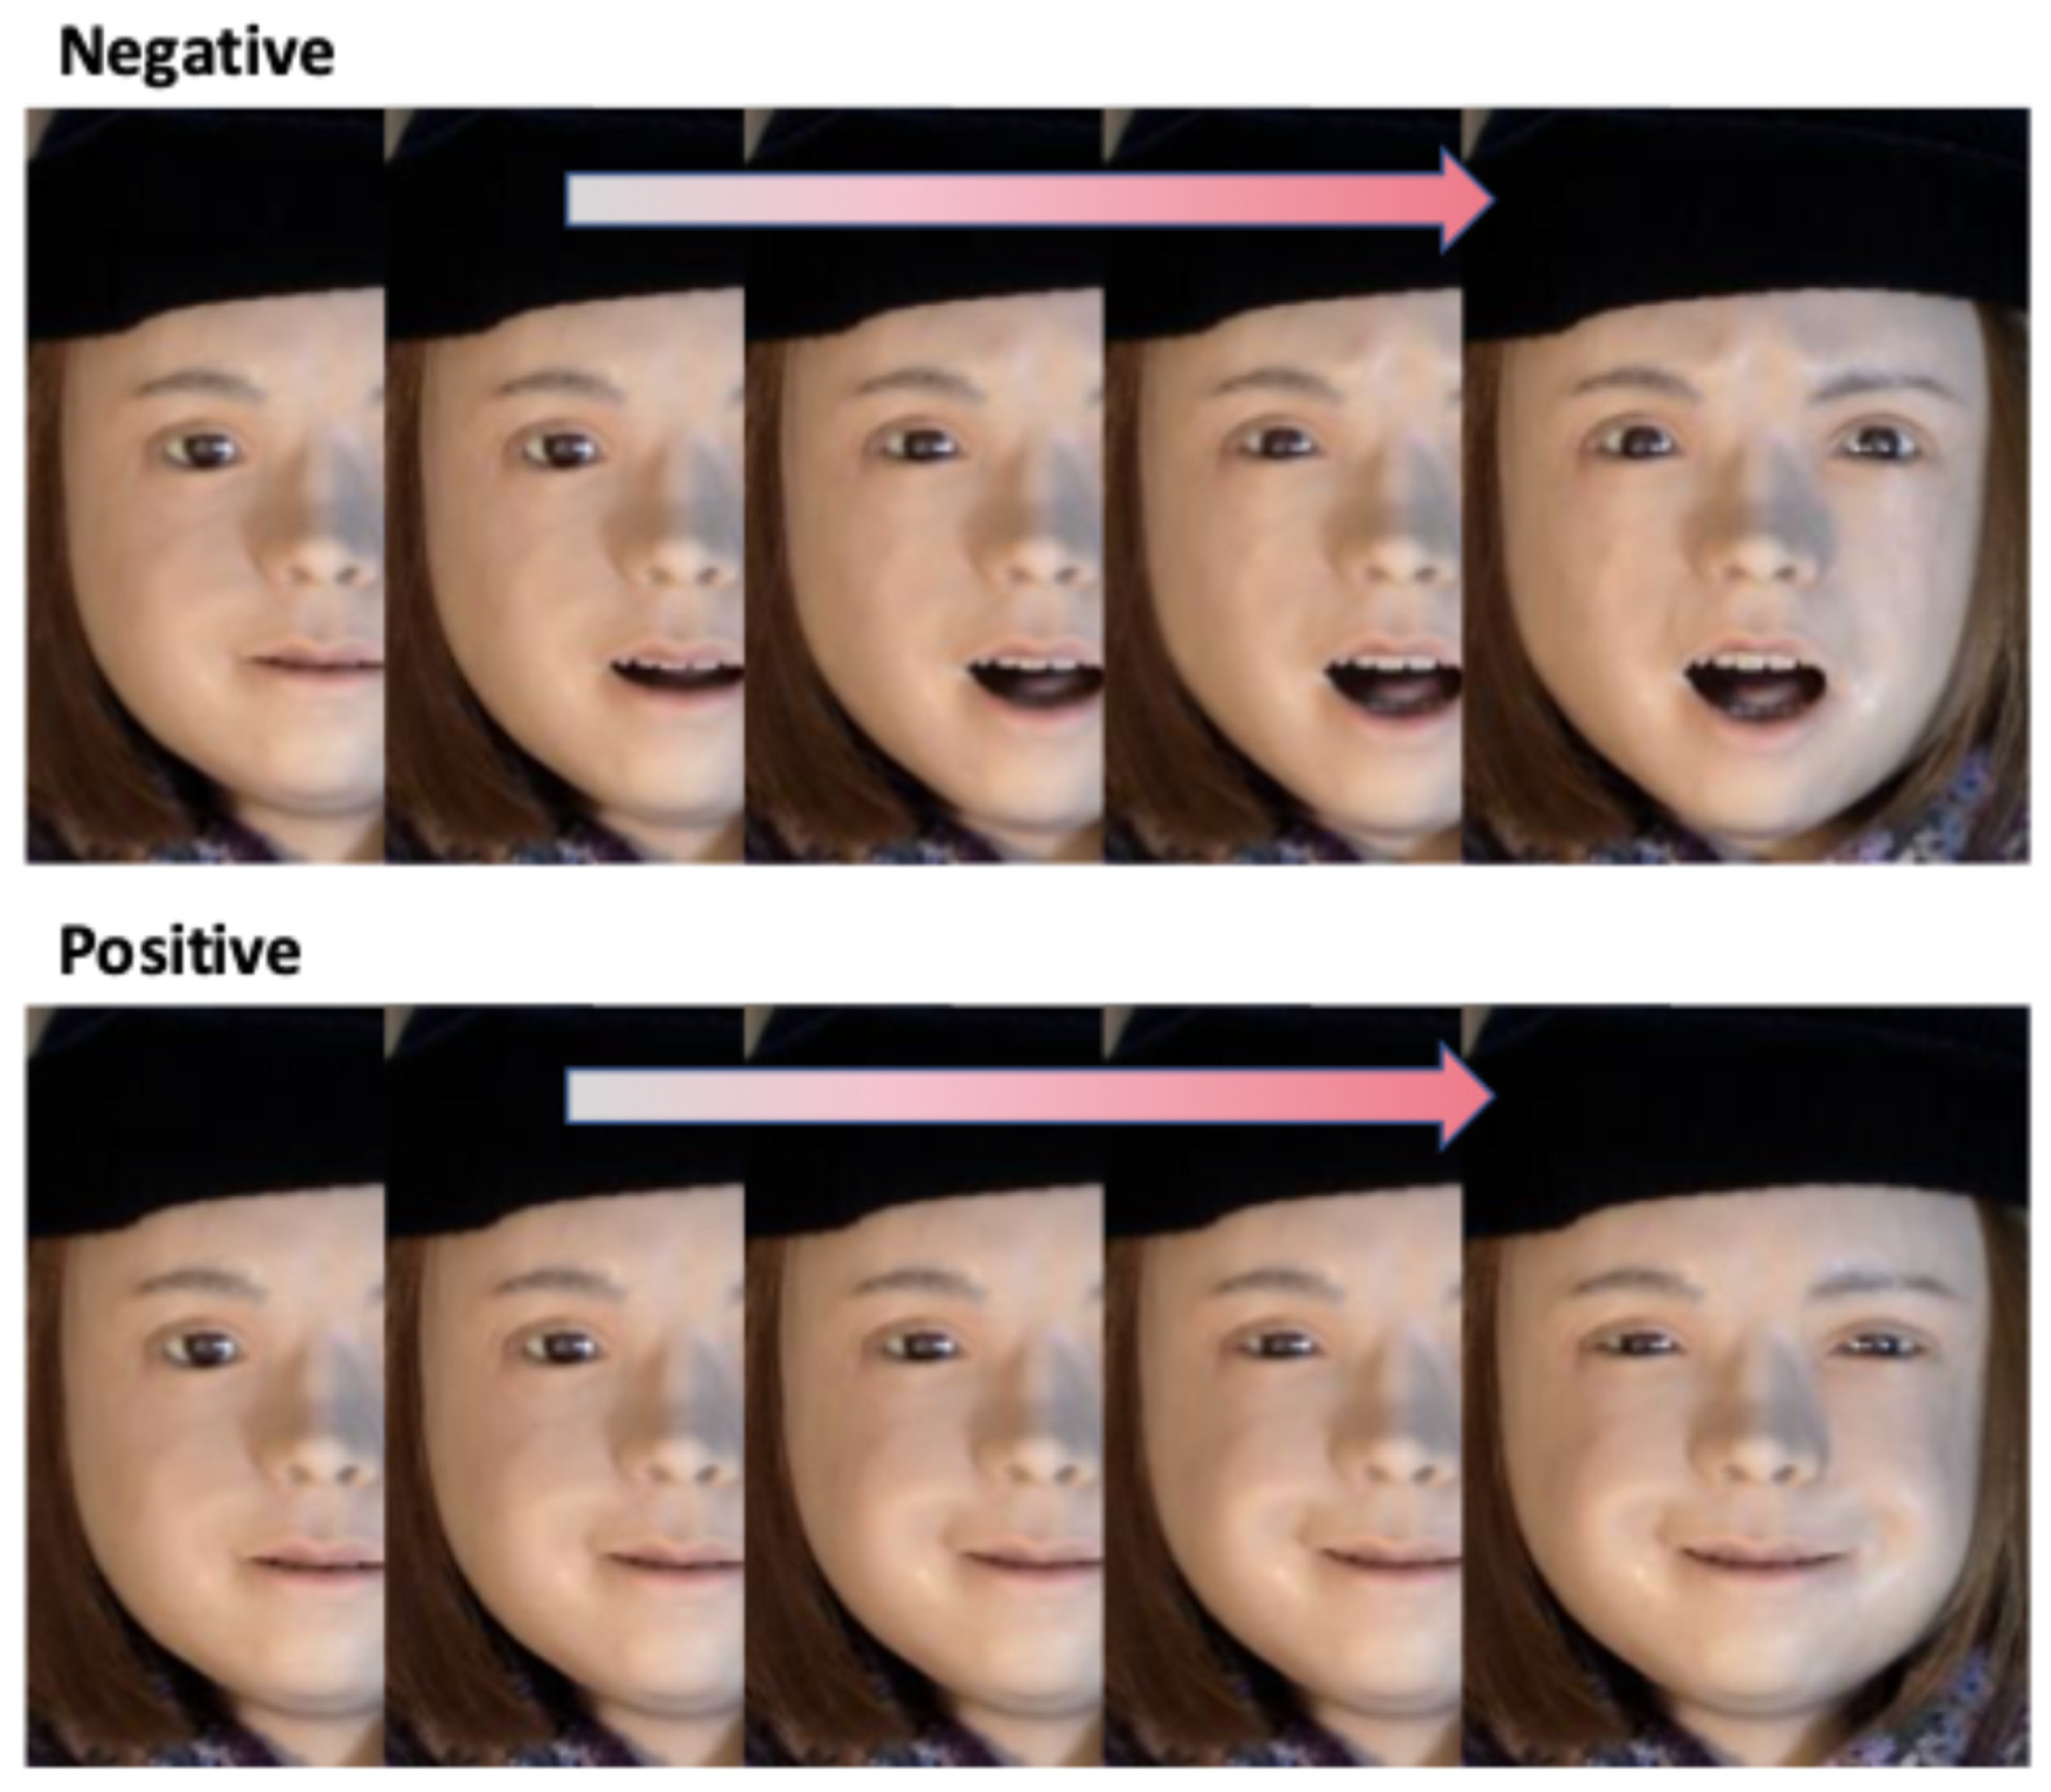
In a recent study [7], we presented participants with live performances of positive (smile) and negative (frown) dynamic facial expressions by the android Nikola (Figure 1 and Figure 2), which features 29 pneumatic actuators for facial actions and produces validated, human-like emotional facial expressions [5]. Participants’ corrugator supercilii and zygomaticus major EMG activity were recorded, and their faces were simultaneously videotaped. Nikola’s frowning expressions (negative condition) elicited stronger corrugator supercilii activity in the EMG data and increased brow-lowering (AU04, Figure 3) in the video recordings, whereas smiling expressions (positive condition) elicited stronger zygomaticus major activity and greater lip-corner puller activation (AU12, Figure 3). Both EMG and automated FACS analysis using Py-feat [22] previously confirmed participants’ spontaneous facial mimicry of the android’s dynamic facial expressions [7].
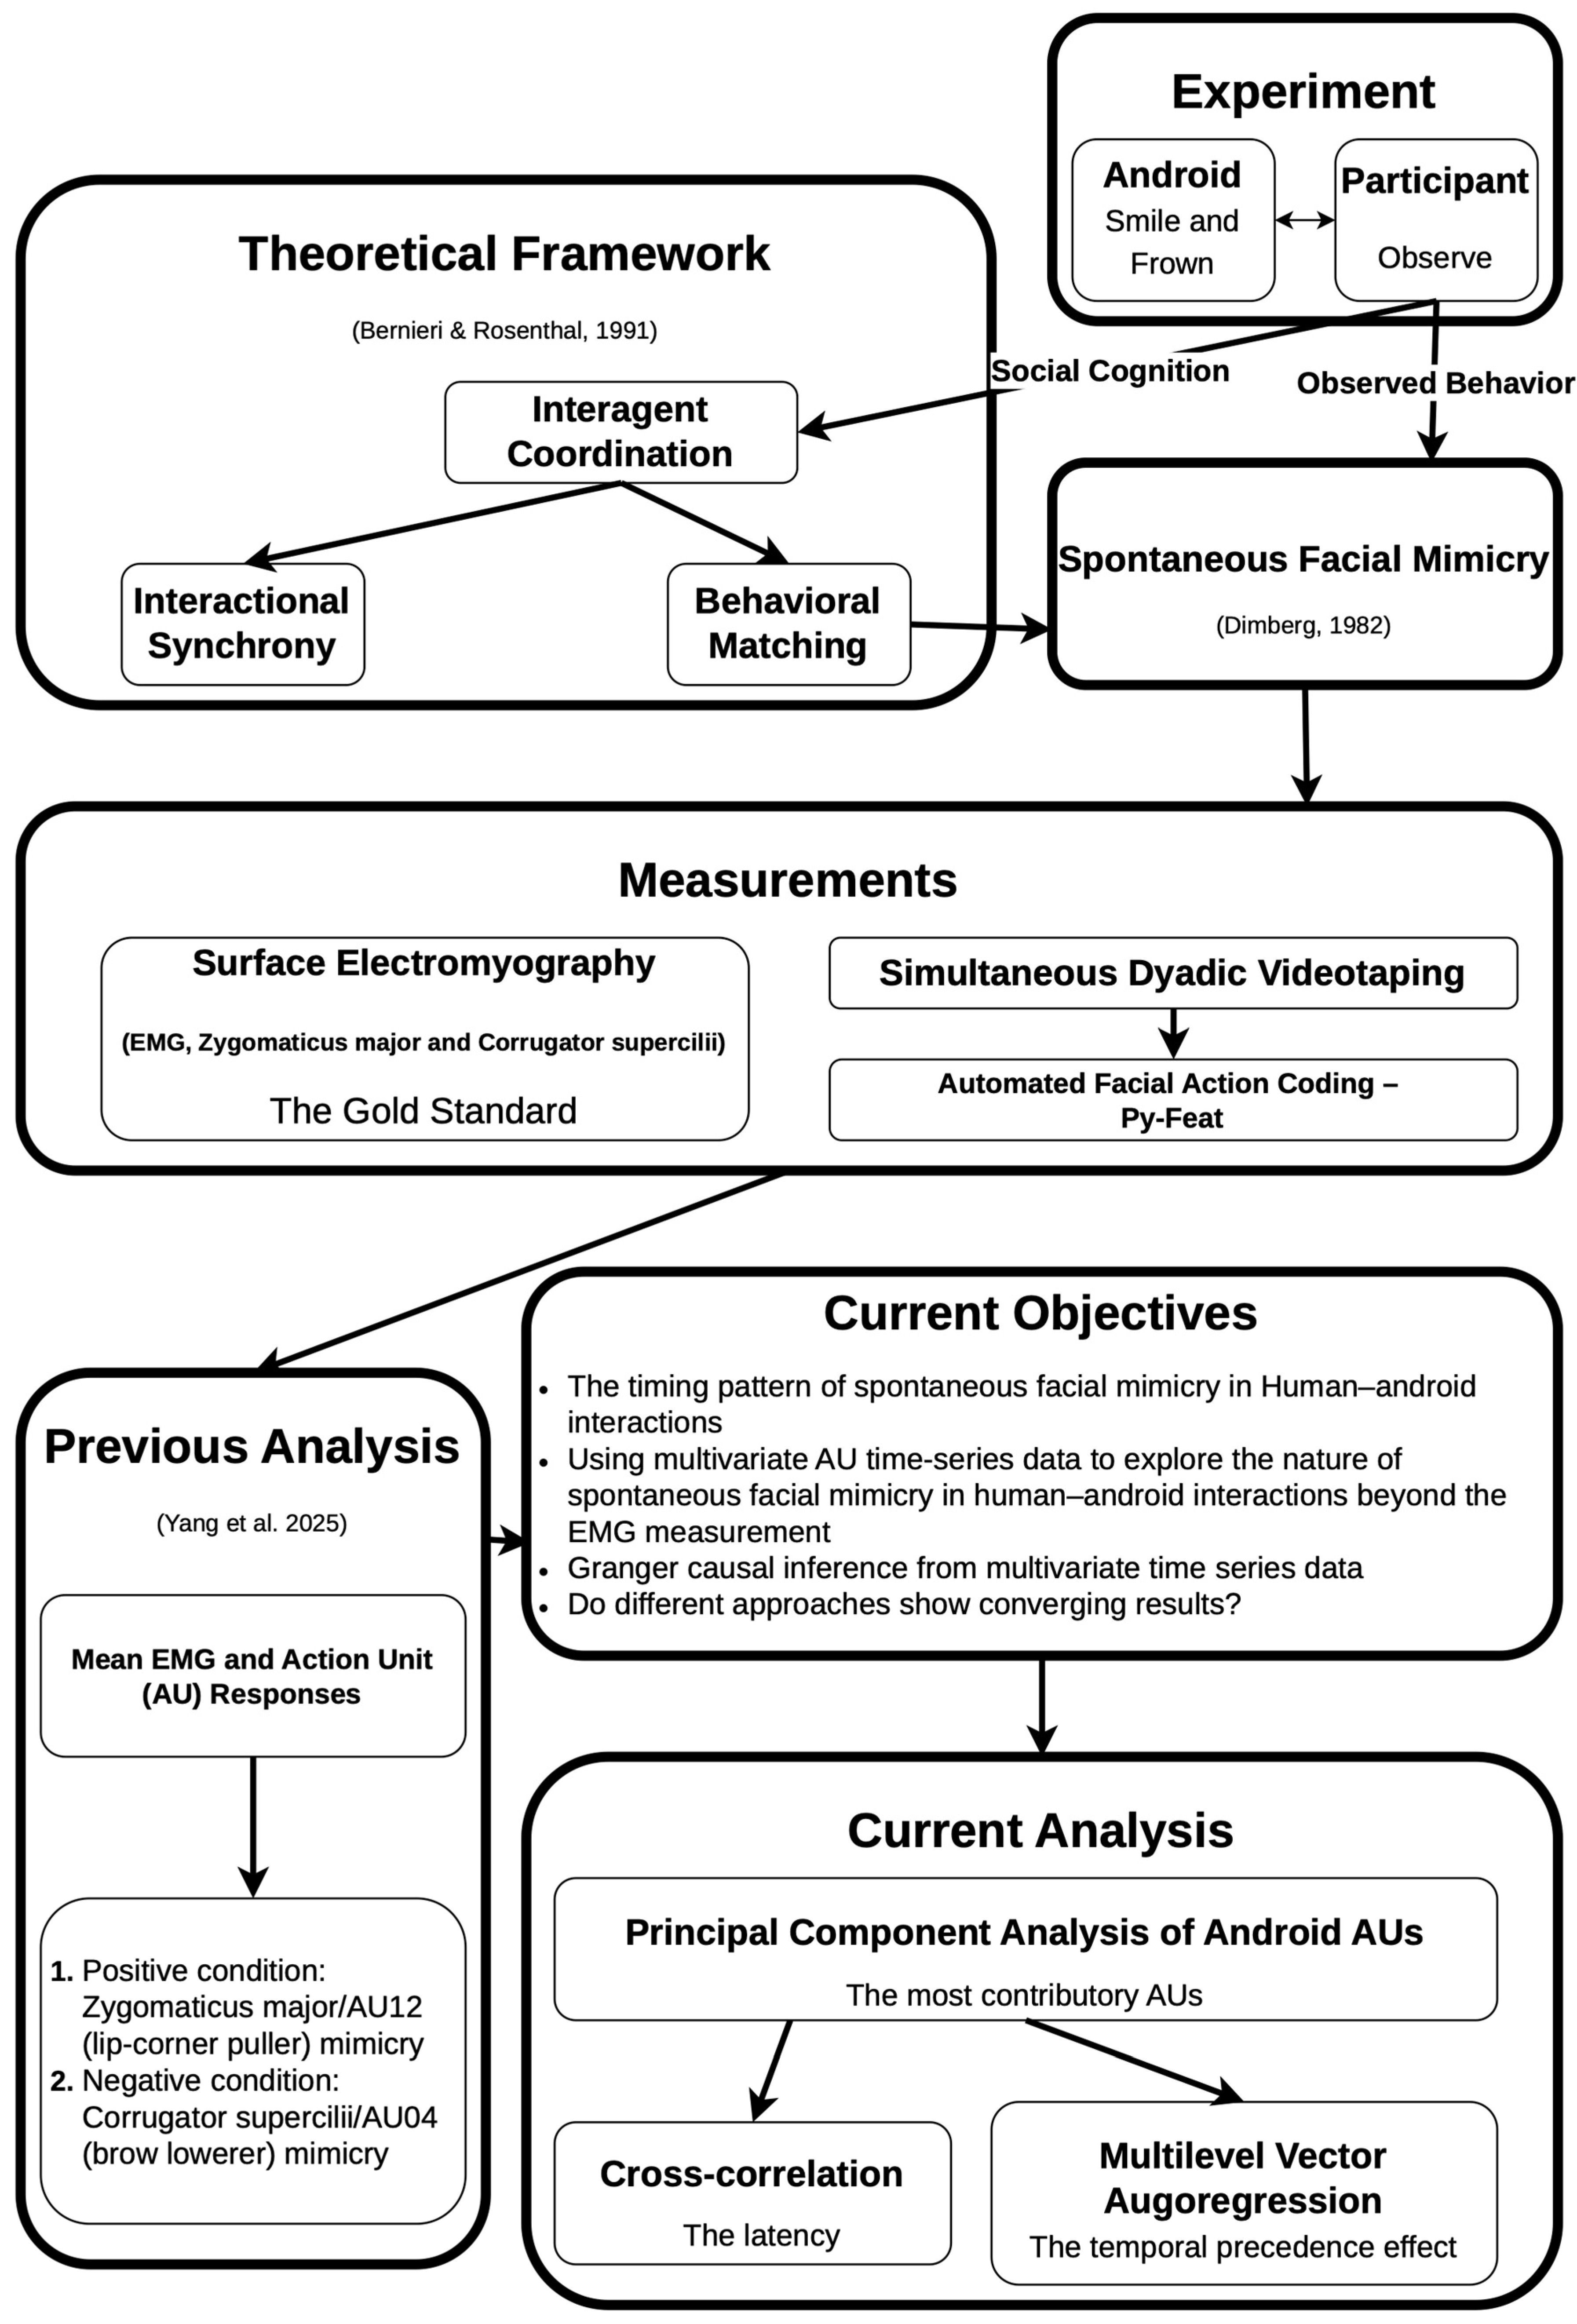
However, our previous study [7] had several limitations. First, the univariate peak-level statistics used did not account for the temporal dynamics of spontaneous facial mimicry. Second, facial mimicry involving AUs other than AU04 and AU12 was not evaluated. Third, the inference that Nikola induced participants’ spontaneous facial mimicry relied on the experimental design and prior knowledge that participants viewed Nikola’s dynamic facial expressions, whereas Nikola’s facial movements were determined solely by predefined actuator motions. Therefore, statistical evidence directly supporting a causal relationship between Nikola’s and participants’ facial expressions was lacking. Therefore, the objectives of the current study were: (1) to use multivariate time-series data and statistics to explore the nature of spontaneous facial mimicry beyond zygomaticus major/AU12 and corrugator supercilii/AU04 customarily measured in previous studies; (2) to determine the temporal latency of spontaneous facial mimicry elicited by the android Nikola; (3) to determine whether Granger causality could be assessed based on a temporal precedence effect of the mimickee (Nikola) on the mimickers (participants) during spontaneous facial mimicry; (4) to examine whether use of different statistical algorithms (participant muscular responses, time-series cross-correlations, and vector autoregression [VAR]) to evaluate the time-series data would yield converging results, e.g., whether the temporal precedence effect could be found at the lag with the maximal cross-correlation coefficient. For an overview of the theoretical and analytical frameworks of this study, please refer to Figure 1.
Univariate statistics, such as peak-level measures or cross-correlation analysis [17,23,24], are typically applied, as in the above-cited study, because EMG is usually recorded from only two or three muscles. Conversely, current automated FACS estimation from video data can simultaneously evaluate approximately 20 AUs, enabling the application of multivariate time-series statistics to detect behavioral matching [18,25,26]. However, most multivariate approaches are correlational in nature and do not provide evidence for causal inference. A notable exception is multivariate Granger causality, which is grounded in the principle of temporal precedence. In the context of multivariate Granger causality, given time series X, Y, and Z (with Z potentially comprising multiple time series), if the present X is predictive of the future of Y beyond the degree to which Y and Z already predict the future of Y, X is said to Granger cause Y [27,28,29]. Moreover, Granger causality has been applied in studies of interpersonal coordination [30,31,32]; however, it has not been applied specifically to facial mimicry. Several statistical frameworks are available to test Granger causality, most commonly VAR, which relies on three key assumptions: continuous-valued series, linear data-generating processes and causal effects, and discrete, regularly sampled data [33].
In the current study, we used Py-feat [22] to analyze video data from participants and the android. We derived trial-wise dyadic facial action time series. In each trial, the android’s face was presented to the participant for 3 s. We analyzed 105 frames per trial, corresponding to 3.5 s at 30 frames per second, to capture delayed responses in participants’ facial mimicry. Py-feat estimated AU time series are finite time series with continuous values and a regular sampling frequency, fulfilling two of the abovementioned assumptions about VAR—continuous-valued series of regularly sampled data. Multivariate VAR models can substantially increase the number of parameters to be estimated, depending on the numbers of time series and lags included.
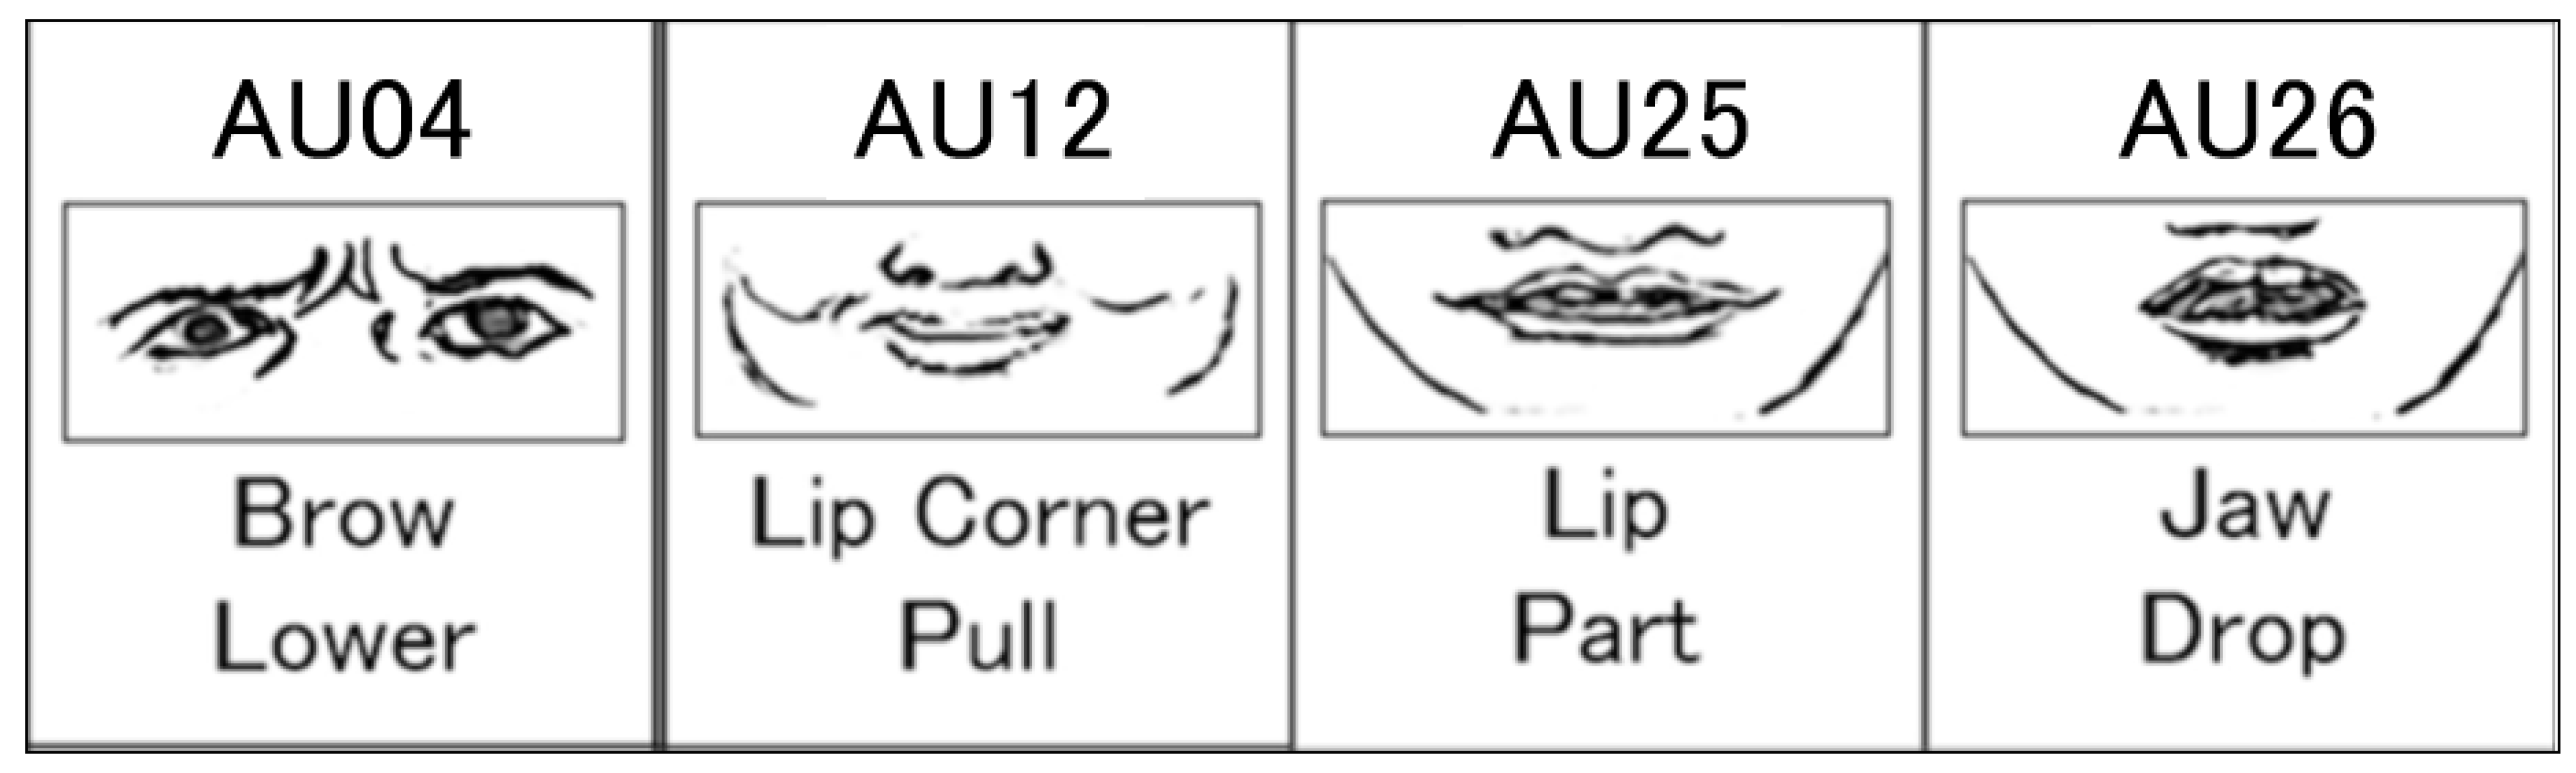
To constrain the search for temporal effects to the most relevant AU time series, we conducted principal component analysis on Nikola’s 17 AU time series, with continuous values generated by Py-feat separately for the positive and negative conditions. We identified the two most contributory AU time series to Nikola’s smile and frown (AU25, lips part, and AU26, jaw drop, under both the positive and negative conditions; Figure 3), as those with the highest weights in the first principal component, in addition to AU12 for the positive condition and AU04 for the negative condition, as supported by past EMG-based studies. The rationale for selecting Nikola’s most contributory AUs was related to the definition of behavioral matching and mimicry. If Nikola activated an AU during a facial expression and the participant followed suit, we could be certain that the participant engaged in spontaneous facial mimicry. If Nikola did not activate an AU, and the participant also did not, then it would be unclear whether the participant “behaved” after Nikola’s non-expression, or if the participant simply remained static. We included three AUs per agent in the mlVAR models, because six time series is the maximum that could be estimated with correlated temporal random effects in the linear mixed effect model implementation in the multilevel VAR (mlVAR) package of R [34].
To investigate the mimicking temporal pattern of Nikola’s most contributing AUs, we performed cross-correlation analyses between the android and participant AU04, AU12, AU25, and AU26 time series, condition-wise, to test whether the cross-correlation coefficients exceeded zero. This identified time periods during which mimicry occurred.
To investigate the temporal patterns of android–human AU temporal precedence effects, we used the mlVAR package of R [34]. The mlVAR models both temporal and contemporaneous effects, as well as hierarchical between-subjects effects (Figure 1). The mlVAR model included three AUs from the dyadic data, yielding six AU time series. Although the experiment involved live performances by the android Nikola, the experimental design ensured that participants viewed Nikola’s dynamic facial expressions, whereas Nikola’s facial movements were determined solely by predefined actuator motions. Therefore, we expected to observe only the temporal effects of Nikola’s dynamic facial expressions on participants’ facial actions. We estimated all nine android–human AU temporal precedence effects across the time course to observe their dynamic evolution, and highlighted significant latencies to identify influential android–human effects. To the best of our knowledge, Granger causality has not yet been used to test spontaneous facial mimicry. We expected to observe dynamically changing temporal effects from android AUs to participant AUs. If android–human temporal effects occur across different AU pairs, it would indicate that facial responses when observing android facial expressions involve not only copying the motor pattern of individual AUs, but also the use of goal inferencing and motor planning during social cognition
This study excelled in the novel use of dyadic multivariate time-series data from both the android and participants, enabling estimation of interpretable Granger causality effects over time, and discussion in relation to the observed AU-paired cross-correlations. Both the approach and the findings are informative in terms of understanding the nature of spontaneous facial mimicry during human–android and human–human interactions [35,36]. There are also practical implications. The approach and findings can be applied to social androids to optimize performance in the commercial, financial, educational, and medical contexts.

2. Materials and Methods

2.1. Participants

Twenty-six adults (12 men and 14 women) were recruited in Kyoto, Japan (mean ± standard deviation [SD] of age = 25.27 ± 5.49 years, range: 20–37 years). They were all native Japanese with Japanese as their native language. The sample size was determined using an a priori power analysis conducted with G*Power software (ver. 3.1.9.2; Heinrich Heine University, Düsseldorf, Germany) [37]. The analysis was based on one-tailed paired t-tests to detect facial mimicry, specifically greater brow-lowering activity in response to angry expressions and greater lip-corner-pulling activity in response to happy expressions. The parameters included an α-level of 0.05 and a statistical power (1 − β) of 0.80, with an effect size (d) of 0.56 estimated from previous findings of visually detectable facial mimicry in response to human dynamic facial expressions [14]. This analysis indicated that a minimum of 22 participants was required. The study was approved by the Ethics Committee of RIKEN and conducted in accordance with its ethical standards. Written informed consent, including consent for video recording and publication, was obtained from all participants. All participants received financial compensation for their participation.

2.2. Facilities

The android Nikola [5] was used to present facial expressions, which was developed at RIKEN to study human–robot emotional interactions. Nikola’s face resembles a human child and is covered with soft, deformable silicone skin attached to the front of the skull. Beneath the skin, the android is equipped with 35 pneumatic actuators controlled by pressure valves: 29 actuators manage facial muscle movements, 3 control head movements, and 3 govern eyeball movements. A previous study [5] validated 17 of Nikola’s AUs associated with prototypical facial expressions, including AU04 (brow lowerer) and AU12 (lip-corner puller). The android receives motor control commands from a notebook computer (G-Tune P5-ADLABW11, Mouse Computer, Tokyo, Japan) running Ubuntu 20.04. Commands are transmitted via a USB cable, allowing Nikola to generate dynamic facial expressions. The android’s hair and make-up were kept consistent throughout the experiment.
To present Nikola’s facial expressions to participants and simultaneously videotape their faces, both the android and the participant faced a prompter (MPL-21W3/HDMI; Life-On, Hikone, Japan), consisting of a mirror reflecting a TV screen, with a video camera (VIXIA HF R800, Canon, Tokyo, Japan) concealed behind the mirror. Video signals were controlled by a switcher (SL-41C; Imagenics, Tokyo, Japan), which received serial port commands from a Windows 11 computer (Precision T3500, Dell, Round Rock, TX, USA) running Presentation 24.1 software (Neurobehavioral Systems, Berkeley, CA, USA) to execute the experimental paradigm and switch between the PC visual input and the android’s side camera. Video recordings were captured at a resolution of 1920 × 1080 pixels. Experiments were conducted individually in an electrically shielded soundproof room (Science Cabin; Takahashi Kensetsu, Tokyo, Japan).

2.3. Paradigm and Procedures

Upon arrival, participants were briefed on the study and provided informed consent before signing the consent form. An assistant prepared the participants and seated them in front of the prompter. During the initial phase of the experiment, participants engaged in passive viewing. They were instructed to focus on a central cross displayed on the screen, which appeared for a jittered duration of 2000–3750 ms, with an average intertrial interval of 2604 ms. During each trial, the android presented dynamic facial expressions of smiling (positive condition) and frowning (negative condition) for 3 s (Figure 2), including neutral, dynamic, and apex expressions each lasting 1 s. This timing has been shown to reflect natural changes in the dynamic facial expressions of human [38] and android [5] faces. Following each trial, the fixation cross reappeared on the screen. Participants completed four practice trials, comprising two trials for each emotion condition, and subsequently completed 30 passive viewing trials per condition, totaling 60 trials, with a scheduled break after 32 trials. Within each condition, 15 trials presented prototypical expressions based on AU descriptions of the happy and angry expressions in the FACS [5,20,39,40], and the rest presented Bayesian optimized expressions [41]. The latter were based on emotion-recognition ratings estimated by Py-Feat [22]. The resulting AU activation profile differed from that of the prototypical expressions. In addition, the optimized happy expression was rated as significantly less happy than the prototypical happy expression [41]. Therefore, only trials (15 per condition) presenting the prototypical expressions were analyzed. The order of conditions within the trials was pseudo-randomized for each participant to prevent more than three consecutive trials of the same condition (either positive or negative). Video data were recorded during these passive viewing trials. Afterward, participants provided 4 practice-ratings and 60 test-ratings of subjective experiential valence and arousal, during which no video data were acquired. These ratings were not analyzed in this study. Participants were remunerated for their participation and then dismissed.

2.4. Py-Feat Automated AU Estimation

The face recordings of participants and the android were segmented into 4 s clips corresponding to each trial, based on the timing recorded in the log files. All trials, including positive and negative conditions, underwent framewise automated FACS [20] estimation to extract AU amplitude time series. This was performed using Py-Feat [22] (version 0.6.0; Python 3.10) within a conda environment in Miniconda (version 23.10.0). The default modules were used for facial detection (RetinaFace), facial landmark estimation (MobileFaceNets), and AU estimation (XGBoost classifier). Py-Feat detects 20 AUs (01, 02, 04, 05, 06, 07, 09, 10, 12, 14, 15, 17, 18, 20, 23, 24, 25, 26, 28, and 43) as continuous values, with the exception of AUs 7, 11, and 20, which are classified as binary (1 or 0).

2.5. Statistical Analysis

2.5.1. Principal Component Analysis

Apart from AU04 in the negative condition and AU12 in the positive condition, we performed principal component analysis using the prcomp function in R on the android’s 17 continuous AU time series to identify the AUs with the highest weights in the first principal component for each condition. In the negative condition, the first principal component explained 62.4% of the variance, with AU25 (lips part, weight = 0.634) and AU26 (jaw drop, weight = 0.433) contributing most. In the positive condition, the first principal component explained 64.6% of the variance, with AU25 (weight = 0.626) and AU26 (weight = 0.287) as the most heavily weighted. Therefore, AU25 and AU26 were identified as contributory AUs for both conditions.

2.5.2. Cross-Correlations Between Android and Human AU Time Series

We cross-correlated trial-wise participant AU04, 12, 25, and 26 time series with the corresponding android time series up to 40 lags (at 30 fps, equivalent to 1333.333 ms) using the crosscorr function in MATLAB R2024b. Following a hierarchical approach, mean condition-wise cross-correlation series were computed and smoothed with a rolling window of five lags using the rollmean function in R version 4.5.2 for each participant. Group-level mean condition-wise cross-correlation series were estimated and visualized using base functions and packages lsr (0.5.2) and ggplot2 (4.0.2) in R. The peak lag within each smoothed cross-correlation series was identified. We then performed one-sample t-tests using the t.test function in R on the cross-correlation coefficient series from the neurobiologically viable 5th to the 40th lags to assess the significance of the findings. Significant t-statistics identified time periods during which facial mimicry was present. The Benjamini–Hochberg procedure was used to derive the corrected false discovery rate (FDR). Additionally, peak cross-correlation coefficients were compared between the positive and negative conditions using paired t-tests. The Shapiro–Wilk normality test indicated that the peak AU12 cross-correlations under the positive condition were not normally distributed (p < 0.001). However, paired t-tests with more than 25 observations are robust to violations of the normality assumption [42]; therefore, both the standard t-test and Yuen’s robust t-test statistics are reported. Yuen’s robust paired t-test was performed using the YuenTTest function in the R package DescTools (0.99.60), with a trim level of 0.2 (the default, trimming 20% of the data), to compare peak cross-correlation coefficients between the positive and negative conditions. Such trimming resulted in a reduced degree of freedom (15 vs. 25) in Yuen’s t-test. Effect sizes were estimated using the Algina–Keselman–Penfield robust standardized difference (AKP), which is comparable to Cohen’s d [43], with calculations performed using the dep.effect function in the R package WRS2 (1.1.7) [44]. All t-tests were one-tailed to reflect the directional nature of the hypotheses.

2.5.3. mlVAR Estimation

MlVAR models were estimated using the mlVAR package (0.5.5) in R. For the negative condition, AU04, AU25, and AU26 from both the android and participants were included as variables to estimate temporal effects. For the positive condition, AU12, AU25, and AU26 from both the android and the participants were included to estimate temporal effects. Temporal random effects were assumed to be correlated. Three AUs per agent were included in the mlVAR models, because, in the mlVAR package, six time series in the model is the maximum that allows estimation of correlated temporal random effects in the linear mixed effect model implementation. Temporal effects were estimated up to the 40th lag. Each time lag was estimated separately in individual models to avoid multicollinearity among temporal effects across lags [45]. Although our experimental design primarily focused on the temporal effects of android AUs on participant AUs, the model estimated and controlled for the autoregressive and temporal effects of all six AUs (three from the participants and three from the android) included in the analysis. We report temporal effects from the 5th to the 40th lags, and also the corrected FDR obtained using the Benjamini–Hochberg procedure. To plot the beta value time courses of all nine android–participant AU temporal effects, we smoothed the beta time series with a rolling window of five lags using the rollmean function in R.

3. Results

3.1. Human-Android AU Cross-Correlations

3.1.1. AU04 Cross-Correlation

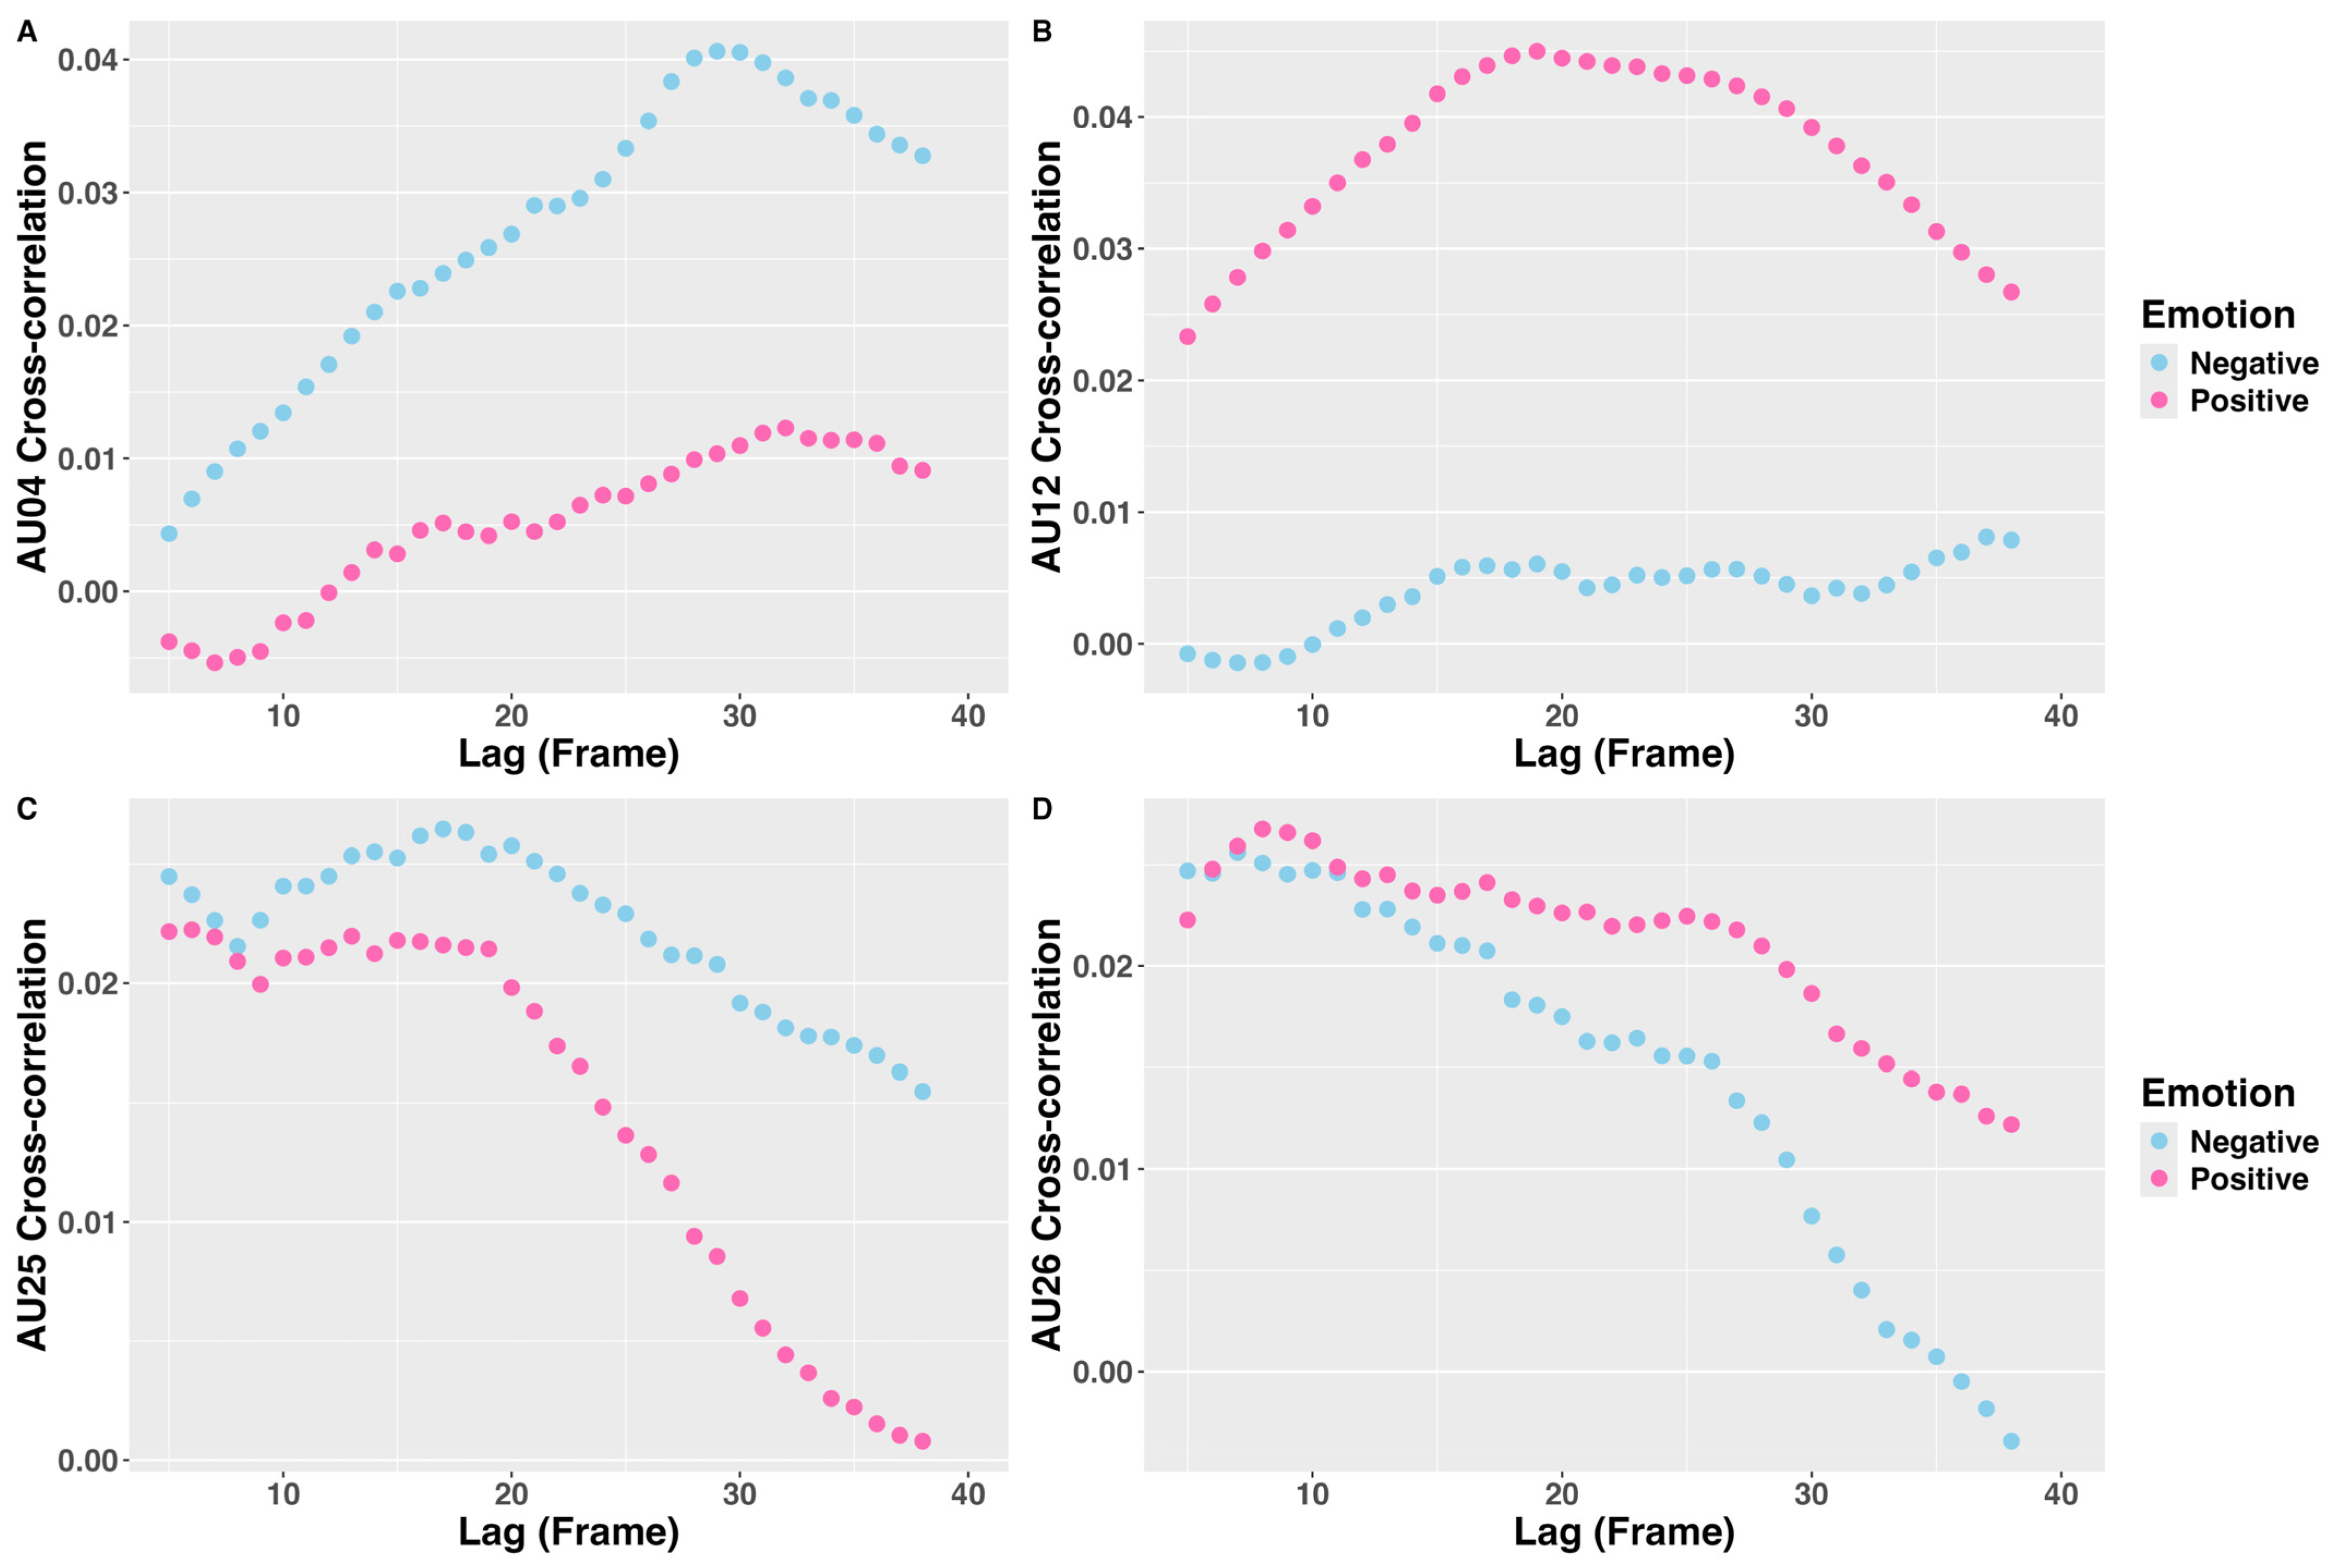
Human–android AU04 cross-correlations reached peak values at different time lags depending on the condition. In the negative condition, the peak occurred at the 29th lag (966.667 ms). The group-level cross-correlation coefficients were significantly greater than zero from the 13th lag to the 40th lag, and all survived FDR correction. Under the positive condition, the peak appeared at the 32nd lag (1066.667 ms), and the cross-correlation coefficients were significantly larger than zero in lags 30, 33, and 34, but none survived FDR correction (Table 1). Comparison of group-level peaks indicated that the peak cross-correlation coefficient was significantly higher in the negative condition than in the positive condition (mean difference = 0.033, 95% CI = [0.012, Inf], df = 25, t = 2.673, p = 0.007, Cohen’s d = 0.524; Figure 4A).

3.1.2. AU12 Cross-Correlations

In the positive condition, the human–android AU12 cross-correlation peak occurred at the 19th lag (633.333 ms), and the group-level cross-correlation coefficients were significantly greater than zero from the 14th lag to the 40th lag, all of which, apart from lags 14 and 15, survived FDR correction. Conversely, under the negative condition, the peak occurred at the 37th lag (1233.333 ms), but none of the cross-correlation coefficients was significantly different from zero (Table 2). Comparison of conditions showed that the standard t-test indicated a significantly higher peak cross-correlation coefficient in the positive condition than in the negative condition (mean difference = 0.038, 95% CI = [0.001, Inf], df = 25, t = 2.673, p = 0.048, Cohen’s d = 0.339), whereas the robust t-test did not yield a significant difference (trimmed mean difference = 0.014, 95% CI = [−0.018, 0.046], df = 15, Ty = 0.938, p = 0.363, AKP = 0.123; Figure 4B).

3.1.3. AU25 Cross-Correlations

The human–android AU25 cross-correlations attained peak values at different time lags depending on the condition. Under the positive condition, the peak appeared at the 6th lag (200 ms), and the group-level cross-correlation coefficients were significantly greater than zero from lag 5 to lag 21, except for lags 7 and 10. However, none survived the FDR correction. Under the negative condition, the peak occurred at the 17th lag (566.667 ms), and the group-level cross-correlation coefficients were significantly greater than zero from lag 5 to lag 40, except for lag 39, and all coefficients survived the FDR correction (Table 3). Comparison of group-level peaks indicated that the peak cross-correlation coefficient did not differ between the positive condition and the negative condition (mean difference = 0.004, 95% CI = [−0.020, Inf], df = 25, t = 0.311, p = 0.379, Cohen’s d = 0.061; Figure 4C).

3.1.4. AU26 Cross-Correlations

The human–android AU26 cross-correlations attained peak values at different time lags depending on the condition. Under the positive condition, the peak appeared at the 8th lag (266.667 ms). The group-level cross-correlation coefficients were significantly greater than zero from lag 5 to lag 38, except for lag 37, and all coefficients survived the FDR correction. Under the negative condition, the peak occurred at the 7th lag (233.333 ms), and the group-level cross-correlation coefficients were significantly greater than zero from lag 5 to lag 27, except for lags 20, 23, 25, and 26. The coefficients survived the FDR correction, except for those of lags 16, 19, 21, 22, 24, and 27 (Table 4). Comparison of group-level peaks indicated that the peak cross-correlation coefficient was no different between the positive condition and the negative conditions (mean difference = 0.007, 95% CI = [−0.013, Inf], df = 25, t = 0.594, p = 0.279, Cohen’s d = 0.116; Figure 4D).

3.2. MlVAR Results

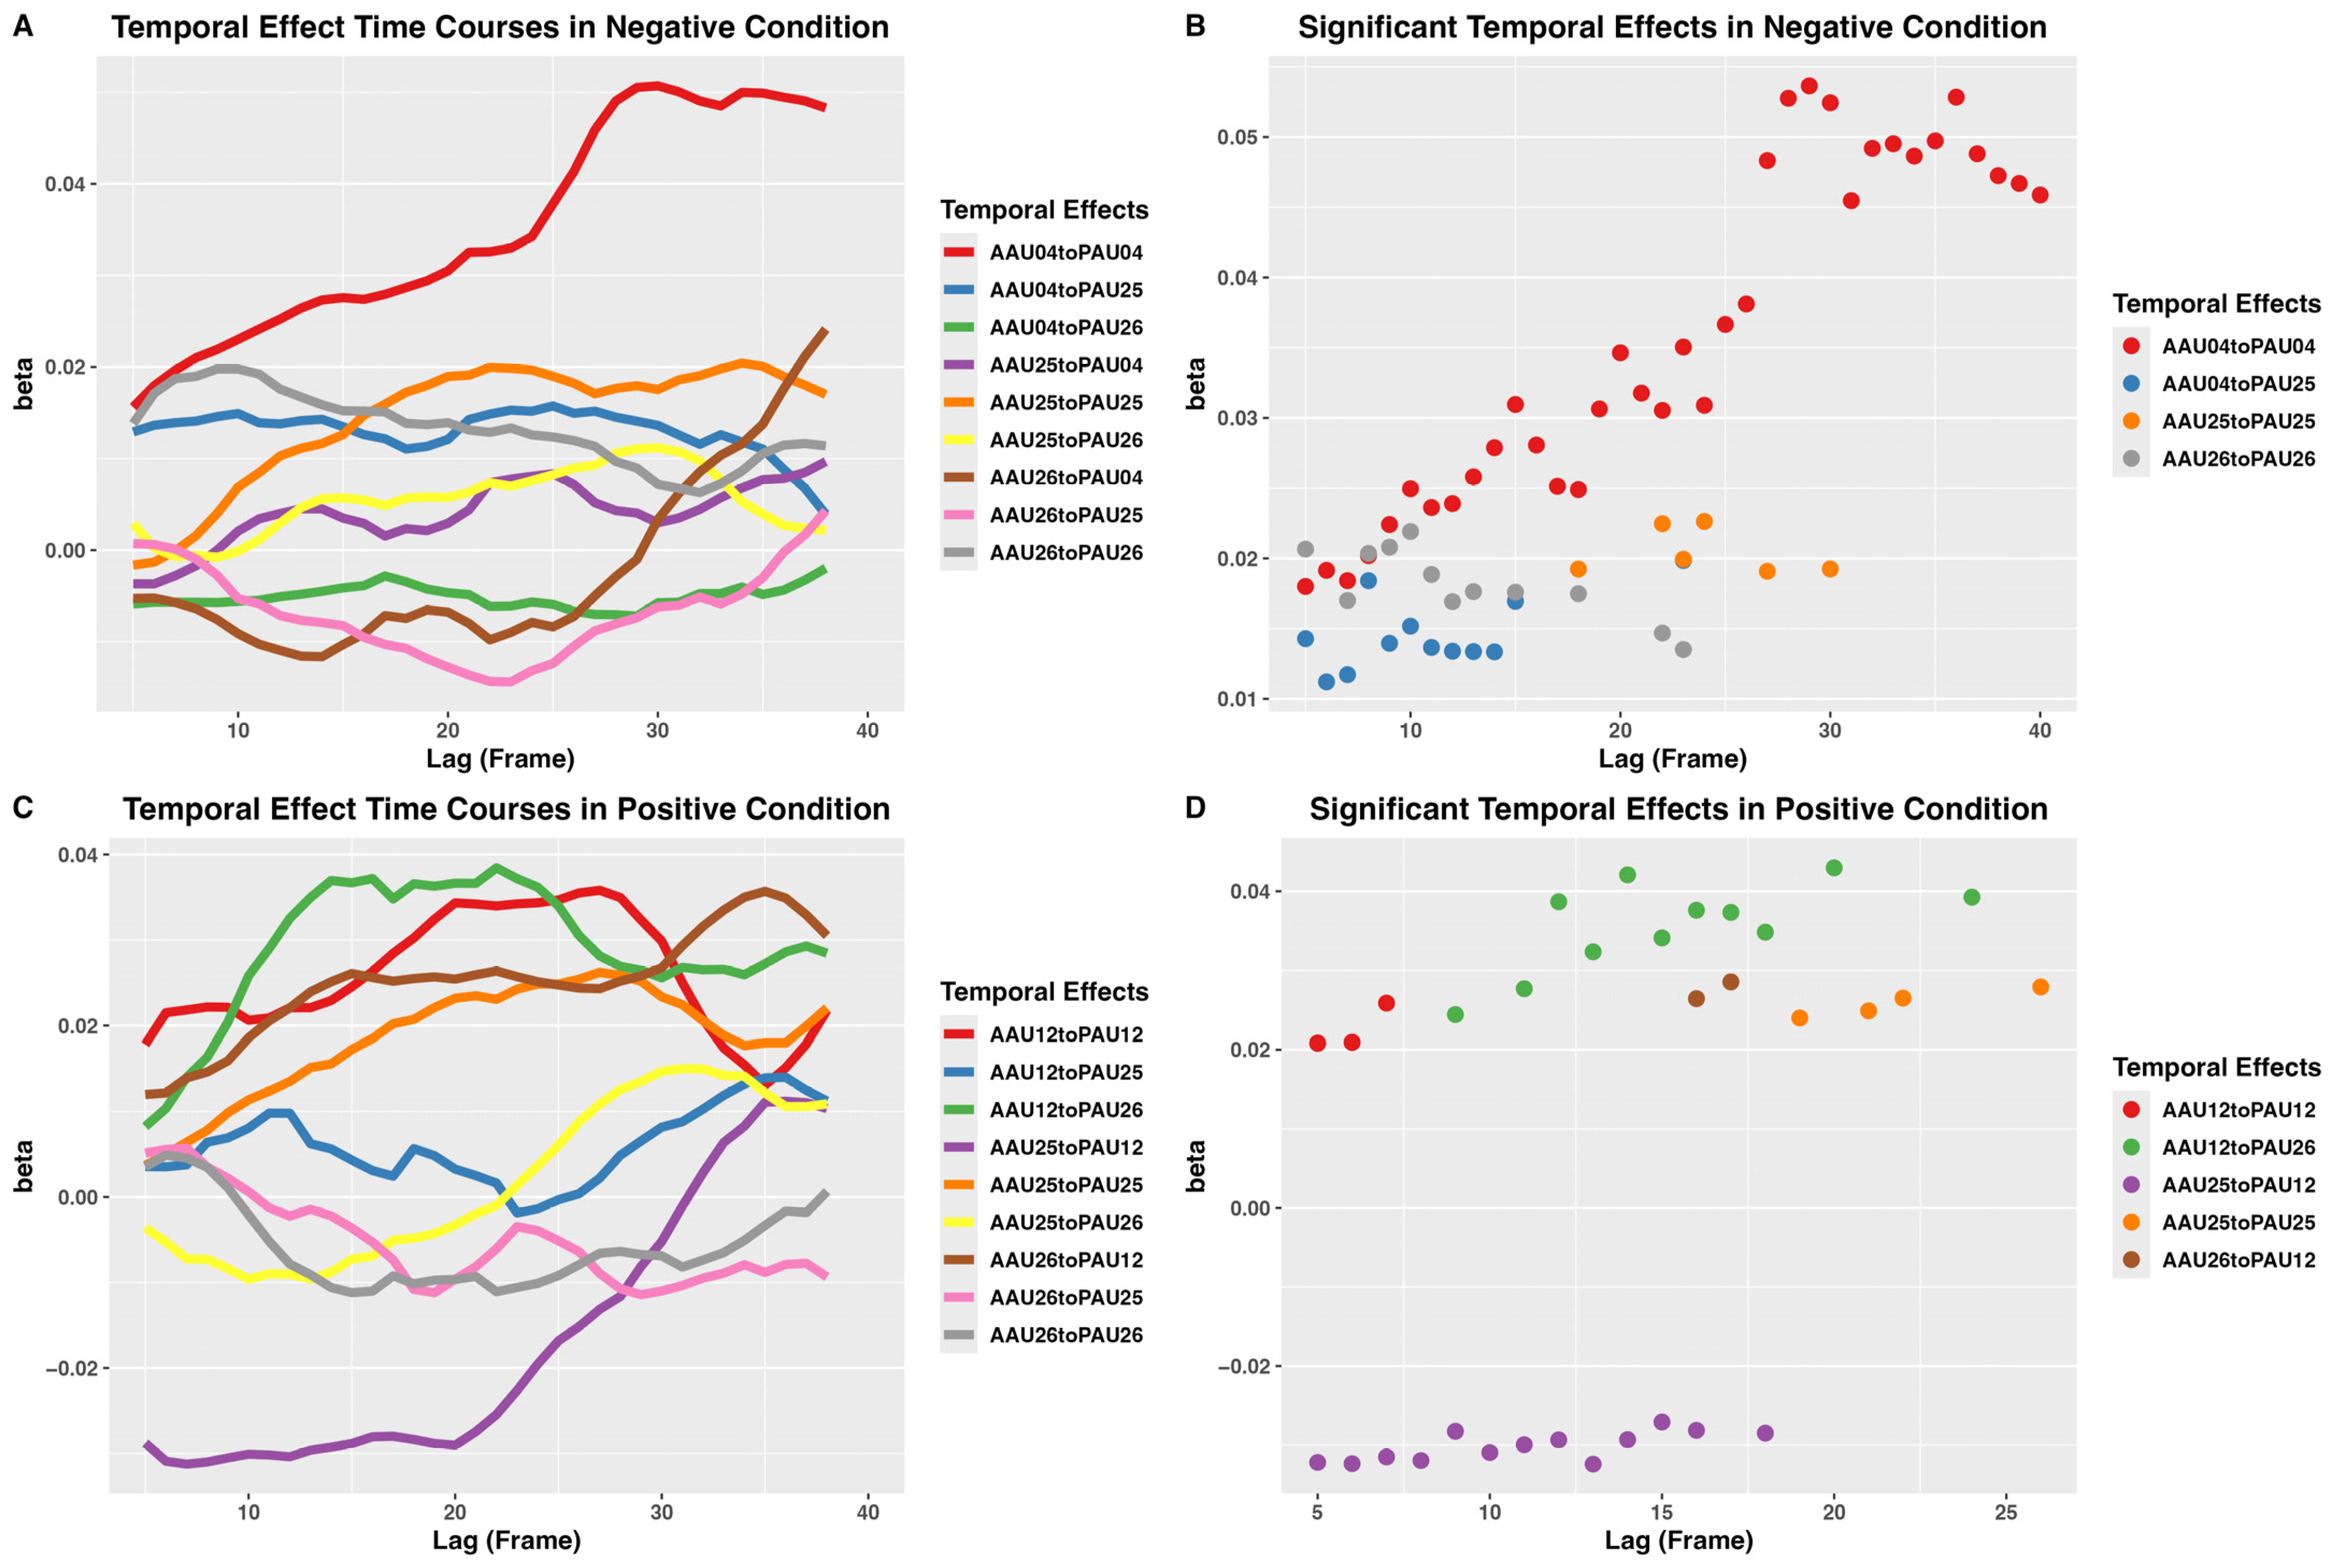
Under the negative condition, the temporal effects of android-to-participant AUs dynamically changed along the course of the trial (Figure 5A). The android AU04 amplitude significantly predicted the participant AU04 amplitude from the 5th lag to the 40th lag, and the temporal effects remained significant after FDR correction. The android AU04 amplitude also significantly predicted participant AU25 amplitude from the 5th to the 15th lags and at the 23rd lag. Lags 5 and 8 remained significant after FDR correction. The android AU25 amplitude significantly predicted participant AU25 amplitude at lags 18, 22, 23, 25, 27, and 30. However, these effects did not survive FDR correction. The android AU26 amplitude significantly predicted participant AU26 amplitude at lags 5, 7 to 13, 15, 18, 22, and 23, but none survived FDR correction (Figure 5B, Table 5).
Under the positive condition, android AU12 amplitude significantly predicted participant AU12 amplitude between the 6th and 8th lags. Android AU12 amplitude also significantly predicted participant AU26 amplitude at lags 9, 11–18, 20, and 24. Android AU25 amplitude significantly predicted participant AU25 amplitude at lags 19, 21, 22, and 26. Android AU25 amplitude also significantly predicted participant AU12 amplitude in a negative direction between the 5th and 16th lags and at the 18th lag. No temporal effects under the positive condition survived FDR correction (Figure 5C,D, Table 6).

4. Discussion

We examined the timing and temporal causal relationships in FACS data from simultaneous dyadic video recordings of participants viewing Nikola’s dynamic facial expressions in our previous study [7]. Under the negative condition, cross-correlation analysis indicated that mimicry of Nikola’s frowning expression in the brow lowerer (AU04) was significant from 433.333 ms onward. This finding corresponded with the mlVAR assessment of Granger causality, which showed that Nikola’s AU04 amplitudes exerted a significant temporal effect on participants’ AU04 amplitudes throughout the entire time-course. The mimicry of Nikola’s mouth-widening expression (AU25, lips part) was also significant throughout the entire time-course. The mlVAR revealed paired android–participant AU25 Granger causality between 600 and 1000 ms. The mimicry of Nikola’s jaw-dropping expression (AU26) was significant, between 166.667 and 900 ms, corresponding to the paired android–participant AU26 Granger causality between 166.667 and 766.667 ms.
Under the positive condition, for the lip-corner puller (AU12) mimicry of Nikola’s smiling expression, the cross-correlation was significant from 466.667 ms onwards. However, the mlVAR analysis revealed significant paired android–participant AU12 Granger causality between 166.667 and 233.333 ms. For mimicry of Nikola’s mouth-widening expression (AU25), the cross-correlation was significant, between 166.667 and 700 ms, whereas the paired android–participant AU25 Granger causality was observed between 633.333 and 866.667 ms. For mimicry of Nikola’s jaw-dropping expression (AU26), the cross-correlation was significant, between 166.667 and 1266.667 ms, but no paired android–participant AU26 Granger causality attained significance.
Turning the traditionally measured AU04/corrugator supercilii and AU12/zygomaticus major, cross-correlations indicated that human–android spontaneous facial mimicry exhibited a latency of 0.4–1 s, which falls within the range reported for human–human spontaneous facial mimicry of dynamic facial expressions (approximately 0.5–0.9 s) [14]. This finding is also consistent with the 1.18 s delay in human–android spontaneous facial mimicry reported by Hofree et al., 2014 [6], who used a different android, Einstein. The fact that observed spontaneous facial mimicry in human–android interactions has a latency comparable to that of human–human interactions implies that participants engage in behavioral matching with the android Nikola in a manner similar to that with a human counterpart. However, for the android–participant pairs of AU25 and AU26, the mimicry appeared to occur faster (from about 200 ms onwards) than for AU04 and AU12. To the best of our knowledge, previous studies of spontaneous facial mimicry have not investigated the timing of AU25 (depressor labii and orbicularis oris) and AU26 (masseter) mimicry responses. We thus lacked previous data for comparison. This is possibly attributable to earlier findings of high saliency in the mouth compared to other facial regions [46,47,48], which therefore attracted visual attention early and contributed to the rapid onset of participants’ responses in the mouth region. Future studies that incorporate simultaneous eye-tracking of participants’ visual attention are required to clarify this potential mechanism.
MlVAR revealed non-paired android–participant AU temporal precedence effects, in addition to paired android–participant AU Granger causality. Under the negative condition, android AU04 exerted temporal effects on participant AU25 between 166.667 and 766.667 ms. Under the positive condition, android AU12 exerted temporal effects on participant AU26 between 300 and 800 ms, whereas android AU25 exerted negative temporal effects on participant AU12 between 166.667 and 600 ms. This showed that the observed participant AU time series was influenced by multiple android AU actions, with temporal effects exerted at different times along the trial time course (Figure 5B,D), likely a consequence of both non-linear and temporal integrative effects. Therefore, the time course of the temporal precedence effects appeared different from that of the pairwise AU cross-correlations. Also, the time window of significant cross-correlation coefficients did not always correspond to the time window of significant Granger causality. Furthermore, the negative temporal effect from android AU25 to participant AU12 was unexpected but could be explained by an initial visual attentional focus on the salient mouth region, which may have suppressed or delayed the zygomaticus reaction relative to the mouth reaction, despite a concurrent early positive temporal effect of the android–participant AU12 pair.
The revealed android–human temporal effects across different AUs provide additional insight into the Goal Emulation, Planning, and Mimicry (EP-M) model [49]. According to this framework, if android–human temporal effects are observed only in identical AU pairs, spontaneous facial mimicry likely reflects a mechanical motor replica (the direct M route between the posterior temporal sulcus and inferior frontal gyrus). Conversely, if temporal effects occur across different AU pairs that are simultaneously active in the mimickee, mimicry may represent a more holistic response driven by top-down goal emulation, planning (the indirect emulation–planning [EP] route via the inferior parietal sulcus), or a mentalizing system-modulated social response [50]. Our mlVAR results support the possibility that the EP mechanism is involved in human–android interaction. In a previous neuroimaging study, Saygin et al. [51], demonstrated that, when observing the actions of the robotic form and the android form of android Repliee Q2, as well as the human on whom Repliee Q2 was based, using a repetition suppression paradigm, each participant’s mirror neuron system, including the inferior parietal sulcus, was more attuned with the action in the android form than the human and robotic forms. The cited authors, however, attributed the effect to the prediction error elicited by the android’s unnatural actions. However, spontaneous facial mimicry to the android does not necessarily require mentalistic attribution to androids. Given that the participants’ human likeness ratings did not correlate with the zygomaticus major/AU12 and corrugator supercilii/AU04 responses in the current dataset [7], our results cannot be used to imply the level of mentalistic attribution that the participants have towards the android, or to establish whether spontaneous facial mimicry was modulated by the participants’ level of mentalistic attribution towards the android [52]. However, the previously analyzed valence and arousal ratings of the current dataset showed that emotional contagion [2,4] was intact during human–android interactions with Nikola. It is important to investigate, in future studies, whether mentalistic attribution to androids modulates behavioral matching in human–android interactions.
It should be noted that other statistical implementations of Granger causality exist, including entropy transfer [29,53,54] and neural Granger causality [30,55], which can estimate non-linear temporal effects. However, the standard entropy transfer method is limited to bivariate data and relies on Shannon conditional entropy [56], which has issues such as positive bias and difficulty in assessing statistical significance [53]. Neural Granger causality approaches such as multilayer perceptrons or recurrent neural networks show promise for multivariate time-series data [30], provided that sufficient computational resources are available. Notably, despite the term “causality” [27], Granger causality estimates only temporal precedence, which is just one of several criteria needed to establish causality inference [57,58]. Therefore, interpretations of Granger causality should be made with caution.
Several limitations of this study should be acknowledged. First, we tested only happy (smiling) and angry (frowning) facial expressions. Hence, the effects of other expressions remain to be examined. Happy and angry expressions have been most often used to explore the effects of spontaneous facial mimicry [6,9,12,59], possibly because it is practical to detect (via surface EMG measurement) movements of the zygomaticus major and corrugator supercilii. The current study was originally designed to measure EMG, although we also collected dyadic facial video recordings, as also analyzed in the current study. However, the android Nikola shows valid facial expressions of all six basic emotions [5], as well as complex emotional states such as awe and “flirty face” [60]. The suggestion that Nikola is suitable for investigating a variety of emotions is a promising direction for future research. Second, the test setting was a laboratory, specifically a soundproof room, with both the android and the participant facing a prompter, and the android always against a sterile background. Although this setting ensured consistency across other visuo-audio conditions throughout the experiment, participants’ experiences of interacting with the android may have differed from those in more naturalistic social settings, such as in a commercial, financial, or medical context. Third, although the sample size of the current study was sufficient for drawing group inferences (see Section 2.1), it was too low to allow us to investigate the effects of individual differences [61]. Furthermore, for AU12 under the positive condition, previous analysis of zygomaticus major and AU12 responses via between-condition comparisons yielded significant results [7]. However, the peak cross-correlation coefficients were not normally distributed, and the between-condition comparison of the peak cross-correlation coefficients was significant only on the standard t-test, not when the robust Yuen’s trimmed mean test was applied. The non-normal distribution of the correlation coefficients, together with a larger standard error (Table 2), imply that individual variation was greater for AU12/zygomaticus mimicry than for other AU mimicries. Although paired t-tests with more than 25 observations are considered robust to violations of the normality assumption [42], a larger sample size should further help avoid such issues. It is important that future studies investigate how variables such as participants’ sex [62], age, socioeconomic status [63], trait empathy, autistic traits [64,65,66], social anxiety [67], and attitudes towards robots and technology [68,69] modulate spontaneous facial mimicry to robotic facial expressions.

5. Conclusions

By analyzing automated FACS-coded dyadic data in human–android interactions, we found that the latency of spontaneous facial mimicry in AU04 and AU12 was comparable to latencies reported in previous human–human interaction studies. We also found that AU25 and AU26 mimicry was more rapid than those of AU04 and AU12. MlVAR models revealed dynamically evolving Granger causality of paired android–human AUs, as well as temporal effects of different AU combinations, indicating that the spontaneous facial response when observing an android’s dynamic facial expressions does not involve only motor copying of facial movements, but also higher-level goal emulation and motor planning in the mirror mechanism. The multivariate, dynamic temporal effects could be further investigated, together with other concurrent behavioral or physiological measurements such as eye-tracking, to identify states and transitions during facial mimicry using a hidden Markov model. Future research should investigate individual differences that modulate human–android facial mimicry, such as sex [62], age, socioeconomic status [63], trait empathy, autistic traits [64,65,66], social anxiety [67], and attitudes towards robots and technology [68,69]. This approach may be valuable when detecting human–human or human–robot behavioral matching in real-life contexts, such as financial and commercial services, education, and medicine [70,71]. The latency and Granger causality findings for humans’ spontaneous facial mimicry in response to the dynamic facial expressions of the android Nikola further support the reliability of the social function of android facial expressions.

Author Contributions

Conceptualization, C.-T.H. and W.S.; Methodology, C.-T.H. and A.K.; Software, C.-T.H.; Validation, T.M. and W.S.; Formal analysis, C.-T.H. and A.K.; Investigation, C.-T.H. and D.Y.; Resources, T.M. and W.S.; Data curation, C.-T.H., A.K. and D.Y.; Writing—original draft preparation, C.-T.H.; Writing—review and editing, A.K., D.Y., T.M. and W.S.; Visualization, C.-T.H.; Supervision, T.M. and W.S.; Project administration, T.M. and W.S.; Funding acquisition, C.-T.H. and W.S. All authors have read and agreed to the published version of the manuscript.

Funding

This study was supported by JSPS KAKENHI (Grant No. JP24K06450) and the Meiji Yasuda Mental Health Foundation Research Grant 2022.

Institutional Review Board Statement

This study was conducted in accordance with the Declaration of Helsinki and was approved by the Ethics Committee of RIKEN (approval no.: Wako3 2021-26), following its ethical standards.

Informed Consent Statement

Written informed consent, including for video recording and publication, was obtained from all participants.

Data Availability Statement

The data and scripts presented in this study are openly available on the depository of the Open Science Framework at https://doi.org/10.17605/OSF.IO/MBDCA (DOI created and accessed on 6 February 2026).

Acknowledgments

We thank Megumi Sakiyama and Saki Kawamura for their technical support.

Conflicts of Interest

The authors declare no conflicts of interest.

Abbreviations

The following abbreviations are used in this manuscript:
AUAction unit
EMGElectromyography
FACSFacial Action Coding System
FDRFalse discovery rate
mlVARMultilevel vector autoregression
SEStandard error

References

  1. Bernieri, F.J.; Rosenthal, R. Interpersonal Coordination: Behavior Matching and Interactional Synchrony. In Fundamentals of Nonverbal Behavior; Cambridge University Press: Cambridge, UK, 1991. [Google Scholar]
  2. Hatfield, E.; Bensman, L.; Thornton, P.D.; Rapson, R.L. New Perspectives on Emotional Contagion: A Review of Classic and Recent Research on Facial Mimicry and Contagion. Interpersona 2014, 8, 159–179. [Google Scholar] [CrossRef]
  3. Arnold, A.J.; Winkielman, P. Smile (but Only Deliberately) Though Your Heart Is Aching: Loneliness Is Associated with Impaired Spontaneous Smile Mimicry. Soc. Neurosci. 2021, 16, 26–38. [Google Scholar] [CrossRef] [PubMed]
  4. Herrando, C.; Constantinides, E. Emotional Contagion: A Brief Overview and Future Directions. Front. Psychol. 2021, 12, 712606. [Google Scholar] [CrossRef]
  5. Sato, W.; Namba, S.; Yang, D.; Nishida, S.; Ishi, C.; Minato, T. An Android for Emotional Interaction: Spatiotemporal Validation of Its Facial Expressions. Front. Psychol. 2022, 12, 800657. [Google Scholar] [CrossRef] [PubMed]
  6. Hofree, G.; Ruvolo, P.; Bartlett, M.S.; Winkielman, P. Bridging the Mechanical and the Human Mind: Spontaneous Mimicry of a Physically Present Android. PLoS ONE 2014, 9, e99934. [Google Scholar] [CrossRef]
  7. Yang, D.; Sato, W.; Hsu, C.-T.; Minato, T.; Nishida, S. Visually Detectable Facial Mimicry in Response to Android Facial Expressions. Sci. Rep. 2025, 15, 41376. [Google Scholar] [CrossRef]
  8. Hsu, C.-T.; Sato, W.; Yoshikawa, S. Enhanced Emotional and Motor Responses to Live versus Videotaped Dynamic Facial Expressions. Sci. Rep. 2020, 10, 16825. [Google Scholar] [CrossRef]
  9. Dimberg, U. Facial Reactions to Facial Expressions. Psychophysiology 1982, 19, 643–647. [Google Scholar] [CrossRef]
  10. Hess, U.; Blairy, S. Facial Mimicry and Emotional Contagion to Dynamic Emotional Facial Expressions and Their Influence on Decoding Accuracy. Int. J. Psychophysiol. 2001, 40, 129–141. [Google Scholar] [CrossRef]
  11. Sato, W.; Fujimura, T.; Suzuki, N. Enhanced Facial EMG Activity in Response to Dynamic Facial Expressions. Int. J. Psychophysiol. 2008, 70, 70–74. [Google Scholar] [CrossRef]
  12. Sims, T.B.; Van Reekum, C.M.; Johnstone, T.; Chakrabarti, B. How Reward Modulates Mimicry: EMG Evidence of Greater Facial Mimicry of More Rewarding Happy Faces. Psychophysiology 2012, 49, 998–1004. [Google Scholar] [CrossRef] [PubMed]
  13. Murata, A.; Saito, H.; Schug, J.; Ogawa, K.; Kameda, T. Spontaneous Facial Mimicry Is Enhanced by the Goal of Inferring Emotional States: Evidence for Moderation of “Automatic” Mimicry by Higher Cognitive Processes. PLoS ONE 2016, 11, e0153128. [Google Scholar] [CrossRef] [PubMed]
  14. Sato, W.; Yoshikawa, S. Spontaneous Facial Mimicry in Response to Dynamic Facial Expressions. Cognition 2007, 104, 1–18. [Google Scholar] [CrossRef]
  15. Weiss, E.M.; Rominger, C.; Hofer, E.; Fink, A.; Papousek, I. Less Differentiated Facial Responses to Naturalistic Films of Another Person’s Emotional Expressions in Adolescents and Adults with High-Functioning Autism Spectrum Disorder. Prog. Neuro-Psychopharmacol. Biol. Psychiatry 2019, 89, 341–346. [Google Scholar] [CrossRef]
  16. Yoshimura, S.; Sato, W.; Uono, S.; Toichi, M. Impaired Overt Facial Mimicry in Response to Dynamic Facial Expressions in High-Functioning Autism Spectrum Disorders. J. Autism Dev. Disord. 2015, 45, 1318–1328. [Google Scholar] [CrossRef]
  17. Hsu, C.-T.; Sato, W. Electromyographic Validation of Spontaneous Facial Mimicry Detection Using Automated Facial Action Coding. Sensors 2023, 23, 9076. [Google Scholar] [CrossRef] [PubMed]
  18. Chuang, Y.; Fujiwara, K. Facial Mimicry in Unstructured Dyadic Interactions: A Cross-Cultural Study. Jpn. Psychol. Res. 2024, 66, 493–509. [Google Scholar] [CrossRef]
  19. Ekman, P.; Friesen, W.V.; Hager, J. Facial Action Coding System; Research Nexus: Salt Lake, UT, USA, 2002; ISBN 978-0-931835-01-8. [Google Scholar]
  20. Ekman, P.; Friesen, W.V. Facial Action Coding System: A Technique for the Measurement of Facial Movement; Consulting Psychologists Press: Palo Alto, CA, USA, 1978. [Google Scholar]
  21. Hjortsjö, C.H. Man’s Face and Mimic Language; Studentlitteratur: Lund, Sweden, 1969. [Google Scholar]
  22. Cheong, J.H.; Jolly, E.; Xie, T.; Byrne, S.; Kenney, M.; Chang, L.J. Py-Feat: Python Facial Expression Analysis Toolbox. Affec Sci. 2023, 4, 781–796. [Google Scholar] [CrossRef]
  23. Westermann, J.-F.; Schäfer, R.; Nordmann, M.; Richter, P.; Müller, T.; Franz, M. Measuring Facial Mimicry: Affdex vs. EMG. PLoS ONE 2024, 19, e0290569. [Google Scholar] [CrossRef]
  24. Amihai, L.; Sharvit, E.; Man, H.; Hanein, Y.; Yeshurun, Y. Facial Mimicry Predicts Preference. Commun. Psychol. 2025, 3, 176. [Google Scholar] [CrossRef]
  25. Zhao, F.; Wood, A.; Mutlu, B.; Niedenthal, P. Faces Synchronize When Communication through Spoken Language Is Prevented. Emotion 2022, 23, 87–96. [Google Scholar] [CrossRef]
  26. Hsu, C.-T.; Minato, T.; Shimokawa, K.; Sato, W. Receiving Human and Android Facial Mimicry Induces Empathic Experiences and Oxytocin Release. Comput. Hum. Behav. Rep. 2026, 21, 100895. [Google Scholar] [CrossRef]
  27. Granger, C.W.J. Testing for Causality: A Personal Viewpoint. J. Econ. Dyn. Control. 1980, 2, 329–352. [Google Scholar] [CrossRef]
  28. Granger, C.W.J. Investigating Causal Relations by Econometric Models and Cross-Spectral Methods. Econometrica 1969, 37, 424–438. [Google Scholar] [CrossRef]
  29. Barnett, L.; Barrett, A.B.; Seth, A.K. Granger Causality and Transfer Entropy Are Equivalent for Gaussian Variables. Phys. Rev. Lett. 2009, 103, 238701. [Google Scholar] [CrossRef] [PubMed]
  30. Takamido, R.; Suzuki, C.; Ota, J.; Nakamoto, H. Understanding Whole-Body Inter-Personal Dynamics between Two Players Using Neural Granger Causality as the Explainable Artificial Intelligence. Hum. Mov. Sci. 2025, 101, 103366. [Google Scholar] [CrossRef]
  31. Kalimeri, K.; Lepri, B.; Aran, O.; Jayagopi, D.B.; Gatica-Perez, D.; Pianesi, F. Modeling Dominance Effects on Nonverbal Behaviors Using Granger Causality. In Proceedings of the 14th ACM International Conference on Multimodal Interaction, Santa Monica, CA, USA, 22–26 October 2012; ACM: New York, NY, USA, 2012; pp. 23–26. [Google Scholar]
  32. Müller, L.; Shadaydeh, M.; Thümmel, M.; Kessler, T.; Schneider, D.; Denzler, J. Causal Inference in Nonverbal Dyadic Communication with Relevant Interval Selection and Granger Causality. arXiv 2018, arXiv:1810.12171. [Google Scholar] [CrossRef]
  33. Shojaie, A.; Fox, E.B. Granger Causality: A Review and Recent Advances. Annu. Rev. Stat. Appl. 2022, 9, 289–319. [Google Scholar] [CrossRef] [PubMed]
  34. Epskamp, S.; Waldorp, L.J.; Mõttus, R.; Borsboom, D. The Gaussian Graphical Model in Cross-Sectional and Time-Series Data. Multivar. Behav. Res. 2018, 53, 453–480. [Google Scholar] [CrossRef]
  35. Xiao, J.; Wang, B.; Huang, K.; Terzi, S.; Wang, W.; Macchi, M. Intelligent Disassembly Scenario Understanding for Human Behavior and Intention Recognition towards Self-Perception Human-Robot Collaboration System. J. Manuf. Syst. 2025, 83, 937–962. [Google Scholar] [CrossRef]
  36. Xiao, J.; Zhang, Z.; Zheng, Y.; Wu, P.; Terzi, S.; Macchi, M. Knowledge Graph-Driven Process Reasoning of Human-Robot Collaborative Disassembly Strategy for End-of-Life Products. Robot. Comput.-Integr. Manuf. 2026, 99, 103211. [Google Scholar] [CrossRef]
  37. Faul, F.; Erdfelder, E.; Lang, A.-G.; Buchner, A. G*Power 3: A Flexible Statistical Power Analysis Program for the Social, Behavioral, and Biomedical Sciences. Behav. Res. Methods 2007, 39, 175–191. [Google Scholar] [CrossRef] [PubMed]
  38. Sato, W.; Yoshikawa, S. The Dynamic Aspects of Emotional Facial Expressions. Cogn. Emot. 2004, 18, 701–710. [Google Scholar] [CrossRef]
  39. Ekman, P.; Friesen, W.V.; Tomkins, S.S. Facial Affect Scoring Technique: A First Validity Study. Semiotica 1971, 3, 37–58. [Google Scholar] [CrossRef]
  40. Ekman, P.; Friesen, W.V. Pictures of Facial Affect; Consulting Psychologists Press: Palo Alto, CA, USA, 1976. [Google Scholar]
  41. Yang, D.; Sato, W.; Liu, Q.; Minato, T.; Namba, S.; Nishida, S. Optimizing Facial Expressions of an Android Robot Effectively: A Bayesian Optimization Approach. In Proceedings of the 2022 IEEE-RAS 21st International Conference on Humanoid Robots (Humanoids), Ginowan, Japan, 28–30 November 2022; IEEE: New York, NY, USA, 2022; pp. 542–549. [Google Scholar]
  42. Canavos, G.C. The Sensitivity of the One-Sample and Two-Sample Student t Statistics. Comput. Stat. Data Anal. 1988, 6, 39–46. [Google Scholar] [CrossRef]
  43. Algina, J.; Keselman, H.J.; Penfield, R.D. An Alternative to Cohen’s Standardized Mean Difference Effect Size: A Robust Parameter and Confidence Interval in the Two Independent Groups Case. Psychol. Methods 2005, 10, 317–328. [Google Scholar] [CrossRef]
  44. Mair, P.; Wilcox, R. Robust Statistical Methods in R Using the WRS2 Package. Behav. Res. Methods 2020, 52, 464–488. [Google Scholar] [CrossRef]
  45. Ariens, S.; Adolf, J.K.; Ceulemans, E. Collinearity Issues in Autoregressive Models with Time-Varying Serially Dependent Covariates. Multivar. Behav. Res. 2023, 58, 687–705. [Google Scholar] [CrossRef]
  46. Calvo, M.G.; Fernández-Martín, A.; Nummenmaa, L. Facial Expression Recognition in Peripheral versus Central Vision: Role of the Eyes and the Mouth. Psychol. Res. 2014, 78, 180–195. [Google Scholar] [CrossRef]
  47. Fernández-Martín, A.; Gutiérrez-García, A.; Calvo, M.G. A Smile Radiates Outwards and Biases the Eye Expression. Span. J. Psychol. 2013, 16, E53. [Google Scholar] [CrossRef]
  48. Khan, R.A.; Meyer, A.; Konik, H.; Bouakaz, S. Saliency-Based Framework for Facial Expression Recognition. Front. Comput. Sci. 2019, 13, 183–198. [Google Scholar] [CrossRef]
  49. Hamilton, A.F.d.C. Emulation and Mimicry for Social Interaction: A Theoretical Approach to Imitation in Autism. Q. J. Exp. Psychol. 2008, 61, 101–115. [Google Scholar] [CrossRef] [PubMed]
  50. Wang, Y.; Hamilton, A.F.D. Social Top-down Response Modulation (STORM): A Model of the Control of Mimicry in Social Interaction. Front. Hum. Neurosci. 2012, 6, 153. [Google Scholar] [CrossRef]
  51. Saygin, A.P.; Chaminade, T.; Ishiguro, H.; Driver, J.; Frith, C. The Thing That Should Not Be: Predictive Coding and the Uncanny Valley in Perceiving Human and Humanoid Robot Actions. Soc. Cogn. Affect. Neurosci. 2012, 7, 413–422. [Google Scholar] [CrossRef] [PubMed]
  52. Jastrzab, L.E.; Chaudhury, B.; Ashley, S.A.; Koldewyn, K.; Cross, E.S. Beyond Human-Likeness: Socialness Is More Influential When Attributing Mental States to Robots. iScience 2024, 27, 110070. [Google Scholar] [CrossRef]
  53. Kirkley, A. Transfer Entropy for Finite Data. Phys. Rev. E 2025, 112, L052304. [Google Scholar] [CrossRef] [PubMed]
  54. Behrendt, S.; Dimpfl, T.; Peter, F.J.; Zimmermann, D.J. RTransferEntropy—Quantifying Information Flow between Different Time Series Using Effective Transfer Entropy. SoftwareX 2019, 10, 100265. [Google Scholar] [CrossRef]
  55. Tank, A.; Covert, I.; Foti, N.; Shojaie, A.; Fox, E.B. Neural Granger Causality. IEEE Trans. Pattern Anal. Mach. Intell. 2021, 4267–4279. [Google Scholar] [CrossRef]
  56. Shannon, C.E. A Mathematical Theory of Communication. Bell Syst. Tech. J. 1948, 27, 379–423. [Google Scholar] [CrossRef]
  57. Evans, A.S. Causation and Disease: The Henle-Koch Postulates Revisited. Yale J. Biol. Med. 1976, 49, 175–195. [Google Scholar]
  58. Siddiqi, S.H.; Kording, K.P.; Parvizi, J.; Fox, M.D. Causal Mapping of Human Brain Function. Nat. Rev. Neurosci. 2022, 23, 361–375. [Google Scholar] [CrossRef]
  59. Sonnby-Borgström, M. Automatic Mimicry Reactions as Related to Differences in Emotional Empathy. Scand. J. Psychol. 2002, 43, 433–443. [Google Scholar] [CrossRef]
  60. Diel, A.; Sato, W.; Hsu, C.-T.; Bäuerle, A.; Teufel, M.; Minato, T. An Android Can Show the Facial Expressions of Complex Emotions. Sci. Rep. 2025, 15, 2433. [Google Scholar] [CrossRef] [PubMed]
  61. Brydges, C.R. Effect Size Guidelines, Sample Size Calculations, and Statistical Power in Gerontology. Innov. Aging 2019, 3, igz036. [Google Scholar] [CrossRef]
  62. Kislev, E. The Robot-Gender Divide: How and Why Men and Women Differ in Their Attitudes Toward Social Robots. Soc. Sci. Comput. Rev. 2023, 41, 2230–2248. [Google Scholar] [CrossRef]
  63. Chatzoglou, P.D.; Lazaraki, V.; Apostolidis, S.D.; Gasteratos, A.C. Factors Affecting Acceptance of Social Robots Among Prospective Users. Int. J. Soc. Robot. 2024, 16, 1361–1380. [Google Scholar] [CrossRef]
  64. Hsu, C.-T.; Sato, W.; Yoshikawa, S. An Investigation of the Modulatory Effects of Empathic and Autistic Traits on Emotional and Facial Motor Responses during Live Social Interactions. PLoS ONE 2024, 19, e0290765. [Google Scholar] [CrossRef]
  65. Kumazaki, H.; Yoshikawa, Y.; Yoshimura, Y.; Ikeda, T.; Hasegawa, C.; Saito, D.N.; Tomiyama, S.; An, K.; Shimaya, J.; Ishiguro, H.; et al. The Impact of Robotic Intervention on Joint Attention in Children with Autism Spectrum Disorders. Mol. Autism 2018, 9, 46. [Google Scholar] [CrossRef]
  66. Kumazaki, H.; Muramatsu, T.; Yoshikawa, Y.; Matsumoto, Y.; Ishiguro, H.; Kikuchi, M.; Sumiyoshi, T.; Mimura, M. Optimal Robot for Intervention for Individuals with Autism Spectrum Disorders. Psychiatry Clin. Neurosci. 2020, 74, 581–586. [Google Scholar] [CrossRef]
  67. Suzuki, T.; Yamada, S.; Kanda, T.; Nomura, T. Influence of Social Anxiety on People’s Preferences for Robots as Daily Life Communication Partners Among Young Japanese. Jpn. Psychol. Res. 2022, 64, 343–350. [Google Scholar] [CrossRef]
  68. Naneva, S.; Sarda Gou, M.; Webb, T.L.; Prescott, T.J. A Systematic Review of Attitudes, Anxiety, Acceptance, and Trust Towards Social Robots. Int. J. Soc. Robot. 2020, 12, 1179–1201. [Google Scholar] [CrossRef]
  69. Koverola, M.; Kunnari, A.; Sundvall, J.; Laakasuo, M. General Attitudes Towards Robots Scale (GAToRS): A New Instrument for Social Surveys. Int. J. Soc. Robot. 2022, 14, 1559–1581. [Google Scholar] [CrossRef]
  70. Vishwakarma, L.P.; Singh, R.K.; Mishra, R.; Demirkol, D.; Daim, T. The Adoption of Social Robots in Service Operations: A Comprehensive Review. Technol. Soc. J. 2024, 76, 102441. [Google Scholar] [CrossRef]
  71. Wu, K.; Liu, C.; Calvo, R.A. Automatic Nonverbal Mimicry Detection and Analysis in Medical Video Consultations. Int. J. Hum. Comput. Interact. 2020, 36, 1379–1392. [Google Scholar] [CrossRef]
Figure 1. The theoretical and analytical frameworks of the present study [1,7,9].
Sensors 26 01881 g001
Figure 2. The android Nikola displaying dynamic facial expressions in the positive (smiling) and negative (frowning) conditions.
Sensors 26 01881 g002
Figure 3. Facial Action Coding System action units (AUs) analyzed in the present study.
Sensors 26 01881 g003
Figure 4. Group-average cross-correlations of android and participant action unit (AU) time series. Each x-axis represents the lag in frames (30 frames per second, 33 ms per frame) and each y-axis the cross-correlation coefficient. (A) Cross-correlation of dyadic AU04 time series: the peak occurred at the 29th lag under the negative condition and at the 32nd lag under the positive condition. (B) Cross-correlation of the dyadic AU12 time series: the peak occurred at the 19th lag under the positive condition and at the 37th lag under the negative condition. (C) Cross-correlation of dyadic AU25 time series: the peak occurred at the 6th lag under the positive condition and at the 17th lag under the negative condition. (D) Cross-correlation of dyadic AU26 time series: the peak occurred at the 8th lag under the positive condition and at the 7th lag under the negative condition.
Sensors 26 01881 g004
Figure 5. Action unit (AU) temporal precedence effects revealed by multilevel vector autoregression. Each x-axis represents the lag in frames (30 frames per second, 33 ms per frame) and each y-axis the beta coefficient of the directed temporal precedence effect. (A) Smoothed time course of temporal precedence effects under the negative condition. (B) Significant temporal precedence effects under the negative condition. (C) Smoothed time course of temporal precedence effects under the positive condition. (D) Significant temporal precedence effects under the positive condition. The time courses in (A,C) were smoothed with a rolling window of five lags using the rollmean function in R.
Sensors 26 01881 g005
Table 1. Significant action unit 04 cross-correlation coefficients.
LagLatency (ms)MeanSEtpFDRCohen’s d
Negative Condition
13433.3330.0200.0111.8920.0350.0450.371
14466.6670.0220.0102.3350.0140.0190.458
15500.0000.0250.0092.7590.0050.0090.541
16533.3330.0220.0092.5060.0100.0140.491
17566.6670.0230.0092.5640.0080.0130.503
18600.0000.0210.0092.3460.0140.0190.460
19633.3330.0280.0093.0900.0020.0040.606
20666.6670.0310.0093.2630.0020.0030.640
21700.0000.0270.0102.7240.0060.0090.534
22733.3330.0280.0083.4520.0010.0020.677
23766.6670.0320.0083.8050.0000.0010.746
24800.0000.0280.0083.2650.0020.0030.640
25833.3330.0330.0084.0480.0000.0010.794
26866.6670.0340.0084.0710.0000.0010.798
27900.0000.0390.0094.6070.0000.0010.904
28933.3330.0420.0094.9580.0000.0010.972
29966.6670.0430.0094.5700.0000.0010.896
301000.0000.0420.0094.6820.0000.0010.918
311033.3330.0370.0094.0210.0000.0010.789
321066.6670.0390.0104.0520.0000.0010.795
331100.0000.0380.0094.0760.0000.0010.799
341133.3330.0370.0093.9790.0000.0010.780
351166.6670.0350.0103.4520.0010.0020.677
361200.0000.0360.0103.6850.0010.0020.723
371233.3330.0330.0093.5730.0010.0020.701
381266.6670.0310.0103.2280.0020.0030.633
391300.0000.0330.0093.7010.0010.0020.726
401333.3330.0310.0093.4610.0010.0020.679
Positive Condition
301000.0000.0140.0081.7900.0430.4180.351
331100.0000.0130.0071.7710.0440.4180.347
341133.3330.0160.0072.2460.0170.4180.440
Abbreviations. FDR: false discovery rate (Benjamini–Hochberg procedure); p: p-values; SE: standard error; t: t-statistics.
Table 2. Significant action unit 12 cross-correlation coefficients under the positive condition.
LagLatency (ms)MeanSEtpFDRCohen’s d
14466.6670.0410.0231.8090.0410.0570.355
15500.0000.0390.0221.7700.0440.0590.347
16533.3330.0430.0221.9580.0310.0440.384
17566.6670.0480.0222.1870.0190.0340.429
18600.0000.0450.0222.0520.0250.0400.402
19633.3330.0450.0212.1150.0220.0360.415
20666.6670.0430.0212.0200.0270.0410.396
21700.0000.0440.0212.1590.0200.0350.423
22733.3330.0450.0202.2820.0160.0310.448
23766.6670.0440.0192.2420.0170.0320.440
24800.0000.0430.0192.3250.0140.0300.456
25833.3330.0430.0182.3750.0130.0290.466
26866.6670.0420.0182.3740.0130.0290.466
27900.0000.0440.0172.6200.0070.0200.514
28933.3330.0420.0162.6010.0080.0200.510
29966.6670.0410.0152.6520.0070.0200.520
301000.0000.0380.0142.6720.0070.0200.524
311033.3330.0370.0142.7500.0050.0200.539
321066.6670.0370.0132.9150.0040.0200.572
331100.0000.0350.0122.9460.0030.0200.578
341133.3330.0330.0112.9460.0030.0200.578
351166.6670.0320.0113.0030.0030.0200.589
361200.0000.0290.0112.6980.0060.0200.529
371233.3330.0270.0102.6370.0070.0200.517
381266.6670.0270.0102.8520.0040.0200.559
391300.0000.0250.0092.6850.0060.0200.527
401333.3330.0250.0092.8450.0040.0200.558
Abbreviations. FDR: false discovery rate (Benjamini–Hochberg procedure); p: p-values; SE: standard error; t: t-statistics.
Table 3. Significant action unit 25 cross-correlation coefficients.
LagLatency (ms)MeanSEtpFDRCohen’s d
Positive Condition
5166.6670.0230.0102.2650.0160.0990.444
6200.0000.0290.0112.5350.0090.0990.497
8266.6670.0200.0111.8130.0410.0990.355
9300.0000.0200.0101.8790.0360.0990.368
11366.6670.0240.0102.4390.0110.0990.478
12400.0000.0240.0102.3490.0140.0990.461
13433.3330.0200.0111.8960.0350.0990.372
14466.6670.0220.0111.9700.0300.0990.386
15500.0000.0210.0102.1280.0220.0990.417
16533.3330.0200.0111.8870.0350.0990.370
17566.6670.0260.0102.6360.0070.0990.517
18600.0000.0200.0111.8330.0390.0990.359
19633.3330.0210.0111.8100.0410.0990.355
20666.6670.0200.0111.8970.0350.0990.372
21700.0000.0200.0101.9820.0290.0990.389
Negative Condition
5166.6670.0270.0093.0070.0030.0120.590
6200.0000.0220.0082.5870.0080.0140.507
7233.3330.0190.0101.9410.0320.0330.381
8266.6670.0240.0092.7530.0050.0120.540
9300.0000.0220.0092.4980.0100.0150.490
10333.3330.0210.0092.4640.0100.0160.483
11366.6670.0270.0093.0260.0030.0120.593
12400.0000.0260.0083.0480.0030.0120.598
13433.3330.0240.0092.7180.0060.0120.533
14466.6670.0250.0092.7970.0050.0120.549
15500.0000.0260.0092.7190.0060.0120.533
16533.3330.0280.0102.9310.0040.0120.575
17566.6670.0240.0092.5730.0080.0140.505
18600.0000.0280.0083.3890.0010.0120.665
19633.3330.0260.0092.8720.0040.0120.563
20666.6670.0250.0092.7690.0050.0120.543
21700.0000.0240.0092.7620.0050.0120.542
22733.3330.0260.0092.7880.0050.0120.547
23766.6670.0250.0092.7550.0050.0120.540
24800.0000.0230.0082.7500.0050.0120.539
25833.3330.0210.0092.3180.0140.0190.455
26866.6670.0210.0082.7400.0060.0120.537
27900.0000.0240.0092.7900.0050.0120.547
28933.3330.0200.0082.5640.0080.0140.503
29966.6670.0200.0082.3640.0130.0180.464
301000.0000.0210.0082.5800.0080.0140.506
311033.3330.0190.0082.3790.0130.0180.467
321066.6670.0160.0081.9470.0310.0330.382
331100.0000.0180.0082.1320.0220.0270.418
341133.3330.0170.0082.0020.0280.0320.393
351166.6670.0190.0082.3340.0140.0190.458
361200.0000.0190.0082.5330.0090.0150.497
371233.3330.0150.0071.9590.0310.0330.384
381266.6670.0160.0082.0110.0280.0320.394
401333.3330.0150.0072.0030.0280.0320.393
Abbreviations. FDR: false discovery rate (Benjamini–Hochberg procedure); p: p-values; SE: standard error; t: t-statistics.
Table 4. Significant action unit 26 cross-correlation coefficients.
LagLatency (ms)MeanSEtpFDRCohen’s d
Positive Condition
5166.6670.0200.0092.1970.0190.0400.431
6200.0000.0280.0093.1310.0020.0400.614
7233.3330.0250.0102.6150.0070.0400.513
8266.6670.0300.0103.0890.0020.0400.606
9300.0000.0260.0102.4920.0100.0400.489
10333.3330.0250.0092.6020.0080.0400.510
11366.6670.0270.0102.7510.0050.0400.539
12400.0000.0230.0102.3080.0150.0400.453
13433.3330.0240.0102.3430.0140.0400.459
14466.6670.0230.0112.1480.0210.0400.421
15500.0000.0260.0112.3330.0140.0400.458
16533.3330.0230.0102.2880.0150.0400.449
17566.6670.0220.0111.9650.0300.0420.385
18600.0000.0250.0122.1350.0210.0400.419
19633.3330.0250.0112.2220.0180.0400.436
20666.6670.0210.0121.8600.0370.0460.365
21700.0000.0220.0121.7870.0430.0480.351
22733.3330.0200.0111.7600.0450.0490.345
23766.6670.0250.0122.1610.0200.0400.424
24800.0000.0210.0121.8610.0370.0460.365
25833.3330.0220.0112.0160.0270.0420.395
26866.6670.0230.0102.2130.0180.0400.434
27900.0000.0210.0102.0240.0270.0420.397
28933.3330.0240.0092.6080.0080.0400.511
29966.6670.0190.0092.1700.0200.0400.426
301000.0000.0180.0082.0950.0230.0410.411
311033.3330.0170.0091.9290.0330.0430.378
321066.6670.0150.0081.9980.0280.0420.392
331100.0000.0140.0071.8270.0400.0460.358
341133.3330.0160.0072.2150.0180.0400.434
351166.6670.0140.0072.0840.0240.0410.409
361200.0000.0130.0071.9810.0290.0420.389
381266.6670.0130.0071.8260.0400.0460.358
Negative Condition
5166.6670.0280.0102.8730.0040.0410.563
6200.0000.0260.0102.7280.0060.0410.535
7233.3330.0230.0102.3410.0140.0410.459
8266.6670.0230.0092.3890.0120.0410.468
9300.0000.0280.0093.0250.0030.0410.593
10333.3330.0250.0092.6290.0070.0410.516
11366.6670.0230.0102.3960.0120.0410.470
12400.0000.0240.0102.4420.0110.0410.479
13433.3330.0220.0092.3940.0120.0410.469
14466.6670.0190.0092.1120.0220.0580.414
15500.0000.0250.0102.6320.0070.0410.516
16533.3330.0190.0101.9800.0290.0620.388
17566.6670.0200.0092.3770.0130.0410.466
18600.0000.0210.0092.5120.0090.0410.493
19633.3330.0180.0082.2000.0190.0520.431
21700.0000.0180.0091.8530.0380.0720.363
22733.3330.0180.0091.9930.0290.0620.391
24800.0000.0180.0091.9890.0290.0620.390
27900.0000.0170.0091.9530.0310.0620.383
Abbreviations. FDR: false discovery rate (Benjamini–Hochberg procedure); p: p-values; SE: standard error; t: t-statistics.
Table 5. Significant android–human action unit (AU) temporal effects under the negative condition.
Lag (Frame)Latency (ms)βSEpFDR
Android AU04 to Participant AU04
5166.6670.0180.0080.0280.029
6200.0000.0190.0080.0180.020
7233.3330.0180.0090.0320.032
8266.6670.0200.0090.0200.021
9300.0000.0220.0100.0200.021
10333.3330.0250.0100.0100.013
11366.6670.0240.0100.0140.018
12400.0000.0240.0100.0160.019
13433.3330.0260.0110.0170.020
14466.6670.0280.0100.0040.006
15500.0000.0310.0090.0000.004
16533.3330.0280.0100.0060.009
17566.6670.0250.0100.0140.018
18600.0000.0250.0090.0070.009
19633.3330.0310.0100.0020.005
20666.6670.0350.0110.0010.005
21700.0000.0320.0110.0030.006
22733.3330.0310.0110.0050.008
23766.6670.0350.0110.0020.005
24800.0000.0310.0110.0050.008
25833.3330.0370.0120.0020.005
26866.6670.0380.0120.0020.005
27900.0000.0480.0130.0000.003
28933.3330.0530.0140.0000.002
29966.6670.0540.0140.0000.002
301000.0000.0520.0140.0000.002
311033.3330.0450.0140.0010.005
321066.6670.0490.0150.0010.005
331100.0000.0500.0150.0010.005
341133.3330.0490.0150.0020.005
351166.6670.0500.0160.0020.005
361200.0000.0530.0160.0010.005
371233.3330.0490.0150.0020.005
381266.6670.0470.0160.0040.006
391300.0000.0470.0150.0020.005
401333.3330.0460.0170.0060.009
Android AU04 to Participant AU25
5166.6670.0140.0050.0030.046
6200.0000.0110.0050.0250.101
7233.3330.0120.0050.0170.078
8266.6670.0180.0040.0000.000
9300.0000.0140.0050.0110.060
10333.3330.0150.0050.0050.060
11366.6670.0140.0050.0120.060
12400.0000.0130.0050.0070.060
13433.3330.0130.0060.0390.130
14466.6670.0130.0070.0430.130
15500.0000.0170.0070.0110.060
23766.6670.0200.0100.0410.130
Android AU25 to Participant AU25
18600.0000.0190.0090.0390.164
22733.3330.0220.0100.0190.164
23766.6670.0200.0100.0380.164
24800.0000.0230.0100.0200.164
27900.0000.0190.0080.0160.164
301000.0000.0190.0090.0360.164
Android AU26 to Participant AU26
5166.6670.0210.0090.0190.145
7233.3330.0170.0080.0330.145
8266.6670.0200.0080.0130.145
9300.0000.0210.0100.0290.145
10333.3330.0220.0090.0180.145
11366.6670.0190.0090.0360.145
12400.0000.0170.0090.0490.146
13433.3330.0180.0080.0350.145
15500.0000.0180.0080.0330.145
18600.0000.0170.0080.0310.145
22733.3330.0150.0070.0430.146
23766.6670.0140.0070.0480.146
Abbreviations. β: beta coefficient; FDR: false discovery rate (Benjamini–Hochberg procedure); p: p-values; SE: standard error.
Table 6. Significant android–human action unit (AU) temporal effects under the positive condition.
Lag (Frame)Latency (ms)βSEpFDR
Android AU12 to Participant AU12
5166.6670.0210.0470.0470.265
6200.0000.0210.0440.0440.265
7233.3330.0260.0300.0300.265
Android AU12 to Participant AU26
9300.0000.0240.0450.0450.136
11366.6670.0280.0320.0320.127
12400.0000.0390.0030.0030.083
13433.3330.0320.0170.0170.085
14466.6670.0420.0050.0050.083
15500.0000.0340.0140.0140.083
16533.3330.0380.0130.0130.083
17566.6670.0370.0120.0120.083
18600.0000.0350.0200.0200.089
20666.6670.0430.0100.0100.083
24800.0000.0390.0350.0350.127
Android AU25 to Participant AU25
19633.3330.0240.0400.0400.227
21700.0000.0250.0380.0380.227
22733.3330.0260.0160.0160.227
26866.6670.0280.0420.0420.227
Android AU25 to Participant AU12
5166.667−0.0320.0180.0180.108
6200.000−0.0320.0190.0190.108
7233.333−0.0320.0180.0180.108
8266.667−0.0320.0140.0140.108
9300.000−0.0280.0270.0270.108
10333.333−0.0310.0080.0080.108
11366.667−0.0300.0270.0270.108
12400.000−0.0290.0290.0290.108
13433.333−0.0320.0170.0170.108
14466.667−0.0290.0300.0300.108
15500.000−0.0270.0350.0350.108
16533.333−0.0280.0360.0360.108
18600.000−0.0280.0490.0490.135
Abbreviations. β: beta coefficient; FDR: false discovery rate (Benjamini–Hochberg procedure); p: p-values; SE: standard error.
Disclaimer/Publisher’s Note: The statements, opinions and data contained in all publications are solely those of the individual author(s) and contributor(s) and not of MDPI and/or the editor(s). MDPI and/or the editor(s) disclaim responsibility for any injury to people or property resulting from any ideas, methods, instructions or products referred to in the content.