4.1. Datasets and Experimental Settings
To evaluate the detection performance of the proposed method, experiments are primarily conducted on the VisDrone2019 dataset, and cross-dataset evaluation is conducted on the DIOR and UAVVaste datasets. These three datasets differ significantly in scene type, number of categories, and object scale distribution, enabling evaluation of the model’s adaptability and robustness from different perspectives.
VisDrone2019 [
2,
4] is a UAV-scenario object detection dataset containing 10 categories, with 6471, 548, and 1610 images in the training, validation, and test sets, respectively. The dataset is characterized by complex backgrounds, dense objects, and high proportions of small objects, and is used as the primary experimental dataset.
DIOR [
21] is a large-scale remote sensing object detection dataset containing 20 categories, with 16,424, 2346, and 4693 images in the training, validation, and test sets, respectively. Compared to VisDrone2019, its scene types and category compositions are more diverse, enabling evaluation of the model’s detection performance in complex remote sensing scenarios.
UAVVaste [
22] is a UAV aerial garbage detection dataset containing only 1 category, with 540, 116, and 116 images in the training, validation, and test sets, respectively. Although relatively small in scale, its task is clearly defined and can be used to validate the model’s detection effectiveness in specific application scenarios.
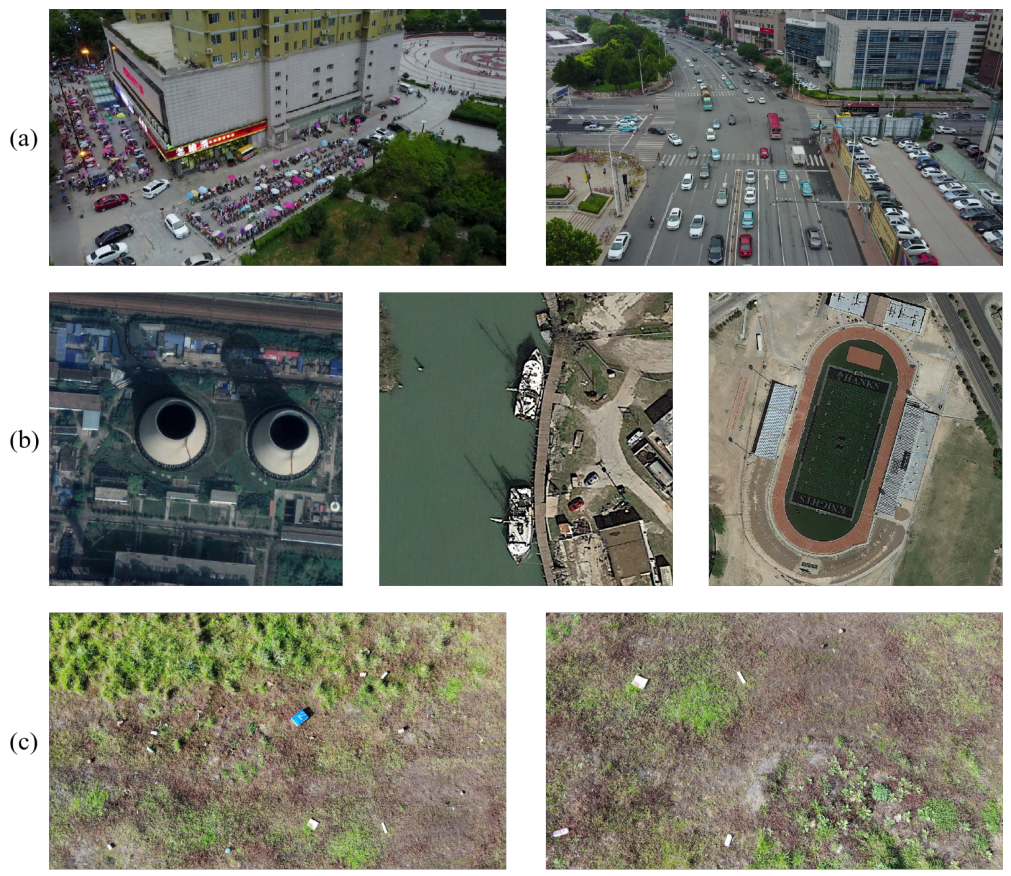
As shown in
Figure 6, the three datasets differ significantly in scene content and object presentation. VisDrone2019 is primarily composed of urban scenes from a UAV perspective with dense object distribution and complex backgrounds; DIOR covers diverse remote sensing scenes such as harbors, storage tanks, and stadiums with more complex categories and spatial structures; UAVVaste features relatively simple scenes but with extremely small and sparsely distributed objects.
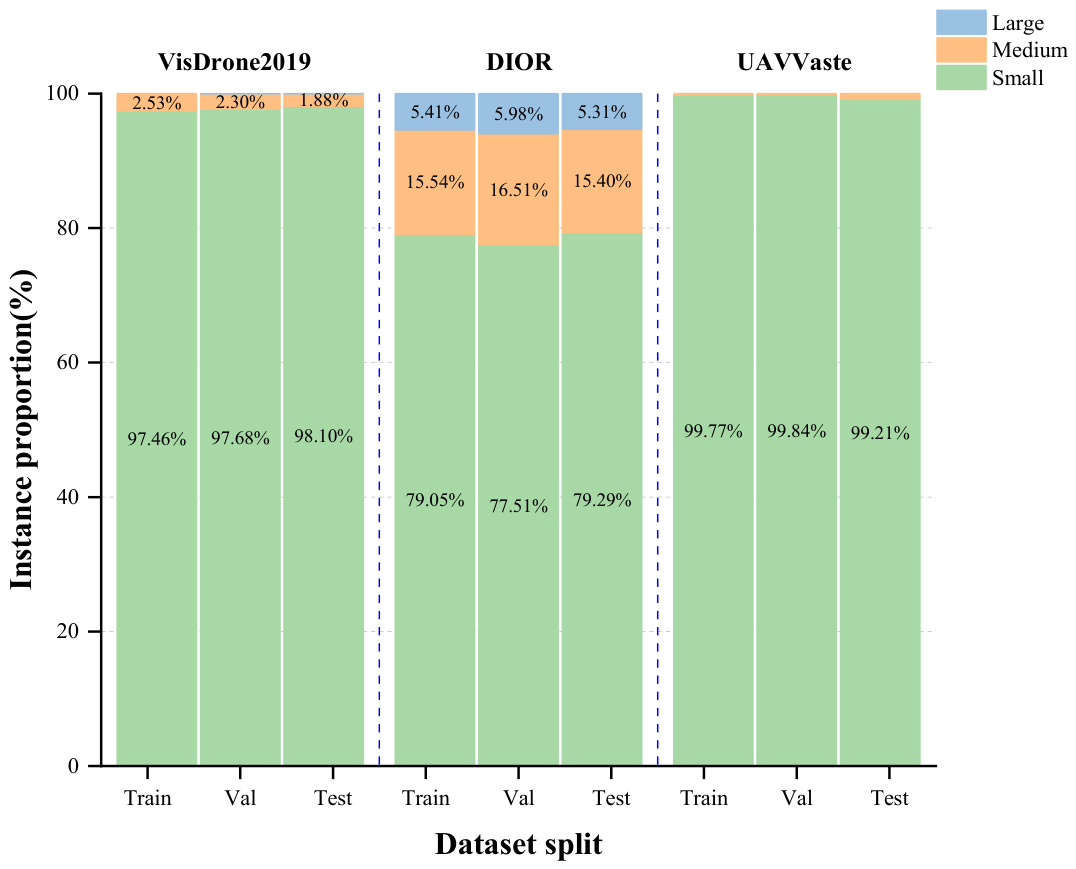
To further analyze the object scale distribution of each dataset, normalized area
is adopted to partition instance sizes, where
w and
h denote the width and height of the bounding box, and
W and
H denote the image width and height. Small objects satisfy
, medium objects satisfy
, and large objects satisfy
.
Figure 7 presents the instance scale ratio statistics for each dataset. The three datasets are all dominated by small objects: the small-object proportion in VisDrone2019 is approximately 97–98%; in DIOR approximately 78–79% with a certain proportion of medium and large objects; and in UAVVaste almost entirely small objects with a proportion exceeding 99%.
All experiments are conducted on an NVIDIA GeForce RTX 4090 D GPU, implemented based on PyTorch 2.3.0 and CUDA 12.1. The DEIM (D-FINE-S) baseline and all PFE-Det variants are trained from scratch with random initialization (backbone pretrained weights disabled; reproducibility seed set to 0). Following the DEIM training recipe and the composite objective in Equation (
2), we use AdamW (learning rate
for the head/encoder/decoder and
for the backbone; weight decay
;
) with a flat-cosine learning-rate schedule (2000-iteration warmup; lr_gamma
), EMA (decay
), and a total batch size of 4. The input resolution is uniformly set to
. On VisDrone2019 and UAVVaste, models are trained for 300 epochs with strong augmentation disabled after epoch 288; on DIOR, training lasts 250 epochs with strong augmentation disabled after epoch 238. No early stopping is applied. On VisDrone2019, models are trained on the training split. The Stage-2 best checkpoint is selected on the validation split, and all reported detection metrics are evaluated on the test-dev split (1610 images) under COCO-style metrics. For the competing detectors, we train and evaluate each method on VisDrone2019 using its official default configuration, without additional VisDrone-specific hyperparameter tuning; RemDet-S [
28] and FRFDet-T/S/M [
41] are included as recent lightweight UAV detectors under their respective official default configurations.
4.3. Ablation Study
To validate the effectiveness of each core component and their synergistic mechanism in the proposed method, rigorous ablation experiments are conducted on the VisDrone2019 test-dev split with DEIM-D-FINE-S as the baseline (Baseline). Quantitative results are shown in
Table 1.
As shown in
Table 1, the independent introduction of each module yields varying degrees of detection performance improvement, validating the soundness of the corresponding designs.
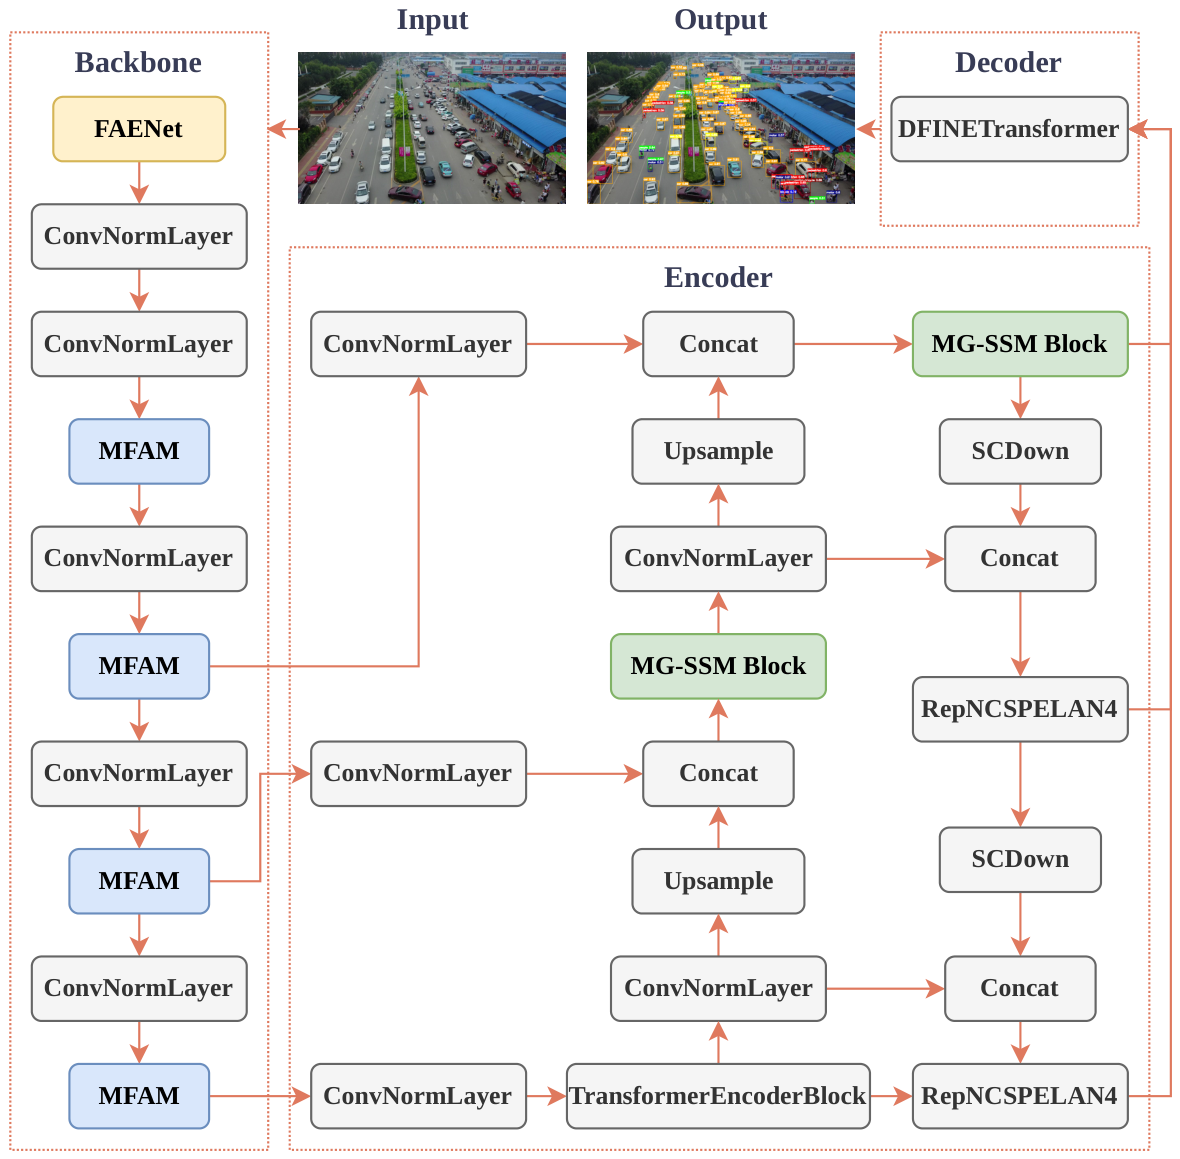
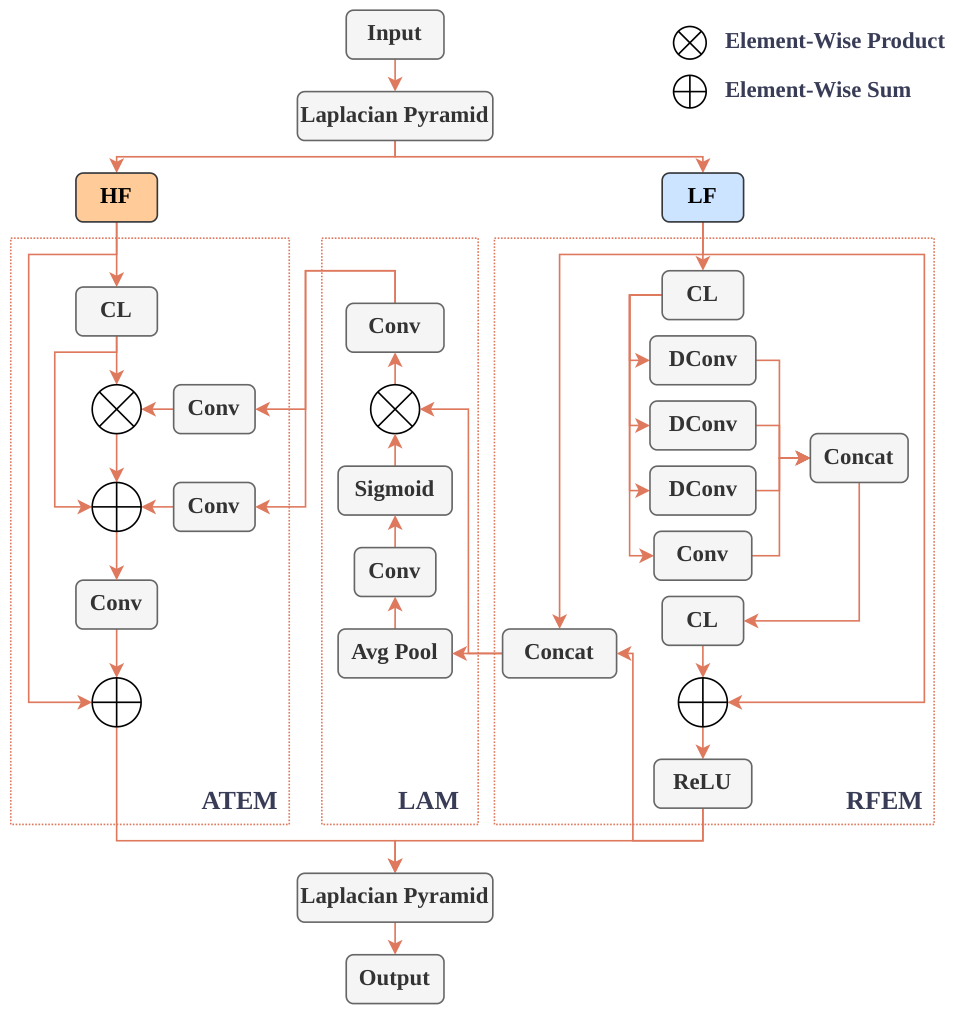
FAENet alone: AP improves from 0.203 to 0.211, and from 0.118 to 0.125. This result confirms that FAENet’s high-low frequency decoupling mechanism based on the Laplacian pyramid can alleviate the smoothing effect of early convolutional layers on fine-grained information of extremely small objects. By separating and adaptively enhancing low-frequency structure and high-frequency details, the network’s capacity for fine-grained feature retention is enhanced. Meanwhile, this preprocessing module adds only 0.04 M parameters, preserving favorable architectural compactness.
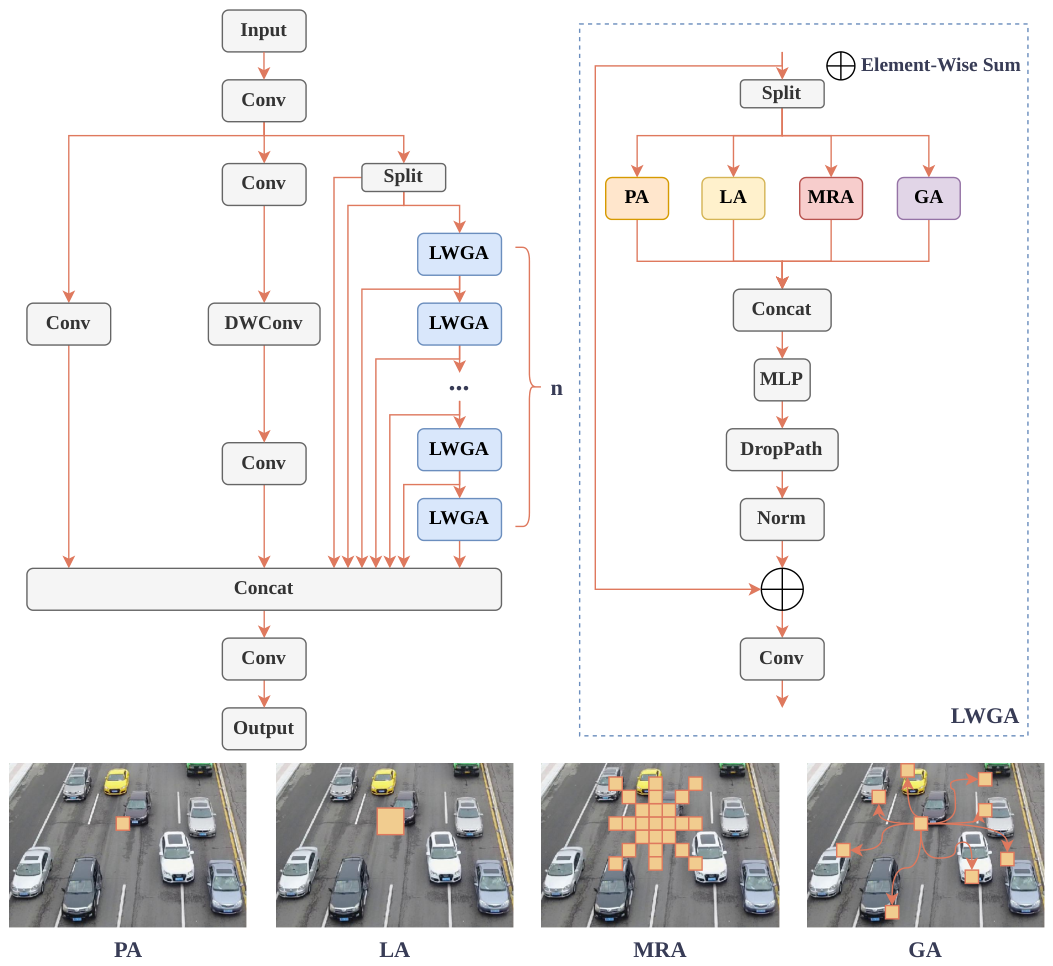
MFAM alone: Overall AP improves to 0.218, and medium-object precision reaches 0.312. Unlike traditional single convolutional paths where fine-grained structures are continuously overwritten, MFAM reorganizes the single path into independent structure-retaining and progressive enhancement paths through multi-path feature decomposition, effectively preserving local structural information and transmitting it stably to deeper layers. This ensures that context at different scales can be precisely aligned in a unified feature space, enhancing the model’s adaptability to drastic scale variation in UAVscenarios.
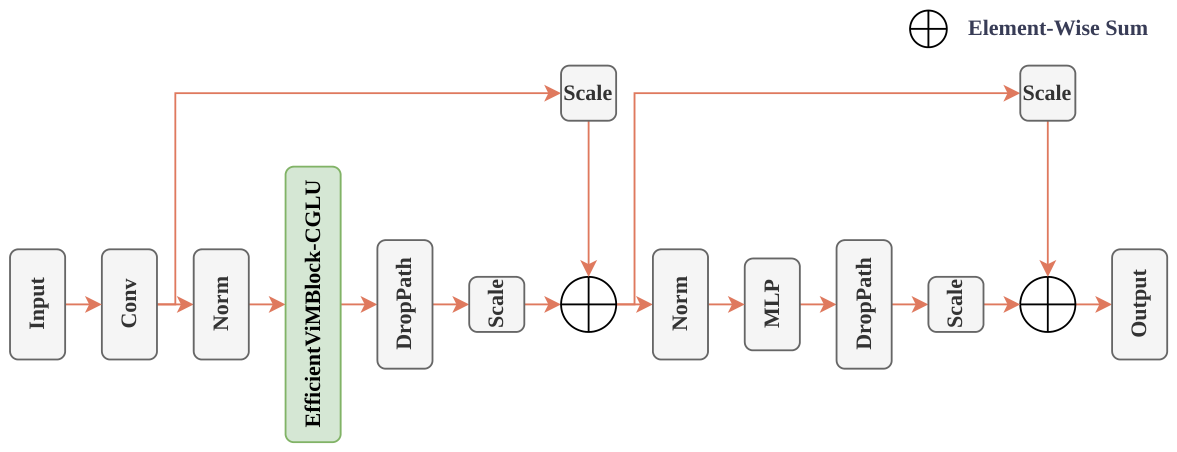
MG-SSM Block alone: AP improves to 0.210, while computational load (GFLOPs) decreases from the baseline’s 24.86 to 23.64. This reduction stems from its state-space-driven feature interaction structure, which maps 2D spatial features to 1D sequences and achieves global information interaction across positions through dynamic propagation of hidden states. Combined with CGLU for adaptive nonlinear feature selection, the block extracts long-range dependencies efficiently while reducing overall floating-point operations.
Beyond individual contributions, the interaction patterns among modules reveal critical dependencies within the progressive feature evolution framework.
FAENet+MFAM: As shown in
Table 1, +FAENet+MFAM attains the same overall AP (0.218) as +MFAM alone. A scale-wise decomposition shows that the two configurations are not equivalent:
increases from 0.129 to 0.132, whereas
decreases from 0.427 to 0.404, with slight declines in
(0.380 → 0.378) and
(0.220 → 0.218). The unchanged aggregate AP therefore arises from an offset between a small-object gain and a large-object loss. Two complementary factors help explain this redistribution. First, MFAM already supplies multi-path structural preservation and hierarchical receptive-field coverage; once these mechanisms are present, medium- and large-object discrimination is largely saturated, so front-end frequency enhancement yields only limited additional benefit to the COCO-averaged AP. Second, without the encoder-level gated selection of the MG-SSM Block, the high-frequency components restored by FAENet are not selectively purified: they remain beneficial for extremely small objects with sparse pixel support, but can introduce texture-level interference over large object regions and slightly degrade localization quality. Overall, the effect of FAENet on top of MFAM is scale-selective and becomes more fully expressed once the subsequent MG-SSM stage completes the progressive evolution pathway, as indicated by the full model (AP 0.225,
0.134,
0.439).
Combination ablation study (+FAENet+MG-SSM): When FAENet and the MG-SSM Block are integrated simultaneously without MFAM (+FAENet+MG-SSM), AP drops to 0.196, falling below the baseline (0.203). The degradation spans multiple scales:
,
, and
all decline relative to the baseline (0.111/0.277/0.397 vs. 0.118/0.289/0.412). From an architectural perspective, FAENet and MG-SSM operate at opposite ends of the network and target different defects—input-level frequency restoration versus encoder-level global sequence interaction. Without MFAM as an intermediate multi-path reorganization stage, FAENet-enriched high-frequency responses must traverse a conventional single-path backbone that neither separates structure-retaining from progressive-enhancement streams nor aligns multi-scale spatial contexts. The encoder therefore receives a mixture of weak object cues and spatially correlated background texture. Because selective state space models propagate information across the full sequence with a global receptive field, residual high-frequency background components are broadcast rather than suppressed, contaminating task-relevant representations and impairing both classification and localization. From an information-bottleneck viewpoint [
12], FAENet increases the fine-grained information available at the network entrance; yet without MFAM as a structured bottleneck that filters and reorganizes this information, the subsequent global mixer cannot form a compact task-relevant representation and instead amplifies local noise. Consistent with this interpretation, +FAENet+MG-SSM underperforms the baseline as well as +MG-SSM alone (AP 0.210) and +FAENet alone (AP 0.211), whereas +MFAM+MG-SSM recovers AP to 0.222, indicating that MFAM provides a critical context-transition stage in the feature flow path.
Full model: Crucially, once MFAM is reintroduced to bridge FAENet and MG-SSM Block, the performance degradation is not only resolved but surpassed. When all three modules are integrated, the model achieves optimal detection performance with an overall AP of 0.225 and of 0.134. Notably, the full model’s computational overhead (36.91 GFLOPs) is slightly lower than that of +FAENet+MFAM (38.07 GFLOPs), despite incorporating the additional MG-SSM Block. This is consistent with the observation that the standalone +MG-SSM configuration (23.64 GFLOPs) consumes fewer floating-point operations than the baseline (24.86 GFLOPs): the MG-SSM Block restructures the encoder’s feature interaction mechanism using SSM-based modeling at linear complexity, which introduces a net GFLOPs reduction in the encoder stage. When integrated into the full model, this reduction partially offsets the overhead introduced by FAENet and MFAM. Although the overall computational overhead increases compared to the baseline, considering the 13.5% relative improvement in , this increase in computational cost is acceptable in specific application scenarios with extremely high requirements for small-object recall (e.g., offline dense inspection from high altitude).
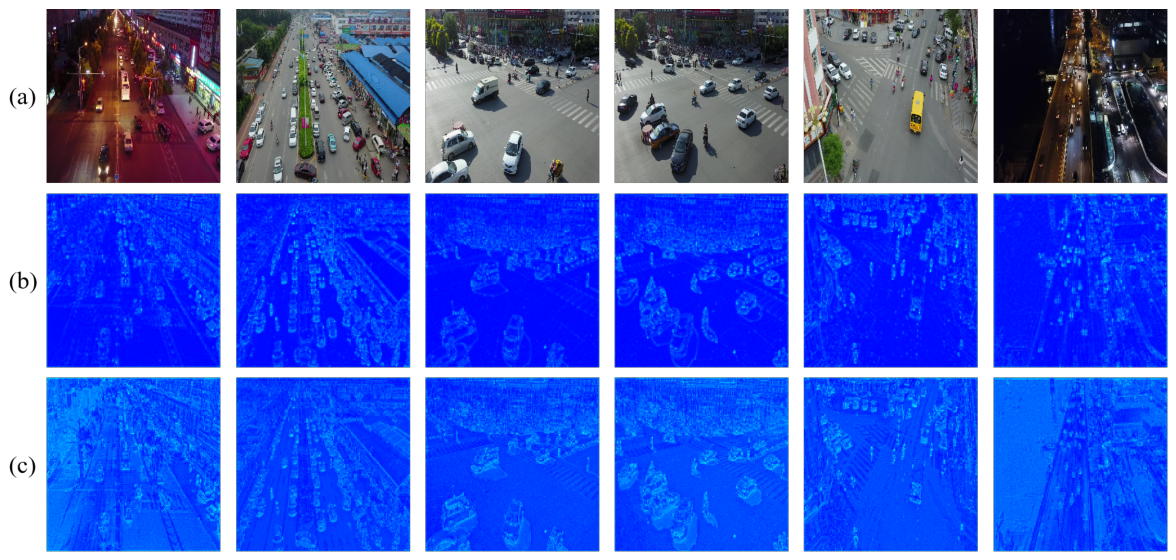
The preceding quantitative analysis validates the effectiveness of each module and their synergy through numerical metrics. To further verify the underlying mechanisms, we present qualitative visualizations that examine feature representation, spatial localization, and complex scene adaptability through feature maps, heat maps, and final detectionresults.
Figure 8 shows the activation states of the model in the shallow feature extraction stage. The feature maps of the baseline model exhibit predominantly attenuated and diffuse activation patterns. Due to the smoothing effect of conventional convolution operations, the high-frequency edge information of images suffers severe attenuation, making it difficult to clearly distinguish the contours of densely distributed small objects such as distant vehicles and pedestrians. In contrast, PFE-Det’s feature maps exhibit rich spatial textures and structural details, with object entities showing bright and sharp edge responses forming strong feature contrast with the surrounding background.
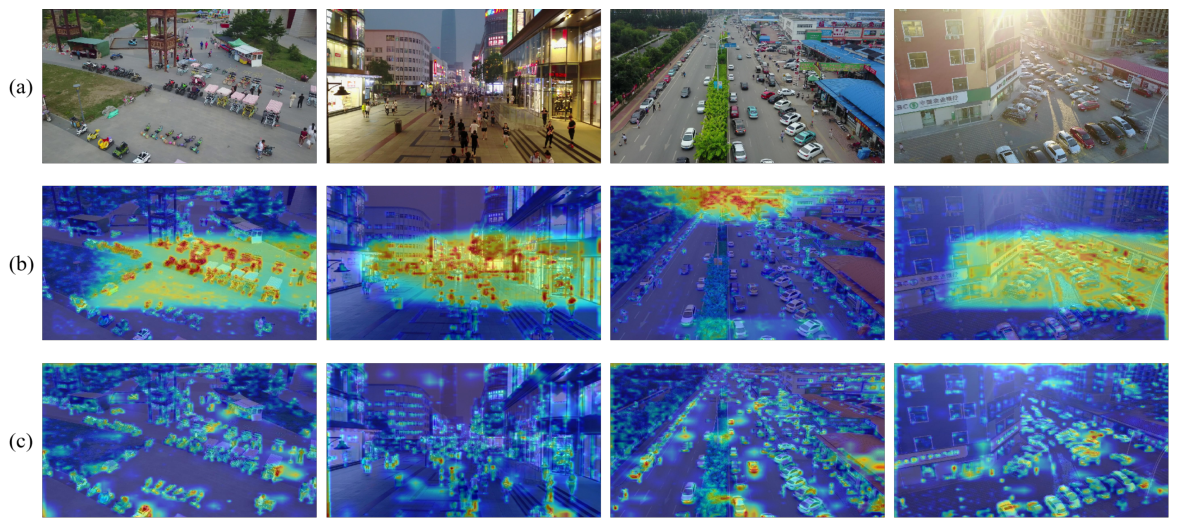
Figure 9 further examines the deep-layer feature representations through KPCA_CAM (Kernel PCA-based Class Activation Mapping) to visualize the nonlinear responses of features. KPCA_CAM is a gradient-free class activation mapping method that applies Kernel PCA to the activation tensors of specified target layers; in this work, a sigmoid kernel is used with the default bandwidth parameter
. The baseline model’s heat distribution shows a significant “contiguous blob” phenomenon when facing dense non-motorized vehicles, commercial street crowds, and parking lot traffic, indicating that the model cannot effectively separate densely arranged adjacent entities due to degradation of spatial structure information during continuous transformations. After introducing the improved architecture, the heat map’s spatial distribution undergoes a marked transformation: the large-area contiguous responses are effectively broken up, replaced by highly focused discrete point-like activation regions precisely anchored on individual vehicle and pedestrian instances, with activation of irrelevant backgrounds significantly suppressed.
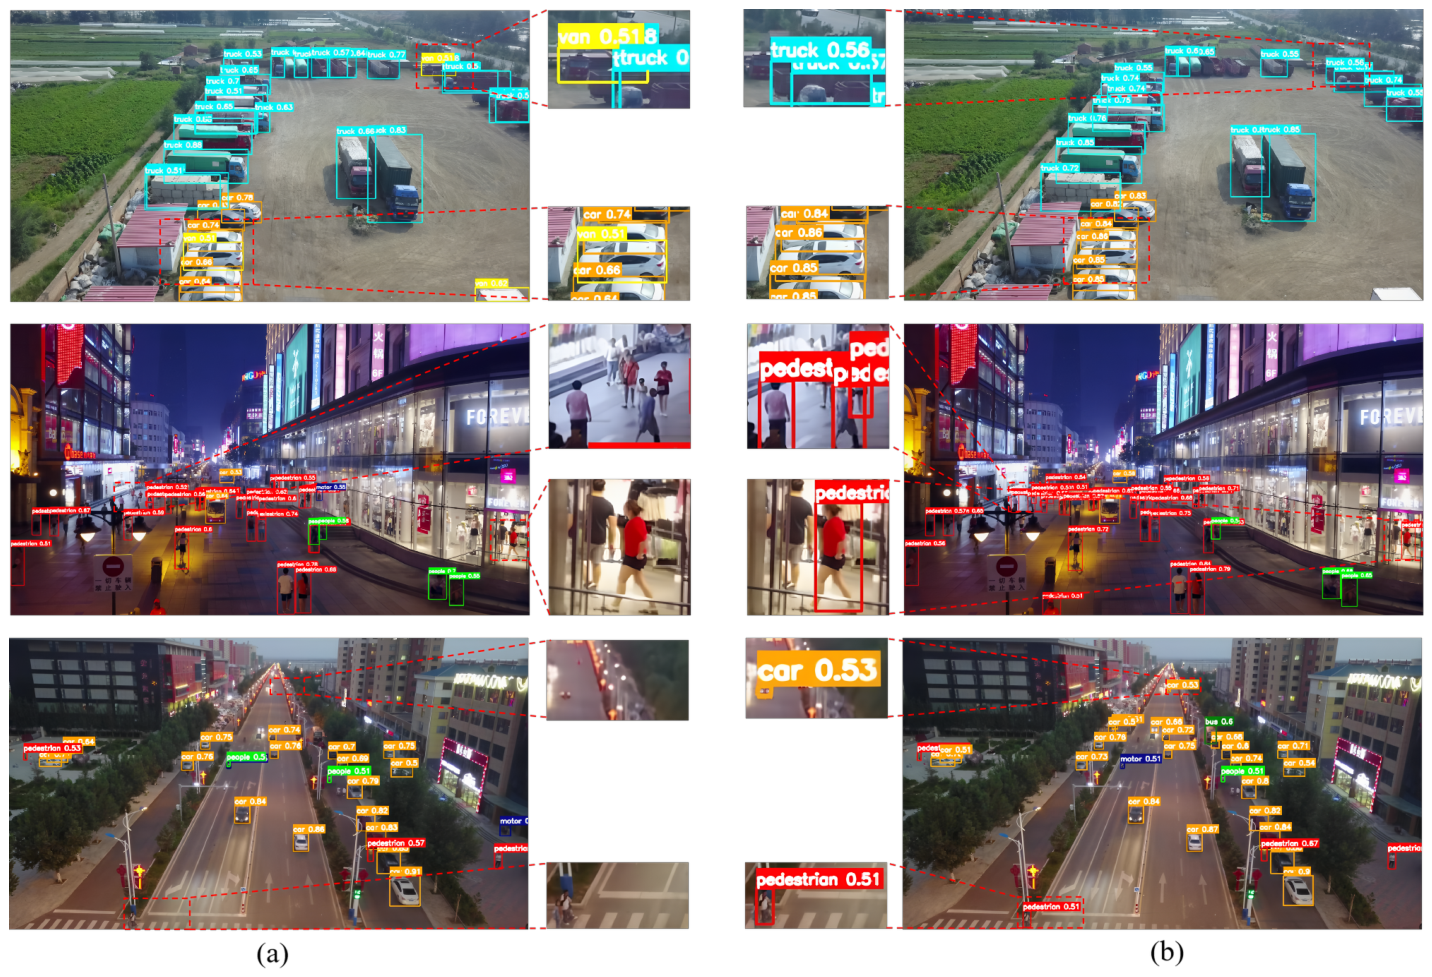
Finally,
Figure 10 presents the final detection result comparison in actual complex UAV-perspective scenarios. Two improvements are observed: first, under extremely low illumination and long shadow scenes, PFE-Det demonstrates superior small-object recall capability; second, in complex scenes with extremely dense objects and high inter-class feature similarity, PFE-Det significantly suppresses false detections and misclassifications caused by local feature confusion.
4.4. Comparison Experiments
To comprehensively validate the comparative performance of the proposed method, detailed experiments are conducted on the VisDrone2019 test-dev split, comparing the proposed model (PFE-Det-N, PFE-Det-S, PFE-Det-M) with representative object detection algorithms. Comparison models cover classical two-stage networks (Faster R-CNN [
6], Cascade R-CNN [
42]), mainstream single-stage and anchor-free networks (RetinaNet [
43], TOOD [
44], GFL [
45], RTMDet [
46], YOLOX [
47], RT-DETR [
9]), the latest YOLO series variants (YOLOv5, YOLOv8, YOLOv10, and YOLO11–YOLO13 [
48], YOLOE-11m [
49], YOLO26 [
50], YOLO-Master [
51], and FBRT-YOLO [
52]), and recent lightweight UAV detectors RemDet-S [
28] and FRFDet-T/S/M [
41]. Quantitative performance evaluation metrics are detailed in
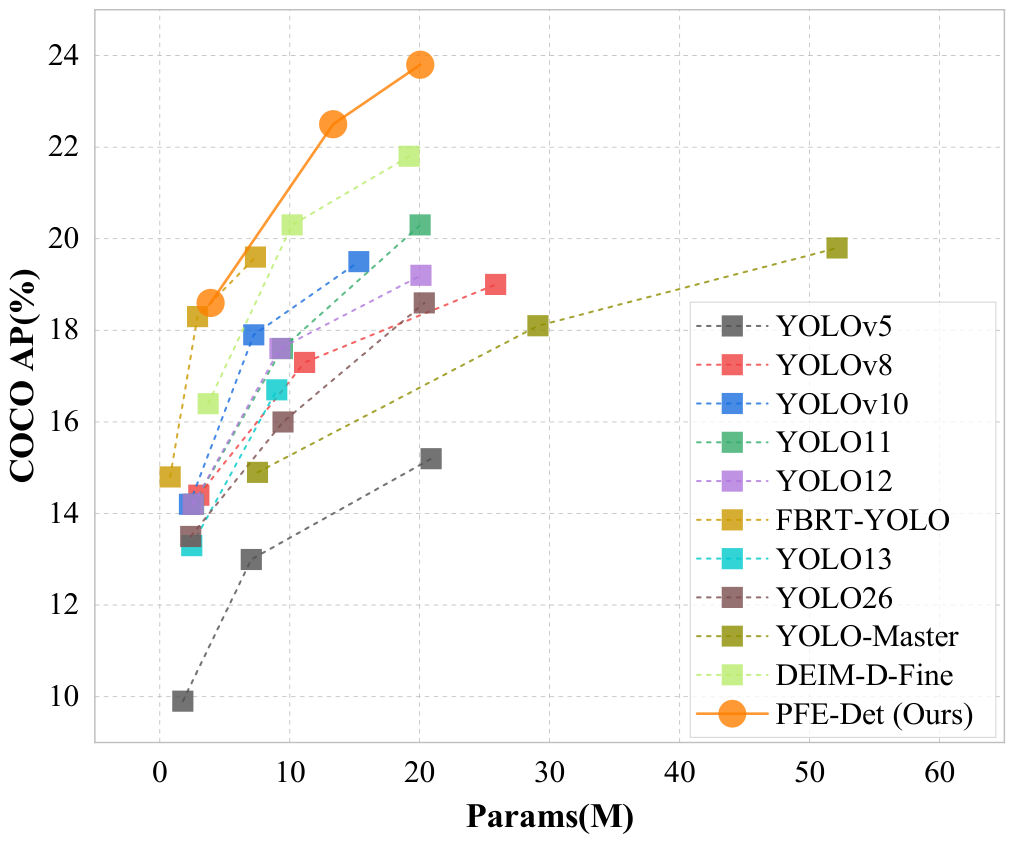
Table 2, and the accuracy–parameters tradeoff is shown in
Figure 11. In this table, PFE-Det and the DEIM baselines follow the from-scratch DEIM training protocol described above, whereas the remaining detectors are trained with their respective official default settings on the same VisDrone2019 splits and evaluated under the same COCO-style metrics on test-dev; the comparison is therefore a non-uniform reference under each method’s official default configuration.
In resource-constrained UAV edge computing platforms, the tradeoff between model accuracy and parameter count is the core metric for evaluating the practical value of an algorithm. As shown in
Figure 11, the proposed PFE-Det series models construct a favorable Pareto front in the upper-left region of the coordinate system across all scalable detector families. Specifically, PFE-Det-M achieves the highest overall detection accuracy (AP of 0.238) with a moderate parameter scale of 20.05 M. As further evidenced by
Table 2, this accuracy substantially exceeds that of traditional heavy networks such as Cascade R-CNN-R50-FPN (69.29 M parameters, an AP of only 0.197) and ATSS-R50-FPN-DyHead (38.91 M, AP 0.204).
In the approximately 20 M parameter track, PFE-Det-M (20.05 M, AP 0.238) demonstrates clear performance superiority. Compared with the latest models at a comparable scale, YOLO11m (20.04 M) and YOLO12m (20.11 M) achieve an AP of only 0.203 and 0.192, respectively; compared to the baseline model DEIM-D-FINE-M (19.19 M, AP 0.218), PFE-Det-M achieves a 2.0 absolute percentage point accuracy gain with only a modest increase in computational cost (60.02 vs. 56.37 GFLOPs). At the same time,
and
rise from 0.129/0.307 to 0.145/0.336, while
decreases slightly from 0.394 to 0.384 (
Table 2). To examine this mild
change, we further report class-wise
on VisDrone2019 test-dev together with the number of large ground-truth instances under the COCO area criterion (
;
Table 3). Class-wise
increases for seven categories and decreases only for people, motor, and bicycle. The aggregate
decrease is concentrated in these three classes (
/
/
), which together contribute only 14 large instances (0.58% of all large GTs). By contrast,
increases for the large-object–dominant categories car, van, truck, bus, and awning-tricycle, which account for most large instances. Thus the M-scale
dip is associated with an extremely sparse large-object subset and should be interpreted with caution. Consistently, PFE-Det-N and PFE-Det-S improve
over their DEIM counterparts on VisDrone (0.336 → 0.368 and 0.412 → 0.439), and PFE-Det-S also improves
on DIOR and UAVVaste (0.795 → 0.803 and 0.590 → 0.635).
In the lightweight track, PFE-Det-S (13.33 M) also achieves a high AP of 0.225, consistently surpassing YOLOv8s (11.13 M, AP 0.173) and YOLO-Master-n (7.51 M, AP 0.149). RemDet-S (12.84 M, AP 0.204) attains comparable overall accuracy to DEIM-D-FINE-S (0.203) at lower computational cost (16.31 GFLOPs). FRFDet-T (2.60 M, AP 0.161) offers a more compact UAV-oriented baseline with 9.8 GFLOPs, but trails PFE-Det-N (3.92 M, AP 0.186; 0.105 vs. 0.073) under the same test-dev COCO protocol. FRFDet-S (9.33 M, AP 0.190; 0.091) remains below PFE-Det-S (13.33 M, AP 0.225; 0.134), and FRFDet-M (17.42 M, AP 0.213; 0.110) remains below PFE-Det-M (20.05 M, AP 0.238; 0.145) despite higher GFLOPs (98.0 vs. 60.02).
Regarding the critical challenge of extremely small object detection in UAV aerial scenarios, PFE-Det achieves substantial gains in
. As shown in
Table 2, current mainstream advanced models encounter severe performance bottlenecks when facing small objects (e.g., TOOD-R50
0.102, YOLO-Master-m
0.100, Cascade R-CNN
0.099). However, the lightest PFE-Det-N (3.92 M) already achieves an
of 0.105, surpassing the majority of medium-to-large networks; and the
of PFE-Det-M reaches 0.145, setting a strong reference among the compared methods for small-object detection.
From the computational efficiency perspective, the proposed models achieve a favorable accuracy–GFLOPs tradeoff compared to methods at similar accuracy levels. PFE-Det-S (36.91 GFLOPs) attains an AP of 0.225, substantially exceeding YOLOv5m (48.0 GFLOPs, AP 0.152) and YOLOv10m (58.9 GFLOPs, AP 0.195), which require 30–60% more computation yet deliver considerably lower accuracy. Among methods in the 60–70 GFLOPs range, PFE-Det-M (60.02 GFLOPs, AP 0.238) surpasses YOLO11m (67.7 GFLOPs, AP 0.203), YOLO12m (67.2 GFLOPs, AP 0.192), and YOLO26m (67.9 GFLOPs, AP 0.186) while consuming approximately 11% fewer floating-point operations. Compared to traditional heavy architectures such as Faster R-CNN (208 GFLOPs, AP 0.194) and GFL (206 GFLOPs, AP 0.193), PFE-Det-S achieves markedly higher accuracy at less than one-fifth of the computational cost.
Table 4 further compares the DEIM baselines and PFE-Det variants under the unified runtime protocol above. Relative to the matched DEIM counterpart, PFE-Det-N/S/M increase end-to-end latency from 9.58/10.56/14.83 ms to 12.55/16.29/18.23 ms and reduce FPS from 104.38/94.65/67.41 to 79.69/61.37/54.85, while checkpoint size grows modestly (14.5 → 15.2 MB, 39.2 → 51.3 MB, and 73.7 → 77.0 MB). The S-scale overhead is the most pronounced because progressive feature evolution expands multi-path and multi-scale modeling in the backbone–encoder pathway; nevertheless, PFE-Det-S still sustains real-time throughput above 60 FPS on an RTX 4090 D, and the corresponding AP/
gains (0.203 → 0.225 and 0.118 → 0.134) indicate a favorable accuracy–latency tradeoff for offline or ground-station processing. The present desktop-GPU latency/FPS figures therefore serve as a high-end reference; watt-level energy metering and onboard measurements on embedded UAV platforms (e.g., Jetson-class devices) are left for future work, and edge deployment remains contingent on complementary compression and acceleration (
Section 5).
4.5. Cross-Dataset Validation
To evaluate cross-dataset applicability, we conduct independent training-and-testing experiments on the DIOR large-scale remote sensing dataset and the UAVVaste UAV garbage detection dataset. Specifically, both PFE-Det-S and the baseline DEIM-D-FINE-S are trained on each target dataset using the same DEIM training recipe without dataset-specific hyperparameter tuning (optimizer, augmentation policy, and learning-rate schedule); training epochs follow the dataset configuration (250 for DIOR and 300 for UAVVaste). All results are shown in
Table 5 and
Table 6.
The DIOR dataset covers 20 complex remote sensing categories, with a significantly higher proportion of medium and large objects compared to VisDrone (medium and large objects combined account for approximately 21% of instances in DIOR, versus only ∼2–3% in VisDrone). As shown in
Table 5, without targeted hyperparameter tuning, PFE-Det-S’s overall AP on DIOR improves from 0.650 to 0.657. Notably, the model demonstrates favorable adaptability on medium objects (
from 0.508 to 0.517) and large objects (
from 0.795 to 0.803). A slight decrease in
of 0.006 (0.311 to 0.305) occurs; under unfamiliar wide-area remote sensing noise such as cloud layers and terrain textures, the MG-SSM module’s global gating mechanism tends to apply a stricter feature purification strategy. The increase in
from 0.705 to 0.711 demonstrates that the model achieves an overall improvement in detection quality at the cost of a slight reduction in edge small-object recall.
Table 5.
Cross-dataset validation results on DIOR. The better result for each metric is in bold.
Table 5.
Cross-dataset validation results on DIOR. The better result for each metric is in bold.
| Model | AP | | | | | | Params (M) | GFLOPs |
|---|
| DEIM-D-FINE-S | 0.650 | 0.861 | 0.705 | 0.311 | 0.508 | 0.795 | 10.19 | 24.90 |
| PFE-Det-S | 0.657 | 0.868 | 0.711 | 0.305 | 0.517 | 0.803 | 13.34 | 36.95 |
The UAVVaste dataset presents distribution characteristics distinctly different from VisDrone: backgrounds are mainly natural textures (grass, beach), and targets (garbage) are extremely small (small objects exceeding 99%) and very sparsely distributed. As shown in
Table 6, PFE-Det-S achieves clear performance gains on this task: overall AP increases by 2.9 percentage points (0.500 to 0.529, a relative improvement of 5.8%), and
reaches 0.830. Notably,
, measuring high localization precision, improves by 4.6 percentage points (0.557 to 0.603). The MFAM structure-retaining path helps preserve boundary cues of sparse targets, coinciding with the gains in overall AP and
. Meanwhile, a marginal decrease of 0.006 in
(0.259 to 0.253) is observed, consistent with the slight
reduction on DIOR. Given that over 99% of UAVVaste instances fall within the small-object category, the substantial overall AP gain (+2.9 points) occurring alongside a minor
dip suggests that the improvement is not driven by a change in COCO size-bin membership. Under COCO evaluation, the “small/medium/large” partition is determined by the ground-truth bounding-box area; therefore, predicted box refinement does not alter the GT-based size bin. Instead, the observed
/
differences reflect changes in detection quality for the corresponding GT size subsets (and the remaining non-small instances).
Table 6.
Cross-dataset validation results on UAVVaste. The better result for each metric is in bold.
Table 6.
Cross-dataset validation results on UAVVaste. The better result for each metric is in bold.
| Model | AP | | | | | | Params (M) | GFLOPs |
|---|
| DEIM-D-FINE-S | 0.500 | 0.810 | 0.557 | 0.259 | 0.534 | 0.590 | 10.18 | 24.82 |
| PFE-Det-S | 0.529 | 0.830 | 0.603 | 0.253 | 0.562 | 0.635 | 13.32 | 36.87 |
Combining the performance on both cross-dataset evaluations, PFE-Det shows consistent scene adaptability: overall AP improves on DIOR and UAVVaste under the shared training recipe, while decreases slightly on both datasets. These results indicate favorable overall detection quality across the evaluated aerial and remote sensing benchmarks, without implying zero-shot domain transfer.



 ,
,