Article

Highly Sensitive CO-LITES Sensor Based on a Tapered Fiber Focusing and a Fiber-Coupled MPC

1
Zhengzhou Advanced Research Institute, Harbin Institute of Technology, Zhengzhou 450008, China
2
National Key Laboratory of Laser Spatial Information, Harbin Institute of Technology, Harbin 150001, China
*
Authors to whom correspondence should be addressed.
Sensors 2026, 26(15), 4828; https://doi.org/10.3390/s26154828
Submission received: 17 June 2026 / Revised: 28 July 2026 / Accepted: 29 July 2026 / Published: 30 July 2026
(This article belongs to the Special Issue Advances in Optoelectronic Information and Computer Engineering)

Abstract

In this paper, a highly sensitive carbon monoxide (CO) light-induced thermoelastic spectroscopy (LITES) sensor based on tapered-fiber focusing and a fiber-coupled multipass cell (MPC) is demonstrated for the first time. An MPC with a fiber-coupled structure and an optical length of 40 m is employed to significantly increase the effective absorption path length, reduce the difficulty of optical alignment, and improve the robustness of the sensor system. By comparing five different beam shaping and focusing schemes at the MPC output, the influence of the excitation spot size on the generation of the LITES signal is thoroughly investigated. Experimental results demonstrate that the system response is significantly enhanced as the spot size is compressed. Owing to the micron-scale focused spot produced by the tapered fiber end face, the tapered-fiber configuration exhibits the strongest sensing response among the five schemes. This configuration achieves the highest signal-to-noise ratio (SNR) and exhibits a good linear response to CO concentration. The minimum detection limit (MDL) of the proposed CO-LITES sensor is 3.86 ppm. Based on Allan deviation analysis, when the system integration time reaches 300 s, the minimum detection limit can be further improved to 304 ppb, demonstrating excellent long-term stability.

1. Introduction

Carbon monoxide (CO) is an important trace gas in atmospheric chemistry, industrial safety, combustion monitoring, and medical diagnostics. In the atmosphere, CO serves as a major sink for hydroxyl radicals (OH), which are the primary oxidants in the atmosphere. Monitoring CO concentration variations provides valuable insights into atmospheric oxidation capacity and greenhouse gas chemistry [1,2,3,4]. In many industrial processes, the presence of trace amounts of CO may indicate equipment malfunction or potential safety hazards [5,6,7]. Since trace amounts of CO are generated during the smoldering stage of combustion, monitoring CO concentration can facilitate early fire detection. Furthermore, in medical diagnostics, minute variations in exhaled CO concentrations have been associated with asthma, chronic obstructive pulmonary disease, and oxidative stress [8,9,10,11]. Therefore, highly sensitive CO detection is of great importance for environmental monitoring, industrial safety, and medical diagnostics [12,13].
Existing detection technologies, such as electrochemical sensing and semiconductor gas sensing, are relatively mature and widely used, but they still face challenges in stability and selectivity [14,15,16,17,18]. In this context, optical spectroscopic methods have become important tools for trace-gas analysis because of their high sensitivity and molecular specificity. Representative approaches, including mid-infrared QCL spectroscopic systems, self-referenced 2f/1f WMS schemes, quartz-tuning-fork-assisted laser sensing, and resonant photoacoustic detection, have shown strong potential for CO and other trace-gas measurements [19,20,21,22,23,24,25,26,27,28,29,30,31]. In addition to hardware optimization, recent advances in high-sensitivity gas sensing, particularly those involving intelligent signal processing and self-referenced sensing strategies, have provided useful references for improving trace-gas detection performance. Representative examples include self-referenced spectroscopic methods, QTF-assisted laser sensing, and resonant photoacoustic detection, which have contributed to improvements in sensing sensitivity, selectivity, and measurement stability [32,33]. Among laser absorption spectroscopy-based techniques [34,35,36,37,38,39,40,41,42], quartz-enhanced photoacoustic spectroscopy (QEPAS) has attracted considerable attention owing to its high selectivity and sensitivity [43,44,45,46,47,48]. Nevertheless, QEPAS requires the quartz tuning fork (QTF) to be directly exposed to the target gas, making the QTF vulnerable to corrosion in harsh environments and thereby limiting its practical applications. To address this limitation, light-induced thermoelastic spectroscopy (LITES) has been proposed as a non-contact gas-sensing technique. Unlike QEPAS, LITES eliminates the need to expose the QTF directly to the target gas, thereby improving its applicability in harsh or corrosive environments. In LITES, the laser wavelength is tuned to a characteristic absorption line of the target gas. After passing through the absorption cell, the transmitted laser beam irradiates the surface of the QTF, where the optical energy is absorbed and converted into localized heat. The resulting periodic thermoelastic deformation drives the mechanical resonance of the QTF and generates a piezoelectric signal [49,50,51,52,53,54,55]. Since the amplitude of this signal is related to the gas absorption strength, quantitative detection of the target gas concentration can be achieved [56,57].
The energy coupling condition of the laser beam on the QTF surface is an important aspect of LITES technology, exerting a significant impact on the overall detection performance [58]. To date, most LITES systems have primarily focused on improving the tuning fork structure [59,60]. In addition, in most LITES systems, the excitation beam illuminating the QTF surface is shaped using conventional focusing optics, which limits further reduction in the spot size and thus restricts the achievable localized optical energy density. The thermoelastic signal intensity of the LITES system is closely related to the localized energy density of the beam. A larger laser spot area on the QTF leads to a more dispersed energy distribution of the light field, which results in a gentler thermal gradient inside the QTF and weakens the thermoelastic response amplitude of the system [61,62]. By optimizing the optical focusing system to tightly focus the excitation light into a focused spot, the light field energy can be highly concentrated on the QTF surface. This micro-spot can excite more intense localized thermoelastic deformation, thereby generating a stronger piezoelectric signal response. As the energy transducer in LITES technology, the enhanced response of the QTF can significantly improve the detection sensitivity of the entire sensor system.
In LITES systems pursuing high sensitivity, the multipass cell (MPC) is also a vital component used to increase the interaction length between light and gas. A common MPC consists of two highly reflective concave mirrors. The laser light reflects multiple times between the two mirrors, achieving an equivalent optical path length of tens or even hundreds of meters within a compact physical volume. This significantly extends the effective absorption path, thereby increasing the absorption of the target gas and improving the LITES signal amplitude [63,64]. However, because the MPC relies on the precise reflection of the laser light between the mirror surfaces, small alignment errors can accumulate over multiple reflections, making optical alignment extremely complex. To overcome the deficiencies of traditional systems, such as difficult optical alignment and high susceptibility to environmental disturbances, a fiber-coupled MPC is an effective solution. In this configuration, the beam position and pointing direction are defined by the fiber geometry, which greatly simplifies the alignment process. The laser beam is launched directly from an input fiber into the MPC and subsequently coupled into an output fiber after multiple reflections. This approach effectively improves alignment stability and reduces sensitivity to environmental perturbations.
In this paper, a tapered-fiber focusing strategy is introduced into a fiber-coupled MPC-based CO-LITES sensor to enhance the localized optical excitation of the QTF for the first time. The tapered fiber reduces the beam spot size on the QTF surface, thereby increasing the signal level. Meanwhile, the fiber-coupled MPC extends the absorption path length and reduces the difficulty of optical alignment. Wavelength modulation spectroscopy (WMS) is employed alongside second-harmonic (2f) demodulation to extract the target signal, and Allan deviation analysis is performed to evaluate the long-term stability of the system.

2. Simulation

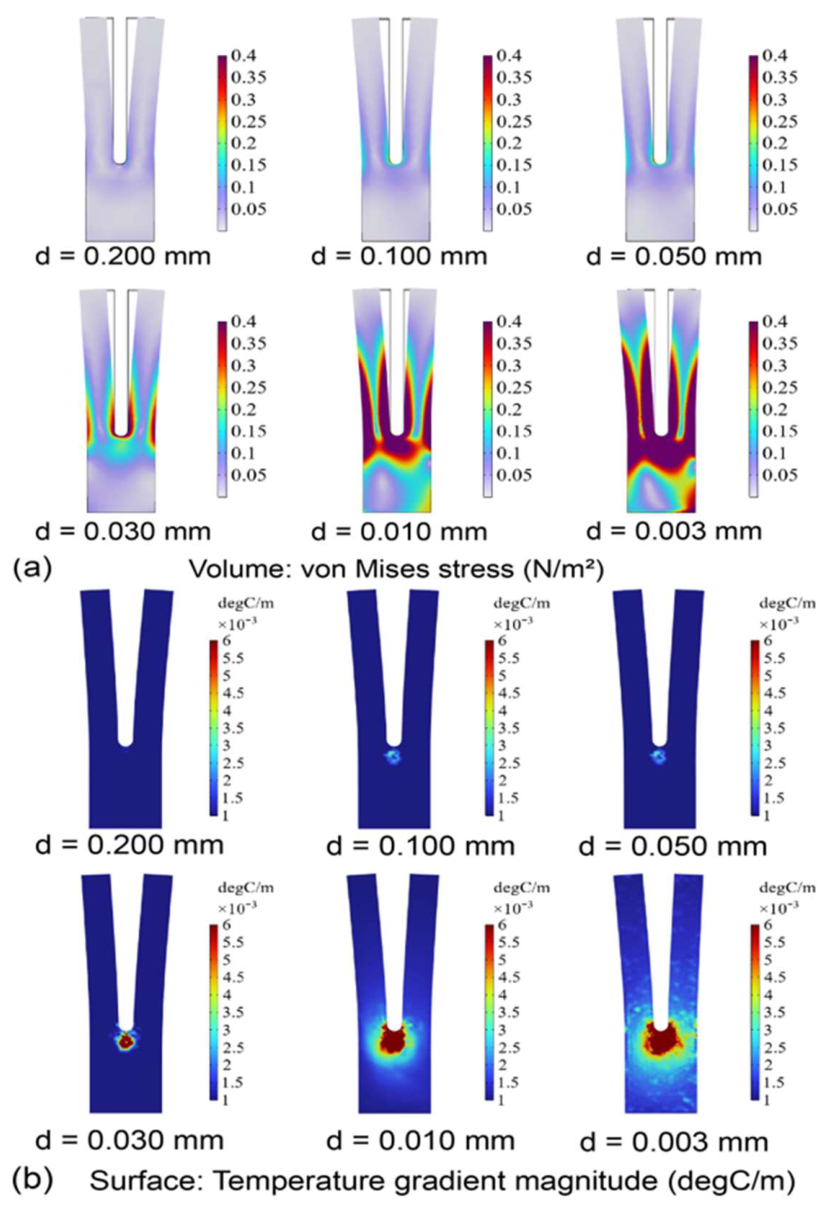
To verify the effect of the spatial distribution characteristics of the laser beam on the surface charge induction process of the QTF, a three-dimensional thermoelastic-piezoelectric coupling model was established using the finite element analysis method. While keeping the total incident laser power constant, the beam spot diameter (d) was gradually reduced from 0.200 mm to 0.003 mm. The overall stress and thermal gradient distributions of the QTF are depicted in Figure 1, respectively. As the beam spot diameter decreases, the local thermal gradient of the QTF is significantly enhanced, leading to a highly concentrated thermoelastic strain. According to the direct piezoelectric effect, the induced electric displacement and corresponding surface charge density are determined by the stress distribution within the QTF. Therefore, a smaller beam spot size excites a more intense piezoelectric response.
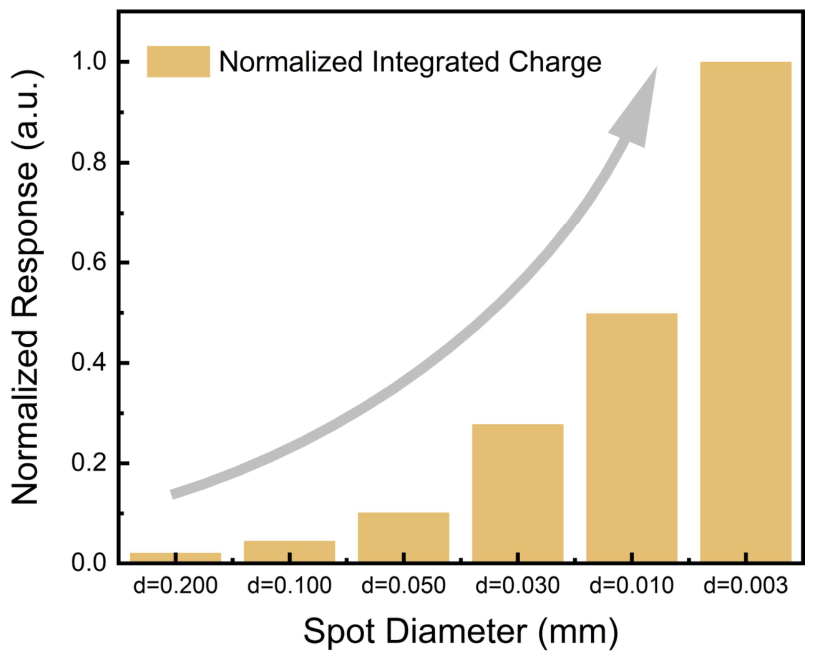
To further quantify this enhancement effect, spatial integration of the surface charge density σ over the effective electrode area was performed to extract the total integrated charge. The dependence of the normalized charge on beam spot diameters is shown in Figure 2. The results indicate that when the laser spot is focused to the micrometer scale, the total piezoelectric charge output of the QTF exhibits significant enhancement.
The analysis reveals that, under a constant incident power, reducing the beam spot size yields a higher energy density at the optimal excitation position of the QTF. This localized stress distribution enhances the effective piezoelectric charge generation, resulting in the integrated charge increasing as the beam spot diameter decreases.

3. Experimental Setup

3.1. Selecting the CO Absorption Line

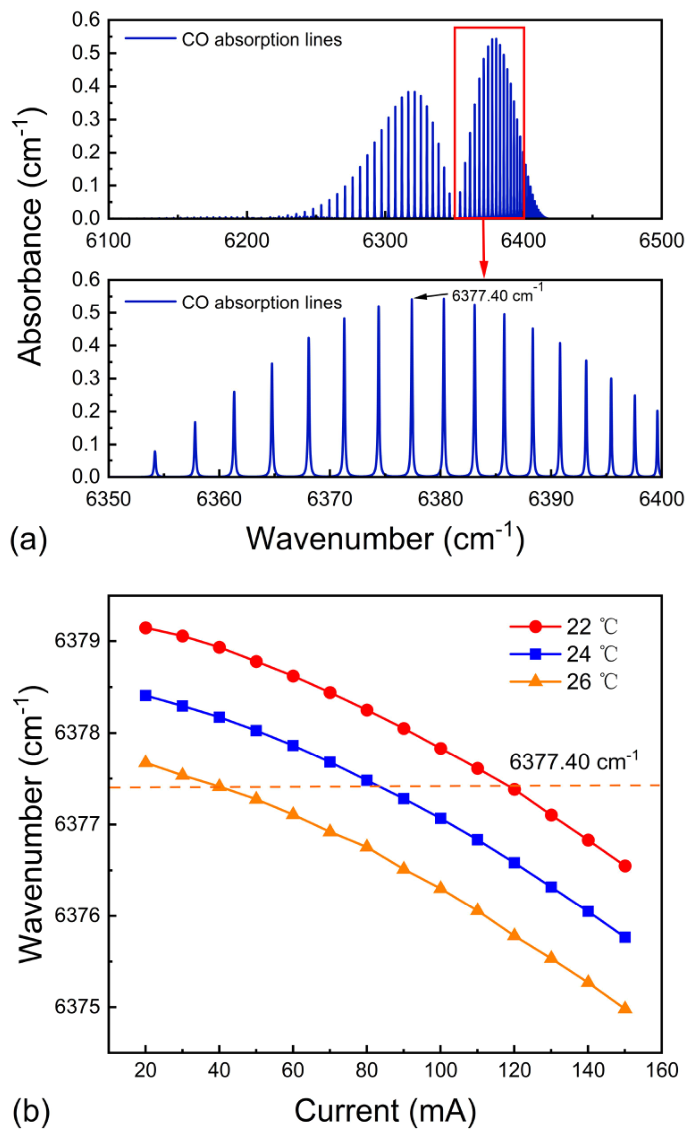
The selection of the target gas absorption line must satisfy two key criteria: a sufficiently strong absorption line strength and minimal interference from neighboring absorption features of background gases. Based on simulations using the HITRAN database, the line located at 6377.40 cm−1 (1568.04 nm) was selected as the target absorption line, as shown in Figure 3a.
A distributed feedback (DFB) diode laser (Model #: SWLD-12782, Wuhan 69 sensor technology Co. Ltd., Wuhan, China) was employed as the light source in this experiment. The variation in its output wavelength with respect to the injection current is depicted in Figure 3b. It is evident that at a constant temperature, the output wavelength increases as the injection current increases. Specifically, at an operating temperature of 24 ℃, the target absorption line can be effectively covered by scanning the injection current centered at approximately 80 mA.

3.2. Experimental Configuration

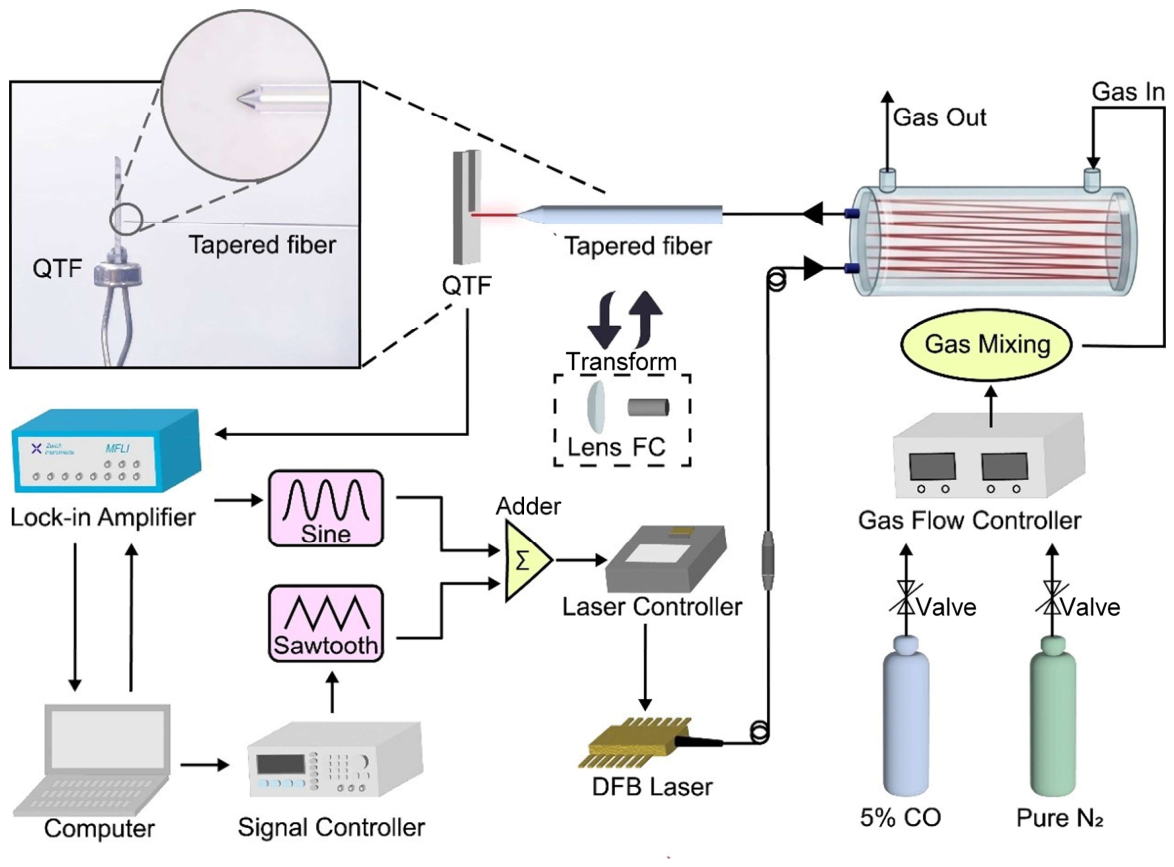
The experimental configuration is illustrated in Figure 4. A DFB diode laser with a central emission wavelength of 1568.04 nm serves as the excitation light source. To extend the effective absorption path length, the beam emitted from the laser output is directly coupled into a fiber-coupled MPC. After exiting the MPC, the transmitted light is shaped and focused using either a fiber collimator combination or a tapered fiber for comparison. Finally, the beam is directed onto the base of the QTF to optimally excite the LITES signal.
To implement signal modulation and data acquisition, the system employs WMS. The laser frequency is simultaneously scanned across the target absorption line by a low-frequency triangular signal from a function generator, and modulated by a high-frequency sinusoidal modulation signal provided by a lock-in amplifier (LIA, Model #: MFLI DC-500 kHz, Zurich Instruments). Following the optical absorption, the weak piezoelectric signal generated by the QTF is routed to the LIA for phase-sensitive demodulation. Finally, the amplitude of the extracted 2f signal is utilized to deduce the target gas concentration.

3.3. Theoretical Estimation of Excitation Spot Size

To accurately evaluate the effective spot sizes generated by different beam shaping configurations, theoretical calculations were performed. For the lens-based focusing schemes, the output beam from the fiber collimator was regarded as a collimated Gaussian beam. The theoretical beam waist generated by a focusing lens can be expressed as:
ω 0 = M 2 λ f π ω L
where ω0 is the beam waist radius at the focal plane, M2 is the beam quality factor, λ is the laser wavelength, f is the focal length of the focusing lens, and ωL is the incident beam radius on the lens. In this manuscript, the beam waist radius is denoted as ω0 in the theoretical equations, whereas the corresponding spot diameter d = 2ω0 is used when comparing different focusing configurations.
In accordance with commercial near-infrared fiber collimator specifications, a collimator output beam diameter of 1.5 mm was utilized in the focusing analysis. Therefore, the incident beam radius on the focusing lens was taken as ωL = 0.75 mm in the theoretical calculation. Under the assumptions of ideal Gaussian beam propagation and M2 ≈ 1, the theoretically estimated focused spot diameters for the 40 mm, 20 mm, and 10 mm focusing lenses were approximately 53.2 μm, 26.6 μm, and 13.3 μm, respectively. These results indicate that shortening the focal length of the focusing lens can effectively reduce the excitation spot size on the QTF surface and thereby increase the localized optical energy density.
For the tapered fiber, the fiber end face is machined into a conical microlens structure. Due to the refractive index mismatch between the fiber and air, the tapered facet functions as a micro-focusing lens, compressing the emitted beam into a smaller spot area prior to its divergence. Compared with alternative configurations, this conical microlens structure provides superior spatial confinement of the optical field, thereby substantially increasing the localized optical power density on the QTF surface.
The focal-plane waist radius of the tapered fiber can be approximately estimated based on an equivalent microlens model. By considering the curvature radius of the tapered microlens, the focal-plane waist radius can be expressed as:
ω 0 , T F M 2 λ R π ω f n 1
where ω0,TF is the focal-plane waist radius of the tapered fiber, R is the curvature radius of the tapered microlens, ωf is the mode-field radius of the fiber, and n is the refractive index of fused silica. In this work, the curvature radius of the tapered microlens was R = 6.00 ± 0.05 μm. Using, ωf ≈ 5.2 μm, the focal-plane waist radius of the tapered fiber was calculated to be approximately 1.3 μm, corresponding to a theoretical focal-plane spot diameter of approximately 2.6 μm.
It should be noted that the spot diameters used in the simulation were defined as Gaussian heat-source diameters, while the spot sizes of the experimental configurations were theoretically estimated based on Gaussian beam propagation or the equivalent microlens model of the tapered fiber. Therefore, the calculated values represent estimated focal-plane spot sizes. Possible uncertainties mainly arise from the beam-quality factor, focal-length tolerance, curvature-radius error of the tapered fiber tip, beam divergence, and the positioning accuracy between the QTF and the focal plane.

4. Experimental Results and Discussion

4.1. Optimization and Comparison of Laser Beam Shaping Structures

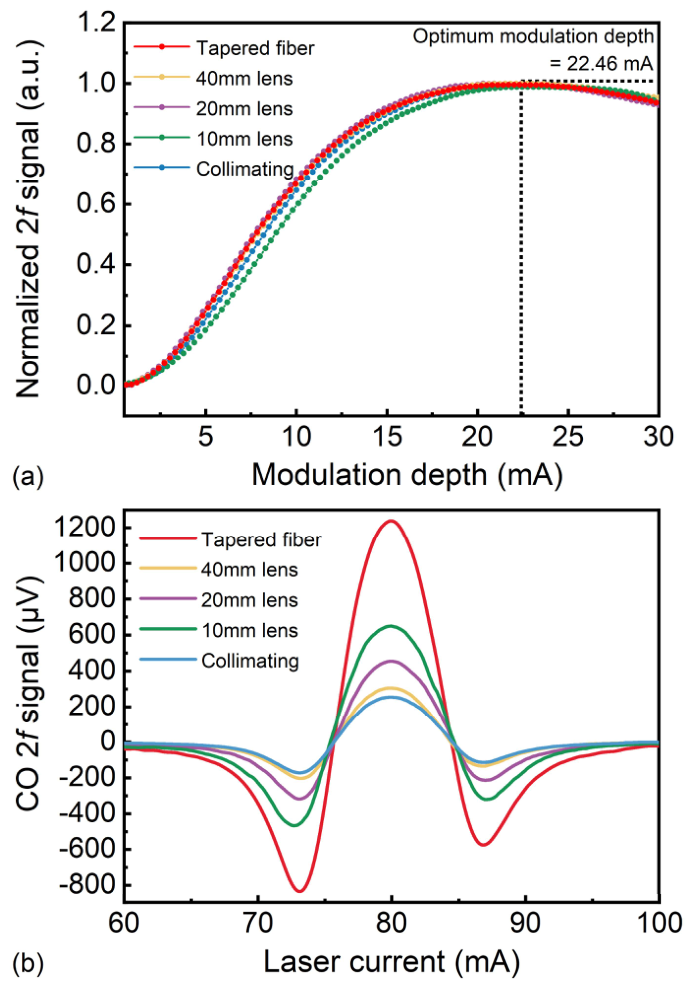
To investigate the influence of the excitation beam spot size on the LITES signal amplitude and to optimize the system structure, this study systematically compares five distinct beam shaping and focusing configurations: fiber collimator only, fiber collimator combined with a 40 mm focusing lens, fiber collimator combined with a 20 mm focusing lens, fiber collimator combined with a 10 mm focusing lens, and a tapered fiber.
For a fair comparison, all five beam-shaping configurations were tested using the same CO concentration, gas pressure, gas flow rate, laser driving parameters, modulation frequency, modulation-depth scanning range, and lock-in amplifier settings. The QTF and MPC were kept unchanged during the comparison, and only the output beam-shaping configuration was replaced.
Because the amplitude of the 2f signal in WMS strongly depends on modulation depth, optimizing the modulation depth is a prerequisite before conducting performance comparisons. Under identical excitation power and gas concentration, the dependence of the 2f signal amplitude on modulation depth for the five optical configurations is shown in Figure 5a. Specifically, as the modulation depth increases, the signal amplitude for each configuration initially increases and subsequently decreases. The optimal modulation depth was experimentally determined to be 22.46 mA for all configurations. Based on this optimized parameter, subsequent comparative experiments clearly demonstrate that the peak amplitudes of the acquired 2f signals vary significantly depending on the specific focusing scheme, as depicted in Figure 5b.
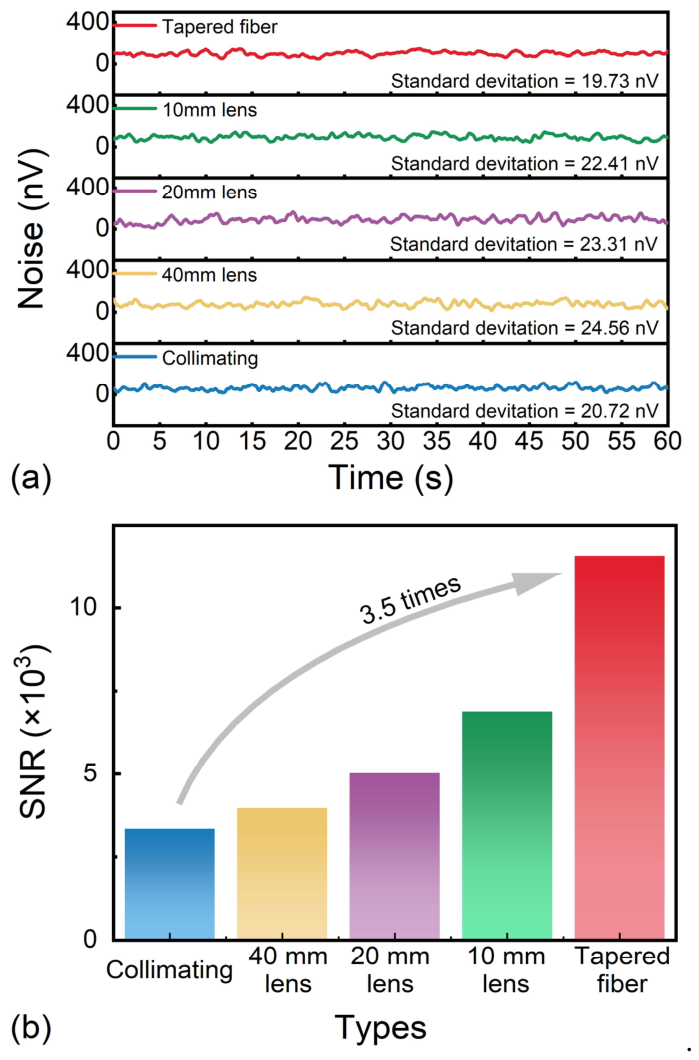
The background noise levels and the resulting signal-to-noise ratios (SNRs) of the five optical configurations are evaluated, as presented in the bar charts in Figure 6a,b. As the focal length decreases from the bare fiber collimator to the fiber collimator paired with the 10 mm focusing lens, the beam spot is effectively compressed, yielding a significant enhancement in both the 2f signal amplitude and the SNR, as clearly observed in Figure 6b. Notably, the configuration employing the tapered fiber achieves the maximum 2f signal amplitude of 1.24 mV and the highest SNR. Furthermore, the noise floors across all five configurations remain essentially constant at approximately 100 nV, as depicted in Figure 6a. These results indicate that the observed SNR enhancement primarily originates from the increased signal amplitude enabled by improved optical focusing, rather than from changes in the system noise level.
Both simulation and experimental results indicate that a smaller laser beam spot size significantly enhances the sensor response. However, the experimental enhancement achieved by the tapered fiber is less pronounced than the idealized enhancement predicted by the finite-element simulations. This discrepancy can be attributed to several practical factors. First, the beam emitted from the tapered fiber tip possesses a substantially large divergence angle, causing it to expand rapidly upon exiting the fiber facet. Consequently, even a microscopic working distance between the fiber tip and the QTF surface dictates that the actual beam spot diameter illuminating the QTF is substantially larger than the nominal 2.6 μm. Second, practical factors such as the limited precision of the mechanical translation stage, environmental micro-vibrations, and thermal drift make it highly challenging to continuously and precisely align the micro-scale spot with the optimal charge-accumulation region of the QTF. Even a slight spatial misalignment can lead to a noticeable reduction in signal amplitude. In addition, optical coupling losses may also exist in the practical system. However, in the present fiber-coupled MPC configuration, the input and output optical connections are mainly realized through fiber-to-fiber coupling. Although such connections inevitably introduce minor insertion losses, these losses are relatively small and stable under fixed connection conditions, and therefore have a negligible influence on the comparison among different beam-shaping configurations.

4.2. Performance Characterization of the Tapered Fiber LITES Sensor

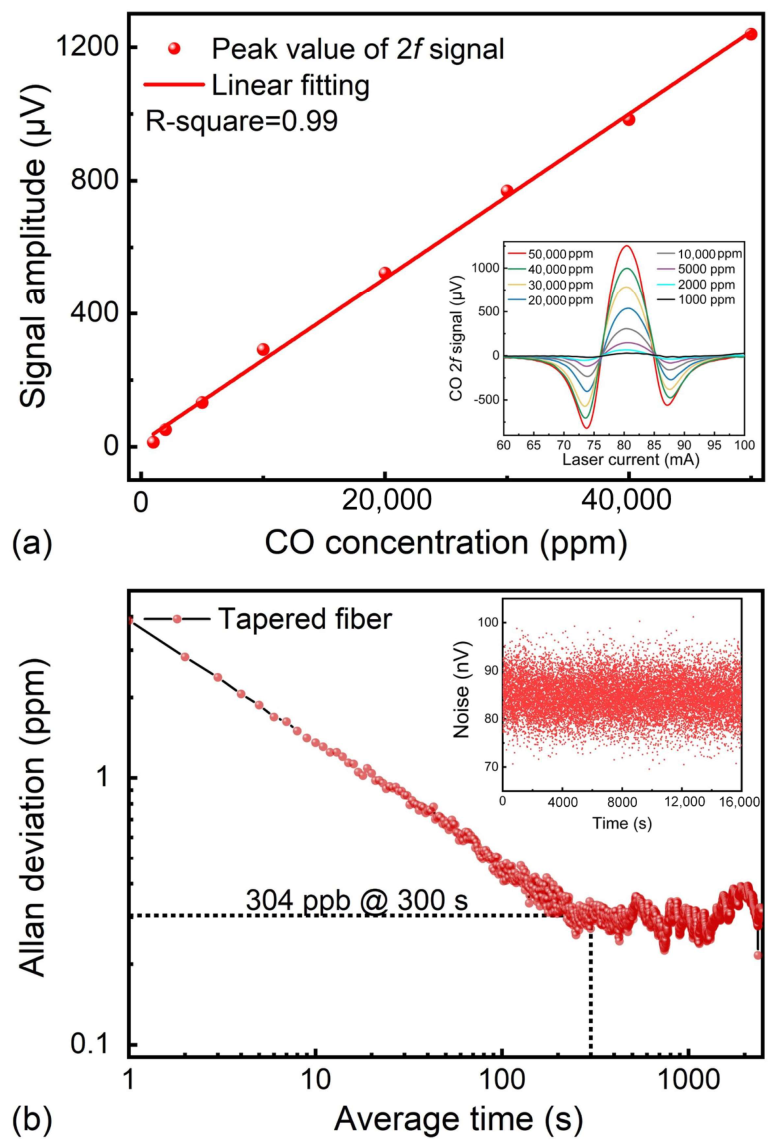
Based on the comparative results above, the configuration utilizing the tapered fiber, which exhibited the optimal performance, was selected for subsequent sensing characterization. First, to evaluate the quantitative analytical capability of the system, its linear response to the target gas at various concentrations was tested. The experimental results demonstrate that the peak amplitude of the 2f signal exhibits a highly linear relationship with the gas concentration in the range of 0.1% to 5%, as plotted in Figure 7a. The corresponding linear fitting equation is:
y = 0.0247 x + 13.2352
with an R-squared (R2) value of 0.99, where x is the CO concentration in ppm and y is the 2f signal amplitude in μV.
This excellent linearity confirms the suitability of the sensor for quantitative gas analysis. Subsequently, to further assess the long-term stability and the ultimate detection capability of the system, long-term continuous data acquisition was performed in a pure N2 environment, and an Allan deviation analysis was conducted, as presented in Figure 7b. The minimum detection limit (MDL) under normal operating conditions was estimated from the measured SNR according to: MDL = C/SNR, where C is the CO concentration used for the SNR measurement and SNR is defined as the ratio between the 2f signal amplitude and the background noise level. Based on the measured SNR at a known CO concentration, the MDL of the tapered-fiber-based CO-LITES sensor was calculated to be 3.86 ppm. According to the Allan deviation analysis, the detection limit can be improved to 304 ppb at an optimal integration time of 300 s. This demonstrates that the system remains highly stable for up to 300 s, effectively suppressing the low-frequency noise induced by environmental perturbations and laser drift, demonstrating its potential for high-performance and stable gas-sensing applications.

5. Conclusions

A highly sensitive CO-LITES sensor based on a tapered fiber focusing and a fiber-coupled MPC is proposed for the first time. The influence of the excitation beam spot size on LITES signal generation is studied by systematically comparing five different beam shaping and focusing schemes. The experimental results reveal that the system response is significantly enhanced as the beam spot size is compressed. Benefiting from its micron-scale tight-focusing end face, the tapered fiber achieves the best sensing response among the five schemes. This configuration yields the highest 2f signal amplitude and the highest SNR without introducing additional system background noise. In the system performance characterization, the tapered-fiber-based LITES sensor exhibits excellent linearity within the concentration range of 0.1–5%, with a linear fitting coefficient R2 of 0.99, confirming its suitability for quantitative gas analysis. Furthermore, under normal operating conditions, the MDL of the system was determined to be 3.86 ppm. Based on Allan deviation analysis, the detection limit could be improved to 304 ppb at an integration time of 300 s, demonstrating the excellent long-term stability and drift-suppression capability of the sensor system. Overall, this work provides a meaningful route for improving LITES performance through optical energy coupling rather than only modifying the QTF structure. The combination of tapered-fiber focusing and a fiber-coupled MPC enhances localized excitation while maintaining alignment robustness, which is beneficial for practical trace-gas sensing applications.

Author Contributions

Investigation, methodology, and writing—original draft preparation, X.Y.; validation, H.S., C.Z., R.W., S.Q. and Y.H.; validation, supervision, writing—review and editing, Y.M. All authors have read and agreed to the published version of the manuscript.

Funding

We are grateful for financial support from the National Natural Science Foundation of China (grant Nos. 62335006, 62275065, 625B2063, 62405078, and 62505066), the Natural Science Foundation of Heilongjiang Province (grant Nos. BS2025F002 and LH2024F031), the Heilongjiang Postdoctoral Fund (grant Nos. LBH-Z23144 and LBH-Z24155), the China Postdoctoral Science Foundation (grant No. 2024M764172), the Open Subject of Hebei Key Laboratory of Advanced Laser Technology and Equipment (HBKL-ALTE2025001), and the Fundamental Research Funds for the Central Universities (HIT.DZJJ.2025015 and HIT.NSFJG202463).

Institutional Review Board Statement

Not applicable.

Informed Consent Statement

Not applicable.

Data Availability Statement

The data presented in this study are available on request from the corresponding author.

Conflicts of Interest

The authors declare no conflicts of interest.

References

  1. Zheng, B.; Chevallier, F.; Yin, Y.; Ciais, P.; Fortems-Cheiney, A.; Deeter, M.N.; Parker, R.J.; Wang, Y.; Worden, H.M.; Zhao, Y. Global atmospheric carbon monoxide budget 2000–2017 inferred from multi-species atmospheric inversions. Earth Syst. Sci. Data 2019, 11, 1411–1436. [Google Scholar] [CrossRef]
  2. Jiang, Z.; Worden, J.R.; Worden, H.; Deeter, M.; Jones, D.B.A.; Arellano, A.F.; Henze, D.K. A 15-year record of CO emissions constrained by MOPITT CO observations. Atmos. Chem. Phys. 2017, 17, 4565–4583. [Google Scholar] [CrossRef]
  3. Liu, M.; Song, Y.; Matsui, H.; Shang, F.; Kang, L.; Cai, X.; Zhang, H.; Zhu, T. Enhanced atmospheric oxidation toward carbon neutrality reduces methane’s climate forcing. Nat. Commun. 2024, 15, 3148. [Google Scholar] [CrossRef] [PubMed]
  4. Stevenson, D.S.; Zhao, A.; Naik, V.; O’COnnor, F.M.; Tilmes, S.; Zeng, G.; Murray, L.T.; Collins, W.J.; Griffiths, P.T.; Shim, S.; et al. Trends in global tropospheric hydroxyl radical and methane lifetime since 1850 from AerChemMIP. Atmos. Chem. Phys. 2020, 20, 12905–12920. [Google Scholar] [CrossRef]
  5. Zhao, X.; Ma, F.; Wang, H.; Qi, H.; Li, C.; Guo, M.; Chen, K. Fiber-Optic Photoacoustic CO Sensor for Gas Insulation Equipment Monitoring Based on Cantilever Differential Lock-In Amplification and Optical Excitation Enhancement. Anal. Chem. 2024, 96, 5298–5306. [Google Scholar] [CrossRef] [PubMed]
  6. Feng, C.; Shen, X.; Li, B.; Liu, X.; Jing, Y.; Huang, Q.; Patimisco, P.; Spagnolo, V.; Dong, L.; Wu, H. Carbon monoxide impurities in hydrogen detected with resonant photoacoustic cell using a mid-IR laser source. Photoacoustics 2024, 36, 100585. [Google Scholar] [CrossRef] [PubMed]
  7. Zhao, X.; Qi, H.; Zhang, Y.; Xu, Y.; Li, C.; Guo, M.; Ma, F.; Peng, W.; Chen, K. Effects of H2O and SF6 on CO Molecular Relaxation in a Cantilever-Enhanced Fiber-Optic Photoacoustic Sensor. Anal. Chem. 2025, 97, 7938–7944. [Google Scholar] [CrossRef] [PubMed]
  8. Xie, Z.; Chai, M.; Gu, W.; Yuan, H. Changes in fractional exhaled nitric oxide, exhaled carbon monoxide and pulmonary function during the acute attack, treatment and remission phases of pediatric asthma. Transl. Pediatr. 2020, 9, 784–794. [Google Scholar] [CrossRef] [PubMed]
  9. Gawad, M.H.M.A.; Morsi, M.G.; Fayiad, H. Role of exhaled carbon monoxide in assessment of chronic obstructive airway disease severity. Egypt. J. Bronchol. 2024, 18, 41. [Google Scholar] [CrossRef]
  10. Taniguchi, A.; Tsuge, M.; Miyahara, N.; Tsukahara, H. Reactive Oxygen Species and Antioxidative Defense in Chronic Obstructive Pulmonary Disease. Antioxidants 2021, 10, 1537. [Google Scholar] [CrossRef] [PubMed]
  11. Li, B.; Feng, C.; Wu, H.; Jia, S.; Dong, L. Photoacoustic heterodyne breath sensor for real-time measurement of human exhaled carbon monoxide. Photoacoustics 2022, 27, 100388. [Google Scholar] [CrossRef] [PubMed]
  12. Salthammer, T. Carbon monoxide as an indicator of indoor air quality. Environ. Sci. Atmos. 2024, 4, 291–305. [Google Scholar] [CrossRef]
  13. Sgobba, F.; Sampaolo, A.; Patimisco, P.; Giglio, M.; Menduni, G.; Ranieri, A.C.; Hoelzl, C.; Rossmadl, H.; Brehm, C.; Mackowiak, V.; et al. Compact and portable quartz-enhanced photoacoustic spectroscopy sensor for carbon monoxide environmental monitoring in urban areas. Photoacoustics 2021, 25, 100318. [Google Scholar] [CrossRef] [PubMed]
  14. He, Y.; Jiao, M. A Mini-Review on Metal Oxide Semiconductor Gas Sensors for Carbon Monoxide Detection at Room Temperature. Chemosensors 2024, 12, 55. [Google Scholar] [CrossRef]
  15. Wei, M.; Shi, X.; Zhu, M.; Zhang, S.; Zhang, H.; Yao, H.; Xu, S. Research Progress on Chemiresistive Carbon Monoxide Sensors. Nanomaterials 2025, 15, 303. [Google Scholar] [CrossRef] [PubMed]
  16. Bulemo, P.M.; Kim, D.-H.; Shin, H.; Cho, H.-J.; Koo, W.-T.; Choi, S.-J.; Park, C.; Ahn, J.; Güntner, A.T.; Penner, R.M.; et al. Selectivity in Chemiresistive Gas Sensors: Strategies and Challenges. Chem. Rev. 2025, 125, 4111–4183. [Google Scholar] [CrossRef] [PubMed]
  17. Wang, J.; Wang, R. Development of Gas Sensors and Their Applications in Health Safety, Medical Detection, and Diagnosis. Chemosensors 2025, 13, 190. [Google Scholar] [CrossRef]
  18. Armas, D.; Matias, I.R.; Lopez-Gonzalez, M.C.; Zamarreño, C.R.; Zubiate, P.; del Villar, I.; Romero, B. Generation of lossy mode resonances (LMR) using perovskite nanofilms. Opto-Electron. Adv. 2024, 7, 230072. [Google Scholar] [CrossRef]
  19. Li, J.; Deng, H.; Sun, J.; Yu, B.; Fischer, H. Simultaneous atmospheric CO, N2O and H2O detection using a single quantum cascade laser sensor based on dual-spectroscopy techniques. Sens. Actuators B Chem. 2016, 231, 723–732. [Google Scholar] [CrossRef]
  20. Wen, D.Y.T.; Zhao, H.T.; Liu, X.F.; Xu, W.M.; Xu, X.S.; Lei, X.R.; Shu, R. Quantitative detection of water/ice in typical lunar minerals using Raman spectroscopy. J. Infrared Millim. Waves 2025, 44, 192–202. [Google Scholar] [CrossRef]
  21. Mei, H.; Wang, G.; Xu, Y.; He, H.; Yao, J.; He, S. Simultaneous measurement of methane, propane and isobutane using a compact mid-infrared photoacoustic spectrophone. Photoacoustics 2024, 39, 100635. [Google Scholar] [CrossRef] [PubMed]
  22. Minamikawa, T.; Sakaguchi, R.; Harada, Y.; Tanioka, H.; Inoue, S.; Hase, H.; Mori, Y.; Takamatsu, T.; Yamasaki, Y.; Morimoto, Y.; et al. Long-range enhancement for fluorescence and Raman spectroscopy using Ag nanoislands protected with column-structured silica overlayer. Light Sci. Appl. 2024, 13, 299. [Google Scholar] [CrossRef] [PubMed]
  23. Zhuang, Z.; Zhou, X.; Zeng, H.; Li, M.; Chen, Z.; He, X.; Chen, X.; Zhou, L.; Dong, J. Overcoming intrinsic dispersion locking for achieving spatio-spectral selectivity with misaligned bilayer metagratings. eLight 2025, 5, 13. [Google Scholar] [CrossRef]
  24. Wu, Y.; Sun, T.; Pei, Z.; Ji, C.; Zhao, X.; Shao, M.; Yu, J.; Li, Z.; Zhang, C. Light-field and external-field modulation in surface-enhanced raman scattering: Strategies and prospects. Light Manip. Appl. 2026, 1, 202601. [Google Scholar] [CrossRef]
  25. Wang, J.; Wu, H.; Liu, X.; Wang, G.; Wang, Y.; Feng, C.; Cui, R.; Gong, Z.; Dong, L. Cantilever-enhanced dual-comb photoacoustic spectroscopy. Photoacoustics 2024, 38, 100605. [Google Scholar] [CrossRef] [PubMed]
  26. Zhao, Z.; Kravtsov, V.; Wang, Z.; Zhou, Z.; Dou, L.; Huang, D.; Wang, Z.; Cheng, X.; Raschke, M.B.; Jiang, T. Applications of ultrafast nano-spectroscopy and nano-imaging with tip-based microscopy. eLight 2025, 5, 1. [Google Scholar] [CrossRef]
  27. Liu, N.; Xu, L.; Zhou, S.; Zhang, L.; Li, J. Simultaneous Detection of Multiple Atmospheric Components Using an NIR and MIR Laser Hybrid Gas Sensing System. ACS Sens. 2020, 5, 3607–3616. [Google Scholar] [CrossRef] [PubMed]
  28. Xu, L.; Zhou, S.; Liu, N.; Zhang, M.; Liang, J.; Li, J. Multigas Sensing Technique Based on Quartz Crystal Tuning Fork-Enhanced Laser Spectroscopy. Anal. Chem. 2020, 92, 14153–14163. [Google Scholar] [CrossRef] [PubMed]
  29. Zhang, Y.; Yang, E.; Yoon, H.H.; Cheng, Q.; Sun, Z.; Hasan, T.; Cai, W. Reconstructive spectrometers: Hardware miniaturization and computational reconstruction. eLight 2025, 5, 23. [Google Scholar] [CrossRef]
  30. Huang, Q.; Wei, Y.; Li, J. Simultaneous detection of multiple gases using multi-resonance photoacoustic spectroscopy. Sens. Actuators B Chem. 2022, 369, 132234. [Google Scholar] [CrossRef]
  31. Zhou, W.; Ruan, Y.-P.; Wu, H.; Zhang, H.; Tang, J.-S.; Xie, Z.; Tang, L.; Wang, Y.; Ji, Y.-E.; Jia, K.; et al. Magnetic-free chiral eigenmode spectroscopy for simultaneous sensitive measurement of optical rotary dispersion and circular dichroism. eLight 2024, 4, 12. [Google Scholar] [CrossRef]
  32. Li, M.; Zhu, R.; Gao, J.; Xie, F.; Li, C.; Luo, Y.; Zhang, Y.; Zhang, Y. A Closed Optical Path Trace H2S Sensing System Based on Vacuum Ultraviolet Differential Absorption Spectroscopy Combined with Reconstructed Domain Point Cloud Segmentation. ACS Sens. 2025, 10, 6185–6194. [Google Scholar] [CrossRef] [PubMed]
  33. Gao, J.; Zhang, X.; Zhu, R.; Li, M.; Li, C.; Xie, F.; Zhang, Y.; Zhang, Y.; Fu, B. An online trace gas detection system for multi-component atmospheric pollutants based on ultraviolet differential optical absorption spectroscopy combined with convolutional attention neural network. Sens. Actuators B Chem. 2025, 441, 138057. [Google Scholar] [CrossRef]
  34. Long, J.; Wang, Z.; Peng, H.; Sun, W.; Chen, D.; Li, S.; Li, S.; Luo, Y.-H.; He, J.; Gao, L.; et al. A chip-based optoelectronic-oscillator frequency comb. eLight 2025, 5, 14. [Google Scholar] [CrossRef]
  35. Xie, Z.; Meng, C.; Yue, D.; Xu, L.; Mei, T.; Zhang, W. Tip-enhanced Raman scattering of glucose molecules. Opto-Electron. Sci. 2025, 4, 240027. [Google Scholar] [CrossRef]
  36. Song, Y.; Ma, H.; Qiao, S.; He, Y.; Sun, H.; Ma, Y. Stable cavity ring-down spectroscopy enabled by intracavity injection with real-time PID feedback locking for reliable acetylene sensing. Sens. Actuators B Chem. 2026, 464, 140199. [Google Scholar] [CrossRef]
  37. Li, K.; Wang, B.; Yuan, M.; Yang, Z.; Yu, C.; Zheng, W. CO Detection System Based on TDLAS Using a 4.625 μm Interband Cascaded Laser. Int. J. Environ. Res. Public Health 2022, 19, 12828. [Google Scholar] [CrossRef] [PubMed]
  38. Qiao, S.; Lv, Z.; Ma, H.; Liu, B.; Sang, C.; Wang, R.; Sun, H.; He, Y.; Ma, Y. “1”-shaped acoustic cascaded resonator enhanced light-induced thermoelastic spectroscopy gas sensing. Opt. Lett. 2026, 51, 3128–3131. [Google Scholar] [CrossRef] [PubMed]
  39. Xiong, S.; Yin, X.; Wang, Q.; Xia, J.; Chen, Z.; Lei, H.; Yan, X.; Zhu, A.; Qiu, F.; Chen, B.; et al. Photoacoustic Spectroscopy Gas Detection Technology Research Progress. Appl. Spectrosc. 2023, 78, 139–158. [Google Scholar] [CrossRef] [PubMed]
  40. Wijesinghe, D.R.; Zobair, A.; Esmaeelpour, M. A Review on Photoacoustic Spectroscopy Techniques for Gas Sensing. Sensors 2024, 24, 6577. [Google Scholar] [CrossRef] [PubMed]
  41. Ma, F.; Cao, J.; Zhang, X.; Zhao, X.; Zhao, Y.; Yuan, X.; Chen, K. T-type multi-pass photoacoustic sensor for fault diagnosis of gas insulated equipment. Opto-Electron. Eng. 2025, 52, 250163. [Google Scholar] [CrossRef]
  42. Nie, Q.; Peng, Y.; Chen, Q.; Liu, N.; Wang, Z.; Wang, C.; Ren, W. Agile cavity ringdown spectroscopy enabled by moderate optical feedback to a quantum cascade laser. Opto-Electron. Adv. 2024, 7, 240077. [Google Scholar] [CrossRef]
  43. Qiao, S.; Liu, X.; Lang, Z.; He, Y.; Chen, W.; Ma, Y. Quartz-enhanced laser spectroscopy sensing. Light Sci. Appl. 2026, 15, 5. [Google Scholar] [CrossRef] [PubMed]
  44. Zifarelli, A.; Negro, G.; Mongelli, L.A.; Sampaolo, A.; Ranieri, E.; Dong, L.; Wu, H.; Patimisco, P.; Gonnella, G.; Spagnolo, V. Effect of gas turbulence in quartz-enhanced photoacoustic spectroscopy: A comprehensive flow field analysis. Photoacoustics 2024, 38, 100625. [Google Scholar] [CrossRef] [PubMed]
  45. Liu, C.; Xu, M.; Hu, M.; Pan, S.; Qi, H.; Liu, S.; Li, H.; Liu, C.; Shang, Y. CW DFB-QCL-based system for H2O2 detection using multi-pass tunable diode laser absorption spectroscopy. Chin. Opt. Lett. 2025, 23, 083001. [Google Scholar] [CrossRef]
  46. Liu, B.; Qiao, S.; Lv, Z.; He, Y.; Sun, H.; Zhi, X.; Ma, Y. On–off-beam differential resonance quartz-enhanced photoacoustic spectroscopy gas sensing technology. Opt. Lett. 2026, 51, 3337–3340. [Google Scholar] [CrossRef] [PubMed]
  47. Wang, Z.; Nie, Q.; Sun, H.; Wang, Q.; Borri, S.; De Natale, P.; Ren, W. Cavity-enhanced photoacoustic dual-comb spectroscopy. Light Sci. Appl. 2024, 13, 11. [Google Scholar] [CrossRef] [PubMed]
  48. Wang, J.; Wu, H.; Sampaolo, A.; Patimisco, P.; Spagnolo, V.; Jia, S.; Dong, L. Quartz-enhanced multiheterodyne resonant photoacoustic spectroscopy. Light Sci. Appl. 2024, 13, 77. [Google Scholar] [CrossRef] [PubMed]
  49. Wang, Y.; He, Y.; Qiao, S.; Liu, X.; Zhang, C.; Duan, X.; Ma, Y. Fast step heterodyne light-induced thermoelastic spectroscopy gas sensing based on a quartz tuning fork with high-frequency of 100 kHz. Opto-Electron. Adv. 2026, 9, 250150. [Google Scholar] [CrossRef]
  50. Sun, H.; Qiao, S.; He, Y.; Sun, X.; Ma, Y. Parts-per-quadrillion level gas molecule detection: CO-LITES sensing. Light Sci. Appl. 2025, 14, 180. [Google Scholar] [CrossRef] [PubMed]
  51. Ma, H.; Qiao, S.; He, Y.; Sun, H.; Ma, Y. Orthogonal phase modulation and Lissajous mode decoupling in light-induced thermoelastic spectroscopy for real-time multi-component gas sensing. Rep. Prog. Phys. 2026, 89, 067902. [Google Scholar] [CrossRef] [PubMed]
  52. Sun, H.; Qiao, S.; He, Y.; Wang, Y.; Hou, J.; Zhang, C.; Dong, Y.; Ma, Y. High-speed and high-sensitivity multi-gas detection based on parallel heterodyne LITES sensor. Light Sci. Appl. 2026, 15, 295. [Google Scholar] [CrossRef] [PubMed]
  53. Ma, H.; Liu, B.; Qiao, S.; He, Y.; Sun, H.; Dong, Y.; Ma, Y. A high-sensitivity light-induced thermoelastic spectroscopy sensor based on dual-path synergistic coupling method. Laser Photonics Rev. 2026, 20, e71169. [Google Scholar] [CrossRef]
  54. Qiao, S.; Lv, Z.; Liu, B.; Ma, H.; He, Y.; Sun, H.; Ma, Y. Asymmetric tongs induced frequency splitting achieving simultaneous two-component gas sensing with a single quartz tuning fork in two independent resonant modes. ACS Sens. 2026. [Google Scholar] [CrossRef] [PubMed]
  55. Liu, B.; Han, G.; He, Y.; Qiao, S.; Wang, R.; Sun, H.; Dong, Y.; Ma, Y. Piezoelectric ceramic tuning fork enhanced laser spectroscopic sensing. Laser Photonics Rev. 2026, 20, e71331. [Google Scholar] [CrossRef]
  56. Nie, Q.; Wang, Z.; Ren, W. Cavity-enhanced absorption spectroscopy with continuous and fast wavelength tuning. Chin. Opt. Lett. 2025, 23, 121201. [Google Scholar] [CrossRef]
  57. Huang, Y.; He, Y.; Qiao, S.; Sun, H.; Ma, Y. Intelligent Algorithm-Assisted Indirect Absorption Spectroscopy for Trace Gas Sensing. Sensors 2026, 26, 4054. [Google Scholar] [CrossRef] [PubMed]
  58. Yang, Q.; Hu, Y.; Torres-Company, V.; Vahala, K. Efficient microresonator frequency combs. eLight 2024, 4, 18. [Google Scholar] [CrossRef] [PubMed]
  59. Mu, J.; Han, G.; Wang, R.; Qiao, S.; He, Y.; Ma, Y. Photoacoustic spectroscopy and light-induced thermoelastic spectroscopy based on inverted-triangular lithium niobate tuning fork. Opto-Electron. Sci. 2025, 4, 250035. [Google Scholar] [CrossRef]
  60. Mu, J.; He, Y.; Qiao, S.; Sun, H.; Ma, Y. Photoacoustic spectroscopy sensing based on an annular quartz tuning fork. Sens. Actuators B Chem. 2026, 463, 140085. [Google Scholar] [CrossRef]
  61. Deng, S.; Dou, W.; Wu, Y.; Shao, M.; Ji, C.; Yu, J.; Zhang, C.; Xu, S.; Man, B.; Li, Z. Dual-tunable SERS substrate: Synergistic enhancement via plasmonic resonance tailoring and pyroelectric field modulation in Ag/BTO hybrid arrays. Opt. Laser Technol. 2026, 203, 115468. [Google Scholar] [CrossRef]
  62. Li, Y.; Liu, W.; Liu, R.; Gao, J.; Feng, J.; Xu, S.; Li, Z.; Jiang, S.; Du, X. 3D hybrid arrayed Ag/MOF multi-plasmon resonant cavity system for high-performance SPR sensing. Opt. Laser Technol. 2023, 167, 109825. [Google Scholar] [CrossRef]
  63. Ma, H.; Cai, J.; Qiao, S.; He, Y.; Dong, Y.; Ma, Y. Dual-gas light-induced thermoelastic spectroscopy sensor based on mixed-frequency heterodyne demodulation. Light Adv. Manuf. 2026, 7, 54. [Google Scholar] [CrossRef]
  64. Ma, Y.; Sun, X.; Sun, H.; He, Y.; Qiao, S. An ultra-highly sensitive LITES sensor based on multi-pass cell with ultra-dense spot pattern designed by multi-objective algorithm. PhotoniX 2025, 6, 26. [Google Scholar] [CrossRef]
Figure 1. (a) Overall stress distribution of the QTF under different laser beam spot diameters; (b) Thermal gradient distribution of the QTF under different laser beam spot diameters.
Sensors 26 04828 g001
Figure 2. Evolution trend of the normalized total integrated charge as a function of beam spot diameters.
Sensors 26 04828 g002
Figure 3. (a) CO absorption lines from the HITRAN database; (b) Dependence of the laser output wavelength on the injection current at different temperatures.
Sensors 26 04828 g003
Figure 4. The schematic diagram of the CO-LITES sensor’s experimental setup.
Sensors 26 04828 g004
Figure 5. (a) 2f signal amplitude as a function of modulation depth under five different beam shaping and focusing configurations; (b) Measured 2f signal profiles at their respective optimal modulation depths. All measurements were performed under the same experimental conditions: temperature of 26 ℃, pressure of 1 atm.
Sensors 26 04828 g005
Figure 6. (a) Background noise levels under five different beam shaping and focusing configurations; (b) SNR comparison under five different beam shaping and focusing configurations.
Sensors 26 04828 g006
Figure 7. (a) The linear relationship between 2f signal amplitude and CO concentration. Inset: 2f signal of CO-LITES sensor with different concentration; (b) Allan deviation analysis of the tapered-fiber-based CO-LITES sensor.
Sensors 26 04828 g007
Disclaimer/Publisher’s Note: The statements, opinions and data contained in all publications are solely those of the individual author(s) and contributor(s) and not of MDPI and/or the editor(s). MDPI and/or the editor(s) disclaim responsibility for any injury to people or property resulting from any ideas, methods, instructions or products referred to in the content.