


Double-Layer Graphene Mesh/PEDOT:PSS Conductive-Network-Reinforced PDMS Nanocomposites for Temperature-Insensitive Strain Sensing


Round 1
Reviewer 1 Report
Comments and Suggestions for Authorssee file
Comments for author File:  Comments.pdf
Author Response
Author Response to Reviewers’ comments
The authors appreciate very much for the invaluable comments provided by the reviewer. All comments are now incorporated in the revision, and the summary is presented in the following of how the amendments are made according to the individual comments.
Reviewer #1:
The manuscript “Double-layer conductive network reinforced PDMS nanocomposites for temperature-insensitive strain sensing Lei Wang et al., reports the results of experimental investigations of a double-layer conductive structure fabricated by coating highly conductive poly(3,4-ethylenedioxythiophene) polystyrene sulfonate (PEDOT:PSS) on a graphene mesh. It was found that the resulting composites PEDOT:PSS/GM/PDMS-0.75 exhibit conductivity (8.1 S/cm), high gauge factor (~42), good reliability (1000 cycles) and stable sensing performance within -30~140℃.
The results presented by the authors may be of interest for research in the field of resistive strain sensor technology. The experimental results obtained in this study are interesting and relatively new. In my opinion, the topic and materials of this study are certainly in line with the scope of the journal Sensors. However, the following questions remain.
Comment 1. Despite the author’s claim that “stable sensor properties were achieved under cyclic strain in the temperature range from -30~140℃,” the temperature dependance of resistance shown in Figure 3a was measured in the 20-140℃ range. Therefore, it would be interesting to investigate this behavior at temperatures below 20℃.
Reply: Thanks for your kind suggestion. Normalized resistance of composites with different PEDOT:PSS content in the temperature range of 25-140°C and -30-25°C was investigated, respectively. Relevant discussions were added to this reversion.
Page 6, Section 3: “…According to Fig. 5b, PEDOT:PSS/GM/PDMS-0.75 underwent a resistance decrement of 0.3% in the temperature range of 25 ℃ to -30 ℃, indicating outstanding temperature stability. Such a compensation effect of electron transport against temperature fluctuation has been verified in other materials with analogous structures[32].”

Figure 5 Normalized resistance of composites with different PEDOT:PSS content in the temperature range of (a) 25-140°C; (b) -30-25°C; (c) schematic of the electron transport in double-layer conductive networks.
Comment 2. Conclusions regarding electron transport in bilayer conductive networks should be based on an analysis of the temperature dependences of the resistivity of samples in the temperature range from expanding and improving the discussion section of this manuscript by considering theoretical models that explain the obtained results.
Reply: Thanks for your kind suggestion. Normalized resistance of composites with different PEDOT:PSS content in the temperature range of 25-140°C and -30-25°C was investigated, respectively. The temperature-dependent resistance of pristine GM was measured for comparison with the data of PEDOT:PSS. Relevant descriptive text has been revised to better illustrate the mechanism underlying the resistance variation behavior.
Page 6, Section 3: “It is essential for strain sensors to maintain temperature-insensitive resistance under mechanical deformation. Herein, the temperature dependence of the composite electromechanical performance was systematically investigated (Fig. 5), where R0 refers to the resistance at 25℃. Fig. 5a presents the resistance evolution of different materials within the temperature range of 25℃ to 145 ℃. When the composite only contains a monolayer conductive network composed of graphene (GM/PDMS), the overall resistance of the material increases with rising temperature. At 60 °C, the material resistance rises by 3.8%; when the temperature increases to 90 °C, the resistance increases by 11.4%; at 140 °C, the resistance of the material is 19.2% higher than its initial value. There are two primary mechanisms responsible for this phenomenon. First, CVD-grown graphene sheets exhibited intrinsic metallic character. Elevated temperatures intensify phonon-carrier scattering on graphene surfaces, hindering electron transport across graphene sheets and consequently increasing the overall resistance of the composite[30]. Second, the PDMS matrix and graphene sheets possess a substantial mismatch in thermal expansion coefficients. Thermal expansion of the matrix upon heating induces microcracks on partial graphene frameworks, disrupting the continuous conductive network and raising the material resistance. The resistance-temperature variation curve of pure GM is similar to that of GM/PDMS composites, indicating that the mismatch of thermal expansion coefficients between filler and matrix is not the dominant factor contributing to the rise of resistance.
PEDOT:PSS is a semiconducting conductive polymer with a distinctive core–shell structure, whose electrical conductivity exhibits a negative correlation with temperature. Specifically, as temperature rises, electrons on the conductive PEDOT chains are thermally excited and can more readily surmount the energy barriers of insulating PSS segments, enhancing the electron transport capacity of PEDOT:PSS and reducing its overall resistance. In contrast, at lower temperatures, electrons lack sufficient thermal energy to overcome the energy barriers of PSS molecules, leading to an increase in the total resistance of PEDOT:PSS[31]. As shown in Fig. 5a, the resistance of neat PEDOT:PSS film decreased by 3.7% at 140℃ compared to that at 25℃.
After introducing PEDOT:PSS to modify the GM network, the normalized resistance variation of the composite was greatly suppressed. When the temperature increased from 25 ℃ to 140 ℃, the normalized resistance of PEDOT:PSS/GM/PDMS-0.75 only slightly increased by 1.1%. According to Fig. 5b, PEDOT:PSS/GM/PDMS-0.75 underwent a resistance decrement of 0.3% in the temperature range of 25 ℃ to -30 ℃, indicating outstanding temperature stability. Such a compensation effect of electron transport against temperature fluctuation has been verified in other materials with analogous structures[32].
To better elucidate the outstanding resistance stability of composites with double-layer conductive networks under various temperature conditions, the electron transport processes within graphene layers and PEDOT:PSS layers at room temperature and 140 °C were schematically illustrated, as presented in Fig. 5c. Electrons migrate freely on the surface of graphene sheets, and their transport is primarily governed by surface phonon scattering. In contrast, electrons move through PEDOT:PSS chains via hopping transport, and the quantity of excited-state electrons capable of surmounting intermolecular energy barriers dominates the electrical conductivity of PEDOT:PSS. At an elevated temperature of 140 °C, phonon scattering on graphene sheet surfaces intensifies, reducing the number of mobile electrons and thereby degrading the conductive performance of the graphene layer. Simultaneously, a larger population of electrons along the conductive PEDOT chains gains sufficient kinetic energy under high temperature to overcome intermolecular energy barriers, which enhances the conductivity of the PEDOT:PSS layer. The competition of different temperature responses of graphene and PEDOT:PSS led to reduced temperature coefficient of resistance of the conductive framework.”

Figure 5 Normalized resistance of composites with different PEDOT:PSS content in the temperature range of (a) 25-140°C; (b) -30-25°C; (c) schematic of the electron transport in double-layer conductive networks.
Reviewer 2 Report
Comments and Suggestions for AuthorsIn this manuscript, Wang et al. developed a temperature-invariant strain sensor based on a graphene/PEDOT:PSS network film. Through utilizing the adverse temperature-resistance relationship of graphene and PEDOT:PSS, the film could be tailored to have temperature-independent electrical resistance and electromechanical property. This work is integrate and interesting, I agree to accept this manuscript on Sensors after the authors tackled the following issues.
- In the SEM images in Figure 1b and 1c, the Ni substrate remains with graphene and graphene/PEDOT:PSS. However, these doesn’t reflect the actual states of the graphene and graphene/PEDOT:PSS film during strain sensing application. Since the removal of Ni could bring wrinkles and cracks on the film. Therefore, I recommend to add the SEM images when Ni is removed. Besides, SEM image with higher magnification should be added to characterize the refined structure.
- In the durability test in Figure 2d, there seems much shift in the peak position during these cycles. The magnified view of the electromechanical behavior near the start and the end of the test should be provided. And the fluctuation of the peak position should be discussed.
- In Figure 3b, the authors compared the strain sensing performance of graphene/PEDOT:PSS film under different temperature, and claimed the temperature-invariant behavior. While the similar comparison for the graphene film should also be provided to validate the superiority of using PEDOT:PSS.
- In the application demonstration in Figure 4, is the temperature marked by the author the environmental temperature? But when the sensor was attached to human skin, it’s true temperature is heavily affected by the skin temperature. Therefore, the temperature marking should be revised, or this comparison could be done in non-organic systems (such as robotic dexterous hand).
- The high temperature (140℃) could bring about structural damage of PDMS. Does this process affect the pressure sensing performance of the sensor?
Author Response
Comment 1. In the SEM images in Figure 1b and 1c, the Ni substrate remains with graphene and graphene/PEDOT:PSS. However, these doesn’t reflect the actual states of the graphene and graphene/PEDOT:PSS film during strain sensing application. Since the removal of Ni could bring wrinkles and cracks on the film. Therefore, I recommend to add the SEM images when Ni is removed. Besides, SEM image with higher magnification should be added to characterize the refined structure.
Reply: Thanks for your kind suggestion. Figure 1 was rewritten by adding SEM images of freestanding GMs.
Page 3, Section 3: “GMs were grown on Ni mesh templates by CVD method under 4 vol% of CH4. After the etching process, the as-obtained free-standing GMs inherited the original structure of Ni meshes, as can be seen from the SEM images in Fig. 2a. SEM image of free standing GMs with higher magnification (Fig. 2b) showed wrinkles and cracks on the film, which were aroused from the grain boundaries on the surface of Ni meshes (Fig. 2c).”

Figure 2. SEM image of (a) free standing GMs, (b) free standing GMs with higher magnification,
Comment 2. In the durability test in Figure 2d, there seems much shift in the peak position during these cycles. The magnified view of the electromechanical behavior near the start and the end of the test should be provided. And the fluctuation of the peak position should be discussed.
Reply: Thanks for your kind suggestion. In the original experiment, the as-fabricated PEDOT:PSS/GM/PDMS composite films were not fully dried, leaving trace residual moisture inside the materials. The retained water alters the contact state of conductive pathways, resulting in obvious resistance drift and baseline offset during long-term cyclic tensile tests. In this revised manuscript, we supplemented the complete fabrication procedure of the composite materials and introduced a thorough drying step. New specimens with sufficient drying treatment were refabricated, and electrical performance measurements under multi-cycle cyclic stretching were reperformed. All original data of long-cycle resistance response curves were updated, which effectively eliminates the testing interference induced by residual moisture and greatly improves the stability and repeatability of experimental results. Relevant discussions are rewritten in this revision.
Page 2, Section 2: “…Finally, the samples were dried in a vacuum oven at 80 ℃ for 24 h to thoroughly remove residual water. The composite films were denoted as PEDOT:PSS/GM/PDMS-x.”
Page 5, Section 3: “Furthermore, long-term stretch-release cycle tests with a target strain of 10% were carried out on PEDOT:PSS/GM/PDMS-0.75 for 700 cycles, and the corresponding results are presented in Fig. 4. When the composites was first stretched to 10%, its resistance increased by 422%, and this resistance state remained stable throughout the subsequent 700 cycles, as shown in Fig. 4a. Fig. 4b–d display the relative resistance variations at three cycle intervals: 1–3, 299–301 and 698–700 cycles. All curves show identical response profiles, with a consistent resistance peak of 420~430% at 10% strain and full baseline recovery after unloading. Fig. 4e plots the relative resistance variation across cycling. The resistance signal remains nearly unchanged over the full test with minor fluctuations, revealing reproducible electrical responses under repeated tensions. Fig. 4f illustrates the corresponding GF value, which maintained a steady high value (~43) without obvious decay, indicating well-preserved sensing performance. These results confirm that the PEDOT:PSS/GM/PDMS-0.75 composite possesses outstanding cycling stability and durable sensing performance for strain detection.
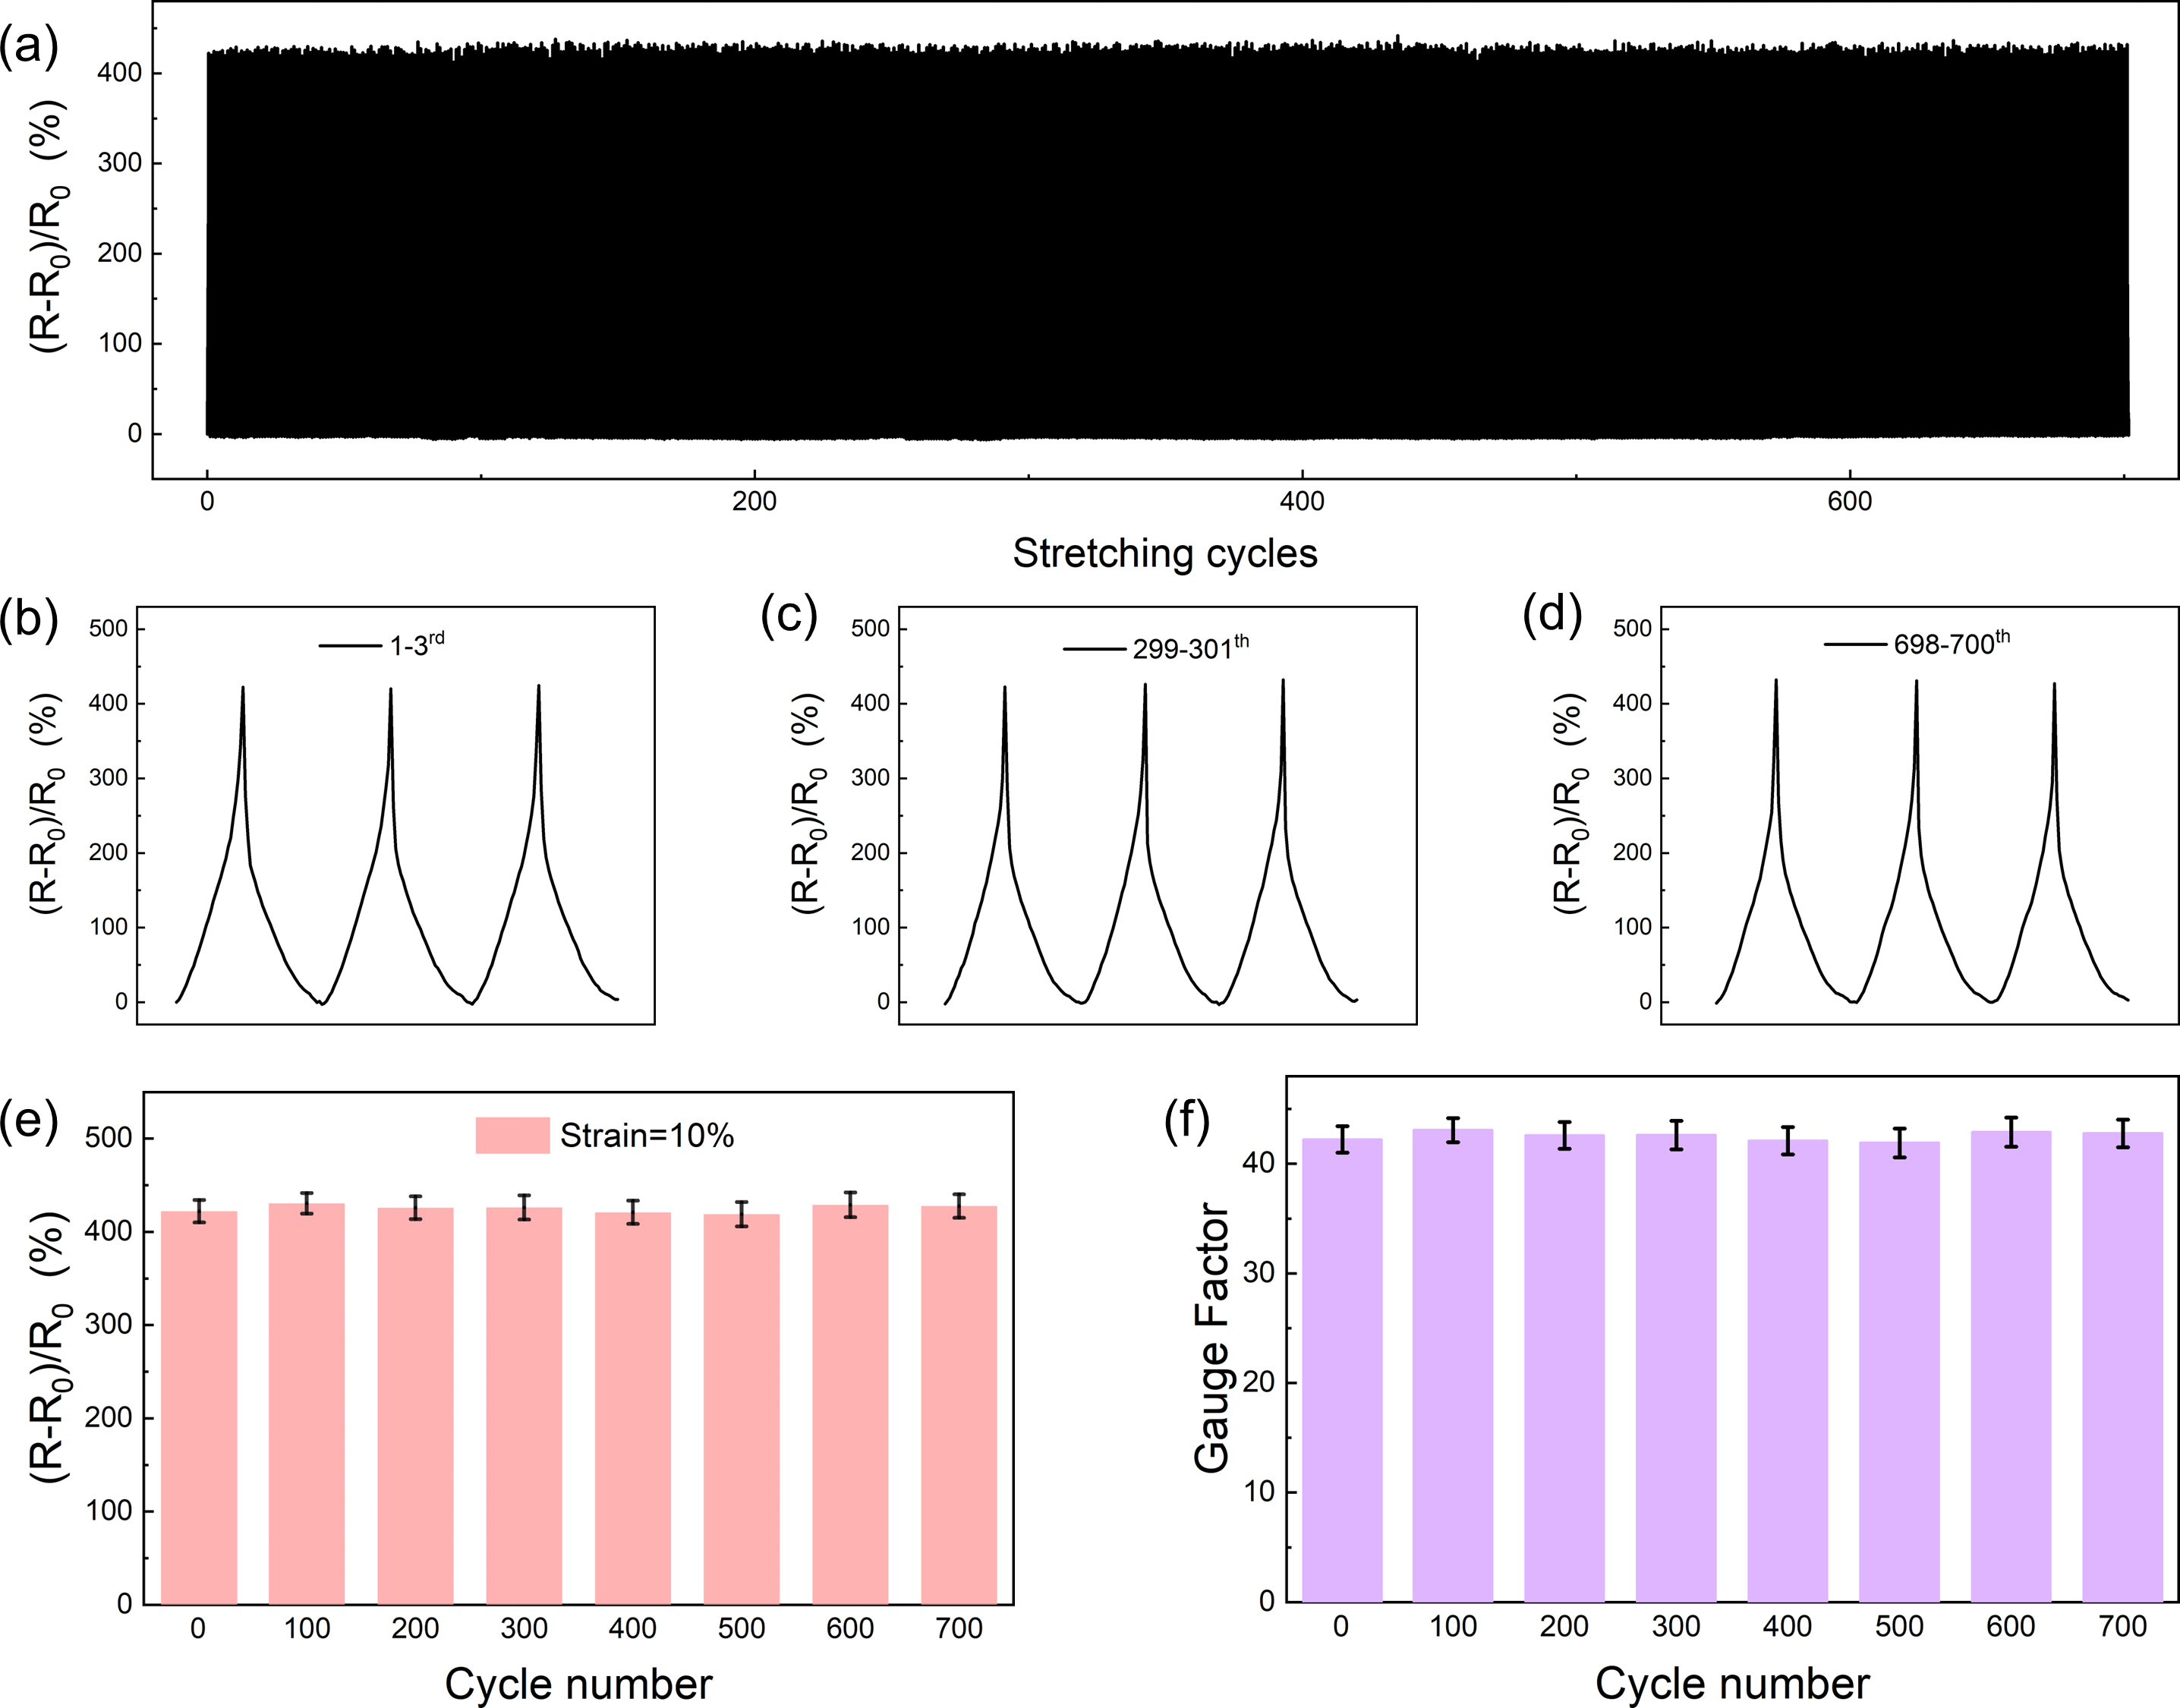
Figure 4. Curve of normalized resistance changes of PEDOT:PSS/GM/PDMS-0.75 over (a) 700 stretching-releasing cycles, (b) 1-3rd cycles, (c) 299-301th cycles and (d) 698-700th cycles at a target strain of 10%. (e) Resistance change and (f) GF value at tensile strain of 10% during 700 stretching-releasing cycles.
Comment 3. In Figure 3b, the authors compared the strain sensing performance of graphene/PEDOT:PSS film under different temperature, and claimed the temperature-invariant behavior. While the similar comparison for the graphene film should also be provided to validate the superiority of using PEDOT:PSS.
Reply: Thanks for your kind reminding. The resistance-strain curves of GM/PDMS composites at various temperatures have been obtained. Relevant discussions are added in this revision.
Page 7, Section 3: “Resistance of GM/PDMS and PEDOT:PSS/GM/PDMS-0.75 stretched at different temperatures were examined. For GM/PDMS, the relative resistance variation increases nonlinearly with tensile strain within a narrow measurable range of 0~5%, as shown in Fig. 6a. The corresponding normalized resistance variations at 5% strain reached 539.1%, 477.1%, 454.2%, 422.4% and 372.1% at −30 °C, 0 °C, 25 °C, 100 °C and 140 °C, respectively. High temperature weakens the sensing signal and restricts its application. After introducing PEDOT:PSS conductive layer, the PEDOT:PSS/GM/PDMS-0.75 composite exhibits greatly improved sensing performance. Its detectable strain range is extended to 0–10%, with the same temperature-response trend observed, as shown in Fig. 6b. The corresponding normalized resistance variations at 10% strain reached 396.7%, 408.4%, 397.8%, 386.4% and 391.7% at −30 °C, 0 °C, 25 °C, 100 °C and 140 °C, respectively. Even at extreme temperatures of 140 °C and −30 °C, the sensor presented comparable normalized resistance profiles during stretching and releasing, with only minor numerical deviations.”

Figure 6. (a) Normalized resistance of (a) GM/PDMS and (b) PEDOT:PSS/GM/PDMS-0.75 during stretching at different temperatures;
Comment 4. In the application demonstration in Figure 4, is the temperature marked by the author the environmental temperature? But when the sensor was attached to human skin, it’s true temperature is heavily affected by the skin temperature. Therefore, the temperature marking should be revised, or this comparison could be done in non-organic systems (such as robotic dexterous hand).
Reply: Thanks for your kind suggestion. The real temperature values of the composite have been revised to account for human body temperature effects. Relevant discussions are added in this revision.
Page 8, Section 3: “Demonstrations of PEDOT:PSS/GM/PDMS-0.75 as strain sensors for flexible and soft de-vices are shown in Fig. 7. Changes in the strain-sensing performance under low-, room- and high-temperature conditions were investigated. The composite sensor maintained stable sensing performance at 0 °C, ambient temperature, and 55 °C, respectively. These results verify that the PEDOT:PSS/GM/PDMS-0.75 sample can well satisfy the strain monitoring demands of dynamic human movements, which endows it with superior reliability and broad applicability for all-weather wearable electronic devices.”

Figure 7. Application of PEDOT:PSS/GM/PDMS-0.75 composites: Finger bending at (a) room temperature, (b) 0℃ and (c) 55℃; Wrist bending at (d) room temperature, (e) 0℃ and (f) 55℃.
Comment 5. The high temperature (140℃) could bring about structural damage of PDMS. Does this process affect the pressure sensing performance of the sensor?
Reply: Thanks for your kind suggestion. The fully cured Sylgard 184 (DC 184) PDMS elastomer possesses a standard long-term operating temperature range of −55 °C to 200 °C. Therefore, this process produces a negligible effect to the sensing performance of the sensor.
Reviewer 3 Report
Comments and Suggestions for AuthorsThis manuscript reports a temperature-insensitive strain sensor based on a double-layer PEDOT:PSS/graphene mesh conductive network embedded in PDMS. The concept is interesting and the temperature compensation strategy is potentially valuable for flexible strain sensing applications. However, several important issues should be addressed before the manuscript can be considered for publication.
1. Repeatability and signal consistency require further clarification.
The resistance responses presented in Fig. 2(b–d) exhibit considerable variation among repeated loading cycles. Although the proposed sensor demonstrates relatively stable performance over a wide temperature range, the repeatability of the strain sensing signal appears insufficient for practical applications. Such fluctuations raise concerns regarding the intrinsic reliability of the sensing mechanism rather than its temperature stability. The authors should discuss the possible origins of these signal variations (e.g., irreversible microstructural evolution, unstable conductive pathways, interfacial sliding between PEDOT:PSS and graphene, viscoelastic deformation of PDMS, or contact resistance) and propose practical strategies to improve the repeatability.
2. The proposed electron transport mechanism at elevated temperatures is insufficiently supported by experimental evidence.
The discussion associated with Fig. 3(e) attributes the temperature-insensitive behavior to the opposite temperature dependence of graphene and PEDOT:PSS conduction pathways. However, this mechanism is currently presented only as a schematic illustration without convincing experimental validation. Additional characterization is necessary to support this interpretation. The authors are encouraged to perform several complementary analyses, such as:
- Temperature-dependent electrical conductivity (or sheet resistance) measurements of individual GM and PEDOT:PSS components separately.
- Arrhenius analysis of electrical conductivity to determine activation energies.
- Temperature-dependent Raman spectroscopy to investigate structural changes and electron-phonon interactions.
- Temperature-dependent impedance spectroscopy (EIS) to distinguish conductive transport and interfacial polarization effects.
- XPS or UPS measurements to investigate possible temperature-induced changes in electronic structure.
- Conductive AFM or Kelvin probe force microscopy (KPFM) to visualize local current transport or surface potential distribution.
These additional experimental results would substantially strengthen the proposed electron transport mechanism.
3. Statistical analysis should be included.
Considering the noticeable cycle-to-cycle variation in the resistance response, the manuscript should provide statistical evidence demonstrating the reproducibility of the sensor performance. Important parameters such as gauge factor, peak resistance change, baseline resistance, and temperature sensitivity should be obtained from multiple independently fabricated samples (n ≥ 3 or preferably n ≥ 5). Error bars (standard deviation or standard error), together with appropriate statistical analysis, should be incorporated into the figures wherever applicable.
4. Figure 2 lacks sufficient sample identification.
According to the manuscript, Fig. 2(b–d) corresponds to the PEDOT:PSS/GM/PDMS-0.75 sample. However, this information is absent from both the figure itself and the figure caption. The sample designation should be explicitly included to avoid ambiguity and improve readability.
5. The claimed temperature-insensitive performance should be quantitatively compared with previously reported sensors.
Although the manuscript claims excellent temperature stability over a wide temperature range, no direct comparison with the current state-of-the-art is provided. A comparison table summarizing key performance metrics (temperature range, temperature coefficient of resistance (TCR), gauge factor, sensing range, durability, conductivity, and fabrication strategy) would clearly demonstrate the novelty and practical advantages of the proposed sensor.
6. The influence of PEDOT:PSS loading requires further discussion.
The manuscript demonstrates that increasing PEDOT:PSS content improves conductivity while reducing the gauge factor beyond the optimum composition. However, the physical origin of this trade-off is only briefly mentioned. A more detailed discussion correlating PEDOT:PSS loading with conductive network density, crack evolution, electron transport pathways, and strain transfer efficiency would greatly improve the scientific depth of the manuscript.
Author Response
Author Response to Reviewers’ comments
The authors appreciate very much for the invaluable comments provided by the reviewer. All comments are now incorporated in the revision, and the summary is presented in the following of how the amendments are made according to the individual comments.
Reviewer #3:
This manuscript reports a temperature-insensitive strain sensor based on a double-layer PEDOT:PSS/graphene mesh conductive network embedded in PDMS. The concept is interesting and the temperature compensation strategy is potentially valuable for flexible strain sensing applications. However, several important issues should be addressed before the manuscript can be considered for publication.
Comment 1. Repeatability and signal consistency require further clarification. The resistance responses presented in Fig. 2(b–d) exhibit considerable variation among repeated loading cycles. Although the proposed sensor demonstrates relatively stable performance over a wide temperature range, the repeatability of the strain sensing signal appears insufficient for practical applications. Such fluctuations raise concerns regarding the intrinsic reliability of the sensing mechanism rather than its temperature stability. The authors should discuss the possible origins of these signal variations (e.g., irreversible microstructural evolution, unstable conductive pathways, interfacial sliding between PEDOT:PSS and graphene, viscoelastic deformation of PDMS, or contact resistance) and propose practical strategies to improve the repeatability.
Reply: Thanks for your kind suggestion. In the original experiment, the as-fabricated PEDOT:PSS/GM/PDMS composite films were not fully dried, leaving trace residual moisture inside the materials. The retained water alters the contact state of conductive pathways, resulting in obvious resistance drift and baseline offset during long-term cyclic tensile tests. In this revised manuscript, we supplemented the complete fabrication procedure of the composite materials and introduced a thorough drying step. New specimens with sufficient drying treatment were refabricated, and electrical performance measurements under multi-cycle cyclic stretching were reperformed. All original data of long-cycle resistance response curves were updated, which effectively eliminates the testing interference induced by residual moisture and greatly improves the stability and repeatability of experimental results. Relevant discussions are rewritten in this revision.
Page 2, Section 2: “…Finally, the samples were dried in a vacuum oven at 80 ℃ for 24 h to thoroughly remove residual water. The composite films were denoted as PEDOT:PSS/GM/PDMS-x.”
Page 5, Section 3: “Furthermore, long-term stretch-release cycle tests with a target strain of 10% were carried out on PEDOT:PSS/GM/PDMS-0.75 for 700 cycles, and the corresponding results are presented in Fig. 4. When the composites was first stretched to 10%, its resistance increased by 422%, and this resistance state remained stable throughout the subsequent 700 cycles, as shown in Fig. 4a. Fig. 4b–d display the relative resistance variations at three cycle intervals: 1–3, 299–301 and 698–700 cycles. All curves show identical response profiles, with a consistent resistance peak of 420~430% at 10% strain and full baseline recovery after unloading. Fig. 4e plots the relative resistance variation across cycling. The resistance signal remains nearly unchanged over the full test with minor fluctuations, revealing reproducible electrical responses under repeated tensions. Fig. 4f illustrates the corresponding GF value, which maintained a steady high value (~43) without obvious decay, indicating well-preserved sensing performance. These results confirm that the PEDOT:PSS/GM/PDMS-0.75 composite possesses outstanding cycling stability and durable sensing performance for strain detection.

Figure 4. Curve of normalized resistance changes of PEDOT:PSS/GM/PDMS-0.75 over (a) 700 stretching-releasing cycles, (b) 1-3rd cycles, (c) 299-301th cycles and (d) 698-700th cycles at a target strain of 10%. (e) Resistance change and (f) GF value at tensile strain of 10% during 700 stretching-releasing cycles.
Comment 2. The proposed electron transport mechanism at elevated temperatures is insufficiently supported by experimental evidence.
The discussion associated with Fig. 3(e) attributes the temperature-insensitive behavior to the opposite temperature dependence of graphene and PEDOT:PSS conduction pathways. However, this mechanism is currently presented only as a schematic illustration without convincing experimental validation. Additional characterization is necessary to support this interpretation. The authors are encouraged to perform several complementary analyses, such as:
Temperature-dependent electrical conductivity (or sheet resistance) measurements of individual GM and PEDOT:PSS components separately.
Arrhenius analysis of electrical conductivity to determine activation energies.
Temperature-dependent Raman spectroscopy to investigate structural changes and electron-phonon interactions.
Temperature-dependent impedance spectroscopy (EIS) to distinguish conductive transport and interfacial polarization effects.
XPS or UPS measurements to investigate possible temperature-induced changes in electronic structure.
Conductive AFM or Kelvin probe force microscopy (KPFM) to visualize local current transport or surface potential distribution.
These additional experimental results would substantially strengthen the proposed electron transport mechanism.
Reply: Thanks for your kind suggestion The temperature-dependent resistance of pristine GM was measured for comparison with the data of PEDOT:PSS. Relevant descriptive text has been revised to better illustrate the mechanism underlying the resistance variation behavior.
Page 6, Section 3: “It is essential for strain sensors to maintain temperature-insensitive resistance under mechanical deformation. Herein, the temperature dependence of the composite electromechanical performance was systematically investigated (Fig. 5), where R0 refers to the resistance at 25℃. Fig. 5a presents the resistance evolution of different materials within the temperature range of 25℃ to 145 ℃. When the composite only contains a monolayer conductive network composed of graphene (GM/PDMS), the overall resistance of the material increases with rising temperature. At 60 °C, the material resistance rises by 3.8%; when the temperature increases to 90 °C, the resistance increases by 11.4%; at 140 °C, the resistance of the material is 19.2% higher than its initial value. There are two primary mechanisms responsible for this phenomenon. First, CVD-grown graphene sheets exhibited intrinsic metallic character. Elevated temperatures intensify phonon-carrier scattering on graphene surfaces, hindering electron transport across graphene sheets and consequently increasing the overall resistance of the composite[30]. Second, the PDMS matrix and graphene sheets possess a substantial mismatch in thermal expansion coefficients. Thermal expansion of the matrix upon heating induces microcracks on partial graphene frameworks, disrupting the continuous conductive network and raising the material resistance. The resistance-temperature variation curve of pure GM is similar to that of GM/PDMS composites, indicating that the mismatch of thermal expansion coefficients between filler and matrix is not the dominant factor contributing to the rise of resistance..

Figure 5 Normalized resistance of composites with different PEDOT:PSS content in the temperature range of (a) 25-140°C; (b) -30-25°C; (c) schematic of the electron transport in double-layer conductive networks.
Comment 3. Statistical analysis should be included.
Considering the noticeable cycle-to-cycle variation in the resistance response, the manuscript should provide statistical evidence demonstrating the reproducibility of the sensor performance. Important parameters such as gauge factor, peak resistance change, baseline resistance, and temperature sensitivity should be obtained from multiple independently fabricated samples (n ≥ 3 or preferably n ≥ 5). Error bars (standard deviation or standard error), together with appropriate statistical analysis, should be incorporated into the figures wherever applicable.
Reply: Thanks for your kind reminding. GF value and peak resistance change of composites during 700 stretching-releasing cycles were recorded to better demonstrating the reproducibility of the sensor performance. Relevant discussions are added in this revision.
Page 5, Section 3: “Furthermore, long-term stretch-release cycle tests with a target strain of 10% were carried out on PEDOT:PSS/GM/PDMS-0.75 for 700 cycles, and the corresponding results are presented in Fig. 4. When the composites was first stretched to 10%, its resistance increased by 422%, and this resistance state remained stable throughout the subsequent 700 cycles, as shown in Fig. 4a. Fig. 4b–d display the relative resistance variations at three cycle intervals: 1–3, 299–301 and 698–700 cycles. All curves show identical response profiles, with a consistent resistance peak of 420~430% at 10% strain and full baseline recovery after unloading. Fig. 4e plots the relative re-sistance variation across cycling. The resistance signal remains nearly unchanged over the full test with minor fluctuations, revealing reproducible electrical responses under repeated tensions. Fig. 4f illustrates the corresponding GF value, which maintained a steady high value (~43) without obvious decay, indicating well-preserved sensing performance. These results confirm that the PEDOT:PSS/GM/PDMS-0.75 composite possesses outstanding cycling stability and du-rable sensing performance for strain detection.”

Figure 4. Curve of normalized resistance changes of PEDOT:PSS/GM/PDMS-0.75 over (a) 700 stretch-ing-releasing cycles, (b) 1-3rd cycles, (c) 299-301th cycles and (d) 698-700th cycles at a target strain of 10%. (e) Resistance change and (f) GF value at tensile strain of 10% during 700 stretching-releasing cycles.
Comment 4. Figure 2 lacks sufficient sample identification.
According to the manuscript, Fig. 2(b–d) corresponds to the PEDOT:PSS/GM/PDMS-0.75 sample. However, this information is absent from both the figure itself and the figure caption. The sample designation should be explicitly included to avoid ambiguity and improve readability.
Reply: Thanks for your kind suggestion. Sample identifications in Figure 2 are added in this revision.

Figure 3. (a) Normalized resistance changes of composites with different PEDOT:PSS content under stretching; resistance changes of PEDOT:PSS/GM/PDMS-0.75 during (b) load-release at different tensile strains and (c) different frequencies; (d) schematic illustration of structural evolution of graphene layer and PEDOT:PSS layer in PEDOT:PSS/GM/PDMS-0.75 during stretching process.
Comment 5. The claimed temperature-insensitive performance should be quantitatively compared with previously reported sensors.
Although the manuscript claims excellent temperature stability over a wide temperature range, no direct comparison with the current state-of-the-art is provided. A comparison table summarizing key performance metrics (temperature range, temperature coefficient of resistance (TCR), gauge factor, sensing range, durability, conductivity, and fabrication strategy) would clearly demonstrate the novelty and practical advantages of the proposed sensor.
Reply: Thanks for your kind suggestion. The sensing performance of EDOT:PSS/GM/PDMS-0.75 with published PEDOT:PSS-based strain sensors are compared. Relevant discussions are added in this revision.
Page 8, Section 3: “Table 1 compares PEDOT:PSS/GM/PDMS-0.75 with published PEDOT:PSS-based strain sensors in sensing range, GF value and temperature effects. Existing works exhibit obvious performance tradeoffs: many high-GF sensors only support ultra-narrow sensing ranges, while sensors with broad working strain ranges deliver low GF values; many prior studies also omit temperature-dependent resistance characterization. By contrast, the sensor in this work achieves a high GF of 42 under 10% strain alongside outstanding thermal stability, with resistance remaining constant within the wide temperature window from −30 °C to 140 °C. Overall, this work attains favorable balance between high strain sensitivity and broad thermal operating tolerance, outperforming most compared PEDOT:PSS-based strain sensors for practical variable-temperature sensing applications.”
Table 1. Comparison of PEDOT:PSS/GM/PDMS-0.75 with reported works.
|
Ref |
Materials |
Sensing range |
GF value |
Temperature effects |
|
[33] |
PEDOT:PSS/PDMS |
150% |
17.1 |
N/A |
|
[34] |
PEDOT:PSS/natural rubber |
10% |
123.8 |
N/A |
|
[35] |
PEDOT:PSS/CNT/PDMS |
50% |
9 |
N/A |
|
[36] |
Fe nanowires/graphene/PEDOT:PSS |
80% |
7.8 |
N/A |
|
[37] |
Graphene/Pd/PEDOT:PSS |
60% |
18 |
N/A |
|
[38] |
PEDOT:PSS/RGO/PDMS |
21% |
8.3 |
Resistance changes in 30~50℃ |
|
[39] |
PEDOT:PSS/graphene |
50% |
1.9 |
Resistance increases with temperature |
|
[40] |
DMSO-doped PEDOT:PSS film |
2% |
2 |
Resistance keeps stable in 20~100℃ |
|
[19] |
Graphene foam/PEDOT:PSS/PDMS |
80% |
0.15 |
Resistance keeps stable in -30~145℃ |
|
This work |
Graphene mesh/PEDOT:PSS/PDMS-0.75 |
10% |
42 |
Resistance keeps stable in -30~140℃ |
Reference
19 Wu Y, Tang H, Wang L, Zong Y, Jia J, Sun L, et al. Temperature-insensitive stretchable conductors based on hierarchical double-layer graphene foams/PEDOT:PSS networks. Composites Science and Technology. 2023;242:110190.
33 Luo R, Li X, Li H, Du B, Zhou S. A stretchable and printable PEDOT:PSS/PDMS composite conductors and its application to wearable strain sensor. Progress in Organic Coatings. 2022.
34 Ren T, Yang H, Zhang J, Lv K, Kong D, Jiang F, et al. PEDOT:PSS/Natural Rubber Latex Inks for Screen‐Printing Multifunctional Wearable Strain–Humidity Sensors. Advanced Engineering Materials. 2023;25(21).
35 Kim T, Kim D, Joo Y, Park J, Yoon J, Hong Y. Crack propagation design in transparent polymeric conductive films via carbon nanotube fiber-reinforcement and its application for highly sensitive and mechanically durable strain sensors. Smart Materials and Structures. 2019;28(2):025008.
36 Yang Pa, Xiang S, Li R, Ruan H, Chen D, Zhou Z, et al. Highly Stretchable and Sensitive Flexible Strain Sensor Based on Fe NWs/Graphene/PEDOT:PSS with a Porous Structure. International Journal of Molecular Sciences2022. p. 8895.
37 Ramírez J, Rodriquez D, Urbina AD, Cardenas A, Lipomi DJ. Combining High Sensitivity and Dynamic Range: Wearable Thin-Film Composite Strain Sensors of Graphene, Ultrathin Palladium, and PEDOT:PSS. Acs Applied Nano Materials. 2019.
38 Zhang F, Hu H, Islam M, Peng S, Wang CH. Multi-modal strain and temperature sensor by hybridizing reduced graphene oxide and PEDOT:PSS. Composites Science and Technology. 2019;187:107959.
39 Chen Y, Wang T, Wu Y, Bai W, Dong J. Screen-printing of eco-friendly PEDOT: PSS/graphene composite ink for flexible electronics. IOP Publishing Ltd.
40 Choi Y, Kim TH, Song JH, Jung BK, Kim W, Bae J, et al. Charge transport transition of PEDOT:PSS thin films for temperature-insensitive wearable strain sensors. Nanoscale. 2023.
Comment 6. The influence of PEDOT:PSS loading requires further discussion.
The manuscript demonstrates that increasing PEDOT:PSS content improves conductivity while reducing the gauge factor beyond the optimum composition. However, the physical origin of this trade-off is only briefly mentioned. A more detailed discussion correlating PEDOT:PSS loading with conductive network density, crack evolution, electron transport pathways, and strain transfer efficiency would greatly improve the scientific depth of the manuscript.
Reply: Thanks for your kind suggestion. A more detailed discussion about the sensing performance difference between single conductive layer of GM and double conductive layer of PEDOT:PSS/GM are added in this revision.
Page 4, Section 3: “As shown in Fig. 3a, the resistance of GM/PDMS increased by ~200% at tensile strain of 5%. Although a high GF value of 79 was obtained, the narrow sensing range restricted the actual application. The sensing performance of composites improved with PEDOT:PSS coatings, due to the double-layer conductive network. PEDOT:PSS/GM/PDMS-0.75 exhibited increased resistance of 415% at 10% strain, showing a high GF value of 41.5 and wide sensing range, simultaneously. With higher coating content, the GF value of composites slightly decreased, resulting from excessive PEDOT:PSS. Fig. 3b presents the dynamic electromechanical response of PEDOT:PSS/GM/PDMS-0.75 under cyclic tensile loading–unloading tests. Under a fixed tensile strain of 10%, the sensor maintained stable resistance signals across different testing frequencies (Fig. 3c).
Fig. 3d shows changes of conductive channels during stretching process for GM/PDMS and PEDOT:PSS/GM/PDMS-0.75. Grey sheets denote graphene layers, blue regions represent PEDOT:PSS layers, and red arrows mark continuous conductive channels. At pristine state, graphene and PEDOT:PSS sheets overlap tightly to form intact, continuous conductive channels for efficient charge transfer. At 5% strain, applied tension pulls apart graphene sheets, breaking conductive pathways formed by graphene, resulting in conductivity lost of GM/PDMS with single conductive layer. For PEDOT:PSS/GM/PDMS-0.75, the PEDOT:PSS layer dominates charge transport, endowing the composite with sustained electrical conductivity. At 10% strain, severe stretching leads to massive detachment of both graphene and PEDOT:PSS sheets, resulting in rapid resistance increasing. Therefore, despite a minor reduction in GF value, PEDOT:PSS/GM/PDMS-0.75 exhibits superior sensing performance compared with GM/PDMS for a much larger strain sensing range.”

Figure 3. (a) Normalized resistance changes of composites with different PEDOT:PSS content under stretching; resistance changes of PEDOT:PSS/GM/PDMS-0.75 during (b) load-release at different tensile strains and (c) different frequencies; (d) schematic illustration of structural evolution of graphene layer and PEDOT:PSS layer in PEDOT:PSS/GM/PDMS-0.75 during stretching process.
Round 2
Reviewer 1 Report
Comments and Suggestions for AuthorsSee file
Comments for author File: Comments.pdf
Author Response
Reviewer #1:
The revised manuscript “Double-layer conductive network reinforced PDMS nanocomposites for temperature-insensitive strain sensing” by Lei Wang et al., reports the results of experimental investigations of a double-layer conductive structure fabricated by coating highly conductive poly(3,4-ethylenedioxythiophene) polystyrene sulfonate (PEDOT:PSS) on a graphene mesh. It was found that the resulting composites PEDOT:PSS/GM/PDMS-0.75 exhibit conductivity (8.1 S/cm), high gauge factor (~42), good reliability (1000 cycles) and stable sensing performance
within -30~140 which significantly broadened their practical applications.
The results presented by the authors may be of interest for research in the field of resistive strain sensor technology. It should be noted that the experimental results obtained in this study are new and interesting. The topic and materials of the study are consistent with the scope of the journal Sensors. The authors revised the manuscript based on the reviewer's comments. In particular, the Introduction and Results sections, as well as the presentation style, were edited and improved. The revised version contains several additional figures and Table 1. The authors described the sample preparation process in more detail and improved the explanation of the obtained results. The results and analysis of the temperature dependences of the sample resistivity in the temperature range from -30 to 140℃ have been added. It is important to confirm that the experimental section of this article is now detailed and sufficiently informative. I believe that most of the authors' additions to the text are more or less appropriate. Overall, I think this revised manuscript looks better than the original version.
In conclusion, the topic of this revised manuscript is consistent with the scope of the journal Sensors. The authors have revised the manuscript in accordance with the reviewer's recommendations. The revised manuscript is sufficiently improved to justify publication in Sensors. The revised manuscript may be accepted for publication in Sensors.
.
Reply: Thank you very much for your positive comments on this work and the manuscript.
Author Response File: Author Response.pdf
Reviewer 3 Report
Comments and Suggestions for AuthorsThe authors have satisfactorily addressed most of my previous comments through substantial revisions, additional experimental results, and expanded discussions. The revised manuscript now provides clearer explanations of the sensing mechanism, cycling repeatability, temperature-dependent behavior, and the influence of PEDOT:PSS loading. In particular, the newly added long-term cycling data and comparison with previously reported PEDOT:PSS-based strain sensors considerably strengthen the experimental support for the main conclusions. I appreciate the authors’ careful efforts in revising the manuscript, and I consider my major concerns to have been adequately resolved.
1. I have only one minor comment regarding the definition and presentation of the gauge factor (GF). Figure 3(a) shows a clearly nonlinear relationship between the normalized resistance change and tensile strain, indicating that the sensitivity varies with strain rather than remaining constant over the entire sensing range. Therefore, the reported GF value of 41.5, calculated from a resistance change of 415% at 10% strain, should be described explicitly as an average GF over the 0–10% strain range, rather than simply as the GF of the sensor. For example, the authors may revise the relevant sentence to read: “The average GF over the entire sensing range (0–10%) was 41.5.”
Alternatively, if the response curve can be divided into approximately linear regimes, the authors may report strain-dependent GF values obtained from the slopes of linear fits within the respective ranges. For example, such a description could be written as: “The sensor exhibited three linear regions with GF values of 8.2 (0–2%), 24.7 (2–6%), and 68.5 (6–10%).” These values are provided only as an illustrative reporting format and should, of course, be replaced by GF values determined from regression analysis of the actual experimental data. The corresponding fitting ranges, fitting equations, and coefficients of determination should also be reported if the authors adopt this piecewise-linear approach. Either the average-GF description or the strain-dependent, piecewise GF analysis would clarify how the sensitivity was determined and prevent readers from interpreting 41.5 as a constant GF throughout the entire strain range.
Author Response
Comment 1. I have only one minor comment regarding the definition and presentation of the gauge factor (GF). Figure 3(a) shows a clearly nonlinear relationship between the normalized resistance change and tensile strain, indicating that the sensitivity varies with strain rather than remaining constant over the entire sensing range. Therefore, the reported GF value of 41.5, calculated from a resistance change of 415% at 10% strain, should be described explicitly as an average GF over the 0–10% strain range, rather than simply as the GF of the sensor. For example, the authors may revise the relevant sentence to read: “The average GF over the entire sensing range (0–10%) was 41.5.”
Alternatively, if the response curve can be divided into approximately linear regimes, the authors may report strain-dependent GF values obtained from the slopes of linear fits within the respective ranges. For example, such a description could be written as: “The sensor exhibited three linear regions with GF values of 8.2 (0–2%), 24.7 (2–6%), and 68.5 (6–10%).” These values are provided only as an illustrative reporting format and should, of course, be replaced by GF values determined from regression analysis of the actual experimental data. The corresponding fitting ranges, fitting equations, and coefficients of determination should also be reported if the authors adopt this piecewise-linear approach. Either the average-GF description or the strain-dependent, piecewise GF analysis would clarify how the sensitivity was determined and prevent readers from interpreting 41.5 as a constant GF throughout the entire strain range.
Reply: Thanks for your kind suggestion. We have revised the relevant description in the manuscript to “The average GF over the entire sensing range (0–10%) was 41.5” as you recommended, to avoid misleading readers regarding the strain-dependent sensitivity of our sensor.
Page 4, Section 3: “…PEDOT:PSS/GM/PDMS-0.75 exhibited increased resistance of 415% at 10% strain, showing a high average GF value of 41.5 over the entire sensing range (0~10%).”
Author Response File: Author Response.pdf
