1. Introduction
With the continuous expansion of power systems and the rapid advancement of smart grid infrastructures, increasing demands have been placed on fine-grained energy management and load-side observability. In recent years, under the strategic framework of carbon neutrality and emission reduction targets, enhancing energy efficiency, optimizing load structures, and promoting energy-saving awareness among end users have become central priorities in modern power system development. Conventional energy monitoring approaches typically rely on deploying dedicated sensors on individual appliances to measure their power consumption. However, such intrusive solutions are costly and difficult to scale in large-scale practical applications.
In contrast, Non-Intrusive Load Monitoring (NILM) enables appliance-level energy disaggregation by acquiring aggregate voltage and current signals at a single measurement point and decomposing them into individual appliance operations through advanced signal processing and learning algorithms. As summarized in prior NILM surveys, this non-intrusive sensing paradigm eliminates the need for additional hardware deployment while providing fine-grained consumption insights for smart homes, energy management systems, demand response, and intelligent power grids [
1].
Early studies on NILM primarily relied on handcrafted features and traditional machine learning techniques, such as those based on power variations, harmonic components, and transient signatures. Although these methods achieved reasonable performance under controlled conditions, they are heavily dependent on expert knowledge and often suffer from limited generalization capability in complex environments or when the number of appliance types increases. With the rapid development of deep learning, neural NILM models based on feed-forward networks, recurrent LSTM structures, and sequence-to-point learning have been increasingly adopted for energy disaggregation [
2,
3,
4]. Residual CNN backbones further provide an effective basis for image-based feature recognition tasks [
5]. To further enhance feature extraction and temporal modeling, recent advancements have pushed the boundaries of neural NILM by incorporating more sophisticated architectures. For instance, deep convolutional neural networks combined with load trajectories and multi-feature fusion have demonstrated superior discriminative capabilities [
6]. Building upon this, cutting-edge multi-stream networks have been recently proposed to fuse multimodal sequential and image features, utilizing interpretable screening mechanisms to effectively reduce redundancy and mitigate inter-class load confusion in complex scenarios [
7]. Concurrently, transformer-based attention mechanisms have been introduced to capture long-range temporal dependencies more effectively [
8], while multi-appliance-task learning frameworks have been proposed to address the challenge of limited labeled data in practical scenarios [
9]. Public datasets such as PLAID have also promoted the reproducible evaluation of these advanced load identification methods [
10].
Within this paradigm, a critical challenge lies in how to effectively transform raw electrical signals into representations that are well-suited for deep learning models. Feature-engineering studies have explored binary VI trajectory mapping, low-frequency spectral signatures, and VI-trajectory-based load monitoring algorithms to capture appliance-specific electrical behavior [
11,
12,
13]. VI trajectory images have also been combined with CNNs for appliance classification [
14]. Furthermore, to mitigate the loss of magnitude and temporal characteristics during standard trajectory pixelation, recent state-of-the-art frameworks have introduced visualized color V-I trajectories combined with self-supervised contrastive learning and adversarial domain adaptation to effectively align cross-domain feature distributions [
15]. In parallel, denoising autoencoders and transient-signal representations have been used to improve NILM robustness under different sampling conditions [
16,
17]. Hybrid ANN-PSO frameworks and Siamese-network identification further show the value of optimization and metric-learning strategies in NILM [
18,
19,
20].
However, existing VI-based methodologies encounter three critical bottlenecks in practical complex scenarios. First, appliances with similar internal topologies (e.g., heating devices) exhibit highly analogous VI trajectories, making it difficult to distinguish them purely by geometric shape. Second, the standard normalization process in VI trajectory mapping inherently suppresses amplitude information, which is a vital discriminative factor for differentiating appliances of the same type but with distinct power ratings. Third, static VI trajectories fail to capture the transient and dynamic impedance variations that occur during appliance operation. Due to these unresolved challenges, readers and practitioners are often limited by the constrained discriminative power of traditional methods.
To bridge this research gap and overcome the aforementioned bottlenecks, this paper proposes a dual-stage cyclic training method for load identification that integrates multi-feature reconstruction with Particle Swarm Optimization (PSO). The main contributions of this study to the NILM and machine learning literature are threefold:
Novel VI Trajectory Reconstruction Methodology: We propose a threshold-based reflection transformation algorithm optimized by PSO. This explicitly disrupts the high structural similarity of original VI trajectories, enhancing the geometric and morphological differences among appliances with analogous operations.
Dynamic and Energy-Level Feature Augmentation: To resolve the issues of weakened amplitude information and the absence of dynamic characteristics in traditional VI images, we introduce two complementary features: the conductance-time trajectory (capturing dynamic impedance) and the Current-Squared Energy Colormap (capturing global energy differences).
Closed-loop Combinatorial Optimization Framework: We design an integrated deep learning architecture that fuses the three constructed features via RGB channels and continuously refines the trajectory thresholds through a “threshold optimization—feature reconstruction—cyclic training” closed loop, offering a new paradigm for adaptive feature engineering in NILM.
2. Reconstructed VI Trajectory
Existing studies typically categorize household appliances into several fundamental types, including purely resistive loads, reactive loads, loads without power factor correction, loads with power factor correction, and complex or hybrid-structure loads. Appliances within the same category generally exhibit highly similar electrical characteristics, particularly in their current trajectories. Event-based recognition and scalable real-time NILM systems have also shown that such similarities complicate robust appliance discrimination in practical settings [
21,
22]. During steady-state operation, although the supply voltage may exhibit minor fluctuations, it remains relatively stable within a standard range. Consequently, accurate load characterization requires jointly analyzing both voltage and current signals, as current variations are inherently influenced by voltage dynamics.
A widely adopted approach is to map single-cycle voltage and current measurements onto a two-dimensional plane to construct voltage–current (VI) trajectory images. This representation has demonstrated strong capability in capturing appliance-specific electrical features and has been extensively used in NILM tasks [
23]. Real-time simultaneous-switching monitoring, empirical VI-signature analysis, and embedded low-sampling-rate identification further indicate that VI-based features must retain both morphology and amplitude-related information [
24,
25,
26]. However, despite its effectiveness, the VI trajectory representation suffers from inherent limitations. For appliances belonging to the same fundamental category, their VI trajectories tend to exhibit high structural similarity, which significantly increases the difficulty of discrimination. This issue becomes more pronounced when differences primarily lie in current amplitude rather than waveform shape. In such cases, even when the original current waveforms differ considerably within a cycle, the resulting VI trajectories may still appear nearly indistinguishable after mapping. This phenomenon arises because many appliances share similar internal components and operating principles, leading to comparable waveform patterns. As a result, without explicitly incorporating amplitude-related information from both voltage and current signals, it remains challenging to achieve reliable appliance-level discrimination. To address these challenges, this study proposes a reconstructed VI trajectory method, which enhances the discriminative capability of traditional VI representations by transforming the original voltage–current mapping through a novel reconstruction strategy.
2.1. Reconstruction Algorithm
After the appliance reaches a steady operating state and remains stable for a sufficient duration, multiple single-cycle voltage and current sequences, denoted as
v and
i, are collected according to the condition defined in (1).
Using the acquired raw data, the original voltage–current (VI) trajectory is first constructed. Subsequently, the trajectory is reconstructed by applying a threshold-based reflection transformation to both voltage and current signals, as described in (2)–(7).
In these equations, the operator % denotes the remainder operation, and
represents the floor operator. The variables
and
denote the
k-th sample point of the voltage and current sequences within a power-frequency cycle, respectively. The parameters
and
represent the predefined voltage and current thresholds, while
and
denote the reconstructed voltage and current values after transformation. Following reconstruction, the transformed voltage and current sequences are normalized to ensure that their values fall within a unified range, thereby facilitating consistent feature representation. Based on the reconstructed and normalized sequences, a VI trajectory image is generated using an RGB color encoding scheme. Specifically, the voltage sequence is mapped to the vertical axis, and the current sequence is mapped to the horizontal axis. The trajectory is rendered in red (RGB: 255, 0, 0), while the background is set to black (RGB: 0, 0, 0), resulting in a visually structured representation suitable for subsequent input into deep learning models.
2.2. Threshold Optimization Based on Particle Swarm Optimization
The proposed reconstruction method relies on threshold-based reflection applied to voltage and current signals. The selection of these thresholds plays a critical role in determining the quality of the reconstructed VI trajectories. Specifically, excessively large thresholds may lead to over-compression along the current axis, resulting in the loss of fine-grained electrical characteristics, whereas overly small thresholds may introduce excessive reflection operations, causing structural distortion of the trajectory. Both scenarios can significantly degrade the performance of the appliance identification model. Therefore, determining an optimal pair of voltage and current thresholds is essential for maximizing classification accuracy.
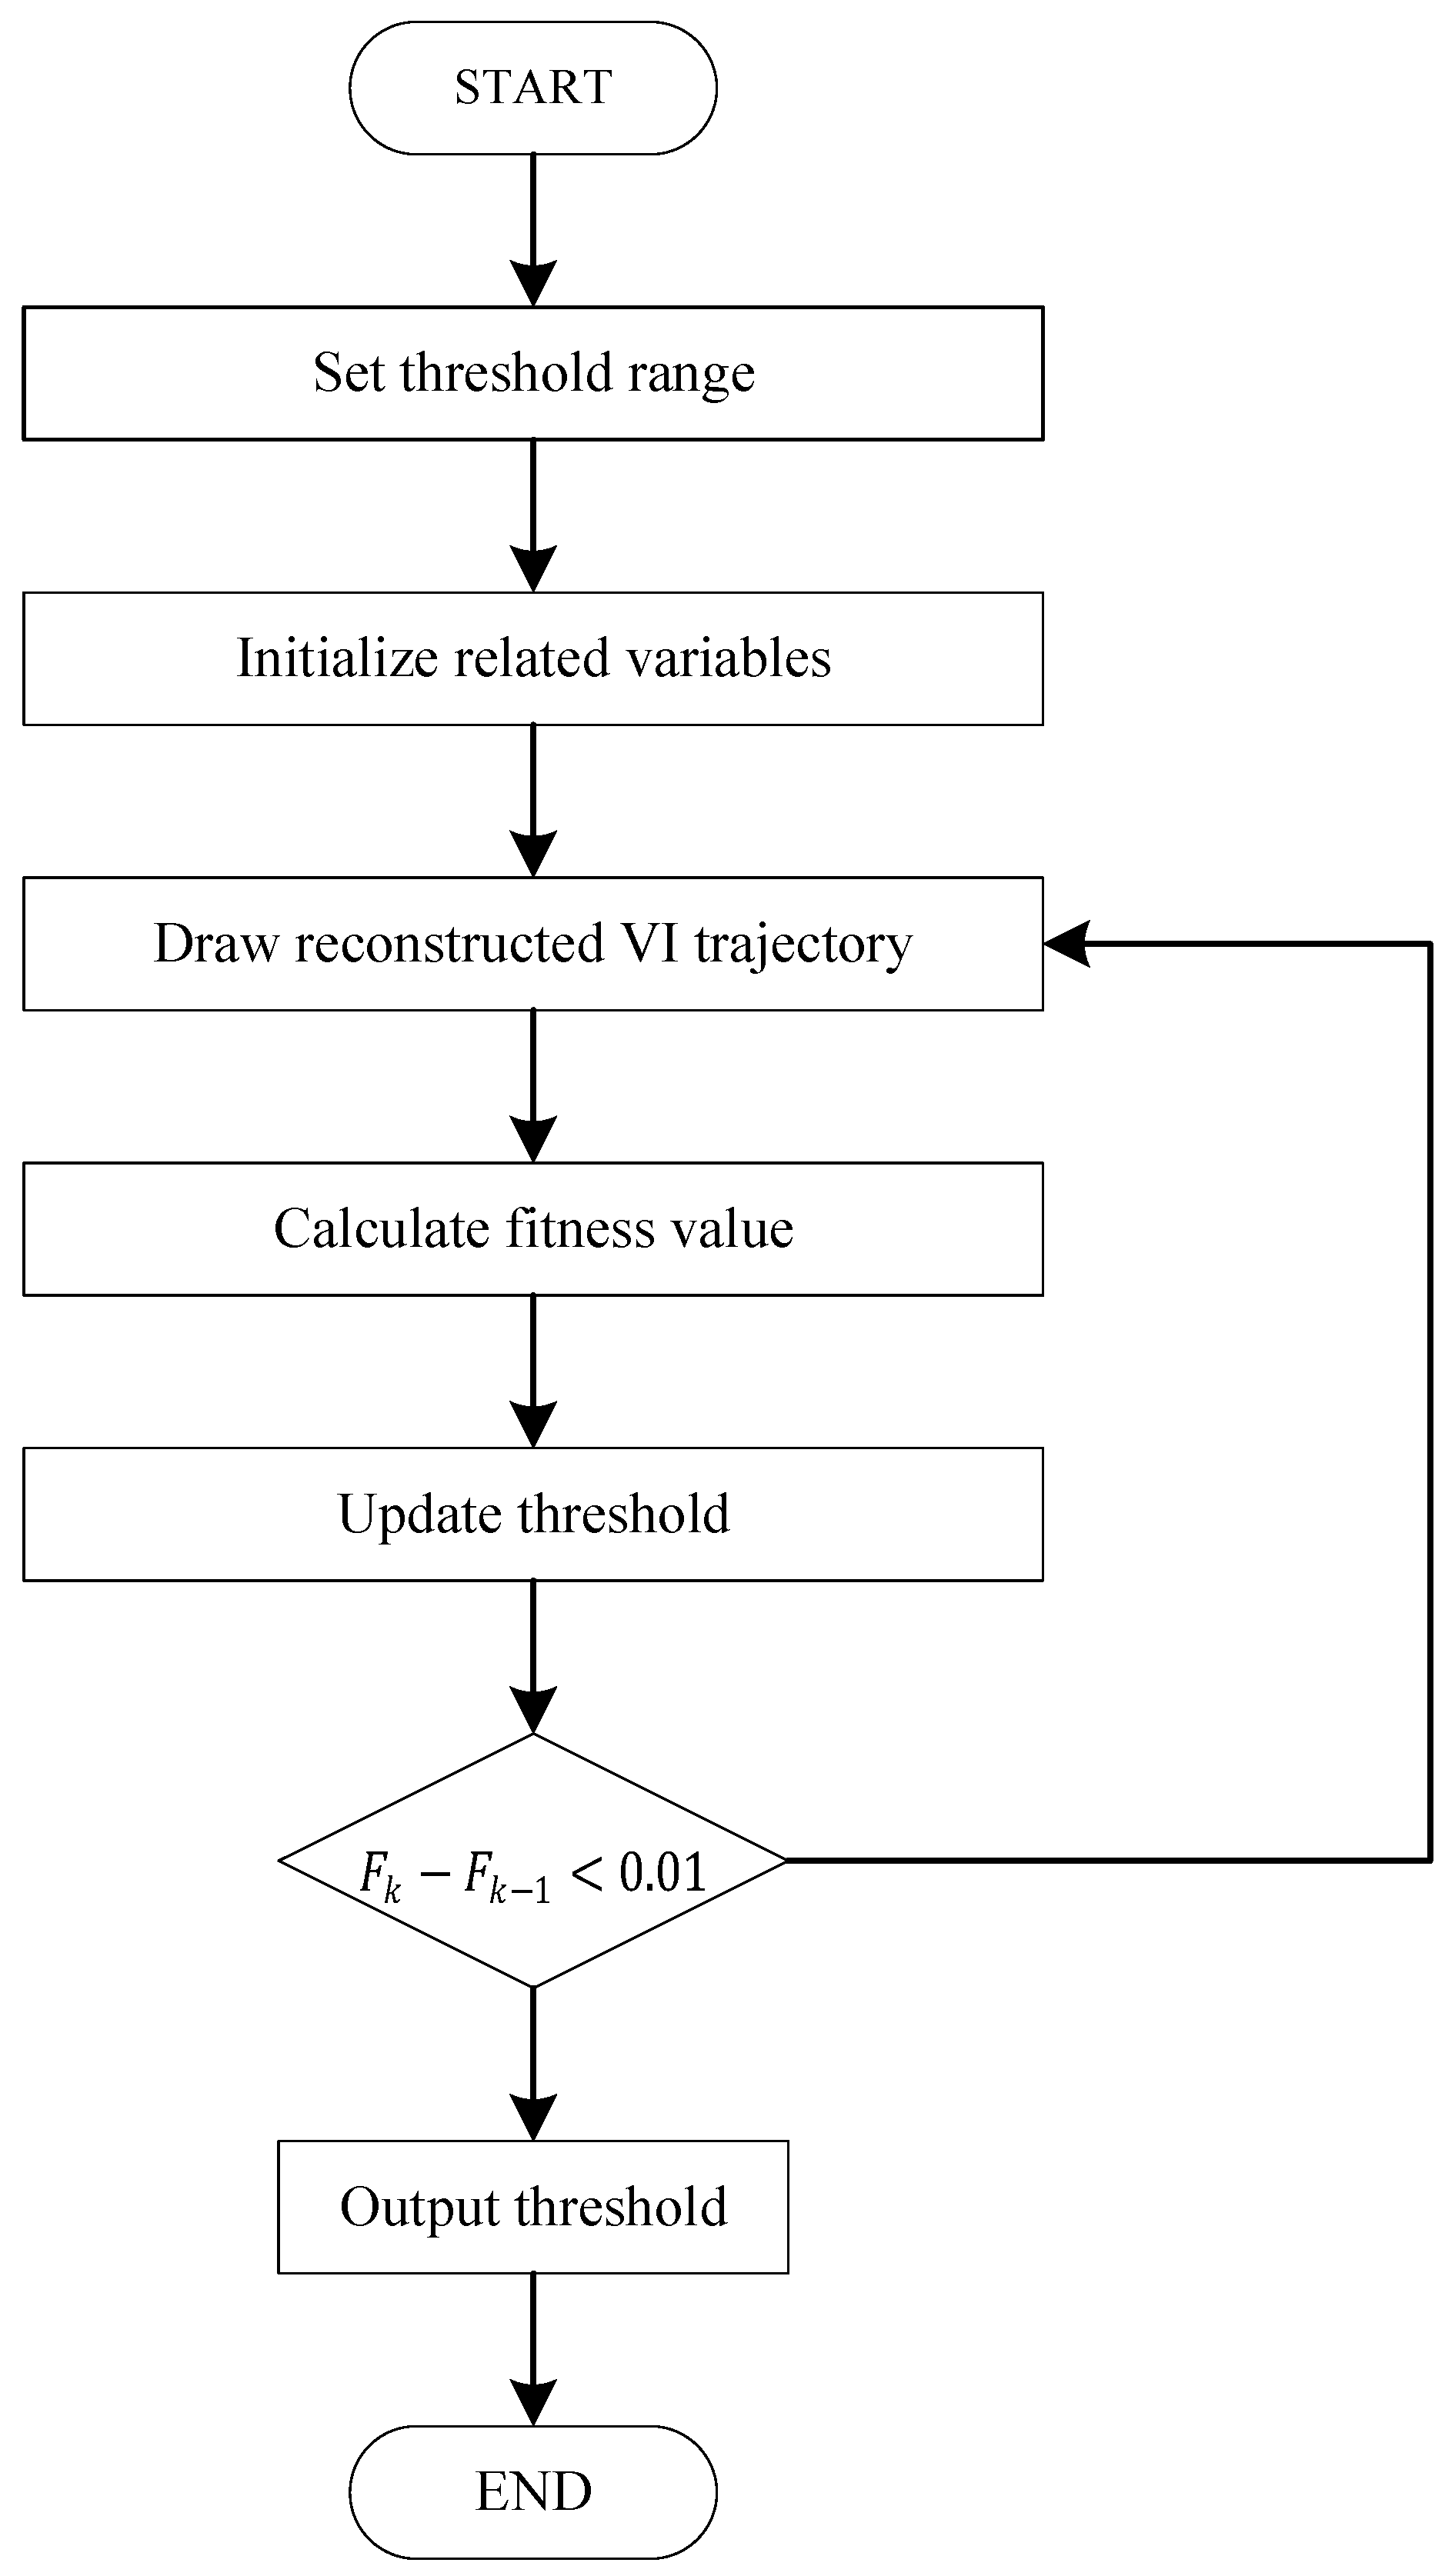
To achieve this in an efficient and adaptive manner, a Particle Swarm Optimization (PSO) algorithm is employed, as illustrated in
Figure 1 [
20]. PSO is a population-based optimization technique that iteratively searches for the optimal solution by simulating the collective behavior of particles. Each particle represents a candidate solution in the search space, and its quality is evaluated using a predefined fitness function. During the optimization process, particles update their positions and velocities based on their historical best positions and the global best solution, exhibiting a tendency to converge toward the optimal region through cooperation and competition. The PSO-based optimization procedure for voltage and current thresholds is summarized as follows:
The search ranges for the voltage and current thresholds are defined based on practical operating conditions of household appliances. Specifically, the voltage threshold is constrained within 0∼350 , while the current threshold is set within 0∼10 .
Initialize the swarm, including particle positions, velocities, inertia weights, individual best positions, and the global best position.
The fitness function is defined as in (8), which jointly considers model performance and computational efficiency
The fitness function adopts a multiplicative structure to simultaneously minimize classification error
, reconstruction loss
, and computational time
. Following the established PSO optimization framework for V-I trajectory reconstruction [
23], the multiplicative penalty is utilized to strictly avoid sub-optimal solutions where any single metric performs poorly. Furthermore, the coefficients
a,
b, and
c (constrained by
) act as attention weights that reflect the empirical “degree of attention” assigned to each attribute. This allows the model to establish a clear priority hierarchy (e.g., prioritizing accuracy over optimization time) within the multiplicative optimization space.
Update the voltage and current thresholds according to the particle positions, and reconstruct the VI trajectory images using the updated thresholds.
Compute the fitness value for each particle based on the reconstructed VI images and corresponding model performance.
Update particle velocities and positions, as well as individual and global optimal solutions, according to the PSO update rules.
Evaluate the stopping criterion. If the condition is not satisfied, return to Step 2 for further iterations; otherwise, output the optimal voltage and current thresholds as the final solution.
2.3. Reconstructed VI Trajectory Visualization
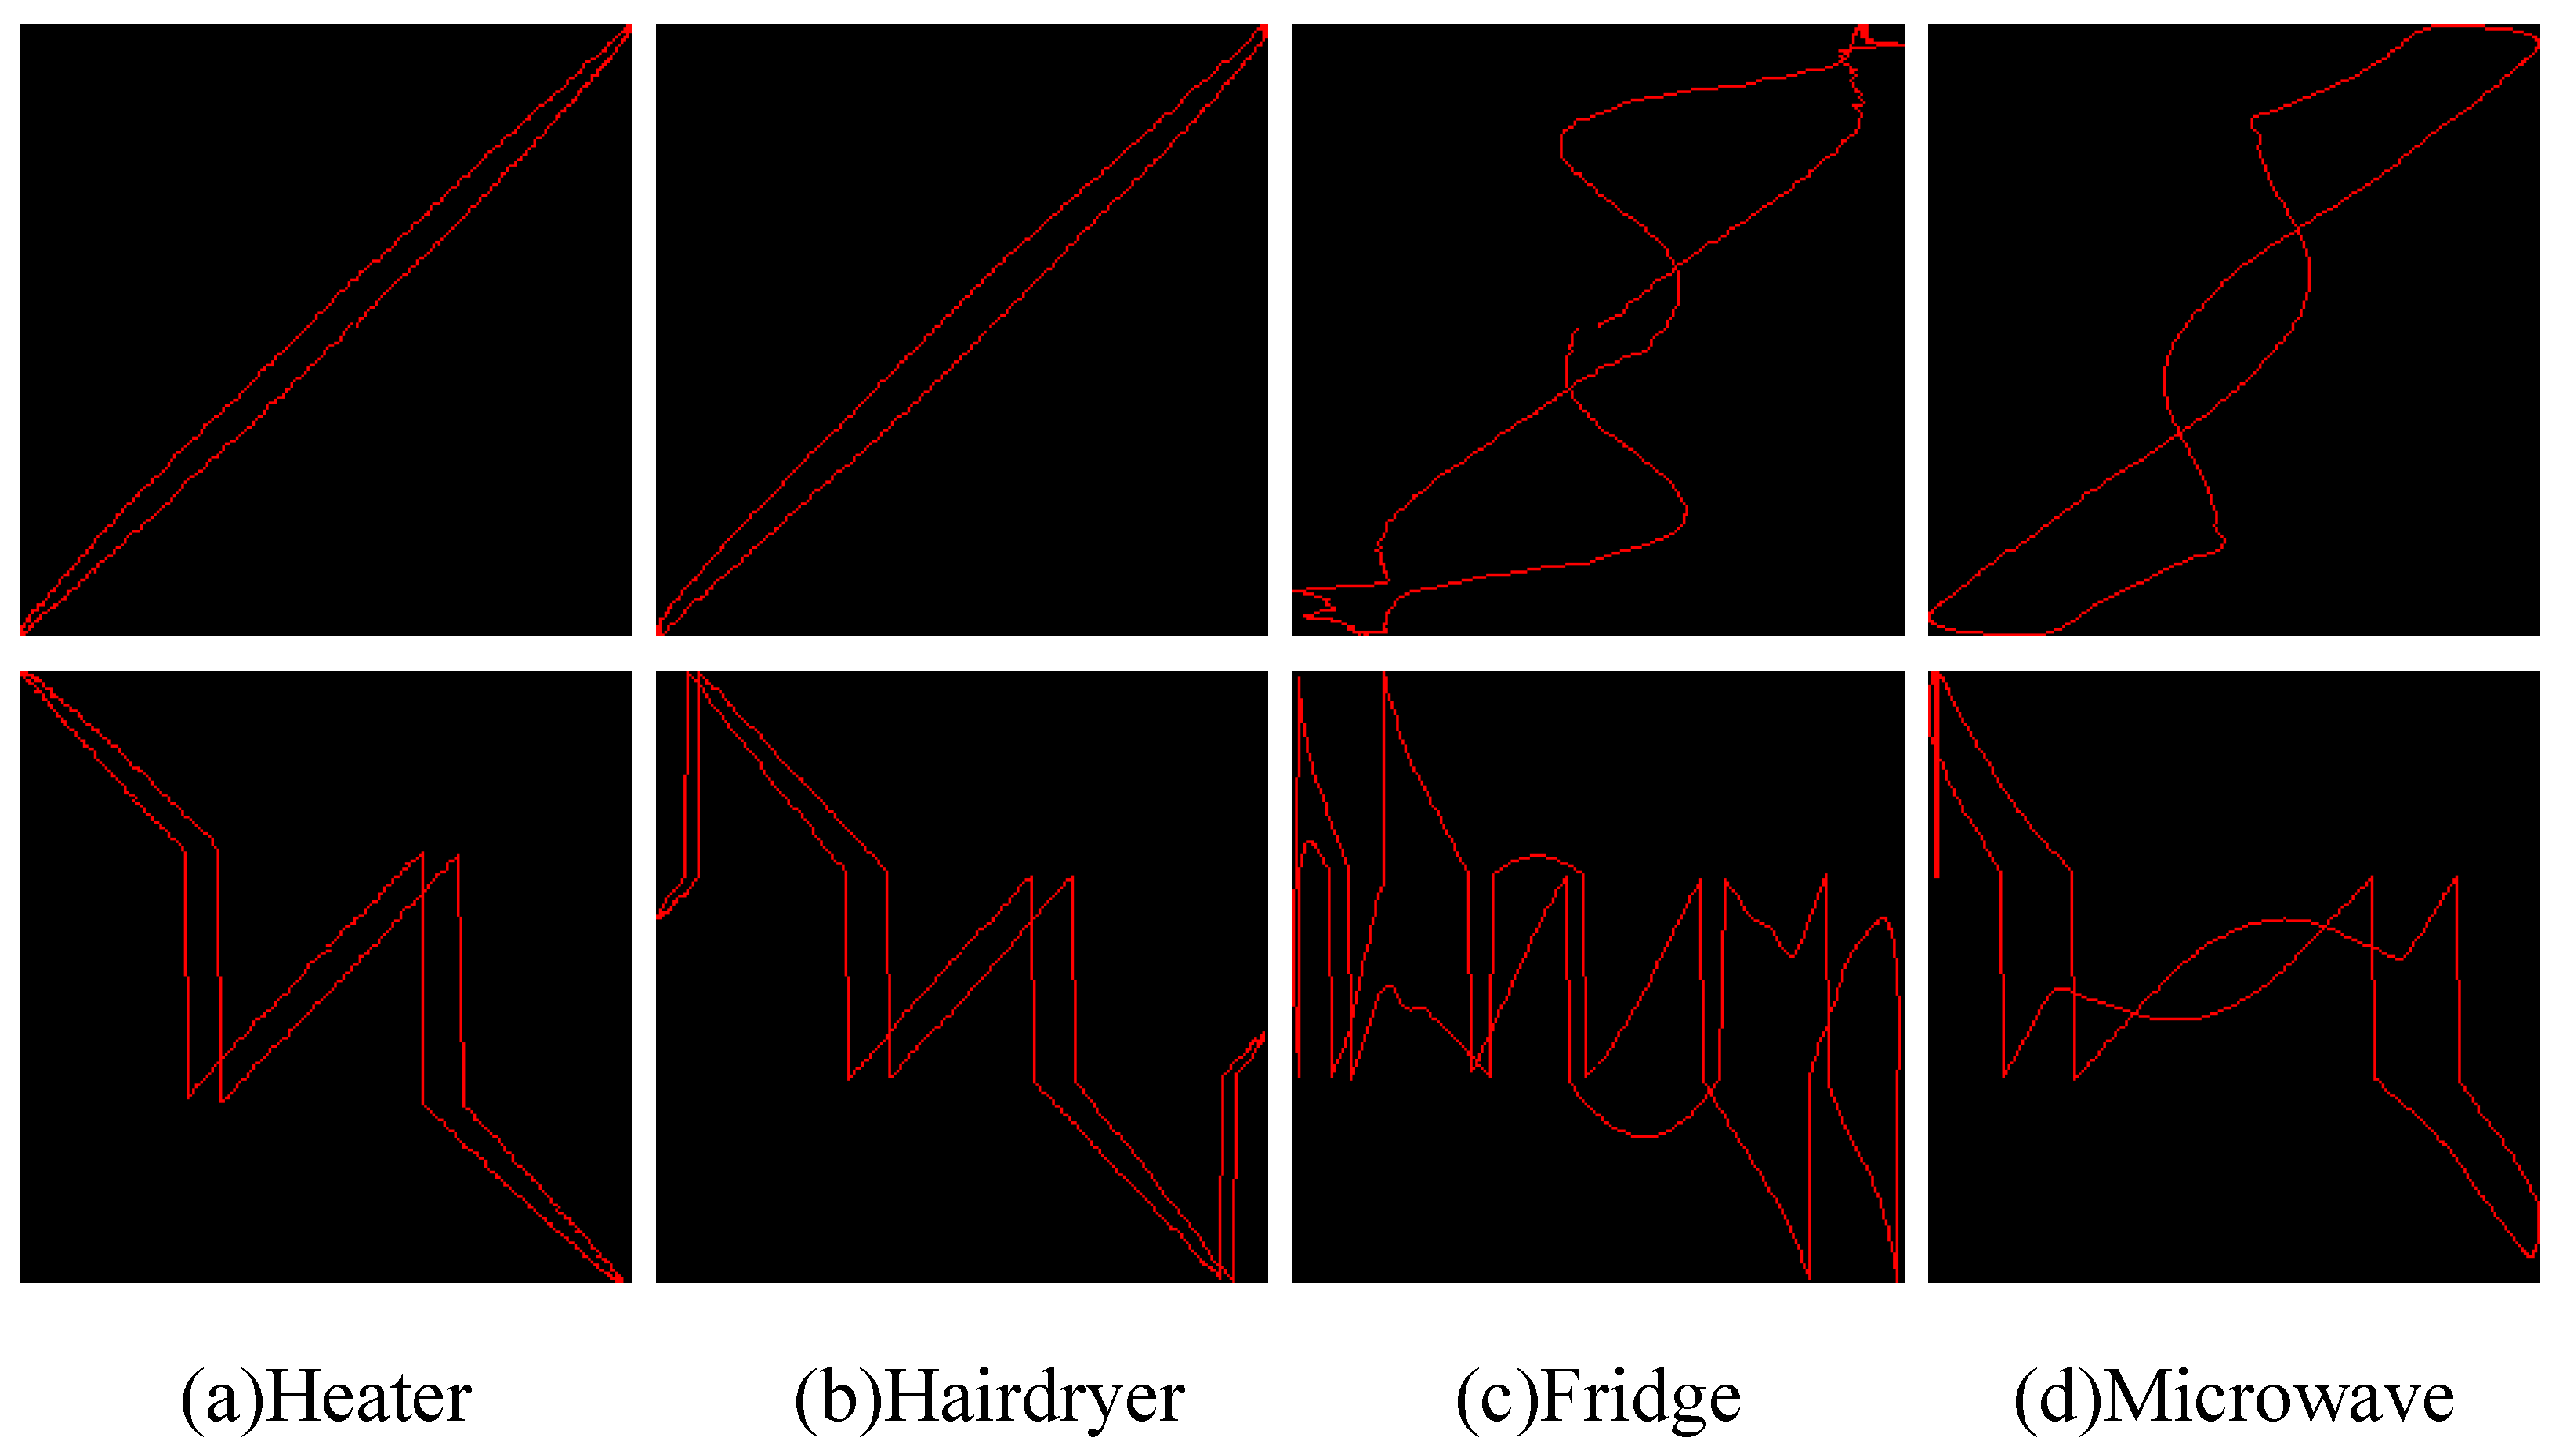
The VI trajectory images obtained after PSO-based threshold optimization and reconstruction exhibit significantly improved discriminative capability. In particular, the proposed method effectively enhances the separability of appliances that share similar electrical characteristics within the same category. As illustrated in
Figure 2, four representative household appliances—namely a heater, a hairdryer, a fridge, and a microwave—are selected to compare the original and reconstructed VI trajectory representations.
From the original VI trajectory images, it can be observed that the heater and hairdryer exhibit highly similar patterns, with almost no distinctive features that allow reliable differentiation. After applying the proposed reconstruction method, the trajectory structures undergo noticeable transformations, resulting in clearly distinguishable patterns between the two appliances. A similar phenomenon is observed for the fridge and microwave. Their original VI trajectories present strong visual similarity, which poses challenges for accurate classification. In contrast, the reconstructed trajectories significantly amplify inter-class differences, leading to more distinguishable feature representations. These results demonstrate that the proposed reconstruction strategy effectively mitigates the issue of structural similarity in conventional VI trajectories, thereby providing more discriminative features for subsequent learning-based classification models.
3. Multi-Feature Fusion and Optimization Framework
Although the reconstructed VI trajectory enhances the geometric separability of appliances through a threshold-based reflection mapping of voltage and current signals, it still presents several inherent limitations. Specifically, the normalization process applied during VI image construction inevitably weakens amplitude-related information, which is a critical discriminative factor for certain appliance types. Moreover, VI trajectories primarily capture the static phase relationship and geometric patterns between voltage and current, while failing to characterize the dynamic variations of equivalent impedance during appliance operation.
To address these limitations, this study introduces two complementary features: the conductance–time trajectory and the current-squared mean colormap. These features are designed to capture dynamic electrical behavior and global energy characteristics, respectively. A multi-feature fusion framework is further developed to jointly integrate the reconstructed VI trajectory with the proposed auxiliary features, inspired by recent feature-fusion and deep-learning NILM studies [
6,
27,
28].
3.1. Conductance–Time Trajectory
Instantaneous conductance provides a direct representation of the internal impedance characteristics of electrical appliances and their temporal variations, complementing VI-trajectory similarity analysis for appliance identification [
29]. This is particularly informative for appliances incorporating rectifiers, inductive components, or control modules, whose conductance profiles often exhibit distinct dynamic patterns compared to purely resistive loads such as heating devices. By introducing the conductance–time trajectory, the proposed method supplements the static information contained in VI images with dynamic features, enabling the model to simultaneously learn waveform morphology and time-varying electrical characteristics.
Given the acquired steady-state single-cycle voltage and current sequences, denoted as
v and
i, the instantaneous conductance
G at each sampling point is computed as
where
and
represent the voltage and current values at the
k-th sampling point within one power-frequency cycle, respectively. After obtaining the conductance sequence, the temporal information corresponding to each data point is derived based on the sampling frequency. The time interval between adjacent samples is calculated as
where
F denotes the sampling frequency. Accordingly, the timestamp of the
k-th data point can be expressed as
where
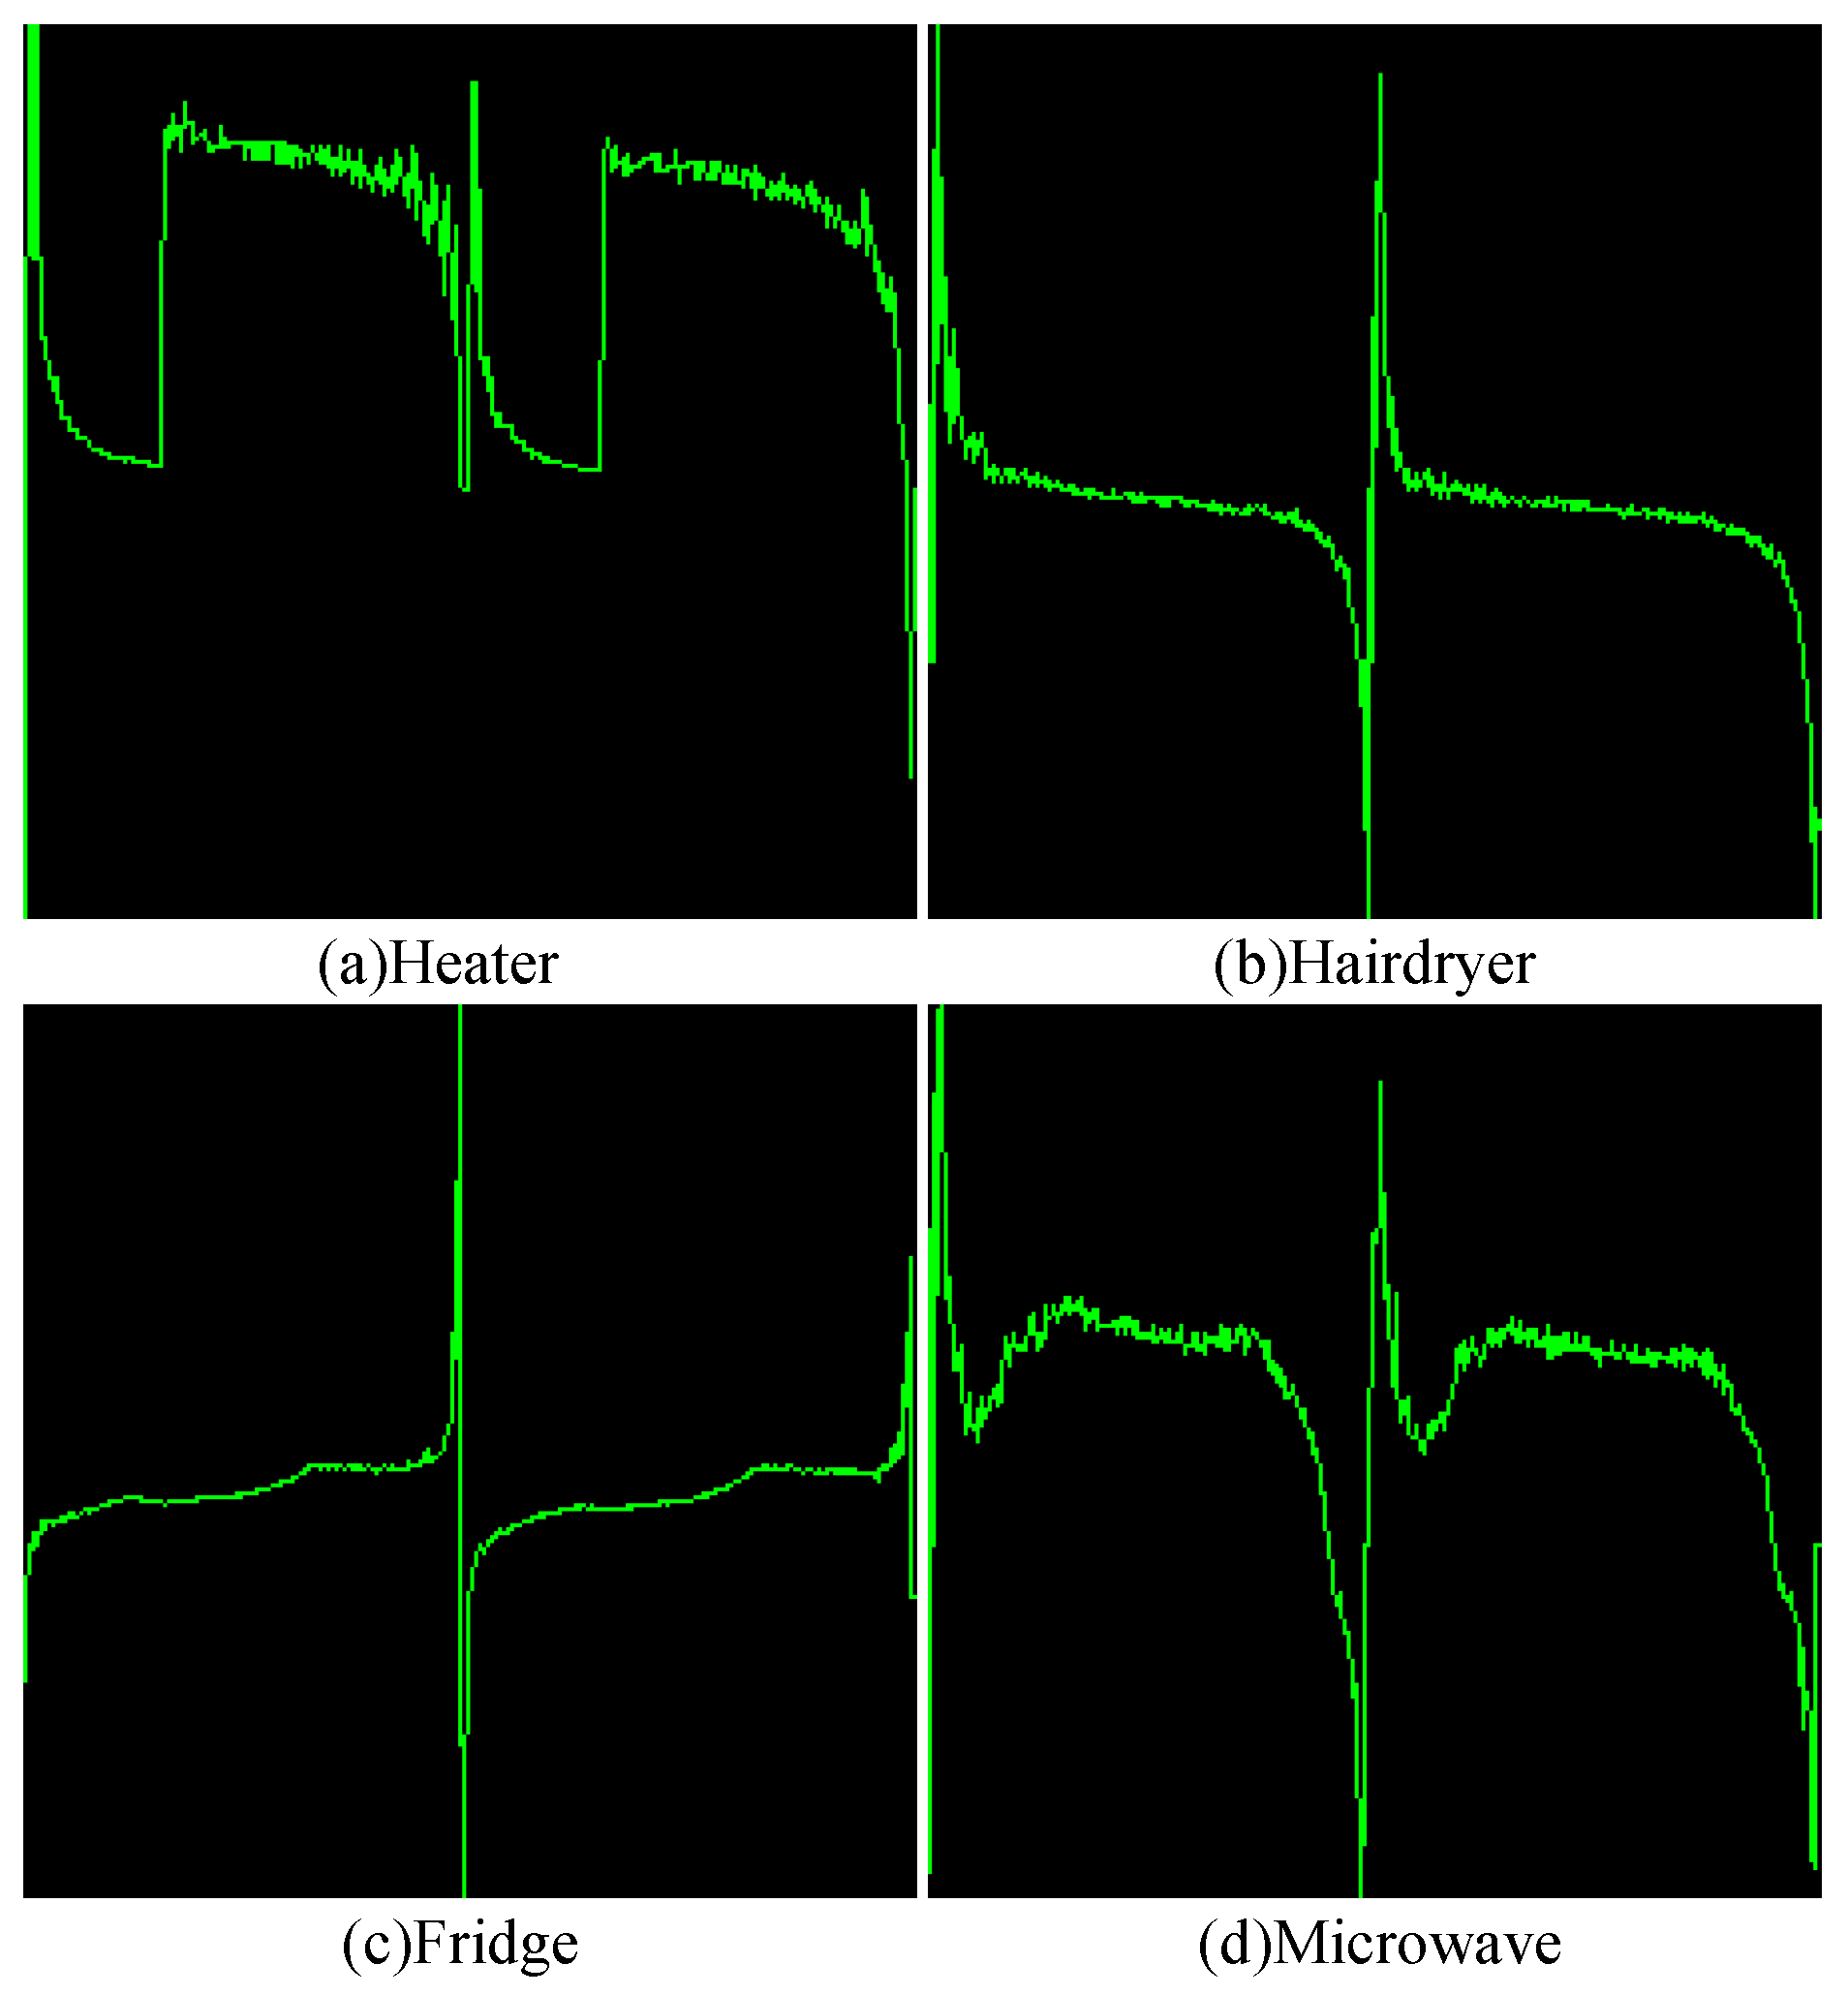
k is the index of the data point in the sequence. Using the obtained conductance and time sequences, a conductance–time trajectory image is constructed in an RGB color space. Specifically, the conductance sequence is mapped to the vertical axis, while the time sequence is mapped to the horizontal axis. The trajectory is rendered in green (RGB: 0, 255, 0) against a black background (RGB: 0, 0, 0), as illustrated in
Figure 3.
From the resulting visualization, it can be observed that high-power appliances tend to produce trajectories concentrated in the upper region of the image, whereas low-power appliances are distributed in the lower regions. Furthermore, appliances with more complex internal structures typically exhibit less smooth trajectories, reflecting richer dynamic variations during operation. These characteristics provide additional discriminative information that is not captured by conventional VI trajectory representations.
3.2. Current–Squared Energy Colormap
While the reconstructed VI trajectory and conductance–time features provide rich information in terms of geometric structure and dynamic behavior, they still lack an explicit representation of the magnitude or energy scale of appliance operation. To address this limitation, a current-squared energy colormap is introduced as a third complementary feature. This feature encodes the energy level of each appliance by combining maximum-value normalization, logarithmic compression, and global standardization, thereby enabling a comparable representation across different appliances.
As a result, it effectively compensates for the amplitude insensitivity of VI trajectories and conductance-based features. Even when appliances exhibit highly similar VI shapes or comparable conductance variations, the proposed feature can amplify inter-class differences through energy-level discrimination. To construct this feature, all single-cycle current sequences are first traversed to determine the global maximum current value across the dataset. For each appliance, the mean squared current over a single cycle is computed and normalized as follows:
where
denotes the normalized mean squared current for a single cycle,
n is the number of sampling points,
is the current square value at the
k-th sampling point, and
represents the global maximum square current value across all sequences. The use of squared current values avoids cancellation effects caused by alternating current polarity during summation. However, it also amplifies differences between large and small current values, potentially causing the resulting representation to be dominated by high-amplitude signals while diminishing distinctions among lower-amplitude appliances. To mitigate this issue, a logarithmic normalization is applied
This transformation effectively compresses the dynamic range and reduces the influence of extreme values. Nevertheless, it may weaken the separability of mid-range values. Therefore, a global standardization step is further introduced
where
and
denote the mean and standard deviation of
over the entire dataset, respectively. This step enhances the discriminability of intermediate values while maintaining robustness against outliers. Finally, the processed feature is linearly mapped to the range
for image representation
where
b denotes the mapped intensity value, and
and
are the minimum and maximum values of
, respectively. The resulting values are encoded in the blue channel of an RGB image, forming a pure blue colormap representation
.
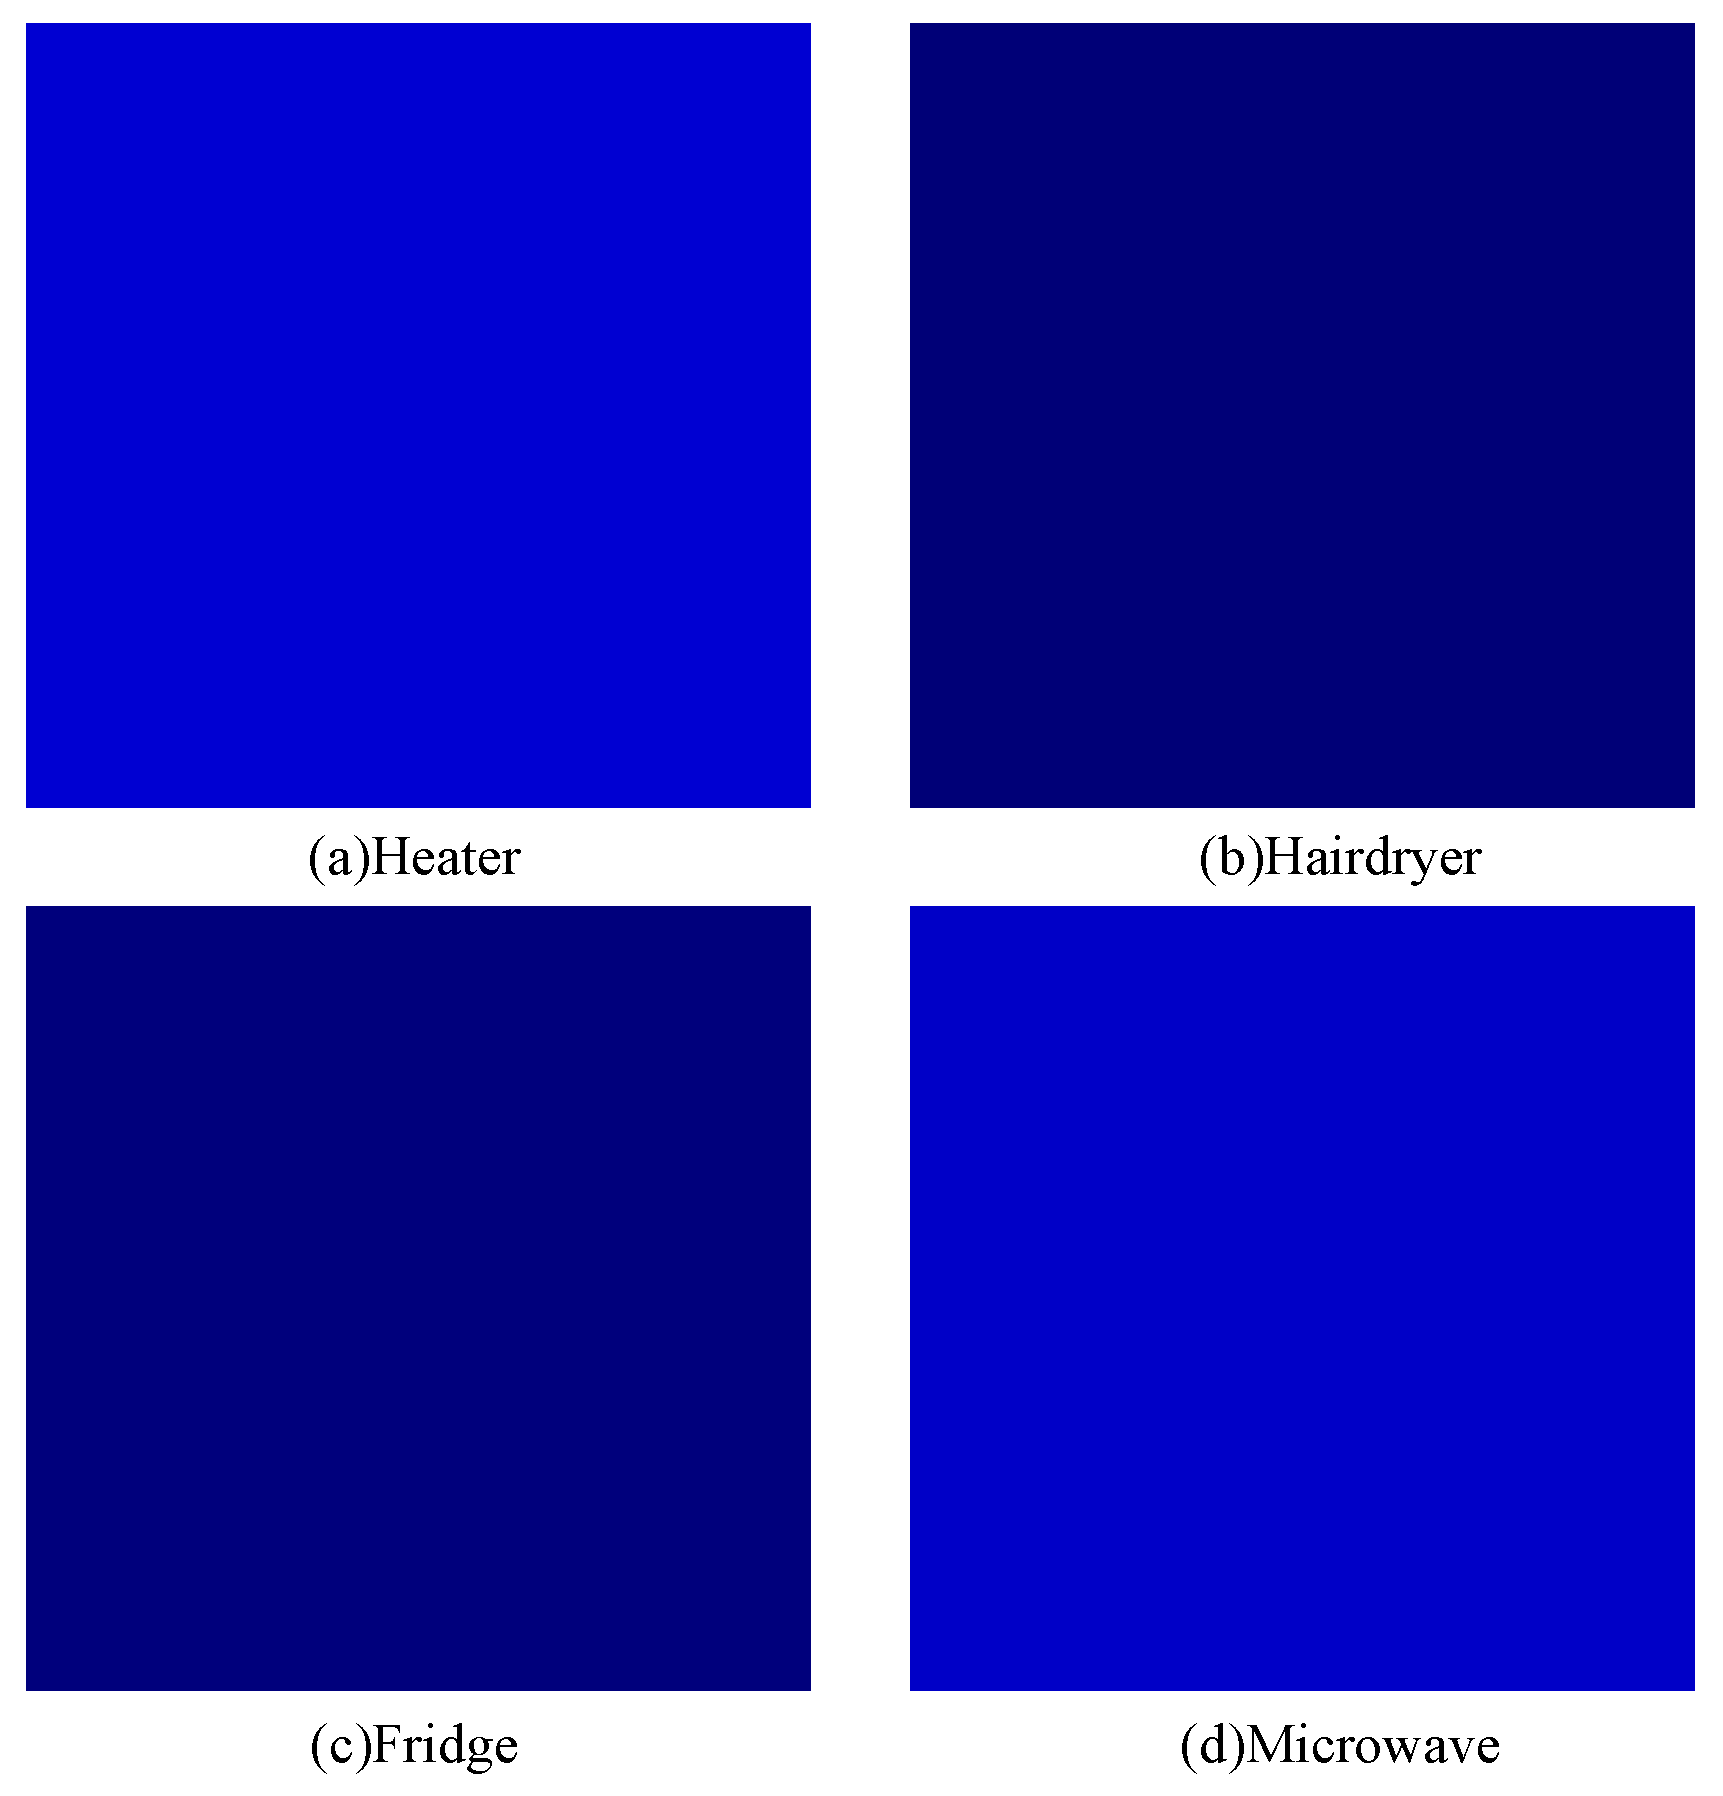
As illustrated in
Figure 4, it is evident that appliances with different energy levels exhibit distinct blue pixel intensities. Residual CNN appliance-recognition and active-learning NILM studies also indicate the importance of informative feature construction when labeled data are limited [
28,
30]. This amplitude-based representation effectively compensates for the inherent limitations of reconstructed VI trajectories and conductance–time trajectories in capturing magnitude-related information. Even for appliances exhibiting high geometric similarity in their VI trajectories, the energy colormap amplifies inter-class differences through significant variations in blue channel intensity, thereby providing highly discriminative global energy representations for the subsequent deep convolutional classification network.
3.3. Integrated Optimization and Multi–Feature Fusion Network
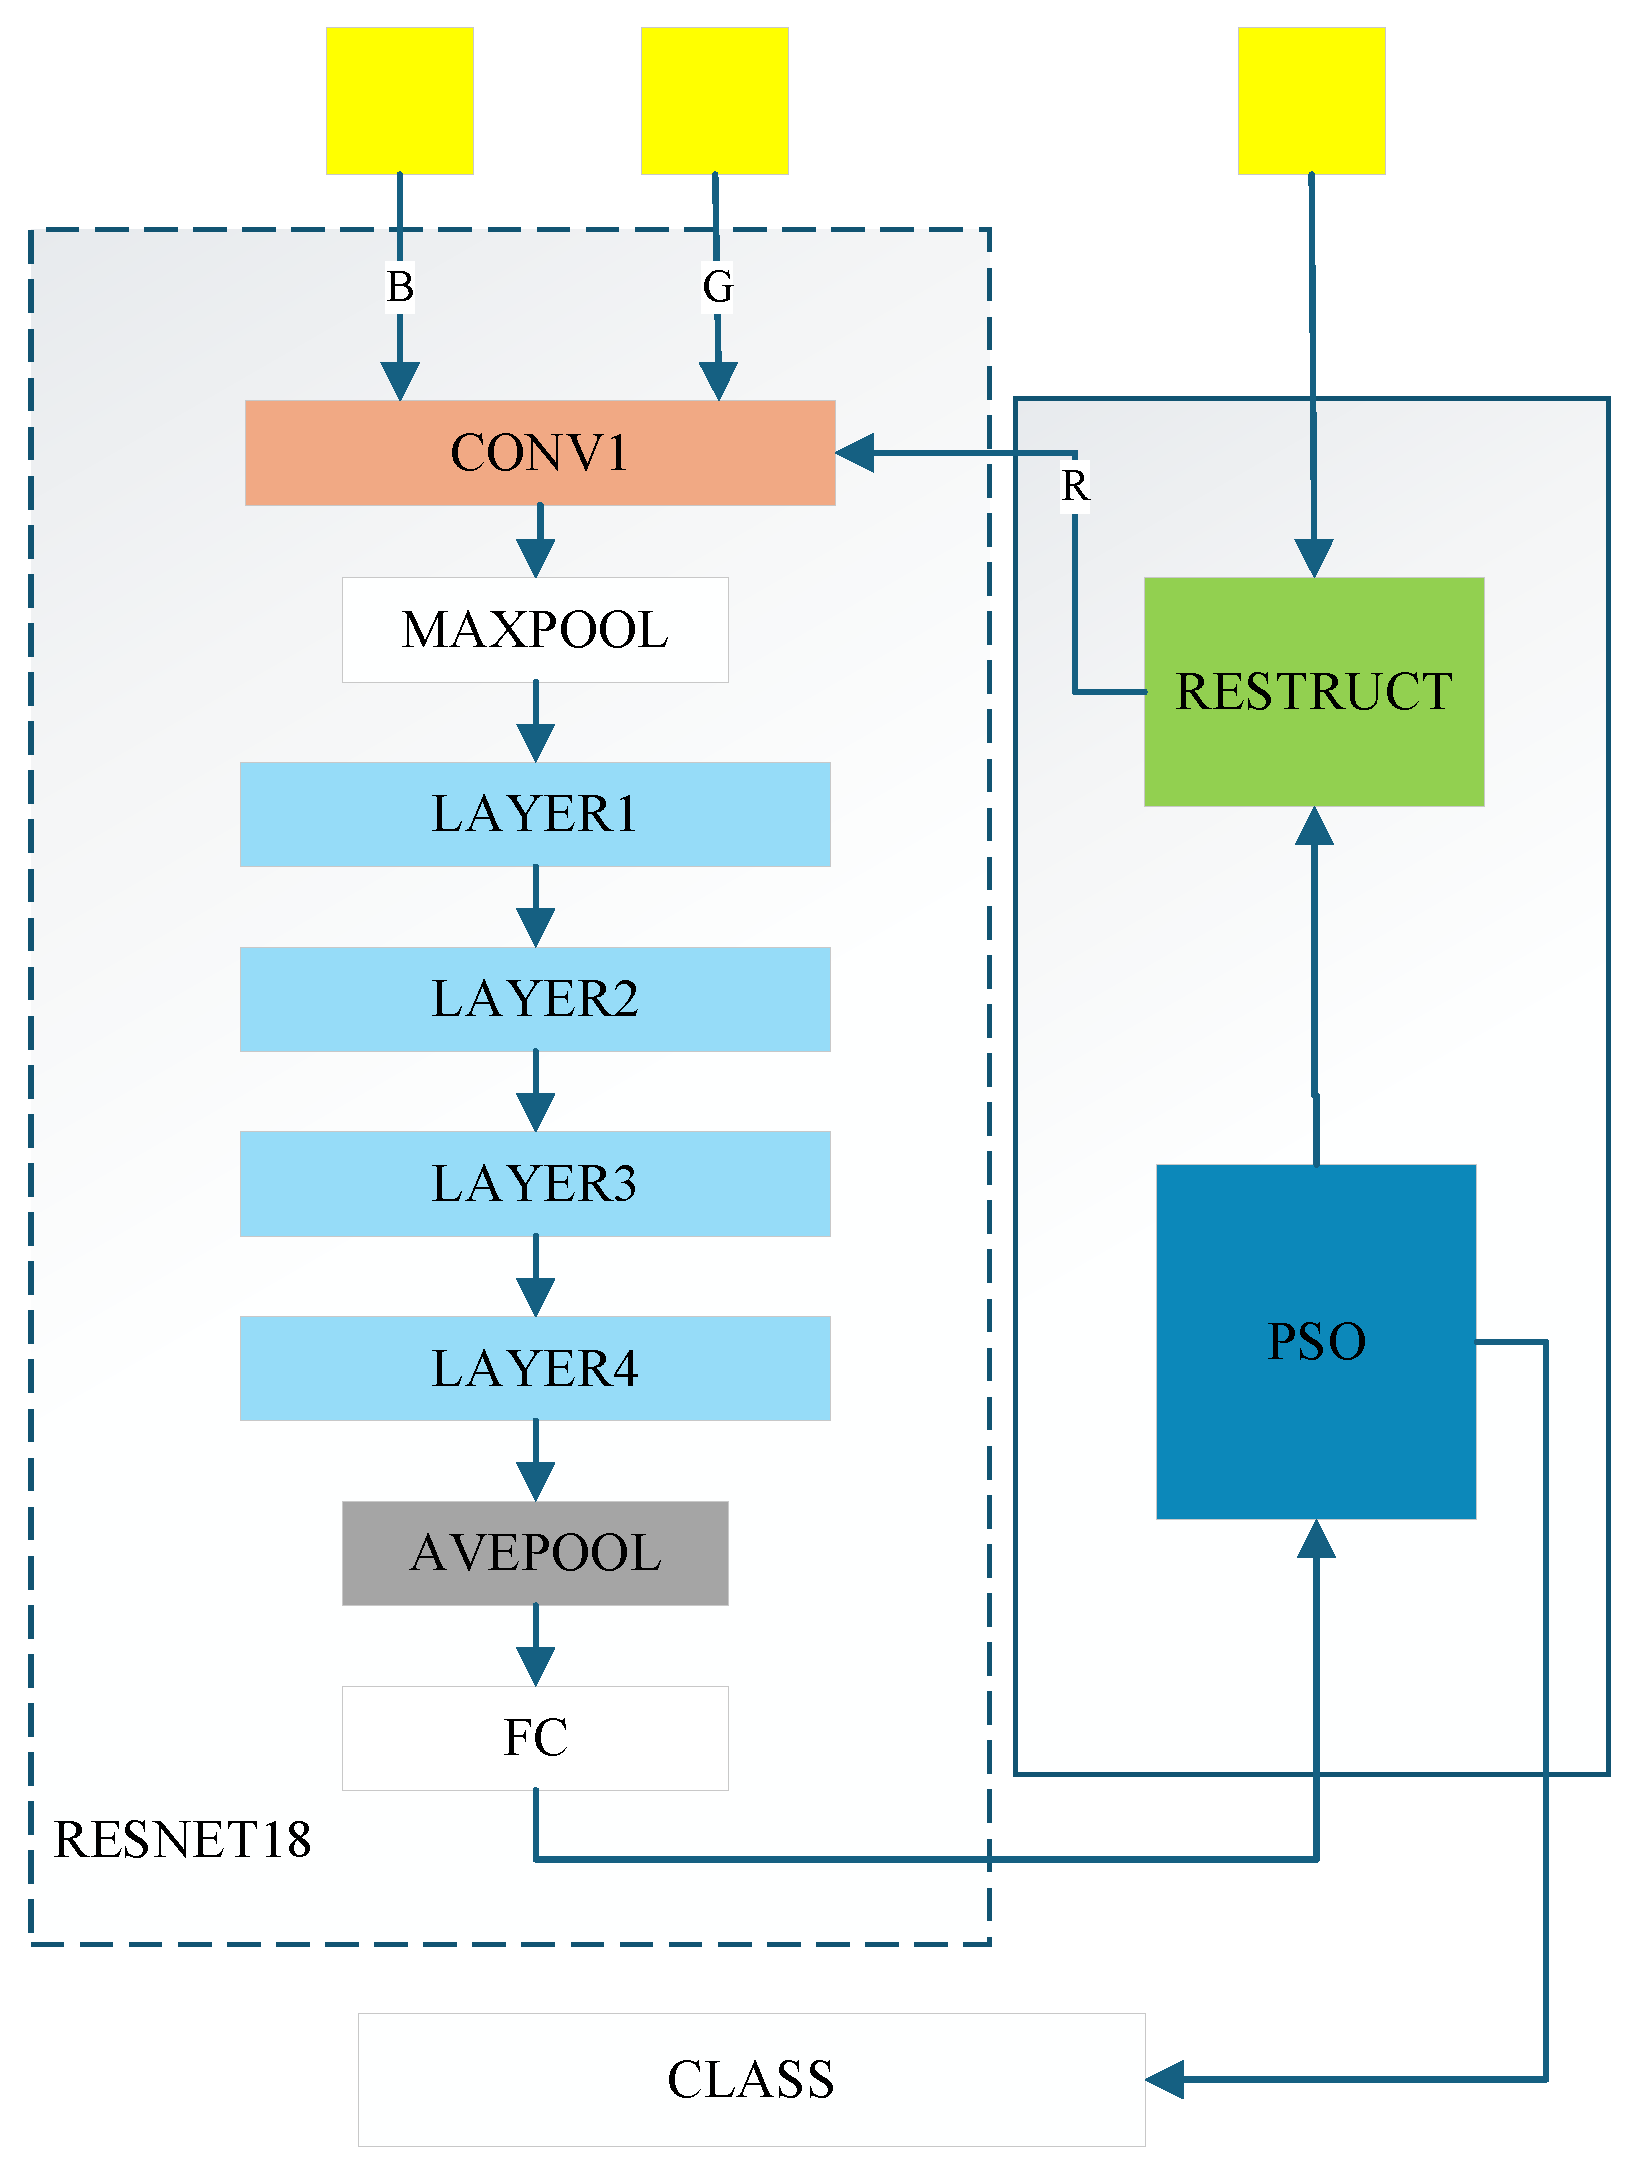
In this study, a dual-stage cyclic training framework is developed to jointly integrate threshold optimization, feature reconstruction, multi-feature fusion, and deep learning-based classification, as illustrated in
Figure 5. The network design is related to load-trajectory multi-feature learning, ON/OFF event detection, and transformer-based NILM optimization [
6,
8,
31]. The framework consists of three core components: a Particle Swarm Optimization (PSO)-based threshold optimizer, a VI trajectory reconstruction module, and a classification network built upon ResNet18 with an RGB three-channel input scheme. These components are organized into a closed-loop structure, enabling iterative refinement of feature representations and continuous improvement of classification performance.
The resulting feature vector is then fed into a fully connected layer to generate classification outputs. These outputs are further utilized by the PSO-based optimizer to evaluate the fitness of the current threshold configuration. If the fitness criterion is not satisfied, the voltage and current thresholds are updated, and the VI trajectories are reconstructed accordingly. The updated features are then re-encoded and reintroduced into the classification network for the next training iteration. This process continues iteratively until the optimal threshold parameters are obtained, at which point the final classification results are produced.
5. Conclusions
This study addresses the fundamental challenges of appliance load identification by proposing an integrated framework that combines feature optimization, multi-feature fusion, and deep learning-based classification. The main conclusions are summarized as follows:
By introducing a PSO-based threshold optimization mechanism and a reflection-based reconstruction strategy, the proposed method preserves the intrinsic electrical characteristics of appliances while amplifying geometric differences among devices with similar structures. This approach effectively overcomes the limitations of conventional VI trajectories, where high structural similarity often leads to classification ambiguity, thereby providing more discriminative feature representations for downstream tasks.
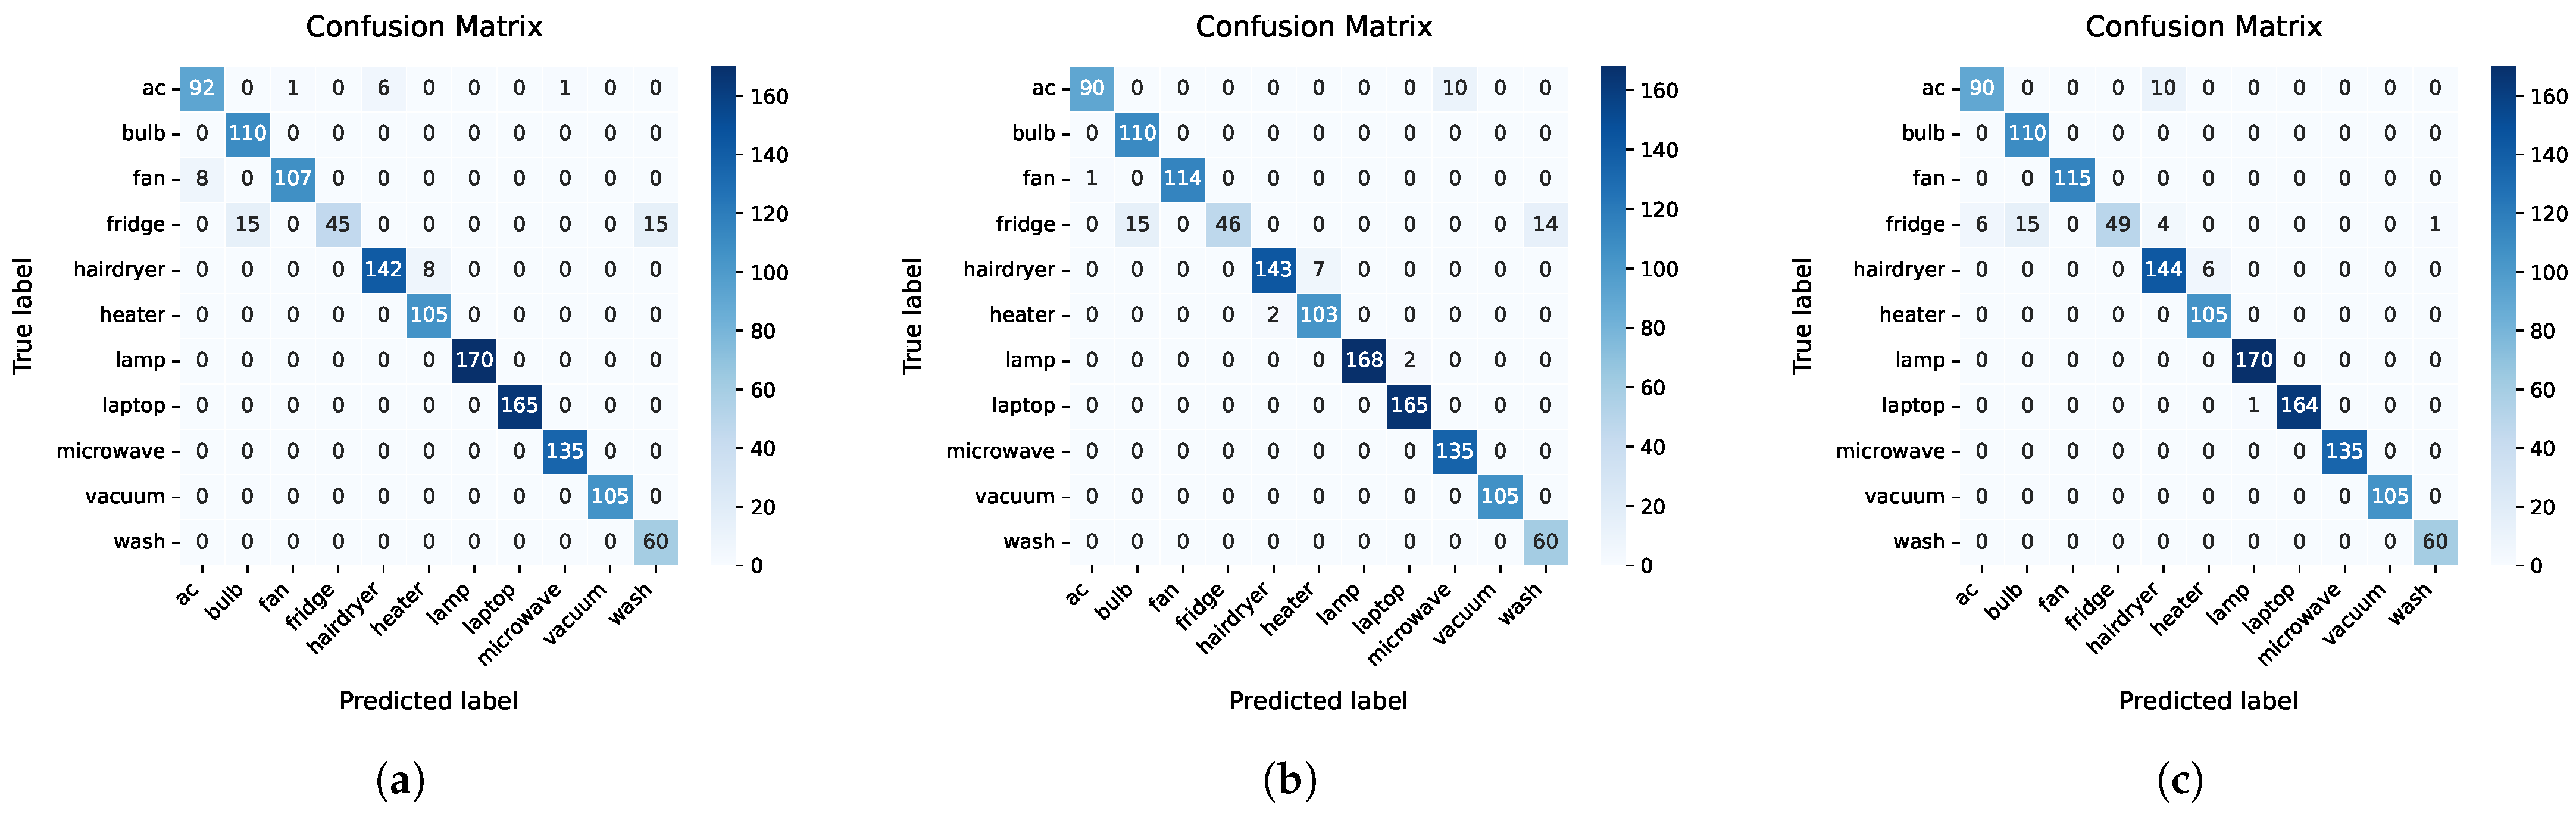
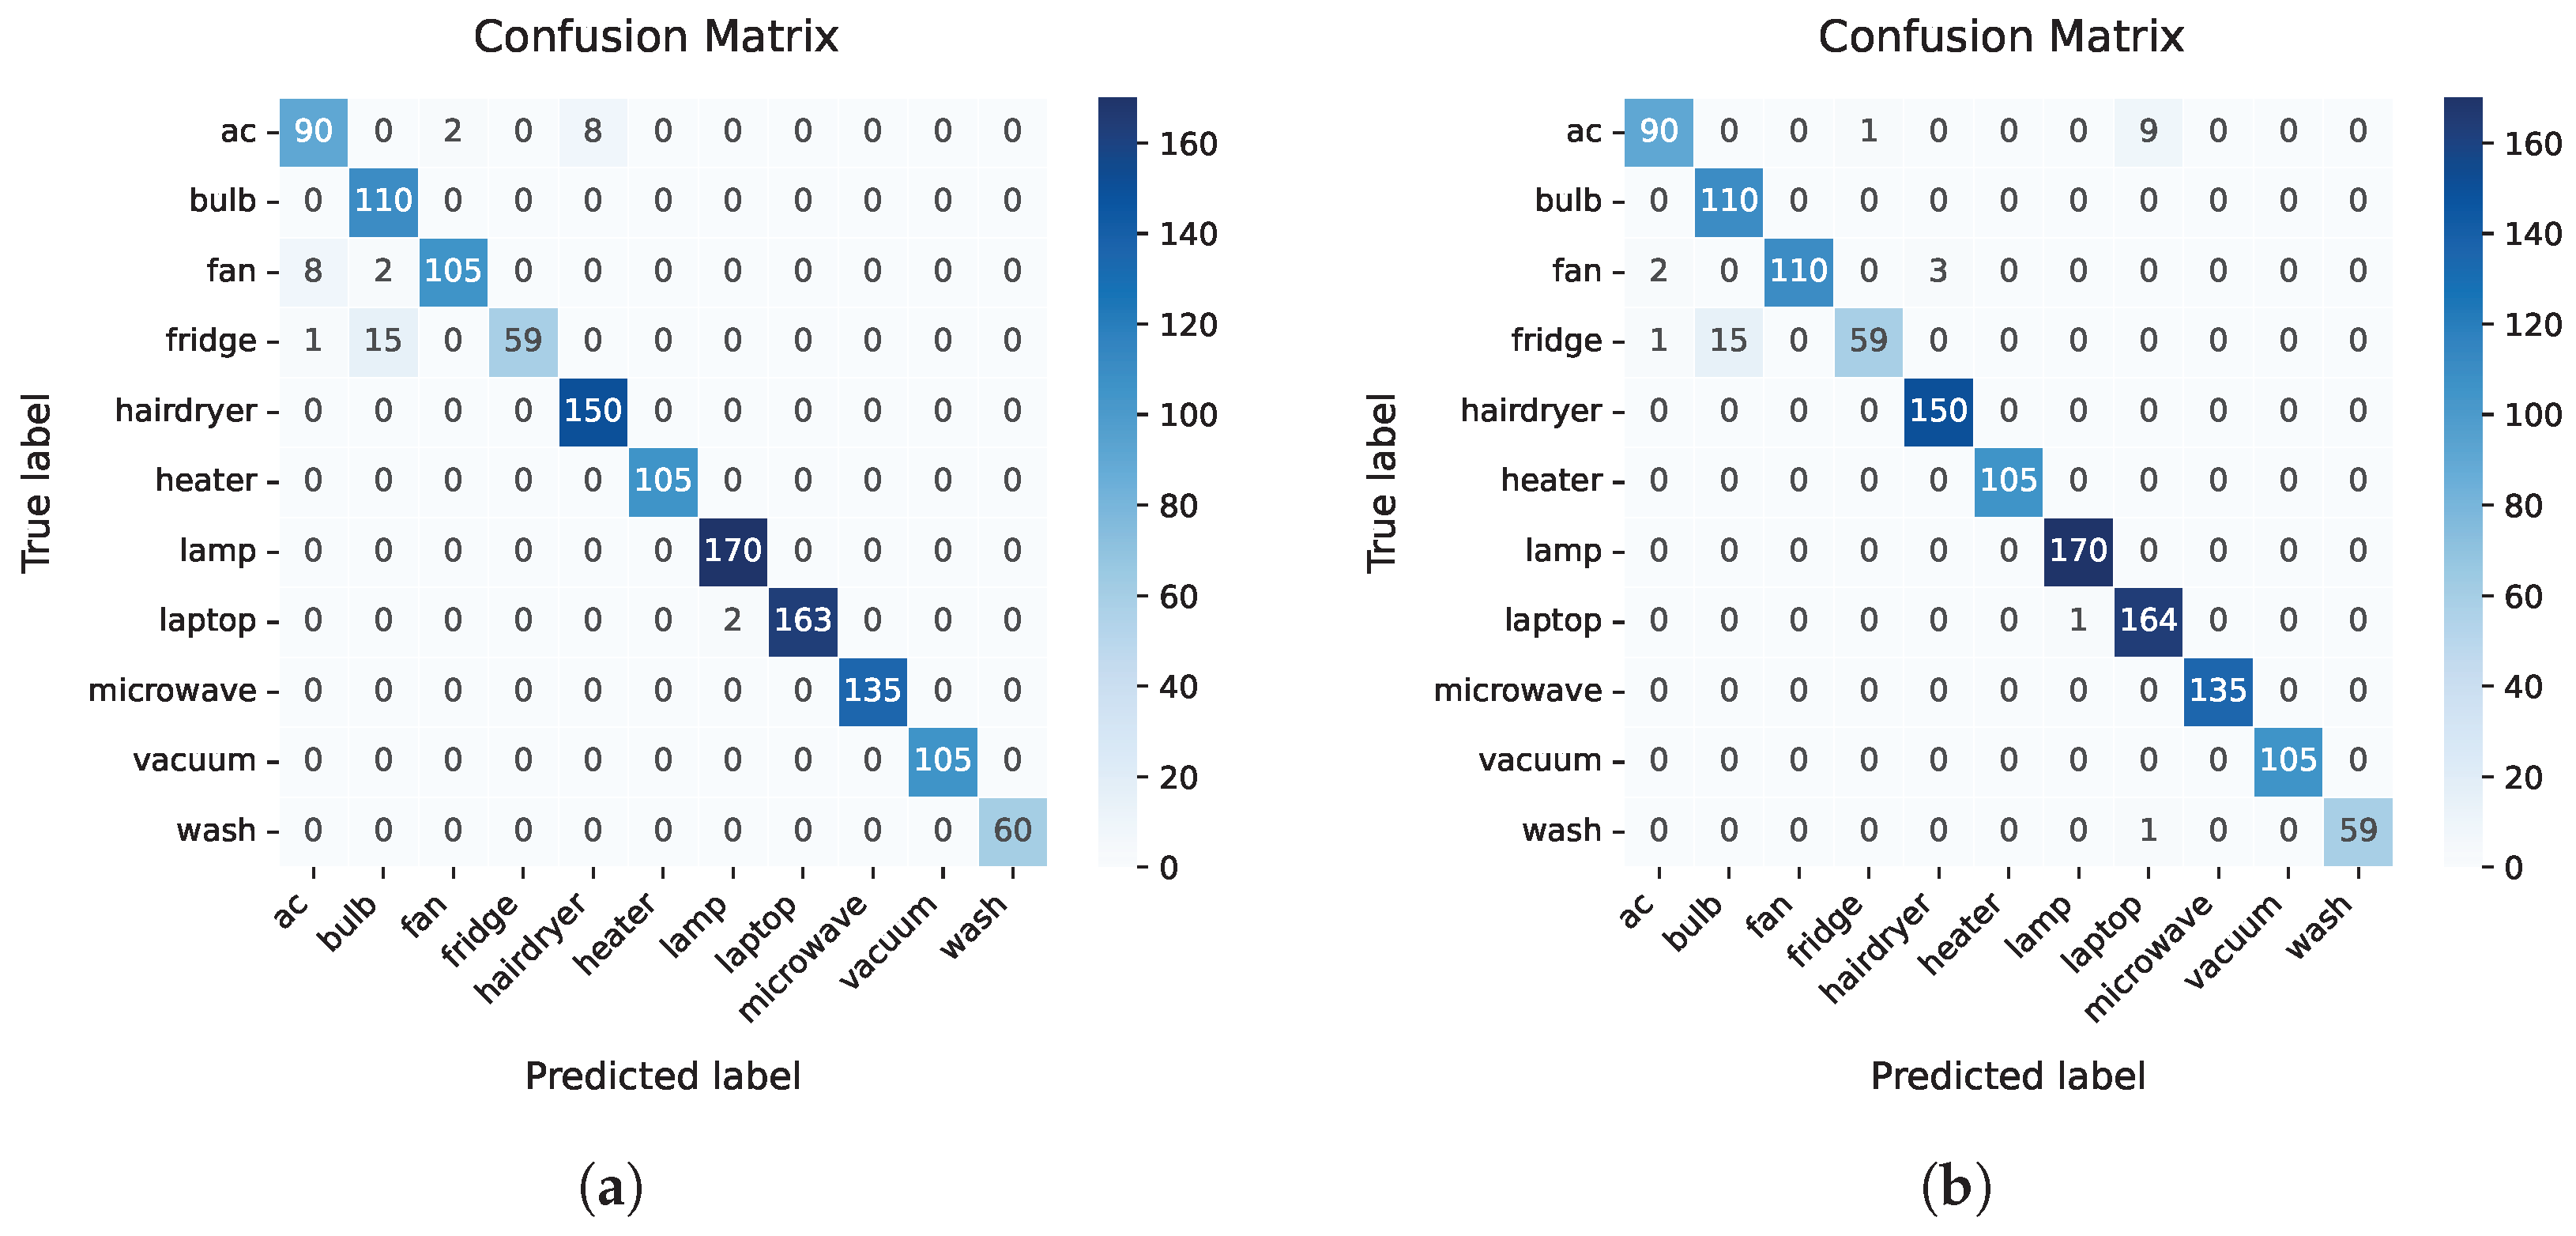
The conductance–time trajectory captures dynamic impedance variations during appliance operation, while the current-squared energy colormap encodes global energy-level differences. These features complement the reconstructed VI trajectory by incorporating dynamic and amplitude-related information. Experimental results demonstrate that the combination of all three features improves classification accuracy by 0.86% and the by 1.56% compared to using VI trajectories alone, effectively addressing the issues of weakened amplitude information and missing dynamic characteristics.
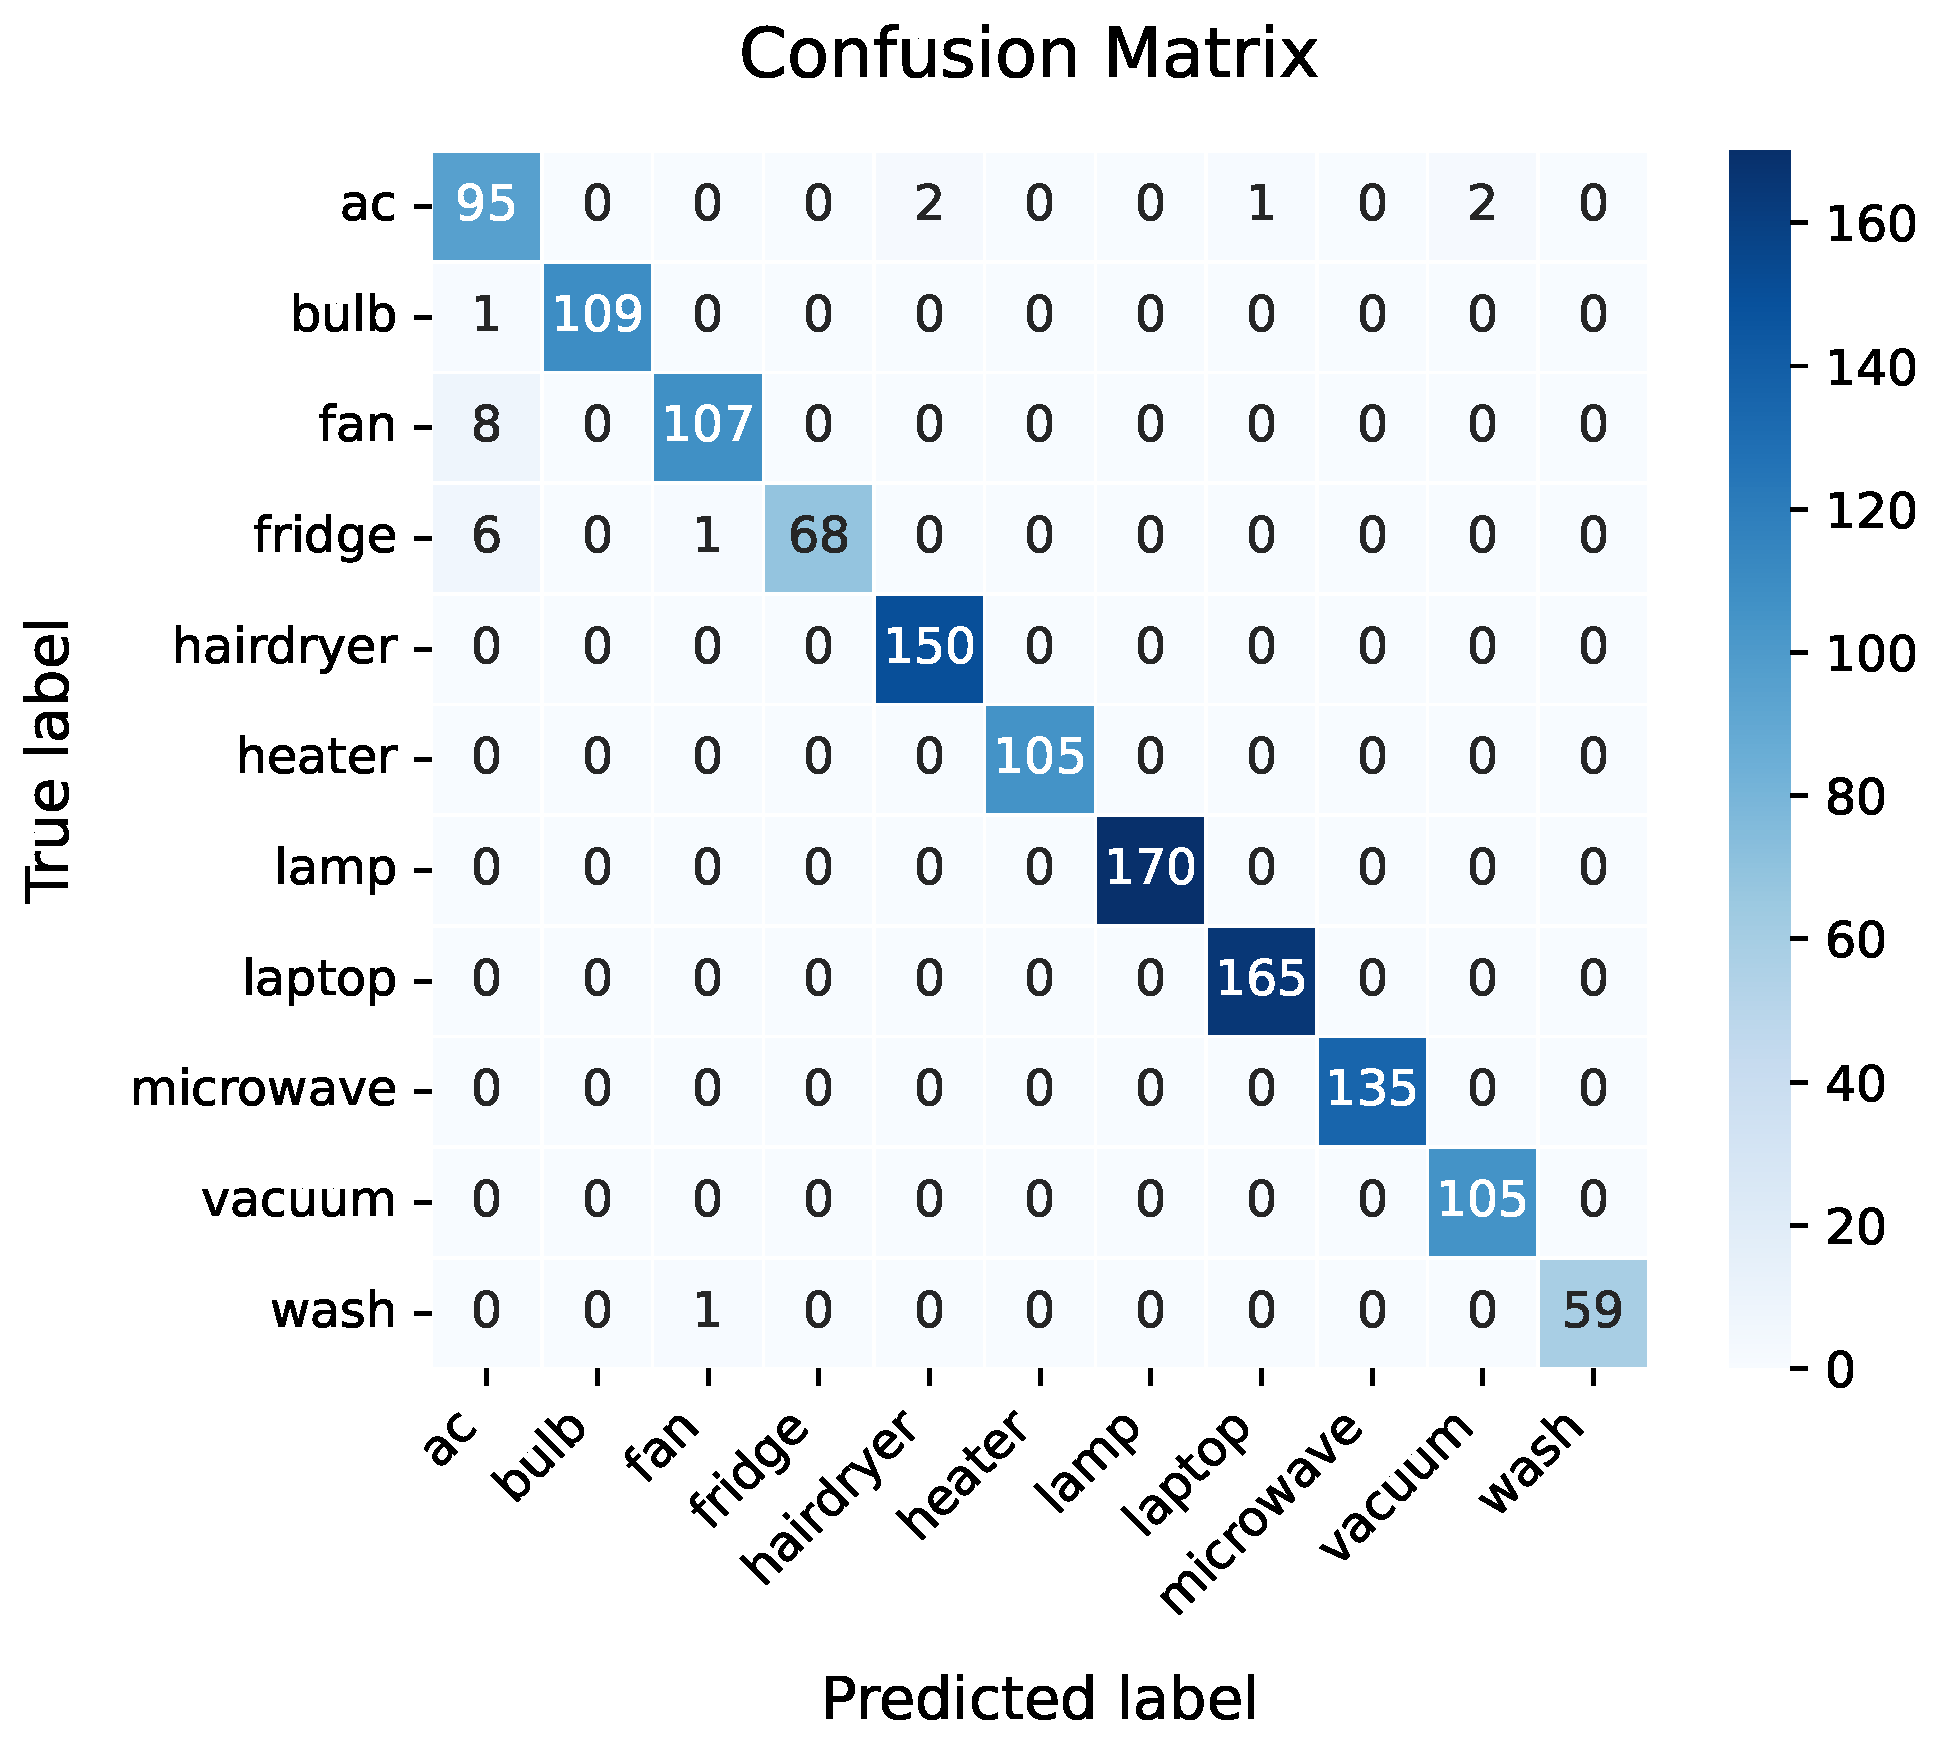
The proposed closed-loop architecture, integrating PSO-based threshold optimization with a ResNet18 classification network, enables adaptive adjustment of reconstruction parameters. This ensures that the model is consistently trained with near-optimal feature inputs. The framework achieves a classification accuracy of 98.29%, outperforming the baseline model without optimization. Notably, within the evaluation scope of the PLAID dataset, the proposed method demonstrates improved recognition performance for certain multi-state appliances, such as air conditioners and refrigerators, compared to baseline models, mitigating the impact of high intra-class variability.
Validation on the publicly available PLAID dataset shows that the method achieves robust performance across 11 common household appliance categories, with an of 97.93%. Furthermore, the proposed framework is computationally feasible and can be readily deployed, making it a promising solution for real-world applications such as residential energy monitoring and smart grid load management.
Despite the promising results, this study has limitations regarding zero-shot generalization to completely unknown electrical equipment and unseen operating conditions. Therefore, future work will focus on integrating continual learning and open-set recognition mechanisms to adaptively handle new appliance signatures without retraining from scratch. Furthermore, we aim to expand the diversity of appliance types in the dataset and improve the adaptive parameter tuning strategy of the PSO algorithm, ultimately enhancing the robustness and scalability of the proposed method in complex, heterogeneous smart grid scenarios.