Article

Recognition of Cu2+ and Al3+ by a Quinolinyl 1,2,3-Triazole Chemosensor: A Comparative Study

1
Department of Biochemistry, Chemistry, and Physics, Georgia Southern University, 521, College of Education Drive, Statesboro, GA 30460, USA
2
Department of Basic Science and Humanities, Institute of Engineering and Management, University of Engineering and Management, New Town, Kolkata 700160, West Bengal, India
3
Department of Chemistry, Science Building West, Southern Illinois University Edwardsville, P.O. Box—1652, Edwardsville, IL 62026, USA
*
Authors to whom correspondence should be addressed.
Deceased author.
Sensors 2026, 26(14), 4508; https://doi.org/10.3390/s26144508
Submission received: 4 June 2026 / Revised: 7 July 2026 / Accepted: 10 July 2026 / Published: 15 July 2026
(This article belongs to the Special Issue Advances in Fluorescence Sensing: Technologies and Applications)

Abstract

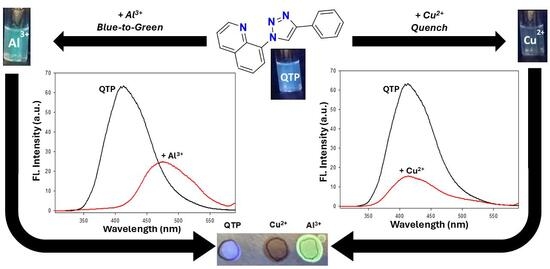
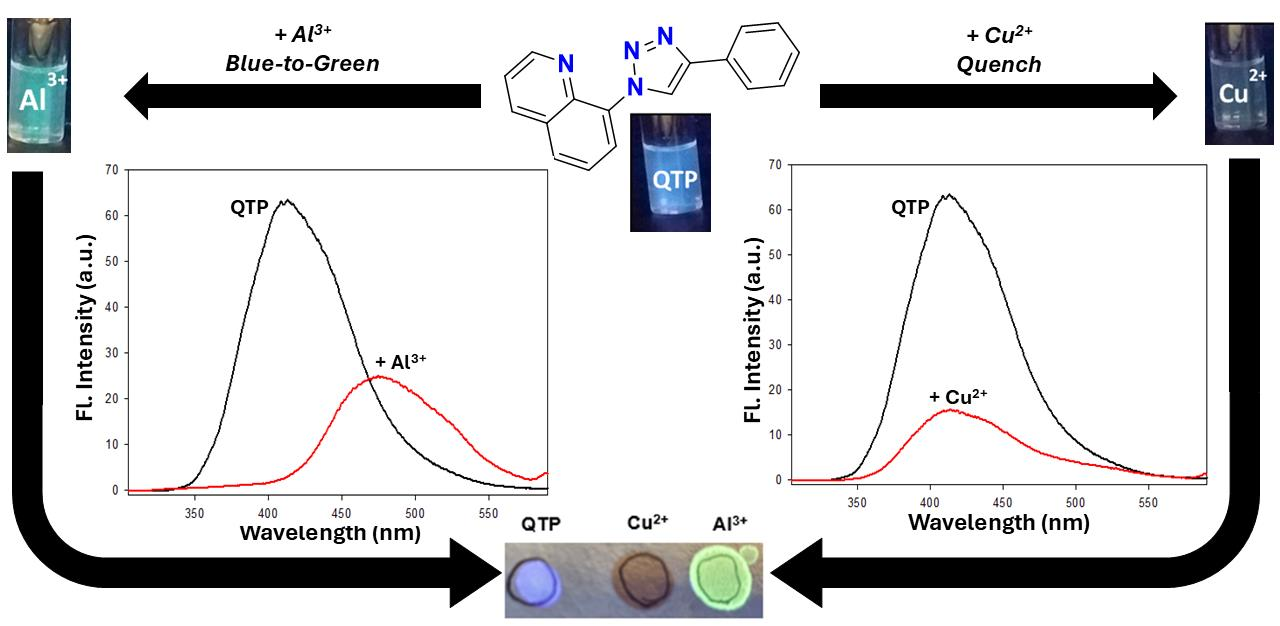
1,2,3-Triazole units with their structural and photophysical properties are well-suited for the development of chemosensors for ion sensing. Synthetic approaches make it extremely easy to modify this core with just a few steps to control ion selectivity and response-signal output. The current study examines how 8-(4-phenyl-1H-1,2,3-triazol-1-yl)quinoline, a quinoline–triazole–phenyl (QTP) construct, responds differentially to Cu2+ and Al3+ ions. QTP provides distinct fluorescent signals in acetonitrile in the presence of Cu2+ versus Al3+, a turn-off response with Cu2+ and blue-to-green output with Al3+. Spectroscopic studies quantify the selectivity of the sensor for these species with respect to other ions and reveal a stoichiometric ratio of 1:1 for sensor:Cu2+ and 2:1 for sensor:Al3+. NMR titration studies suggest that Cu2+ is detected via coordination of the quinolinyl and triazolyl nitrogens, while Al3+ is detected through coordination of the quinoline nitrogen. Overall, QTP displays a selectivity for Al3+ relative to Cu2+ over other cations in this investigation.

Graphical Abstract

1. Introduction

Cations are of fundamental importance to environmental and physiological processes. While an ion may be essential and advantageous in certain situations, the same ion can be considered xenobiotic or even an indicator of harmful conditions under different circumstances [1]. As such, ion imbalance, including the accumulation of excessive amounts, can have devastating effects.
Copper is important to ATP biosynthesis, proper brain function, and antioxidant processes [2]. Aluminum, the third most abundant metal on earth, is incorporated into materials for several important purposes: for example, water purification systems, food containers, machine parts, and construction [3,4,5]. Over-accumulation of either metal, copper, or aluminum, is harmful. For example, both are linked to the progression of neurodegenerative diseases such as Alzheimer’s and Parkinson’s disease [6]; amassing copper in the liver and brain leads to the debilitating effects of Wilson’s Disease, and the buildup of aluminum in the environment threatens aquatic and plant life [7,8]. For example, both are linked to the progression of neurodegenerative diseases such as Alzheimer’s and Parkinson’s disease [6,9]. Amassing copper in the liver and brain leads to the debilitating effects of Wilson’s Disease, and the buildup of aluminum in the environment threatens aquatic and plant life [10,11]. The development of inexpensive, ion-specific chemosensors to easily detect and quantify these species can facilitate a better understanding of their role in diseases and how they affect the environment [12].
The multifunctionality of the 1,2,3-triazole unit is excellent for sensing applications in colorimetric and fluorometric chemosensors [13]. Photophysical and structural properties of this heterocycle make it suitable for use as a part of the receptor, as a signaling unit, or as a linker connecting binding and reporter sites. As a receptor for cations, triazoles are N-donors through the π-bonded nitrogens [14,15,16]. The triazoles, by virtue of the synthetic procedures used to make them, are relatively easy to modify. The syntheses tend to be tolerant of several functional groups and high-yielding [17,18,19,20]. Facile modification of the substituents on triazoles can serve two important purposes: the ability to dictate (1) the cation selectivity and (2) tune the fluorometric or colorimetric signal output. In the current study, functionalizing the triazole unit with a quinoline moiety provides an extensively conjugated structure that can function as a fluorometric chemosensor for the Cu2+ and Al3+ ions.
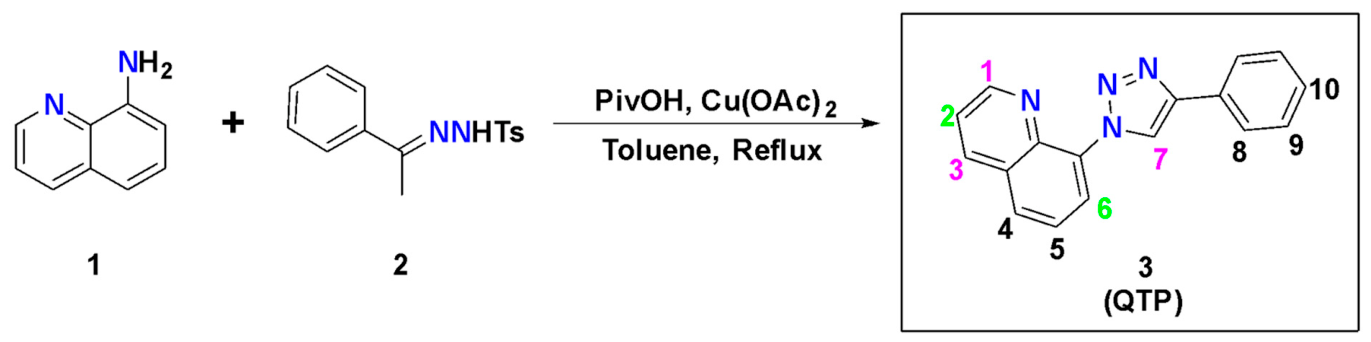
Herein, we report on the contrast in the response of the 8-(4-phenyl-1H-1,2,3-triazol-1-yl)quinoline, a quinoline-triazole-phenyl (QTP) construct to Cu2+ versus Al3+, two of the ions that induce visible fluorometric changes in the molecule. QTP is known [17] but, to the best of our knowledge, this is the first report on its versatility as a chemosensor. The sensor is made by the coupling of 8-aminoquinoline and acetophenone N-tosylhydrazone in a copper (II)-mediated reaction (Scheme 1) [17]. With extensive conjugation throughout the structure and donor nitrogens in the triazolyl and quinolinyl units, QTP has cation-sensing capabilities that provide clear and distinctly different fluorescence-signal outputs for Cu2+ versus Al3+ under ultraviolet (UV) illumination at 356 nm—a complete “turn-off” response for Cu2+ and a “blue-to-green” output for Al3+. Nuclear Magnetic Resonance (NMR), UV-Vis absorption, and fluorescence spectroscopy were used to investigate the interaction of the probe with the cations and to decipher the difference in the binding mode between the two. Our results reveal a stoichiometric ratio of 1:1 for Cu2+ and 2:1 for Al3+ (QTP:metal).

2. Materials and Methods

2.1. General Experimental

All chemicals and reactants were obtained through commercial sources (Alfa Aeser, Ward Hill, MA 01835, USA; OXCHEM, Dallas, TX 75254, USA; Sigma-Aldrich, St. Louis, MO 63103, USA; Acros, Irvine, CA 92618, USA; and Fisher, Waltham, MA 02451, USA) without further purification. HPLC-grade solvents and de-ionized (DI) water were used for spectroscopic experiments and syntheses. Column chromatography was performed with Selecto Scientific Silica Gel (particle size 100–200 microns).

2.2. Synthesis of 8-(4-Phenyl-1H-1,2,3-triazol-yl)quinoline (QTP)

8-(4-Phenyl-1H-1,2,3-triazol-yl)quinoline (QTP) was synthesized according to a previously reported procedure (Scheme 1) [17]. Structural modifications in QTP resulting from the presence of metal ions were characterized via 1H-NMR (Nuclear Magnetic Resonance (NMR)) titration experiments. To ensure accurate assignment of the overlapping or shifted proton signals, two-dimensional 1H-1H COrrelation SpectroscopY (COSY) was subsequently employed (Figure S1A,B).

2.3. Determination of Stoichiometry (Job’s Plot) Between Sensor and Metal Ions

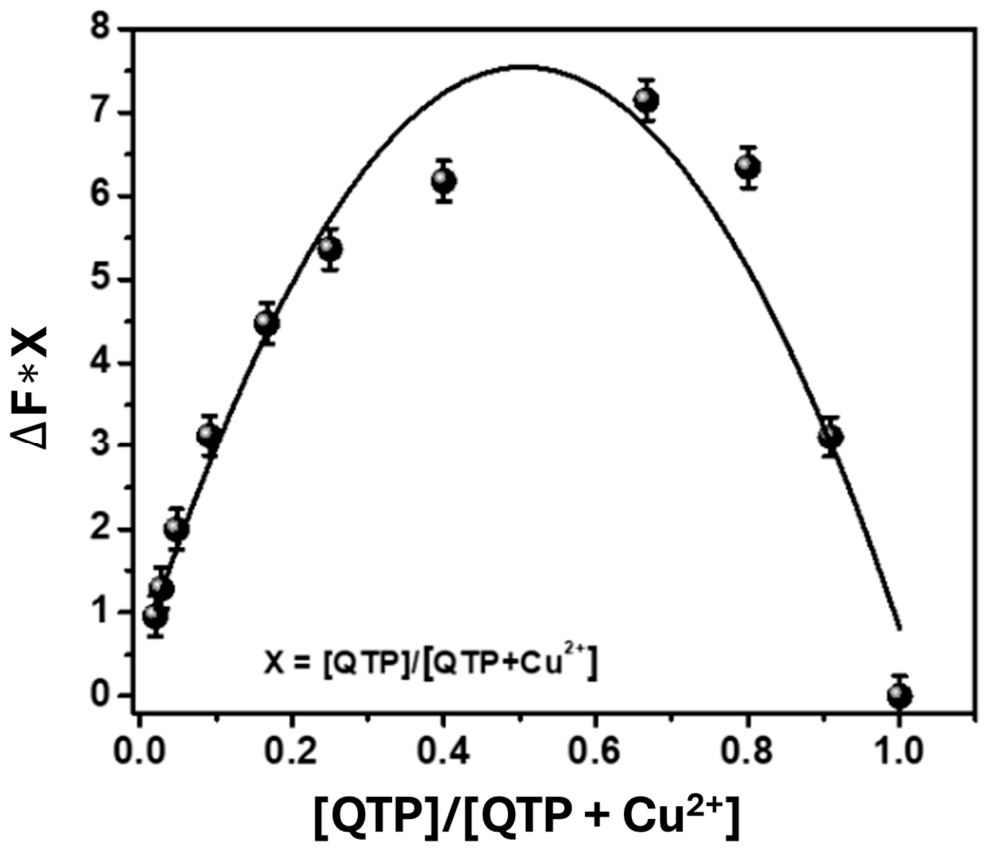
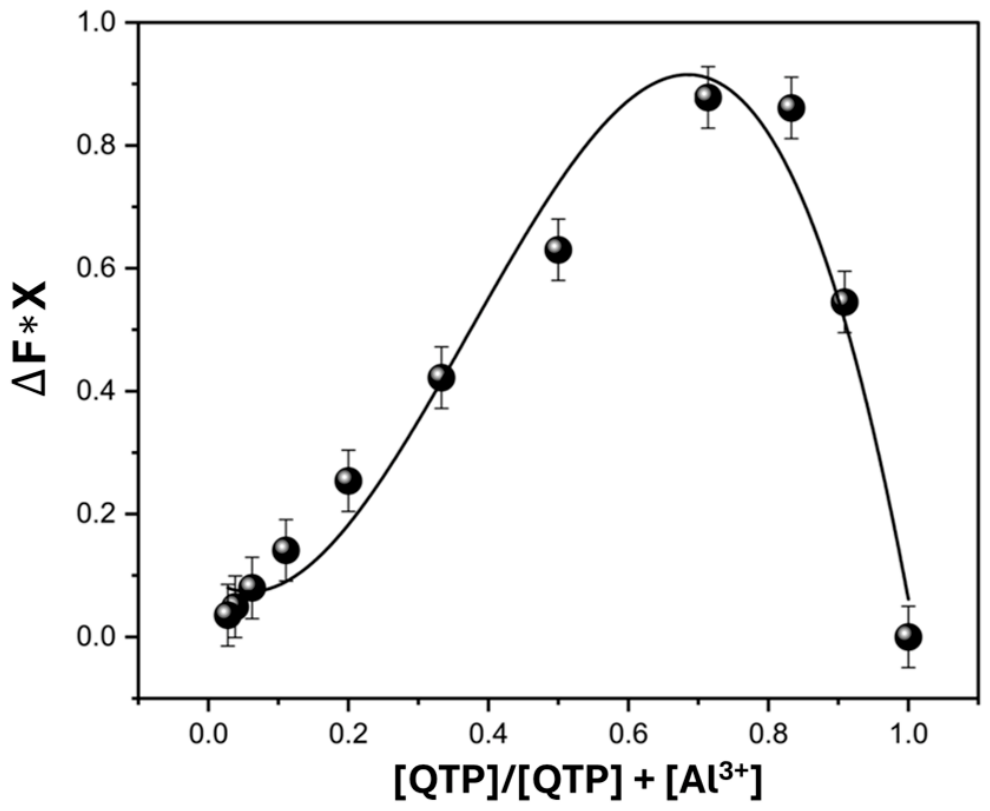
For Job’s plot, the product of the difference in fluorescence intensity (ΔF) and the mole fraction (Χ), ΔF.Χ, was plotted against Χ. ΔF is determined from F0 − Fx, where F0 and Fx are the fluorescence intensities of QTP in the absence and presence of the metal ions (Mn+). The maximum of the plot indicated the mole ratio between the interacting species.

2.4. Calculation of the Limit of Detection (LOD)

The detection limit of QTP for the metal ion, Cu2+, was calculated using the fluorescence titration according to the IUPAC definition (Equation (1)). The fluorescence of QTP was measured independently ten times and the standard deviation (σ) of the blank measurement was determined. To find the slope (k), the ratio of fluorescence intensities (Fx/F0) at 415 nm was plotted against [Cu2+].
Limit of Detection (LOD) = 3σ/k

2.5. Instrumentation

NMR spectra were recorded on an Agilent MR4000DD2 spectrometer (Agilent Technologies, Loveland, CO 80537, USA, originally manufactured by Varian Inc., Palo Atlo, CA 94304, USA) with a multinuclear probe with two RF channels and variable temperature capability, 1H-NMR: 400 MHz and 13C-NMR:100 MHz using deuterated acetonitrile (CD3CN). Signals were recorded in parts per million (ppm). References in the corresponding solvents were set according to residual CH3CN at 1.94 ppm for 1H-NMR and 1.32 ppm [CH3] and 118.26 [CN] for 13C-NMR. Signals for the 1H-NMR multiplicity are described as: singlet (s), doublet (d), doublet of doublet (dd), triplet (t), multiplet (m), coupling constants (J, Hz) and integration. Melting points were measured with the Vernier Melt Station using Vernier LabQuest 2 and are uncorrected.
Room temperature absorption and steady-state fluorescence measurements were performed using a Shimadzu UV-2450 spectrophotometer (Shimadzu Scientific Instruments, Columbia, MD 21046, USA, manufactured in Kyoto 604-8511, JPN) and a PerkinElmer LS55 (PerkinElmer, Inc., Shelton, CT 06484, USA, manufactured in Buckinghamshire, HP9 2FX, UK) with a well plate reader fluorimeter respectively. Concentrations of QTP were kept at 2.94 × 10⁻⁴ mol dm−3 or below in acetonitrile to avoid any possible intermolecular effect. The specific concentration for each experiment is identified in the corresponding figures.

3. Results and Discussion

The differential interactions of QTP with Cu2+ and Al3+ were investigated through UV illumination, UV–Vis absorption measurements, fluorescence analysis, and NMR spectroscopy. The behavior of the sensor with these cations was compared to a select group of metals to which the probe is essentially nonresponsive under UV-light (Ni2+, Cu2+, Cd2+, Zn2+, Li+, Al3+, Mg2+, Ag+). These investigations provided valuable insight into the interaction of the chemosensor with Cu2+ versus Al3+, such as the stoichiometry, the structural motifs involved in binding, and the ion selectivity of the molecule. Owing to the hydrophobic nature of QTP, the sensing mechanism was evaluated using non-coordinating perchlorate salts in organic media. While the probe in its current form is limited for direct aqueous anion-rich environments due to solubility constraints, future work will focus on structural modifications (e.g., appending hydrophilic groups) as also seen in our previous work [16].

3.1. Preliminary Observations Under UV-Light

At a molar ratio of 1:10, QTP: metal salt in acetonitrile, the response of the probe to the series of perchlorate salts of the cations was investigated under UV-light (365 nm) and ambient light (Figure 1a and Figure S2). Clear, visible changes, if any, only occurred under UV-light. The fluorescent blue of the probe was altered by Cu2+ and Al3+, a complete “turn-off” response with Cu2+ and a blue-to-green fluorescence signal with Al3+.
To investigate the practical sensing application of chemosensor QTP, paper test strips were prepared by spotting filter paper with QTP (free sensor) followed by the targeted cations (Cu2+ and Al3+). At 365 nm, the quenching of fluorescence with Cu2+ and the green output with Al3+ are clearly observed (Figure 1b).

3.2. Fluorescence Spectroscopic Response to Cu2+ and Al3+ Compared to Other Cations

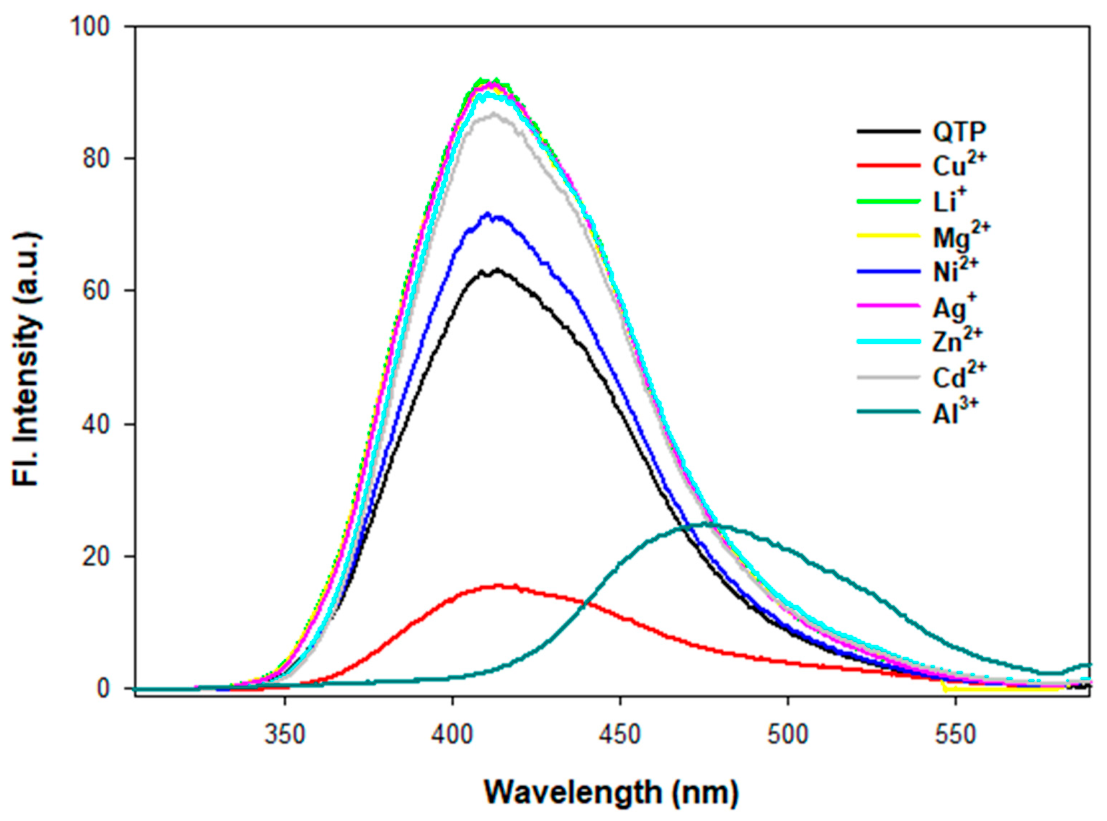
The changes in the optical output of QTP with Cu2+ and Al3+ prompted an investigation of the photophysical behavior of the molecule with these ions. Fluorescence spectroscopy revealed that the maximum emission band for QTP occurs at ~411 nm with excitation at the maximum absorption of 294 nm (Figure 2 and Figure S3). Treatment with ten equivalents of the Cu2+ perchlorate reduced the intensity of this band by four-fold. The addition of Al3+ caused a bathochromic shift, from ~411 nm to ~477 nm, at an intensity that was 2.5-times lower than the original QTP maximum. The other salts enhanced the intensity at ~411 nm by different degrees but, visually, the corresponding response output for those salts was not as distinct as the changes induced by Cu2+ and Al3+ (Figure 1 and Figure 2).
Overall, screenings with the metal salts under UV-light and fluorescence spectroscopic studies revealed particularly distinct and contrasting responses with Cu2+ and Al3+. Studies were performed with these two cations to better understand the mechanism by which signaling occurs. All subsequent fluorescence experiments monitored bands at ~411/410 nm for Cu2+ and Al3+ in addition to ~477 nm for Al3+.

3.3. Cu2+: UV-Vis Absorption, Fluorescence, and NMR Spectroscopic Investigations

In-depth studies with fluorescence, absorbance and NMR experiments were used to understand the behavior of QTP with Cu2+.

3.3.1. Cu2+: Investigation by UV-Vis Absorption

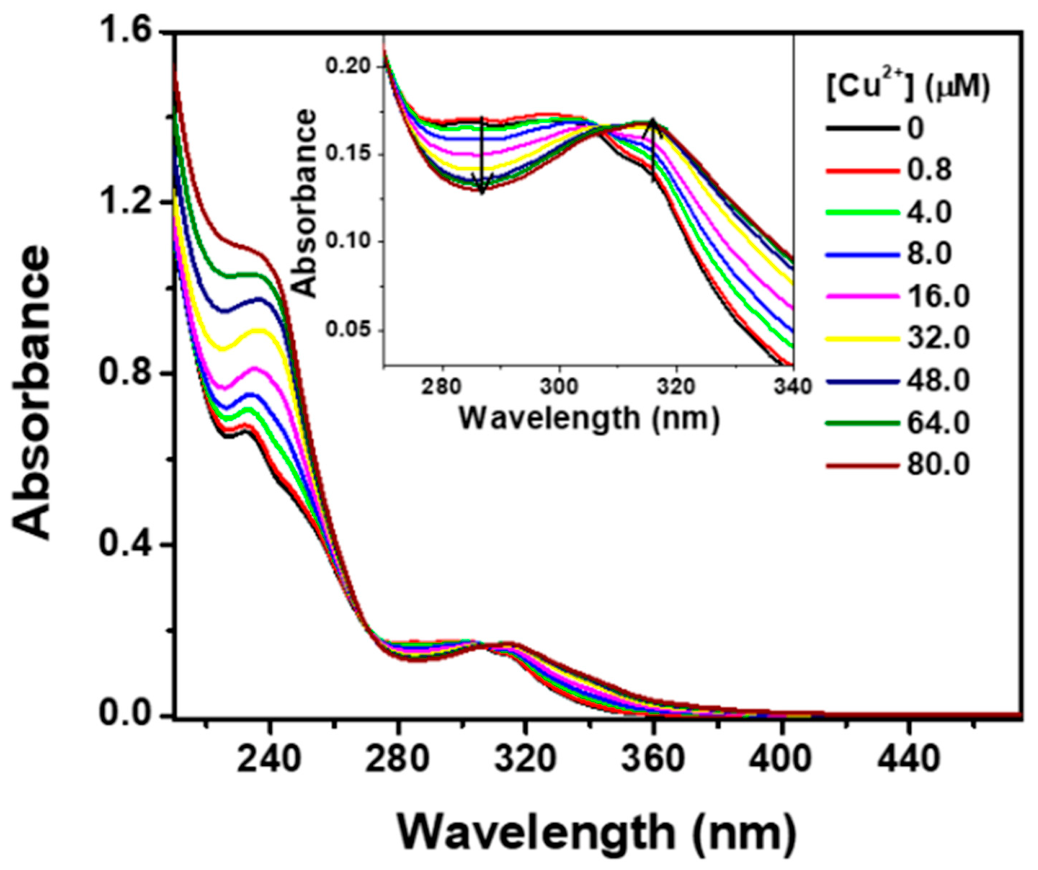
In acetonitrile, QTP exhibited an unstructured, low-energy absorption band peaking around 294 nm (Figure 3). Addition of the Cu2+ salt resulted in a gradual decrease in the 294 nm absorbance, followed by the emergence of a new band at 315 nm. This modulation in the absorption yielded two isosbestic points at 276 nm and 308 nm (Figure 3). The presence of the isosbestic points which occur due to an equilibrium between different species in a medium supports the formation of a QTP-Cu2+ complex. The appearance of the 315 nm band for this new species is due to the charge transfer from the triazolyl nitrogen to Cu2+ [21]. An intramolecular charge transfer (ICT) from the fluorophore to the Cu2+ occurs when QTP forms a stable complex with the metal ion. Other transitions, such as d-d, π-π*, and charge transfer (LMCT and MLCT) are also responsible for the change in the absorbance spectra of organic molecules with metal ions [22].

3.3.2. Cu2+: Fluorescence Spectroscopic Investigation

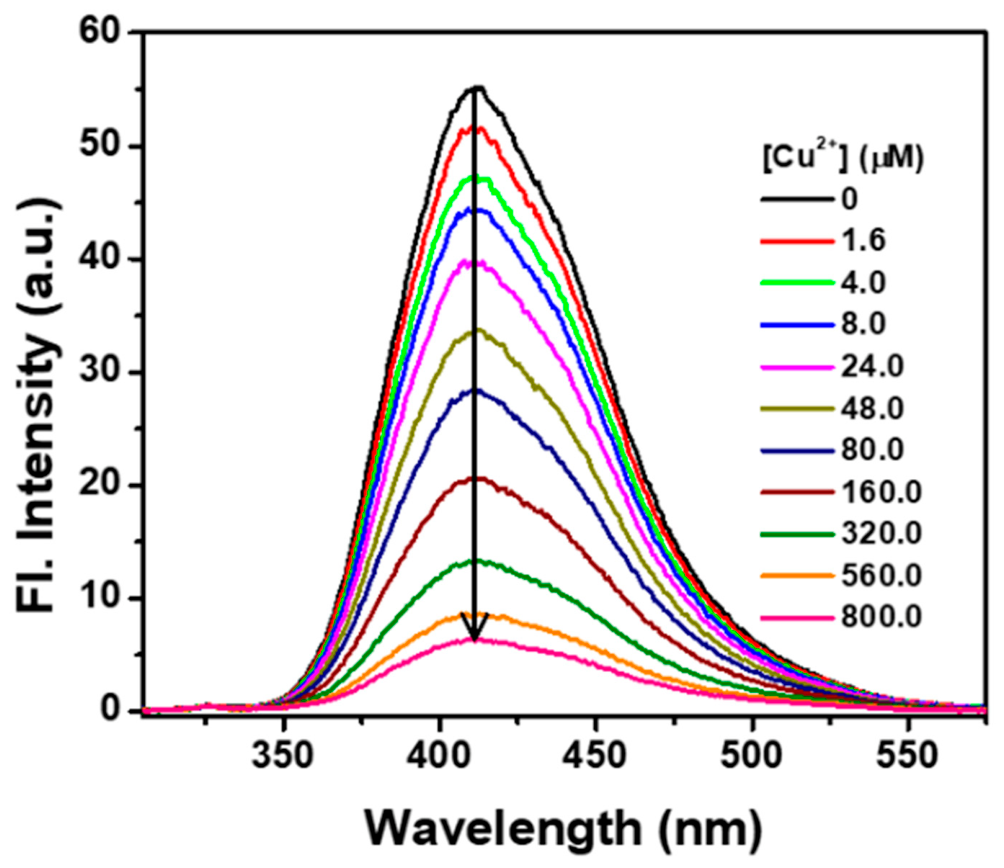
A fluorescence titration study also revealed a 1:1 binding stoichiometry between Cu2+ and QTP (Figure 4 and Figure 5). Changes in the fluorescence at 411 nm were monitored while varying the equivalents of the perchlorate relative to the sensor. The chelation-enhanced fluorescence quenching (CHEQ) impact of paramagnetic Cu2+ ions produced a notable decrease in the fluorescence intensity of QTP. For the Job’s plot, the emission intensity was monitored at 411 nm. A non-linear curve fit parameter went through a maximum ΔF.Χ at Χ = 0.51 correlating with a 1:1 stoichiometric ratio for QTP:Cu2+ (Figure 5). A Job’s plot based on the change in absorbance at 315 nm (Figure S4) was consistent with the 1:1 stoichiometry. The binding constant according to the Benesi–Hildebrand plot for this interaction is 1.45 × 10⁵ M−1 (Figure S10) [23].
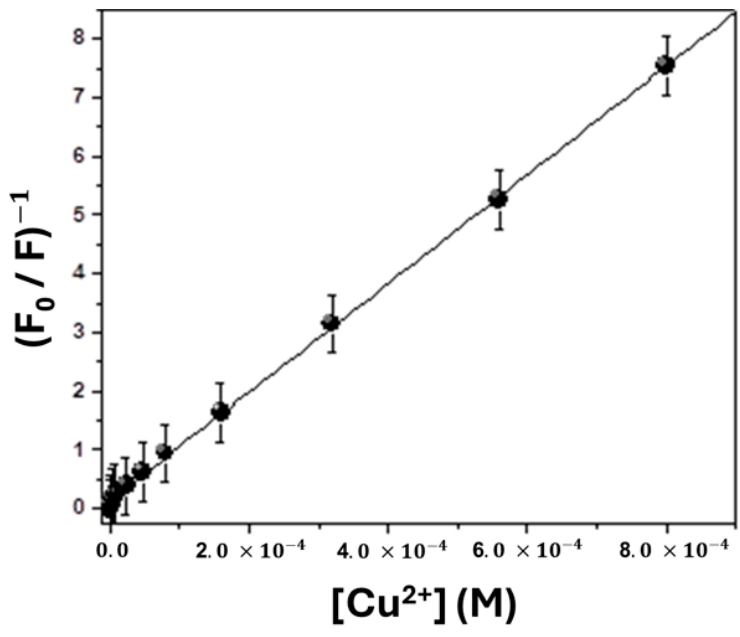
In order to understand the type of fluorescence quenching, collisional or dynamic, the decrease in the fluorescence intensity was plotted using the Stern–Volmer equation, F0/F = 1 + KSV [Cu2+], where F0 and F are, respectively, the fluorescence intensities of QTP in the absence and presence of the Cu2+ (quencher) at 411 nm (Figure 6) [24]. A linear plot indicated dynamic quenching of QTP in the presence of Cu2+. KSV, the Stern–Volmer quenching constant, as revealed from the slope of the plot is 9.26 × 10⁴ M−1 which is higher than the order for diffusion-controlled collisional quenching (101–102 M−1) [25,26,27]. This strongly indicated that the quenching of QTP is caused by the complexation with Cu2+. The limit of detection (LOD) as revealed from the Fx/F0 showed a linearity from 1.6 to 24 μM of copper (II) addition. At 1.6 μM, it is therefore possible to detect extremely low levels of Cu2+ with QTP using fluorescence spectroscopy. Furthermore, this LOD is in the range of previously reported values, between ~77nM and 2.5 µM, for other small-molecule quinoline-based Cu2+-sensors which bind 1:1, sensor:cation [28,29]. On par with other reported LODs, QTP has the added benefit of its one-step synthesis and distinct “turn-off” response with Cu2+.

3.3.3. 1H-NMR Investigations with the QTP-Cu2+ Complex

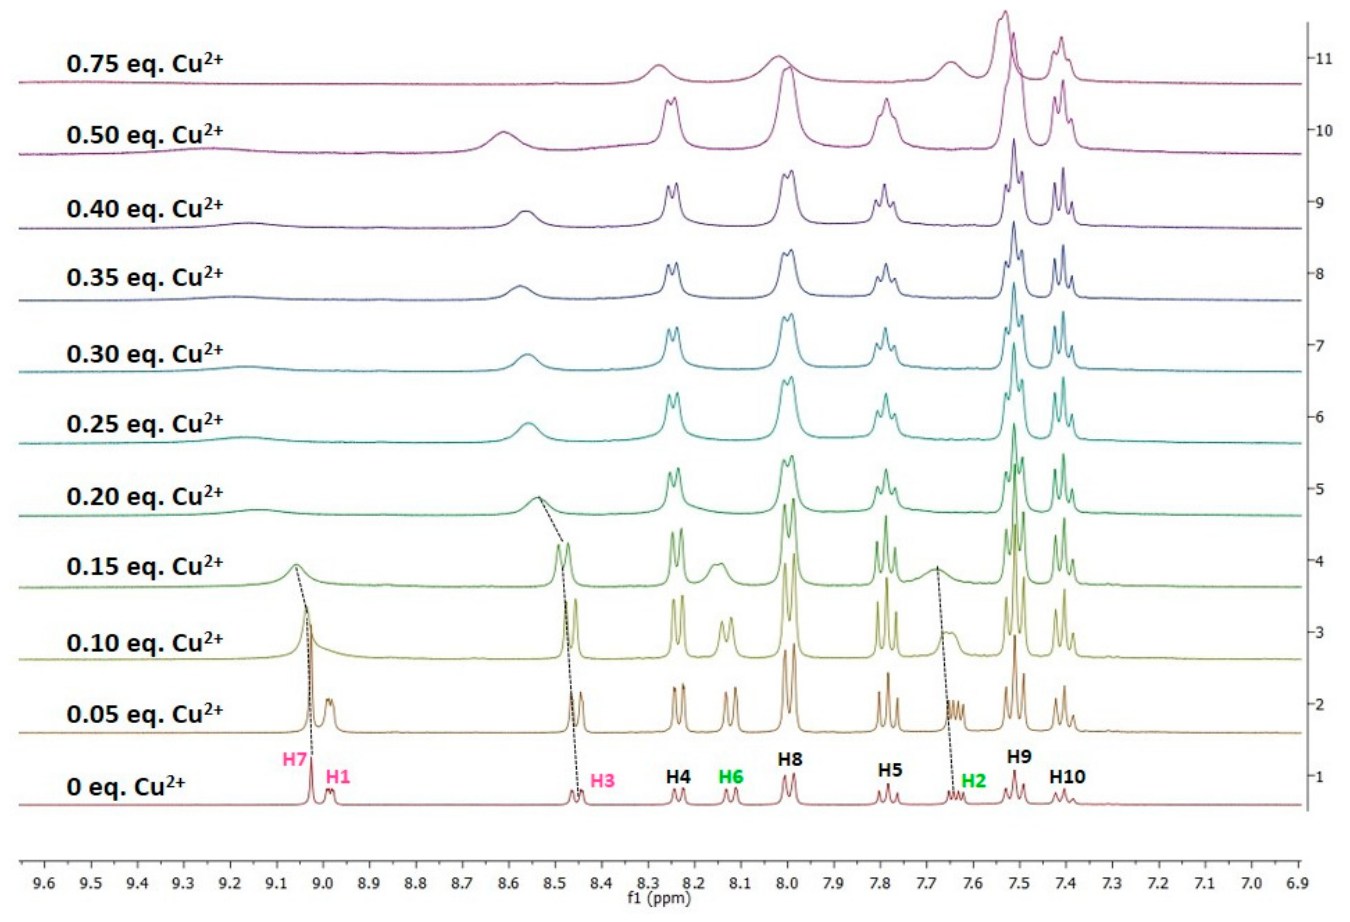
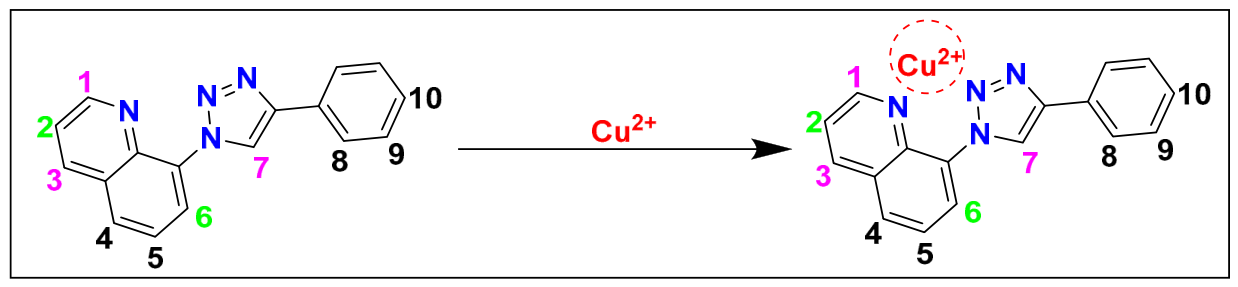
Details regarding the interactions in the Cu-QTP species were obtained using an 1H-NMR titration experiment with Cu2+ where the amount of QTP was held constant. These results clearly showed the participation of the triazolyl and quinolinyl nitrogens in the detection process [30]. Increasing the amount of Cu2+ resulted in downfield shifts for the triazole’s H-7 and the quinoline’s H-1 and H-3 (Figure 7). The maximum observable change occurred with H-3, from 8.45 ppm at 0.0 eq of Cu (II) to 8.60 ppm with 0.50 eq of Cu (II). The chemical shifts for H-1 and H-7 seemed to merge at ~9.10 ppm with 0.15 eq Cu2+, each originating at 8.99 and 9.04 ppm, respectively. The observed deshielding of protons whose environments depend on the electronic character of the ring nitrogens indicates that both the triazole (H-7) and quinoline (H-1 and H-3) nitrogens participate directly in coordinating to Cu2+. The triazolyl–quinolinyl binding-pocket model is strongly reinforced by the pronounced line broadening and eventual disappearance of proton signals. Protons are located in close proximity to the Cu2+ center, specifically H-2 and H-6 at 0.15 equiv. of Cu(II), followed by H-1 and H-7 at approximately 0.30 eq consistent with direct paramagnetic perturbation upon coordination [31]. Not much could be discerned at ≥0.75 eq due to broadening of the signals caused by the paramagnetism of Cu2+. However, the information obtained at lower equivalents clearly demonstrates the involvement of N-donor groups from both the quinoline and triazole in the formation of a probe-metal complex (Scheme 2).

3.4. Al3+: UV-Vis Absorption, Fluorescence, and NMR Spectroscopic Investigations

Spectroscopic investigations with fluorescence, UV-Vis absorption and NMR revealed the mechanism of response to Al3+.

3.4.1. Al3+: Investigation by UV-Vis Absorption

The spectrophotometric titrations of QTP were performed with different concentrations of Al3+ salt in acetonitrile (Figure S5). Upon addition of Al3+, the absorption bands centered around 294 nm showed a gradual decrease in absorbance with the simultaneous development of a new peak around 345 nm. In addition to these changes, the high-energy band (~294 nm) showed red-shifted absorption. The preliminary observation of QTP with Al3+ in UV-Vis absorption prompted a quantitative analysis using fluorescence spectroscopy for the formation of the QTP-Al3+ complex.

3.4.2. Al3+: Fluorescence Spectroscopic Investigation

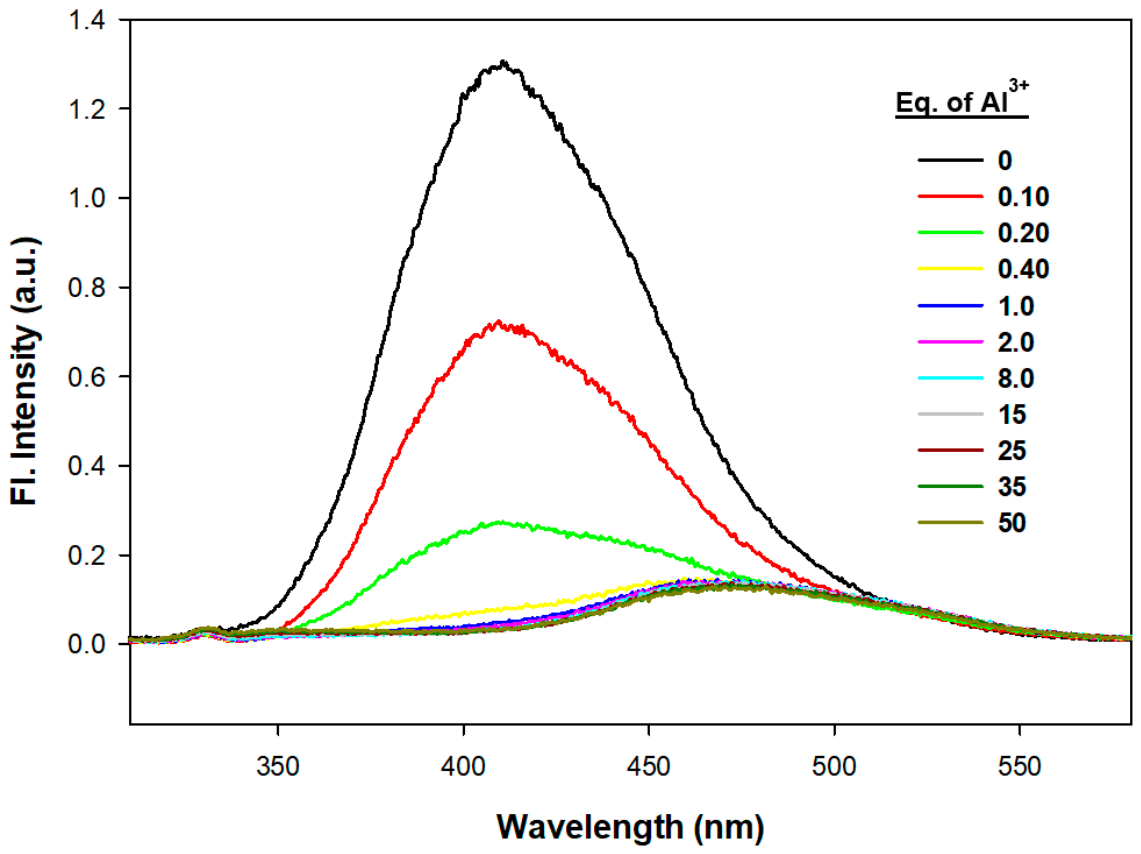
As mentioned in the fluorescence screening study (Section 3.2), the emission of QTP yielded a peak around 411 nm. Fluorescence spectroscopy titration experiments with the QTP sensor and Al3+ showed a decrease in the emission band at ~411 nm until 0.3 eq of the metal with respect to QTP (Figure 8). Development of a new band around 477 nm was observed when 0.4 equivalents of Al3+ were added to QTP. This is consistent with the signal output observed under UV-light in Figure 1 which shows that Al3+ induces a blue to green color change with QTP. The ratiometric change in the emission of QTP is considered an outcome of the combined effect of the Lewis acidity of Al3+, solvation and the formation of the metal-ligand complex [32]. Quinoline probes have often shown modulation in the emission due to changes in local pH [33]. Asthana et al. [34] synthesized a potent fluorescent sensor, CMO for the detection of Al3+. Further, the CMO-Al3+ ensemble demonstrated effective performance as a selective probe for the detection of pyrophosphate (PPi) and picric acid. The results from their study revealed that the operational pH range of CMO for the detection of Al 3+ is 4–8.
Job’s plot based on the emission band intensity at 411 nm revealed a 2:1 stoichiometric ratio for the sensor: Al3+ ion (Figure 9). In this plot, the non-linear curve fit parameter went through a maximum ΔF.Χ at Χ = 0.70, correlating a 2:1 binding stoichiometry between QTP and Al3+. The binding constant based on the Benesi–Hildebrand plot is 1.42 × 10⁶ M−2 (Figure S11) [23]. The LOD based on the Stern–Volmer plot is 4.27 µM (Figure S6) somewhat higher than similar small-molecule sensors which bind 2:1, sensor:Al3+ with LODs in the ~70–80 nM range [35,36]. However, as noted previously, QTP’s one-step synthesis and its distinct response to the cation, in this case blue to green, are an advantage; this speaks to its potential for further development for practical use.

3.4.3. 1H-NMR Investigations with the QTP-Al3+ Complex

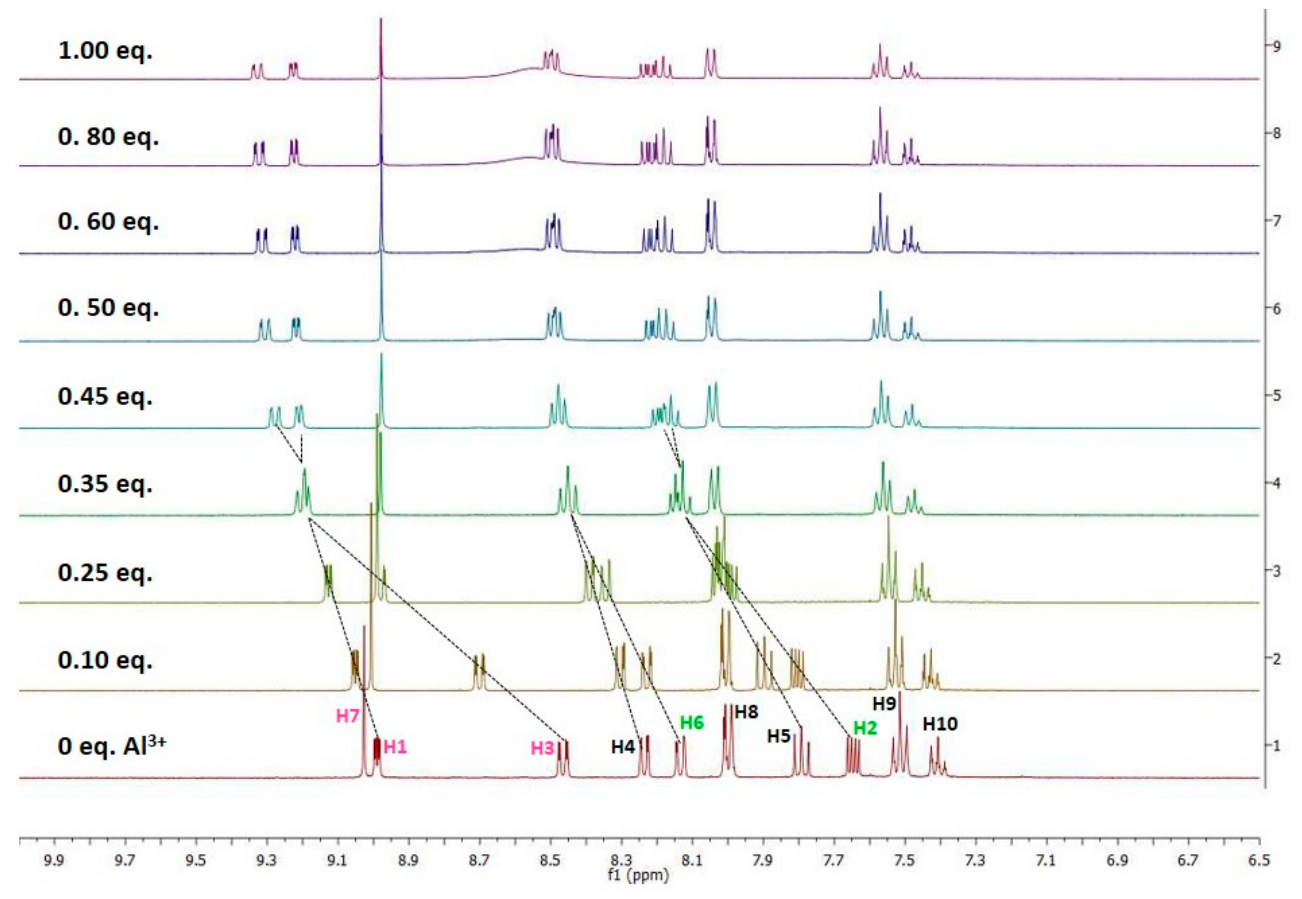
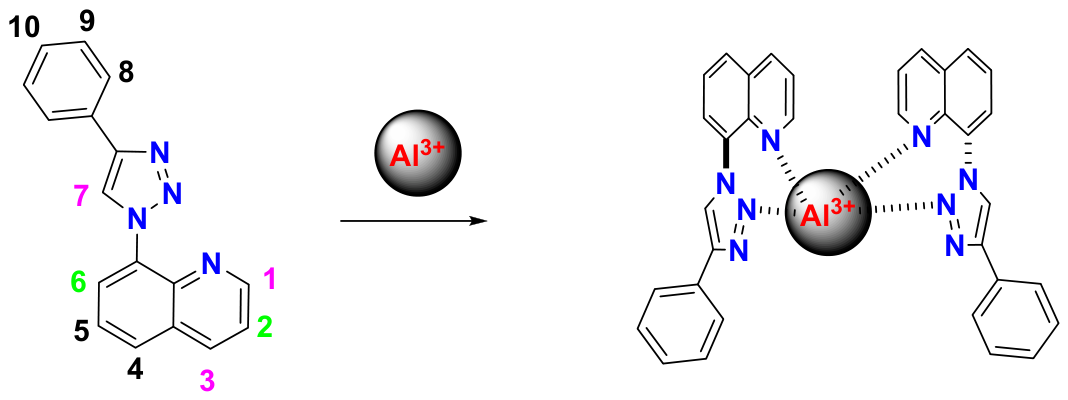
NMR titration experiment with QTP and aluminum perchlorate strongly suggests that the sensor binds to Al3+ via its quinolinyl nitrogen (Figure 10) [37,38,39]. The behavior of the sensor with this ion is vastly different from that of Cu2+ (Figure 7). The change in the triazole proton’s resonance, H-7, is marginal compared to quinolinyl signals that are substantially shifted downfield between 0 and ~0.50 eq of Al3+ (Figure 10). With increasing amounts of Al3+, the resonances for H-1 and H-3 move from 8.99 ppm to 9.22 ppm, and 8.46 ppm to 9.32 ppm, respectively. The chemical shift for H-5 changes from 7.79 ppm to 8.18 ppm while signals for H-2 move from 7.65 ppm to 8.23 ppm. The peaks for H-4 at 8.24 ppm and H-6 at 8.14 ppm eventually merge and become centered around 8.50 ppm. In contrast, the triazole’s Csp2-H resonance, H-7, moves upfield by only 0.06 ppm from 9.04 ppm to 8.98 ppm. This slight upfield shift as opposed to a significant downfield movement in the H-7 signal strongly suggests that the triazolyl nitrogens are not involved in the binding to the Al3+ [38,39]. The phenyl signals, H-8, H-9 and H-10, remain unchanged regardless of the amount of Al3+ and after 0.6 eq, the quinolinyl signals stop responding to the addition of the cation. A Job’s plot based on the NMR titration corroborated the results of the fluorescence Job’s plot, with a maximum of ~0.7 that indicates a ratio of 2:1, QTP:Al3+ (Scheme 3, Figure 9 and Figure S7).
DFT calculations on the QTP–Al3+ coordinated geometries were performed using Gaussian 09W software with the ωB97XD functional and 6-311G(d,p) basis set using acetonitrile as solvent (Figures S8 and S9) [40]. The solvation was computed using the SMD (Solvation Model based on Density) model [41]. The optimized geometry suggests the participation of triazole nitrogen along with the quinolinyl nitrogen in binding Al3+ with QTP molecules as evidenced by their close proximities (Figures S8B and S9). In the optimized geometry, the close proximity of nitrogen atoms to Al3+, especially N21—Al67 and N15—Al67 points towards a nitrogen-assisted binding rather than an isolated one (Figure S9). NMR titration with Al3+ on QTP though shows little change in the triazole signal but this is not explicit of the excluded triazole nitrogen atom in binding with Al3+. Triazole nitrogen coordinated to Al3+ can induce localized electronic perturbations which might have little effect on the NMR signals as evidenced by the DFT calculations suggesting the triazole nitrogen and quinolinyl nitrogen bound QTP–Al3+ structure [42].

3.5. Interference Studies Probing the QTP’s Response to Cu2+ and Al3+ via Fluorescence

Interference studies to determine the sensitivity of the sensor compared to the other cations in this investigation were performed with Cu2+ and Al3+ cations.

3.5.1. Interference Studies with Cu2+

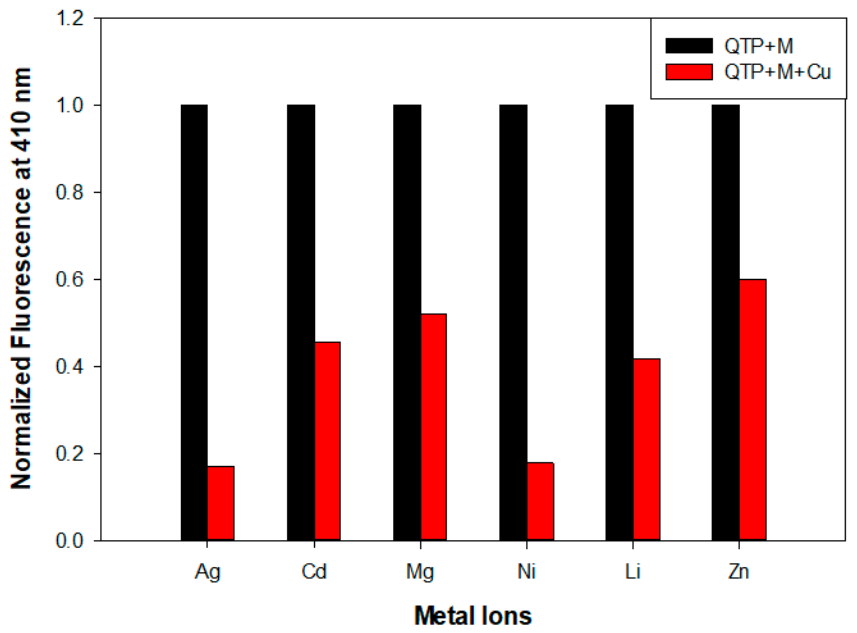
To varying degrees, five equivalents of Cu2+ muted the fluorescence of the sensor in the presence of ten equivalents of the Ni2+, Cd2+, Zn2+, Mg2+, Li+, and Ag+ ions (Figure 11). Significantly, in all cases, fluorescence intensity was reduced to 60% of the original value or less with the addition of copper (Figure 11). The most pronounced effect was observed with Ni2+ and Ag+ with which the addition of copper (II) reduced the fluorescence by more than 80%.

3.5.2. Interference Studies with Al3+

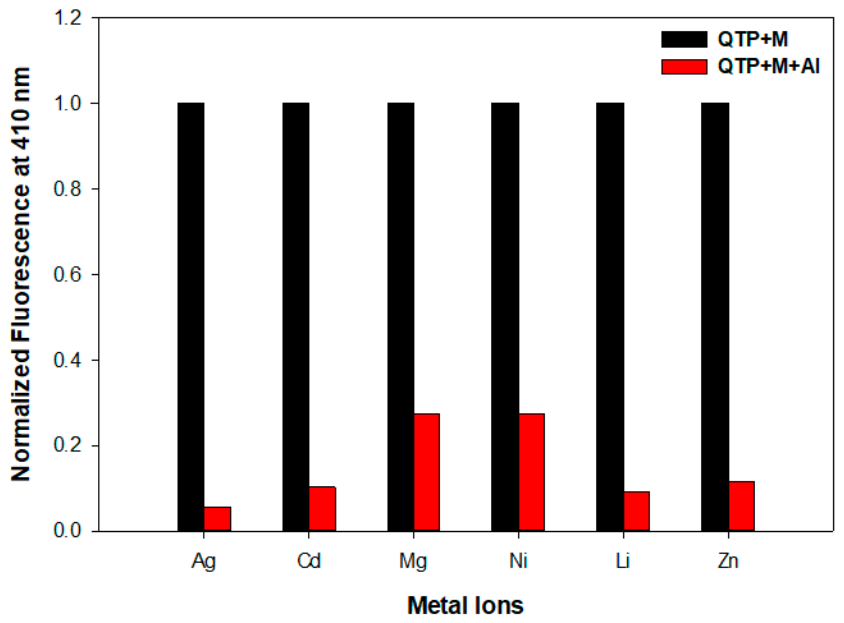
For the aluminum perchlorate addition of 5 eq. of Al3+ to an acetonitrile solution of the sensor and 10 eq. of the interfering cations, Ni2+, Cd2+, Zn2+, Mg2+, Li+, and Ag+, showed a clear reduction in the intensity at ~410 nm (Figure 12). A comparison of the fluorescence output at 410 nm in the presence and absence of Al3+ indicates a distinct and strong preference for the Al3+ ion over the other metals, more so than was observed with Cu2+. In all cases, the 410 nm band was reduced to ~30% or less of its original value when Al3+ was added.

3.5.3. Cu2+ Versus Al3+ Interference

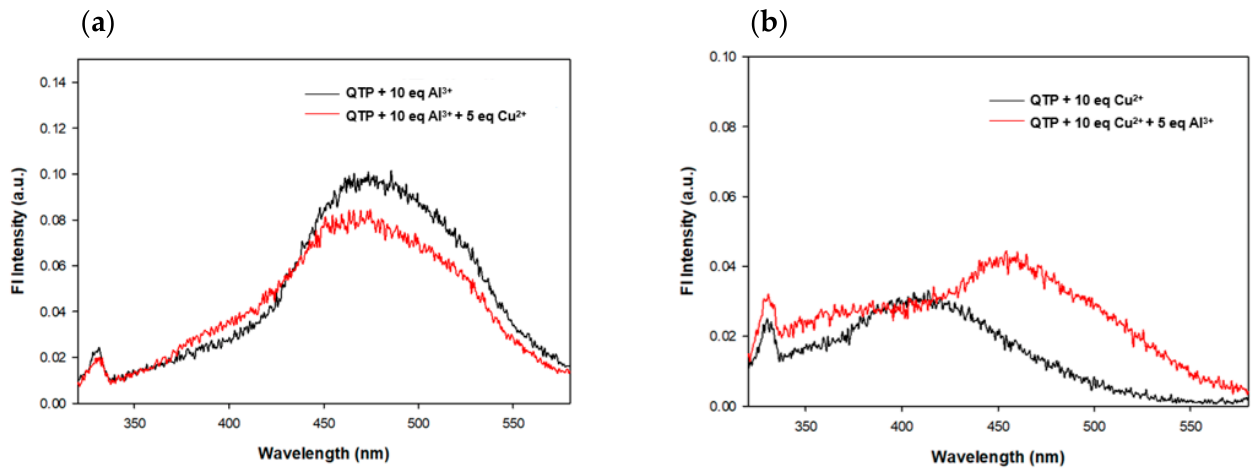
In exploring the preference of the sensor for Al3+ compared to Cu2+, it was noted that a selectivity for Al3+ was somewhat maintained in the presence of Cu2+. The addition of 5 eq of the copper (II) perchlorate salt to a solution of the sensor and 10 eq of Al3+ reduced the intensity at 477 nm to ~80% of the initial value but did not revert to ~411 nm maximum that is observed when the sensor is only in the presence of Cu2+ (Figure 2 and Figure 13a). Doing the study in reverse, treating a mixture of the sensor and 10 eq. copper (II) with half the amount of Al3+, 5 eq., caused a red shift in the λmax. from ~411 nm to ~460 nm. This movement toward the 477 nm band clearly shows a response that is specific to Al3+ and is most indicative of the aluminum cation’s ability to compete with Cu2+ for binding to QTP.

4. Conclusions

Under UV illumination (365 nm), QTP, a triazolyl-quinoline-based sensor, was found to produce a “turn off” response to Cu2+ and blue-to-green signal output for Al3+. NMR and DFT studies provided valuable information about the binding interaction. QTP appears to interact with Cu2+ via nitrogens in both the triazole and quinoline units based on NMR data while Al3+ strongly interacts with the molecule through the quinolinyl nitrogen as seen in NMR, and through the triazole N as predicted by DFT calculations. Job’s plots from fluorescence titration studies confirm a 1:1 stoichiometric ratio for QTP:Cu2+ and a 2:1 binding ratio for QTP:Al3+; each result is corroborated by two separate experiments from the following: NMR, absorbance or fluorescence studies. Overall, the sensor displays a marked selectivity for Al3+ over other ions explored in this study, including Cu2+. Results from this work provide rich insight into the binding mode and selectivity of the sensor. These findings will establish that the triazolyl–quinolinyl scaffold forms a well-defined, metal-selective binding pocket capable of differentiating Cu2+ from Al3+, positioning this platform as a strong candidate for next-generation metal-ion sensors, chelators, and coordination-driven functional materials. Our group is currently focusing on substituted pyridine and quinoline ion sensors. The scope of this manuscript is restricted to the design and evaluation of QTP with Cu2+ and Al3+ in comparison to a narrow selection of non-response-inducing cations. Consequently, to further develop this quinoline scaffold for practical applications, the impact on the photophysical response with a wider selection of cations, variation in the counter anions, and different conditions that mimic environmental pH will be investigated in future iterations of this work [43].

Supplementary Materials

The following supporting information can be downloaded at: https://www.mdpi.com/article/10.3390/s26144508/s1. The supplementary material consists of: Section A. General Experimental; Section B. Synthesis of 8-(4-phenyl-1H-1,2,3-triazol-yl)Quinoline (QTP); Section C. Spectra and Images; and Figure S1. (A) 1H-NNMR Spectrum of QTP. (B) 2D 1H-1H COSY Spectrum for QTP. (C) 13C-NMR Spectrum of QTP. Solvent: deuterated acetonitrile (CD3CN); Figure S2. Response of QTP (2.94 × 10⁻⁴ mol dm−3) treated with metal perchlorate salts (~2 × 10⁻³ mol dm−3) in acetonitrile under (A) UV-light (365 nm), (B) ambient light, and (C) paper strip practical applications: (i)—ambient light; (ii)—UV-light (365 nm)—pure QTP sensor; (iii)—UV-light (365 nm)—pure QTP sensor; QTP + Cu2+ and, QTP + Al3+. (D) Fluorescence spectra for QTP only (black) (2.94 × 10⁻⁴ mol dm−3), QTP with Fe3+ (red), Fe2+ (purple) and Al3+ (green) (concentration of perchlorate salts: ~3 × 10⁻³ mol dm−3); Figure S3. Normalized emission and fluorescence excitation spectra of QTP (2.94 × 10⁻⁴ mol dm−3) in acetonitrile (for the emission spectrum the excitation wavelength is 294 nm and for the excitation spectrum the monitored emission wavelength is 411 nm); Figure S4. Job’s plot of QTP with copper (II) perchlorate hexahydrate in acetonitrile based on absorbance monitored at 315 nm. X = [ Q T P ] [ Q T P + C u 2 + ] for [QTP +Cu2+]: sum of molar concentrations of QTP and Cu2+, and [QTP]: molar concentration of QTP; Figure S5. Absorbance Titration with QTP and the perchlorate salt of Al3+; Figure S6. Stern–Volmer plot to determine the limit of detection (LOD) using the fluorescence output for QTP with Al3+ ion (observed wavelength: 415 nm). LOD = 4.27 µM; Figure S7. Job’s plot based on the 1H-NMR titration experiment with QTP and the perchlorate salt of Al3+, observed chemical shift is for H-3; Figure S8. DFT Prediction for (A) Uncoordinated 2:1 QTP-Al3+ Complex and (B) Coordinated 2:1 QTP-Al3+ Complex; Figure S9. Detailed View of Optimized DFT Prediction for 2:1 QTP-Al3+ Complex; Figure S10. Benesi–Hildebrand plot for QTP with Cu2+ based on absorbance; Figure S11. Benesi–Hildebrand plot for QTP with Al3+ based on fluorescence.

Author Contributions

Conceptualization, S.M.L., D.G. and K.S.A.; Methodology, S.M.L., D.G., D.B. and K.S.A.; Validation, T.C.C., R.D.G., V.F.H. and P.O.; Formal Analysis, all authors; Investigation, T.C.C., R.D.G., V.F.H. and P.O.; Computing Resources—D.B.; Data Curation, all authors; Writing—Original Draft Preparation, S.M.L., D.G. and K.S.A.; Writing—Review and Editing, S.M.L., D.G., D.B. and K.S.A. Author T.C.C. passed away prior to the publication of this manuscript. All authors have read and agreed to the published version of the manuscript.

Funding

The authors acknowledge the support of the Georgia Southern (GS) University Biochemistry, Chemistry and Physics Department. S.M.L. is also grateful to the Vertically Integrated Projects (VIP) program supported by the Office of Research and Economic Development.

Data Availability Statement

Data related to investigations in this article are in the supplemental material. Additional raw data can be made available upon reasonable request.

Acknowledgments

This article is dedicated to the late Tyler C. Camp who made invaluable contributions to the investigations and analyses in this work. During the preparation of the manuscript, the authors used Microsoft Copilot to paraphrase and refine selected sections of text for improved clarity and to correct grammatical errors. After using this tool, the authors reviewed the scientific content to ensure accuracy and maintain the integrity of the original meaning. The authors also take full responsibility for the content of this publication. D.G. acknowledges the Department of Chemistry and the computational server facility at Southern Illinois University Edwardsville. We are also grateful to Yassine Ndiaye (MS’27) for providing technical assistance.

Conflicts of Interest

The authors declare no conflicts of interest.

References

  1. Kaya, S.; Bezerra, C.W.B.; Fernandes de Farias, R.; Çiltaş, A.Ç.; Elik, M. Metal cations toxicity: An inorganic interpretation. J. Indian Chem. Soc. 2023, 100, 100840. [Google Scholar] [CrossRef] [Scilit]
  2. Tsang, T.; Davis, C.I.; Brady, D.C. Copper biology. Curr. Biol. 2021, 31, R421–R427. [Google Scholar] [CrossRef] [Scilit] [PubMed]
  3. Welch, E.B.; Cooke, G.D. Effectiveness and Longevity of Phosphorus Inactivation with Alum. Lake Reserv. Manag. 1999, 15, 5–27. [Google Scholar] [CrossRef] [Scilit]
  4. Krewski, D.; Yokel, R.A.; Nieboer, E.; Borchelt, D.; Cohen, J.; Harry, J.; Kacew, S.; Lindsay, J.; Mahfouz, A.M.; Rondeau, V. Human Health Risk Assessment for Aluminium, Aluminium Oxide, and Aluminium Hydroxide. J. Toxicol. Environ. Health Part B Crit. Rev. 2007, 10, 1–269. [Google Scholar] [CrossRef] [Scilit] [PubMed]
  5. Krupińska, I. Aluminium Drinking Water Treatment Residuals and Their Toxic Impact on Human Health. Molecules 2020, 25, 641. [Google Scholar] [CrossRef] [Scilit] [PubMed]
  6. Sentyabreva, A.V.; Miroshnichenko, E.A.; Grabeklis, A.R.; Stalnova, D.S.; Kosyreva, A.M. Comparison of Morphological Signs of Neurodegenerative Changes and Expression of Neuroprotective Factors in Adult and Aged Wistar Rats in AlCl3-Induced Neurodegeneration. Bull. Exp. Biol. Med. 2025, 179, 778–784. [Google Scholar] [CrossRef] [Scilit] [PubMed]
  7. Singh, S.; Tripathi, D.K.; Singh, S.; Sharma, S.; Dubey, N.K.; Chauhan, D.K.; Vaculík, M. Toxicity of aluminium on various levels of plant cells and organism: A review. Environ. Exp. Bot. 2017, 137, 177–193. [Google Scholar] [CrossRef] [Scilit]
  8. Cardwell Allison, S.; Adams William, J.; Gensemer Robert, W.; Nordheim, E.; Santore Robert, C.; Ryan Adam, C.; Stubblefield William, A. Chronic toxicity of aluminum, at a pH of 6, to freshwater organisms: Empirical data for the development of international regulatory standards/criteria. Environ. Toxicol. Chem. 2017, 37, 36–48. [Google Scholar] [CrossRef] [Scilit] [PubMed]
  9. Wiloch-Szyborska, M.Z.; Baran, N.; Gorla, G.; Amigo, J.M.; Wesoły, M. Investigation of copper binding competition between a potential anti-Alzheimer’s drug and Aβ(1–16) based on voltametric and chemometric analysis. Electrochim. Acta 2026, 562, 148716. [Google Scholar] [CrossRef] [Scilit]
  10. Exley, C. The Chemistry of Human Exposure to Aluminum. In Neurotoxicity of Aluminum; Niu, Q., Ed.; Springer Nature: Singapore, 2023; pp. 33–37. [Google Scholar]
  11. Ofoe, R.; Thomas, R.H.; Asiedu, S.K.; Wang-Pruski, G.; Fofana, B.; Abbey, L. Aluminum in plant: Benefits, toxicity and tolerance mechanisms. Front. Plant Sci. 2023, 13, 1085998. [Google Scholar] [CrossRef] [Scilit] [PubMed]
  12. Zavalishin, M.N.; Guschin, A.A.; Gamov, G.A. Experimental and DFT Investigation of a Vitamin B6-Derived Fluorescent Probe for Detection of Al3+ and Ga3+ Ions in a Buffered Aqueous DMSO Solution. Sensors 2026, 26, 2816. [Google Scholar] [CrossRef] [Scilit] [PubMed]
  13. Rajkhowa, S.; Jaiswal, M.K.; Singh, S.K.; Chaubey, S.; Tiwari, V.K. “Click Chemistry” Inspired 1,2,3-Triazole-Based Chemosensors: Recent Developments and Future Perspectives. Chem. Biodivers. 2025, 22, e00735. [Google Scholar] [CrossRef] [Scilit] [PubMed]
  14. Ghosh, D.; Rhodes, S.; Winder, D.; Atkinson, A.; Gibson, J.; Ming, W.; Padgett, C.; Landge, S.; Aiken, K. Spectroscopic investigation of bis-appended 1,2,3-triazole probe for the detection of Cu(II) ion. J. Mol. Struct. 2017, 1134, 638–648. [Google Scholar] [CrossRef] [Scilit]
  15. Struthers, H.; Spingler, B.; Mindt, T.L.; Schibli, R. “Click-to-Chelate”: Design and Incorporation of Triazole-Containing Metal-Chelating Systems into Biomolecules of Diagnostic and Therapeutic Interest. Chem. A Eur. J. 2008, 14, 6173–6183. [Google Scholar] [CrossRef] [Scilit] [PubMed]
  16. Landge, S.M.; Lazare, D.Y.; Freeman, C.; Bunn, J.; Cruz, J.I.; Winder, D.; Padgett, C.; Aiken, K.S.; Ghosh, D. Rationally designed phenanthrene derivatized triazole as a dual chemosensor for fluoride and copper recognition. Spectrochim. Acta Part A Mol. Biomol. Spectrosc. 2020, 228, 117758. [Google Scholar] [CrossRef] [Scilit] [PubMed]
  17. Chen, Z.; Yan, Q.; Liu, Z.; Xu, Y.; Zhang, Y. Copper-Mediated Synthesis of 1,2,3-Triazoles from N-Tosylhydrazones and Anilines. Angew. Chem. 2013, 125, 13566–13570. [Google Scholar] [CrossRef] [Scilit]
  18. Kolb, H.C.; Finn, M.G.; Sharpless, K.B. Click Chemistry: Diverse Chemical Function from a Few Good Reactions. Angew. Chem. Int. Ed. 2001, 40, 2004–2021. [Google Scholar] [CrossRef]
  19. Hein, J.E.; Fokin, V.V. Copper-catalyzed azide–alkyne cycloaddition (CuAAC) and beyond: New reactivity of copper(i) acetylides. Chem. Soc. Rev. 2010, 39, 1302–1315. [Google Scholar] [CrossRef] [Scilit] [PubMed]
  20. Chen, Z.; Yan, Q.; Liu, Z.; Zhang, Y. Metal-Free C—N- and N—N-Bond Formation: Synthesis of 1,2,3-Triazoles from Ketones, N-Tosylhydrazines, and Amines in One Pot. Chem. A Eur. J. 2014, 20, 17635–17639. [Google Scholar] [CrossRef] [Scilit] [PubMed]
  21. Kaleeswaran, S.; Prabakaran, D.S.; Santhamoorthy, M.; Ansar, S.; Farah, M.A.; Rajamanikandan, R.; Mani, K.S. Novel quinoline-based chemosensor as specific fluorescence sensing of copper ions in cancer cells and for organelle-specific imaging application. Inorganica Chim. Acta 2025, 575, 122440. [Google Scholar] [CrossRef] [Scilit]
  22. Udhayakumari, D. A comprehensive anthology of literature based on quinoline chemosensors from 2006 to 2022. J. Mol. Struct. 2023, 1287, 135715. [Google Scholar] [CrossRef] [Scilit]
  23. Nunes, M.C.; dos Santos Carlos, F.; Fuganti, O.; Galindo, D.D.M.; De Boni, L.; Abate, G.; Nunes, F.S. Turn-on fluorescence study of a highly selective acridine-based chemosensor for Zn2+ in aqueous solutions. Inorganica Chim. Acta 2020, 499, 119191. [Google Scholar] [CrossRef] [Scilit]
  24. Ghosh, D.; Sarkar, D.; Chattopadhyay, N. Intramolecular charge transfer promoted fluorescence transfer: A demonstration of re-absorption of the donor fluorescence by the acceptor. J. Mol. Liq. 2010, 156, 131–136. [Google Scholar] [CrossRef] [Scilit]
  25. Rahimi, Y.; Goulding, A.; Shrestha, S.; Mirpuri, S.; Deo, S.K. Mechanism of Copper Induced Fluorescence Quenching of Red Fluorescent Protein, DsRed. Biochem. Biophys. Res. Commun. 2008, 370, 57–61. [Google Scholar] [CrossRef] [Scilit] [PubMed]
  26. Badugu, R.; Lakowicz, J.R.; Geddes, C.D. Fluorescence intensity and lifetime-based cyanide sensitive probes for physiological safeguard. Anal. Chim. Acta 2004, 522, 9–17. [Google Scholar] [CrossRef] [Scilit] [PubMed]
  27. Badugu, R.; Lakowicz, J.R.; Geddes, C.D. Enhanced Fluorescence Cyanide Detection at Physiologically Lethal Levels:  Reduced ICT-Based Signal Transduction. J. Am. Chem. Soc. 2005, 127, 3635–3641. [Google Scholar] [CrossRef] [Scilit] [PubMed]
  28. Chamlagai, D.; Nonglamin, I.; Phanrang, P.T.; Khamrang, T.; Velusamy, M.; Mitra, S. Deciphering the excited state behaviour of 2-pyridin-2-yl-quinoline based systems with fluorescence quenching response for the selective detection of cu(II) ions. J. Photochem. Photobiol. A Chem. 2026, 470, 116647. [Google Scholar] [CrossRef] [Scilit]
  29. Senpradit, Y.; Wacharasindhu, S.; Sukwattanasinitt, M. Novel highly selective quinoline-based fluorescent chemosensors for quantitative analysis of Cu(II) ion in water and food. Spectrochim. Acta Part A Mol. Biomol. Spectrosc. 2025, 326, 125128. [Google Scholar] [CrossRef] [Scilit] [PubMed]
  30. Urankar, D.; Pinter, B.; Pevec, A.; De Proft, F.; Turel, I.; Košmrlj, J. Click-Triazole N2 Coordination to Transition-Metal Ions Is Assisted by a Pendant Pyridine Substituent. Inorg. Chem. 2010, 49, 4820–4829. [Google Scholar] [CrossRef] [Scilit] [PubMed]
  31. McCarney, E.P.; Hawes, C.S.; Blasco, S.; Gunnlaugsson, T. Synthesis and structural studies of 1,4-di(2-pyridyl)-1,2,3-triazole dpt and its transition metal complexes; a versatile and subtly unsymmetric ligand. Dalton Trans. 2016, 45, 10209–10221. [Google Scholar] [CrossRef] [Scilit] [PubMed]
  32. Saha, S.; De, A.; Ghosh, A.; Ghosh, A.; Bera, K.; Das, K.S.; Akhtar, S.; Maiti, N.C.; Das, A.K.; Das, B.B.; et al. Pyridine-pyrazole based Al(iii) ‘turn on’ sensor for MCF7 cancer cell imaging and detection of picric acid. RSC Adv. 2021, 11, 10094–10109. [Google Scholar] [CrossRef] [Scilit] [PubMed]
  33. An, B.-K.; Mulherin, R.; Langley, B.; Burn, P.; Meredith, P. Ruthenium complex-cored dendrimers: Shedding light on efficiency trade-offs in dye-sensitised solar cells. Org. Electron. 2009, 10, 1356–1363. [Google Scholar] [CrossRef] [Scilit]
  34. Asthana, S.K.; Kumar, A.; Neeraj; Shweta; Hira, S.K.; Manna, P.P.; Upadhyay, K.K. Brightening Quinolineimines by Al3+ and Subsequent Quenching by PPi/PA in Aqueous Medium: Synthesis, Crystal Structures, Binding Behavior, Theoretical and Cell Imaging Studies. Inorg. Chem. 2017, 56, 3315–3323. [Google Scholar] [CrossRef] [Scilit] [PubMed]
  35. Liu, Y.; Li, N.; Zhang, Y.; Wang, Y. Diphenyl imidazole-based fluorescent chemosensor for Al3+ and its Al3+ complex toward water detection in food products. Food Chem. 2023, 420, 136138. [Google Scholar] [CrossRef] [Scilit] [PubMed]
  36. Li, Q.; Ma, L.; Li, J.; Wang, L.; Yu, L.; Zhao, Y.; Lv, Y. Study of a Fluorescent System Based on the Naphthalene Derivative Fluorescent Probe Bound to Al3+. Micromachines 2023, 14, 868. [Google Scholar] [CrossRef] [Scilit] [PubMed]
  37. Roy, A.; Dey, S.; Roy, P. A ratiometric chemosensor for Al3+ based on naphthalene-quinoline conjugate with the resultant complex as secondary sensor for F: Interpretation of molecular logic gates. Sens. Actuators B Chem. 2016, 237, 628–642. [Google Scholar] [CrossRef] [Scilit]
  38. Zhu, Q.; Li, L.; Mu, L.; Zeng, X.; Redshaw, C.; Wei, G. A ratiometric Al3+ ion probe based on the coumarin-quinoline FRET system. J. Photochem. Photobiol. A Chem. 2016, 328, 217–224. [Google Scholar] [CrossRef] [Scilit]
  39. Stefane, B.; Perdih, F.; Visnjevac, A.; Pozgan, F. Novel triazole-based ligands and their zinc(ii) and nickel(ii) complexes with a nitrogen donor environment as potential structural models for mononuclear active sites. New J. Chem. 2015, 39, 566–575. [Google Scholar] [CrossRef] [Scilit]
  40. Frisch, M.J.; Trucks, G.W.; Schlegel, H.B.; Scuseria, G.E.; Robb, M.A.; Cheeseman, J.R.; Scalmani, G.; Barone, V.; Mennucci, B.; Petersson, G.A.; et al. Gaussian 09, Revision A.02; Gaussian, Inc.: Wallingford, CT, USA, 2009. [Google Scholar]
  41. Marenich, A.V.; Cramer, C.J.; Truhlar, D.G. Universal Solvation Model Based on Solute Electron Density and on a Continuum Model of the Solvent Defined by the Bulk Dielectric Constant and Atomic Surface Tensions. J. Phys. Chem. B 2009, 113, 6378–6396. [Google Scholar] [CrossRef] [Scilit] [PubMed]
  42. Safronov, N.E.; Kostova, I.P.; Palafox, M.A.; Belskaya, N.P. Combined NMR Spectroscopy and Quantum-Chemical Calculations in Fluorescent 1,2,3-Triazole-4-carboxylic Acids Fine Structures Analysis. Int. J. Mol. Sci. 2023, 24, 8947. [Google Scholar] [CrossRef] [Scilit] [PubMed]
  43. Lakhani, D.; Sadiq, S.; Subbaiahgari, H.; Swanson, V.; Munyon, J.; Poudel, S.B.; Aiken, K.S.; Landge, S.M.; Bose, D.; Ghosh, D. Structure–Property Correlations in Disubstituted 1,2,3-Triazoles: DFT Insights and Photophysical Analysis. ACS Omega 2025, 10, 58925–58942. [Google Scholar] [CrossRef] [Scilit] [PubMed]
Scheme 1. Synthesis of 8-(4-phenyl-1H-1,2,3-triazol-yl)quinoline, QTP.
Sensors 26 04508 sch001
Figure 1. (a) Response of QTP (2.94 × 10⁻⁴ mol dm−3) treated with 10 equivalents of a diverse range of perchlorate salts in acetonitrile under UV-light (365 nm) and (b) photograph of the paper strip showcasing the real-life application of free sensor QTP, and QTP + Copper (II) and QTP + Aluminum (III) perchlorate salts at 365 nm.
Sensors 26 04508 g001
Figure 2. Fluorescence spectra of QTP sensor (2.94 × 10⁻⁴ mol dm−3) treated with perchlorate salts (~3 × 10⁻³ mol dm−3) in acetonitrile. Exc. at 294 nm.
Sensors 26 04508 g002
Figure 3. Absorbance spectrum of QTP (2 × 10⁻⁵ mol dm−3) with the addition (µL) of copper (II) perchlorate salt in acetonitrile. Vertical arrows indicate the direction in which changes occur with increasing amounts of the salt.
Sensors 26 04508 g003
Figure 4. Fluorescence titration of the QTP sensor (2.95 × 10⁻⁴ mol dm−3) with the addition of copper (II) perchlorate hexahydrate in acetonitrile. Exc. at 294 nm. The vertical arrow indicates the direction in which changes occur with increasing amounts of the salt.
Sensors 26 04508 g004
Figure 5. Job’s plot of QTP with copper (II) perchlorate salt in acetonitrile, emission monitored at 411 nm. Exc. at 294 nm.
Sensors 26 04508 g005
Figure 6. The Stern–Volmer plot for the fluorescence quenching of QTP in the presence of copper (II) perchlorate hexahydrate.
Sensors 26 04508 g006
Scheme 2. A schematic representation of the plausible interaction of QTP with Cu (II).
Sensors 26 04508 sch002
Figure 7. Titration experiments with QTP sensor (3.68 × 10⁻² mol dm−3) and Cu (II) perchlorate salt in acetonitrile using 1H-NMR spectroscopy.
Sensors 26 04508 g007
Figure 8. Fluorescence titration of the QTP sensor (1.47 × 10⁻⁶ mol dm−3) with the addition of Al3+ perchlorate hexahydrate (2.00 × 10⁻⁵ mol dm−3) in acetonitrile. Exc. At 294 nm.
Sensors 26 04508 g008
Figure 9. Job’s plot of QTP with Al3+ perchlorate salt in acetonitrile, emission monitored at 411 nm. Exc. at 294 nm.
Sensors 26 04508 g009
Scheme 3. A schematic representation of the plausible interaction of QTP with Al (III).
Sensors 26 04508 sch003
Figure 10. Titration experiments with QTP sensor (1.47 × 10⁻³ mol dm−3) and Al3+ perchlorate salt (1.00 × 10⁻³ mol dm−3) in acetonitrile using 1H-NMR spectroscopy.
Sensors 26 04508 g010
Figure 11. Interference experiments with QTP sensor with perchlorate salts of Ni2+, Cd2+, Zn2+, Mg2+, Li+, and Ag+ (10 eq for each) and Cu2+ (5 eq) with respect to QTP.
Sensors 26 04508 g011
Figure 12. Interference experiments with QTP sensor with perchlorate salts of Ni2+, Cd2+, Zn2+, Mg2+, Li+, and Ag+ (10 eq for each) and Al3+ (5 eq).
Sensors 26 04508 g012
Figure 13. Interference experiment for QTP in acetonitrile with (a) 5 eq of copper (II) perchlorate added to 10 equivalents of aluminum perchlorate and the sensor and (b) 5 eq of aluminum (III) perchlorate added to 10 equivalents of copper (II) perchlorate and the sensor.
Sensors 26 04508 g013
Disclaimer/Publisher’s Note: The statements, opinions and data contained in all publications are solely those of the individual author(s) and contributor(s) and not of MDPI and/or the editor(s). MDPI and/or the editor(s) disclaim responsibility for any injury to people or property resulting from any ideas, methods, instructions or products referred to in the content.