4.1. Dataset and Evaluation Protocol
Unless otherwise specified, all experiments in this paper were conducted on a Windows operating system. The hardware platform included an NVIDIA GeForce RTX 3060 GPU (Nvidia, Santa Clara, CA, USA), an 11th Gen Intel(R) Core(TM) i5-11400 @ 2.60 GHz CPU, and 16.0 GB memory (Intel, Santa Clara, CA, USA). The software environment mainly included Python 3.10.19, PyTorch 2.7.1+cu118, Ultralytics 8.3.228, and CUDA 11.8 (V11.8.89).
This paper constructs SISID (Soldering Iron Safety Interaction Dataset) to support instance detection, interaction modeling, and safety-state evaluation for slender metallic tools in training scenarios. SISID-Det and SISID-Int are the two official subsets used by RISNet. SISID-Det provides bounding-box annotations for desk, hand, stand, and iron and is used to train the first-stage instance detector. SISID-Int uses the same image split and entity annotations while adding relation records for the second-stage interaction model. Each SISID-Int relation record identifies a soldering iron subject, its associated environmental object when a reliable object is available, and one relation label from on_hand, on_stand, on_desk, and unknown. The first three labels describe explicit operational states. The unknown label represents absent, weak, unreliable, or indeterminate interaction evidence and provides a conservative no-interaction-like target during quality learning.
For comparison with direct state detection, SISID-Direct reorganizes soldering iron boxes into three detector categories: iron_on_hand, iron_on_desk, and iron_on_stand. It is used only to train the single-stage baseline detectors. In addition, the Quality-Head sample cache contains detector-generated candidates and constructed low-quality subject examples for Quality-Head training; it is a training resource and is not treated as an official benchmark subset.
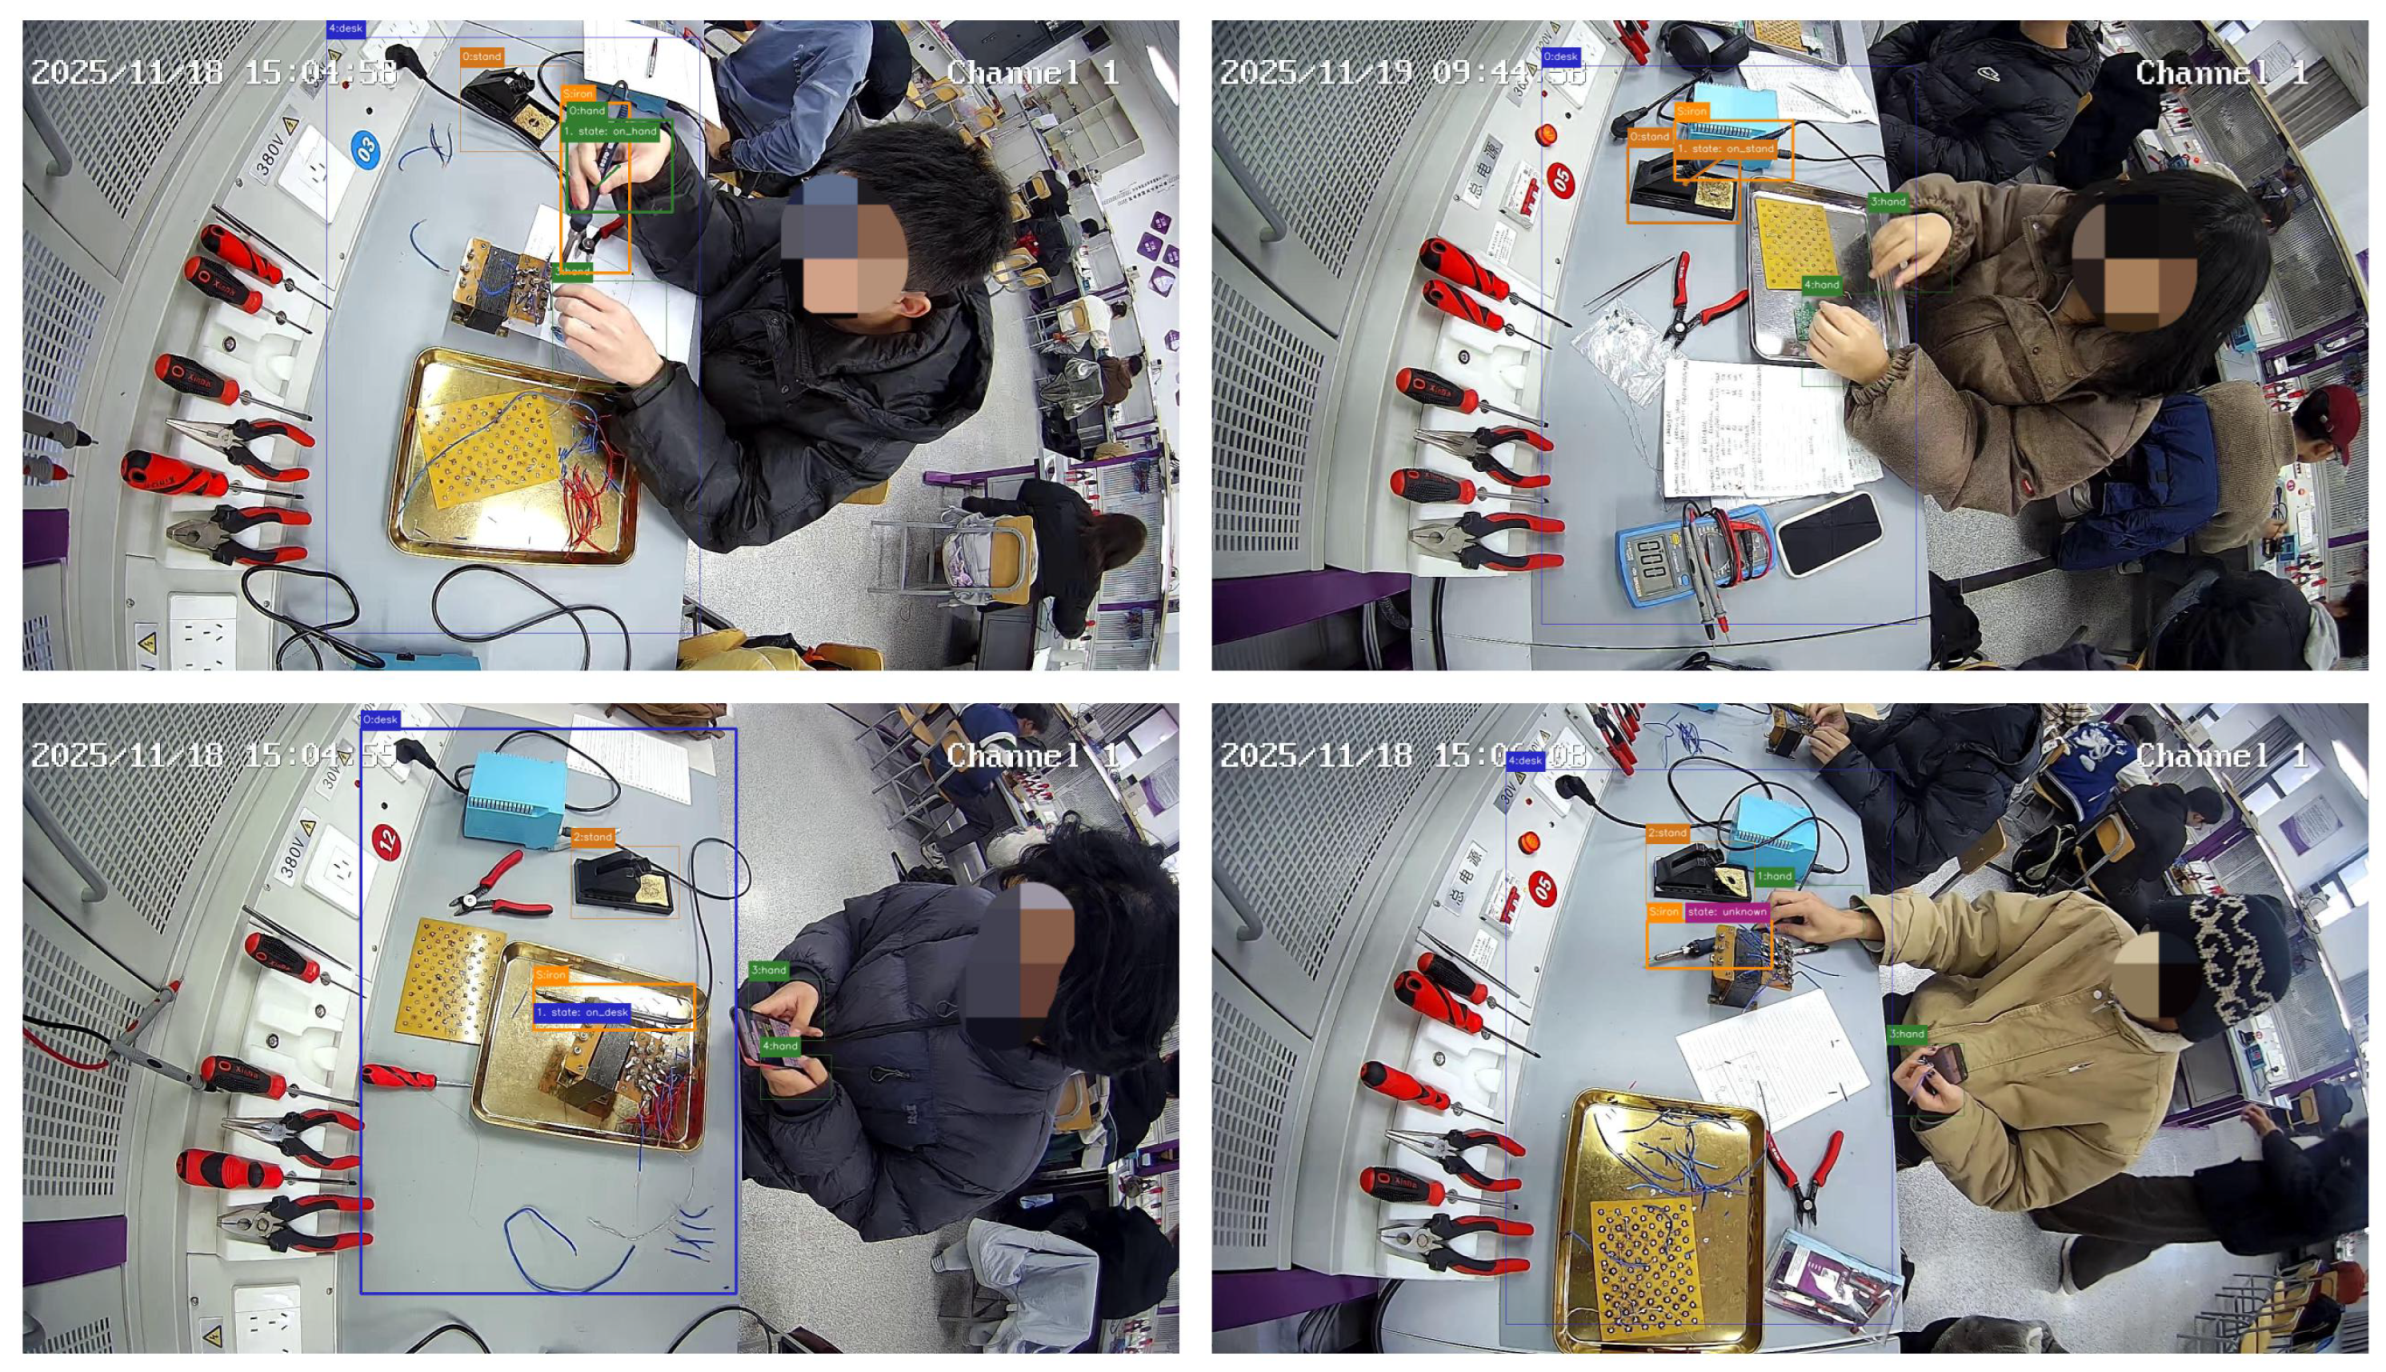
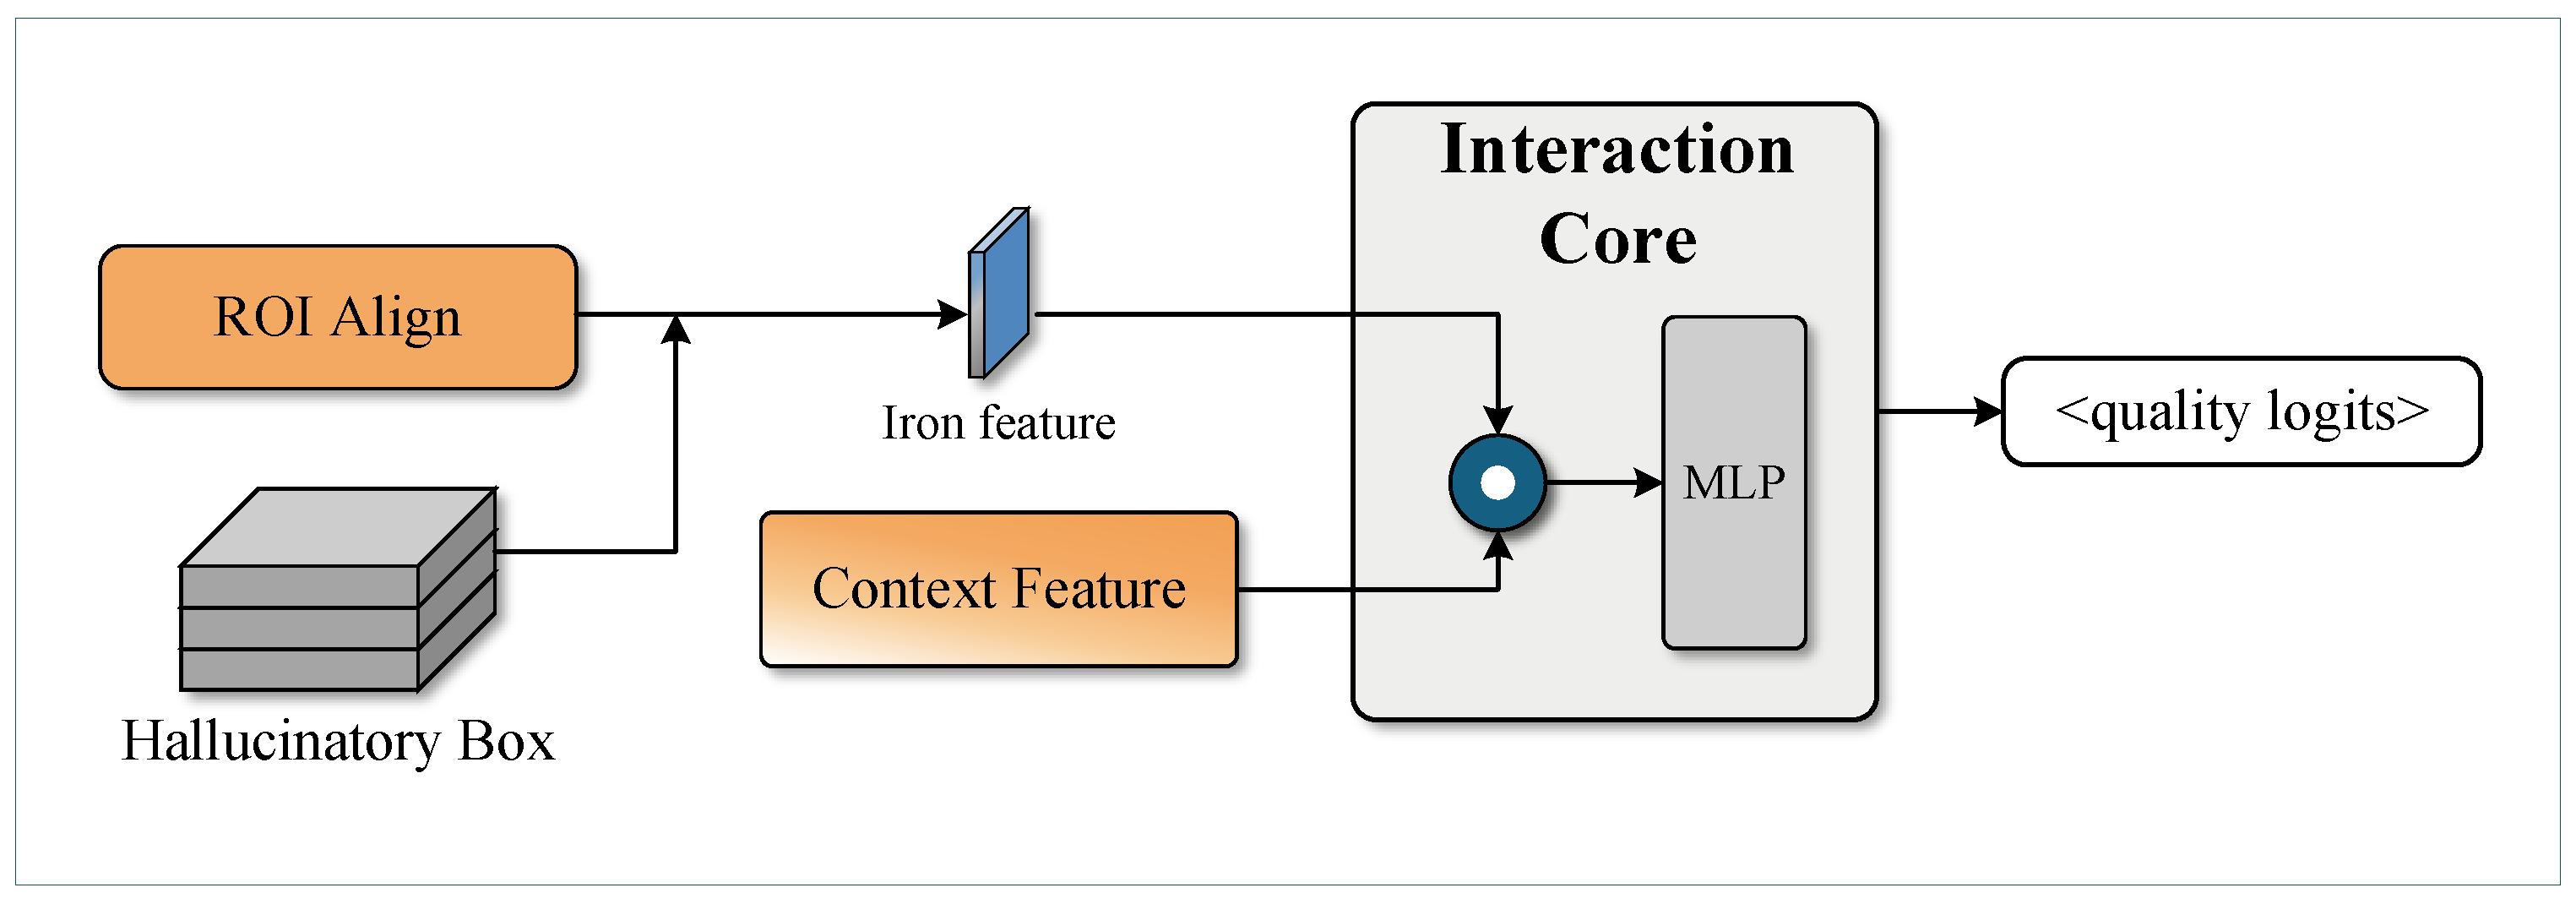
Figure 5 illustrates the annotation structure of SISID-Int. For an explicit interaction, the annotation links the soldering iron subject to the relevant hand, stand, or desk instance and assigns the corresponding state label. When the available candidates do not support a reliable interaction conclusion, the relation is labeled as
unknown. This organization allows Pointer-Head to learn subject–object association and State-Head to learn the corresponding state semantics, while the conservative samples support the rejection behavior of Quality-Head.
Table 1 reports the overall statistics of SISID.
SISID-Det and SISID-Int use the same image split, with 3636 training images and 970 validation images. For entity annotations, this paper adopts the Effective Entity Instances criterion, which counts the four entity categories used in the final experiments: desk, hand, stand, and iron. Under this criterion, the training and validation splits of SISID-Det contain 18,182 and 4910 effective entity instances, respectively. Based on the same images and entities, SISID-Int contains 3758 training and 980 validation relation annotations. SISID-Det supports candidate generation, whereas SISID-Int supports interaction association and state learning over these candidates.
All quantitative results reported in this study are obtained on the SISID validation split. The current dataset organization does not include an independent held-out test split. The validation split is used for model selection, selection of the Quality-Head operating threshold, and final performance reporting. Consequently, the reported results characterize performance under the current SISID evaluation setting and may provide an optimistic estimate of performance on unseen scenes or devices. This evaluation boundary is discussed further in the limitations.
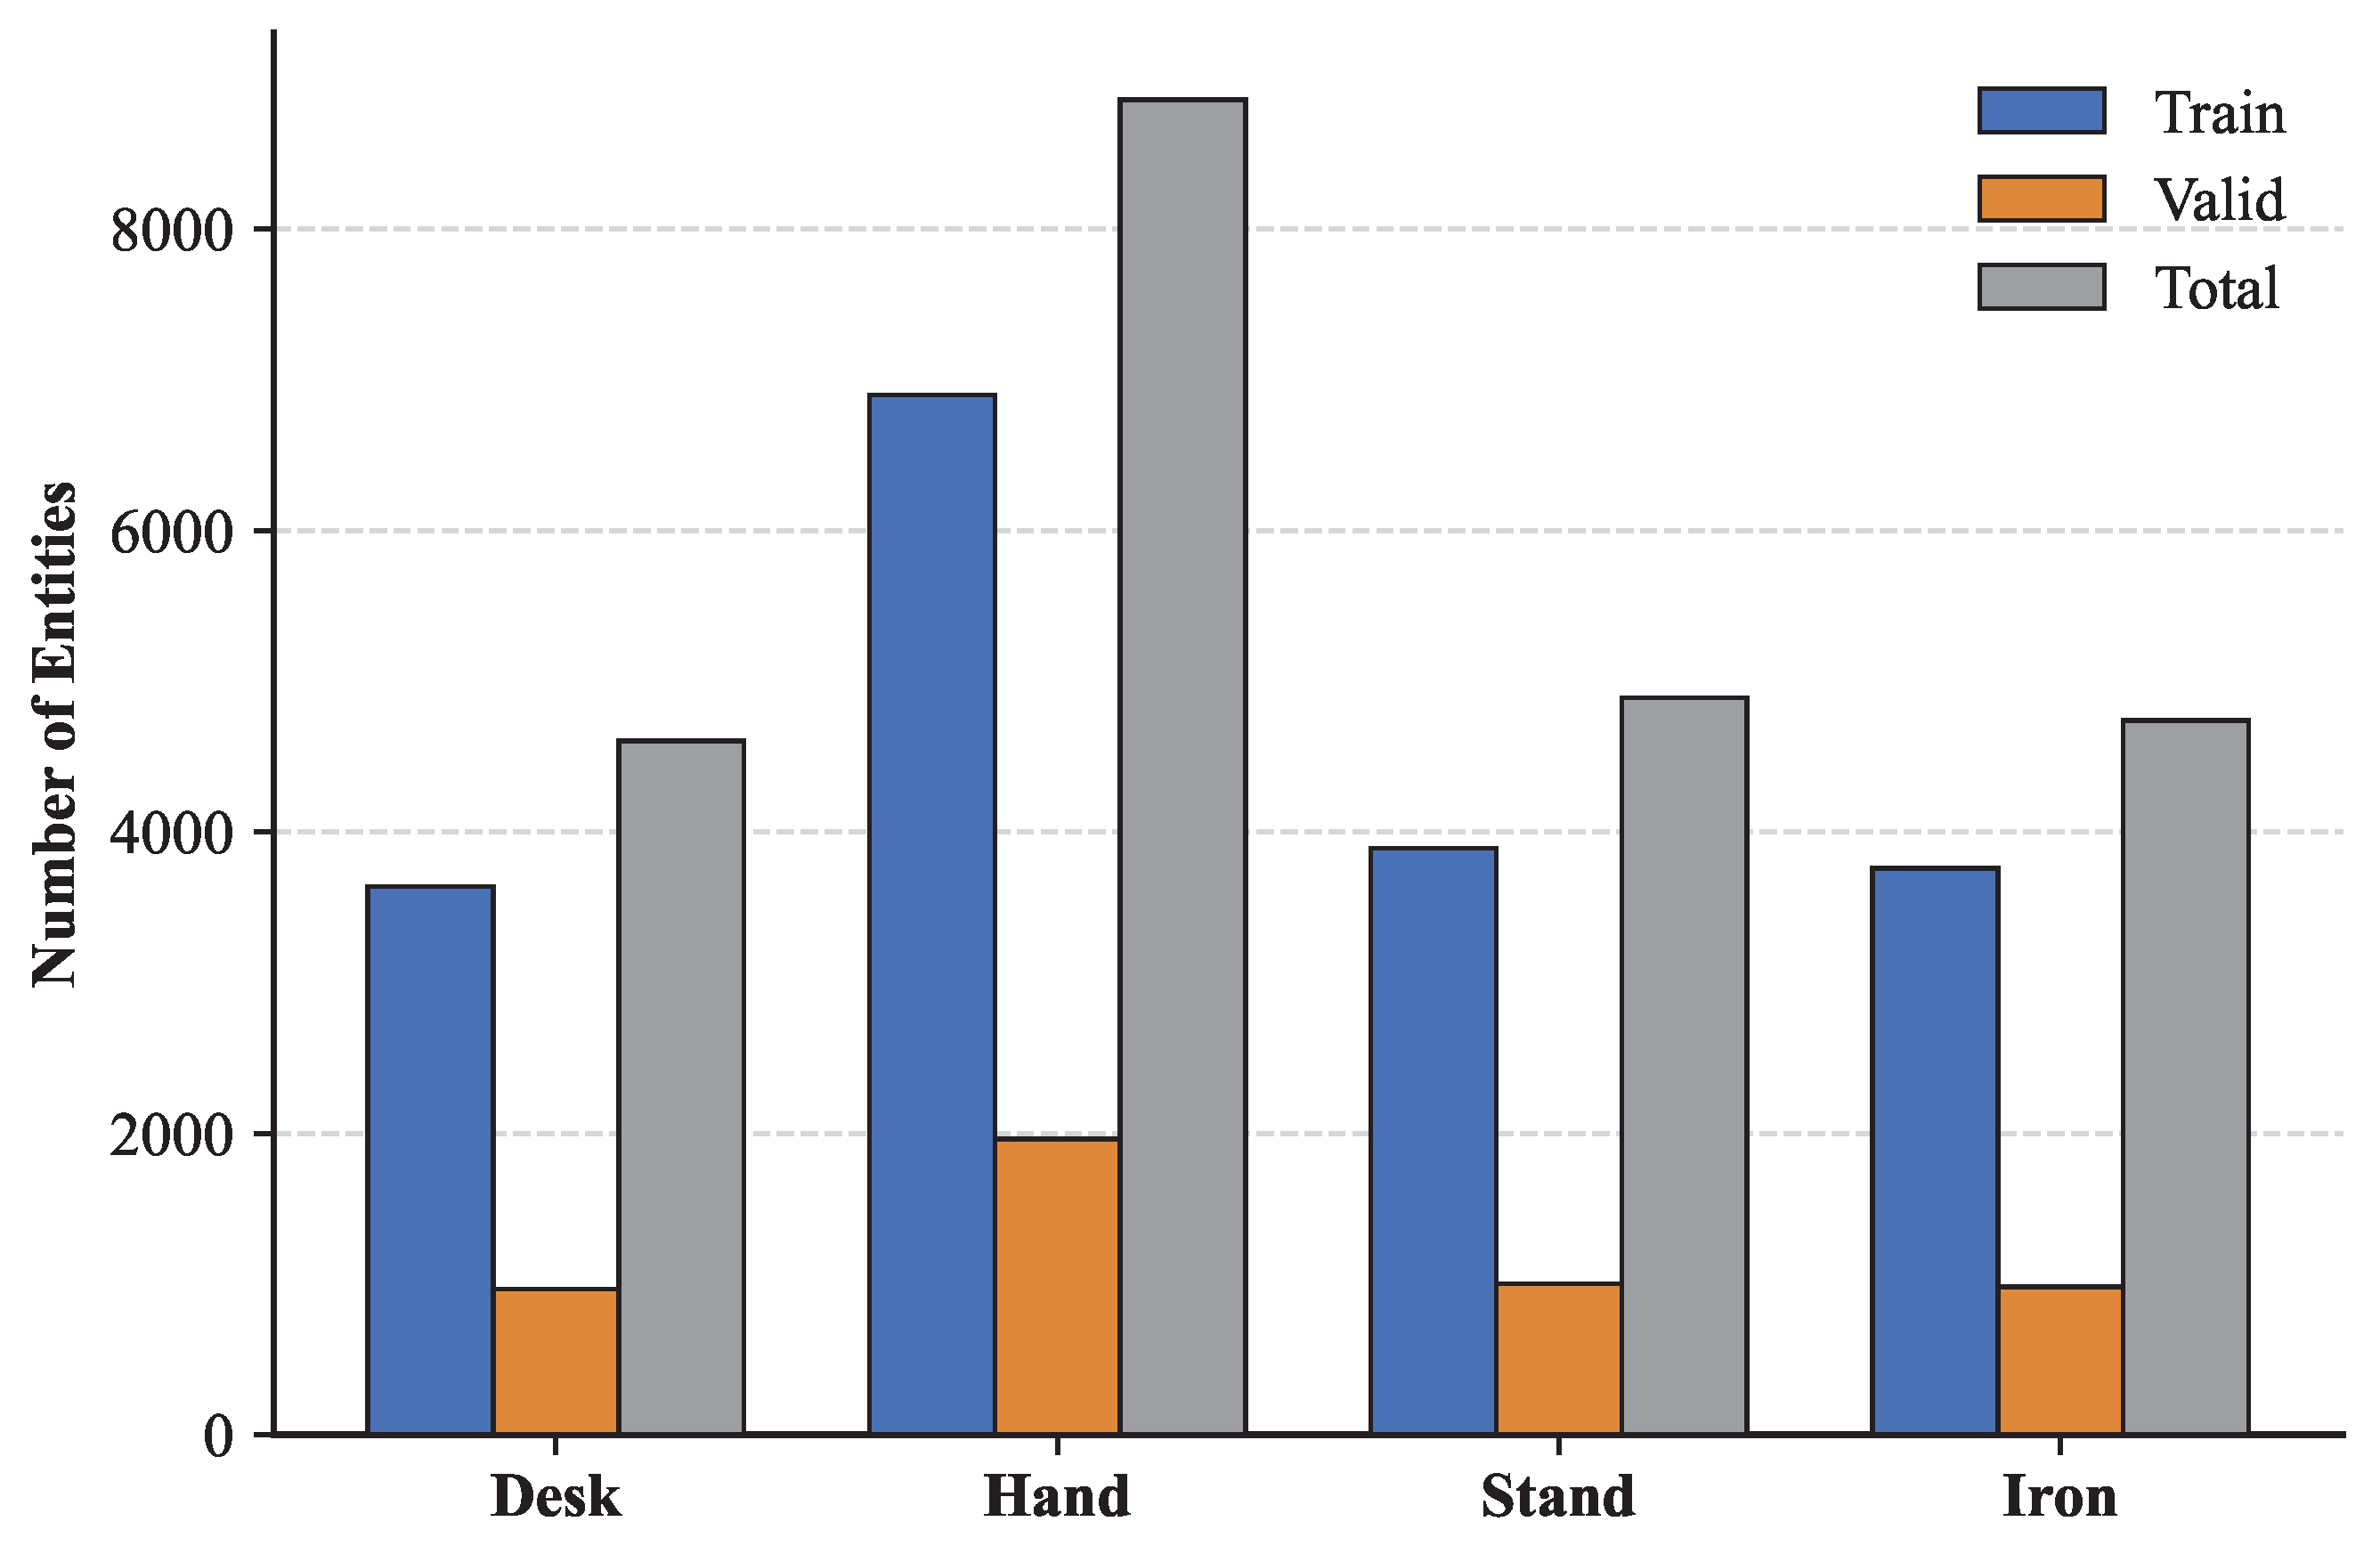
In terms of category distribution,
Figure 6 shows that
hand is the entity category with the largest number of instances, with 8858 instances in total.
The total numbers of
desk,
stand, and
iron instances are 4603, 4891, and 4740, respectively. Overall, the four entity categories are adequately represented and can support the first-stage detector in learning the main interaction objects in training scenarios.
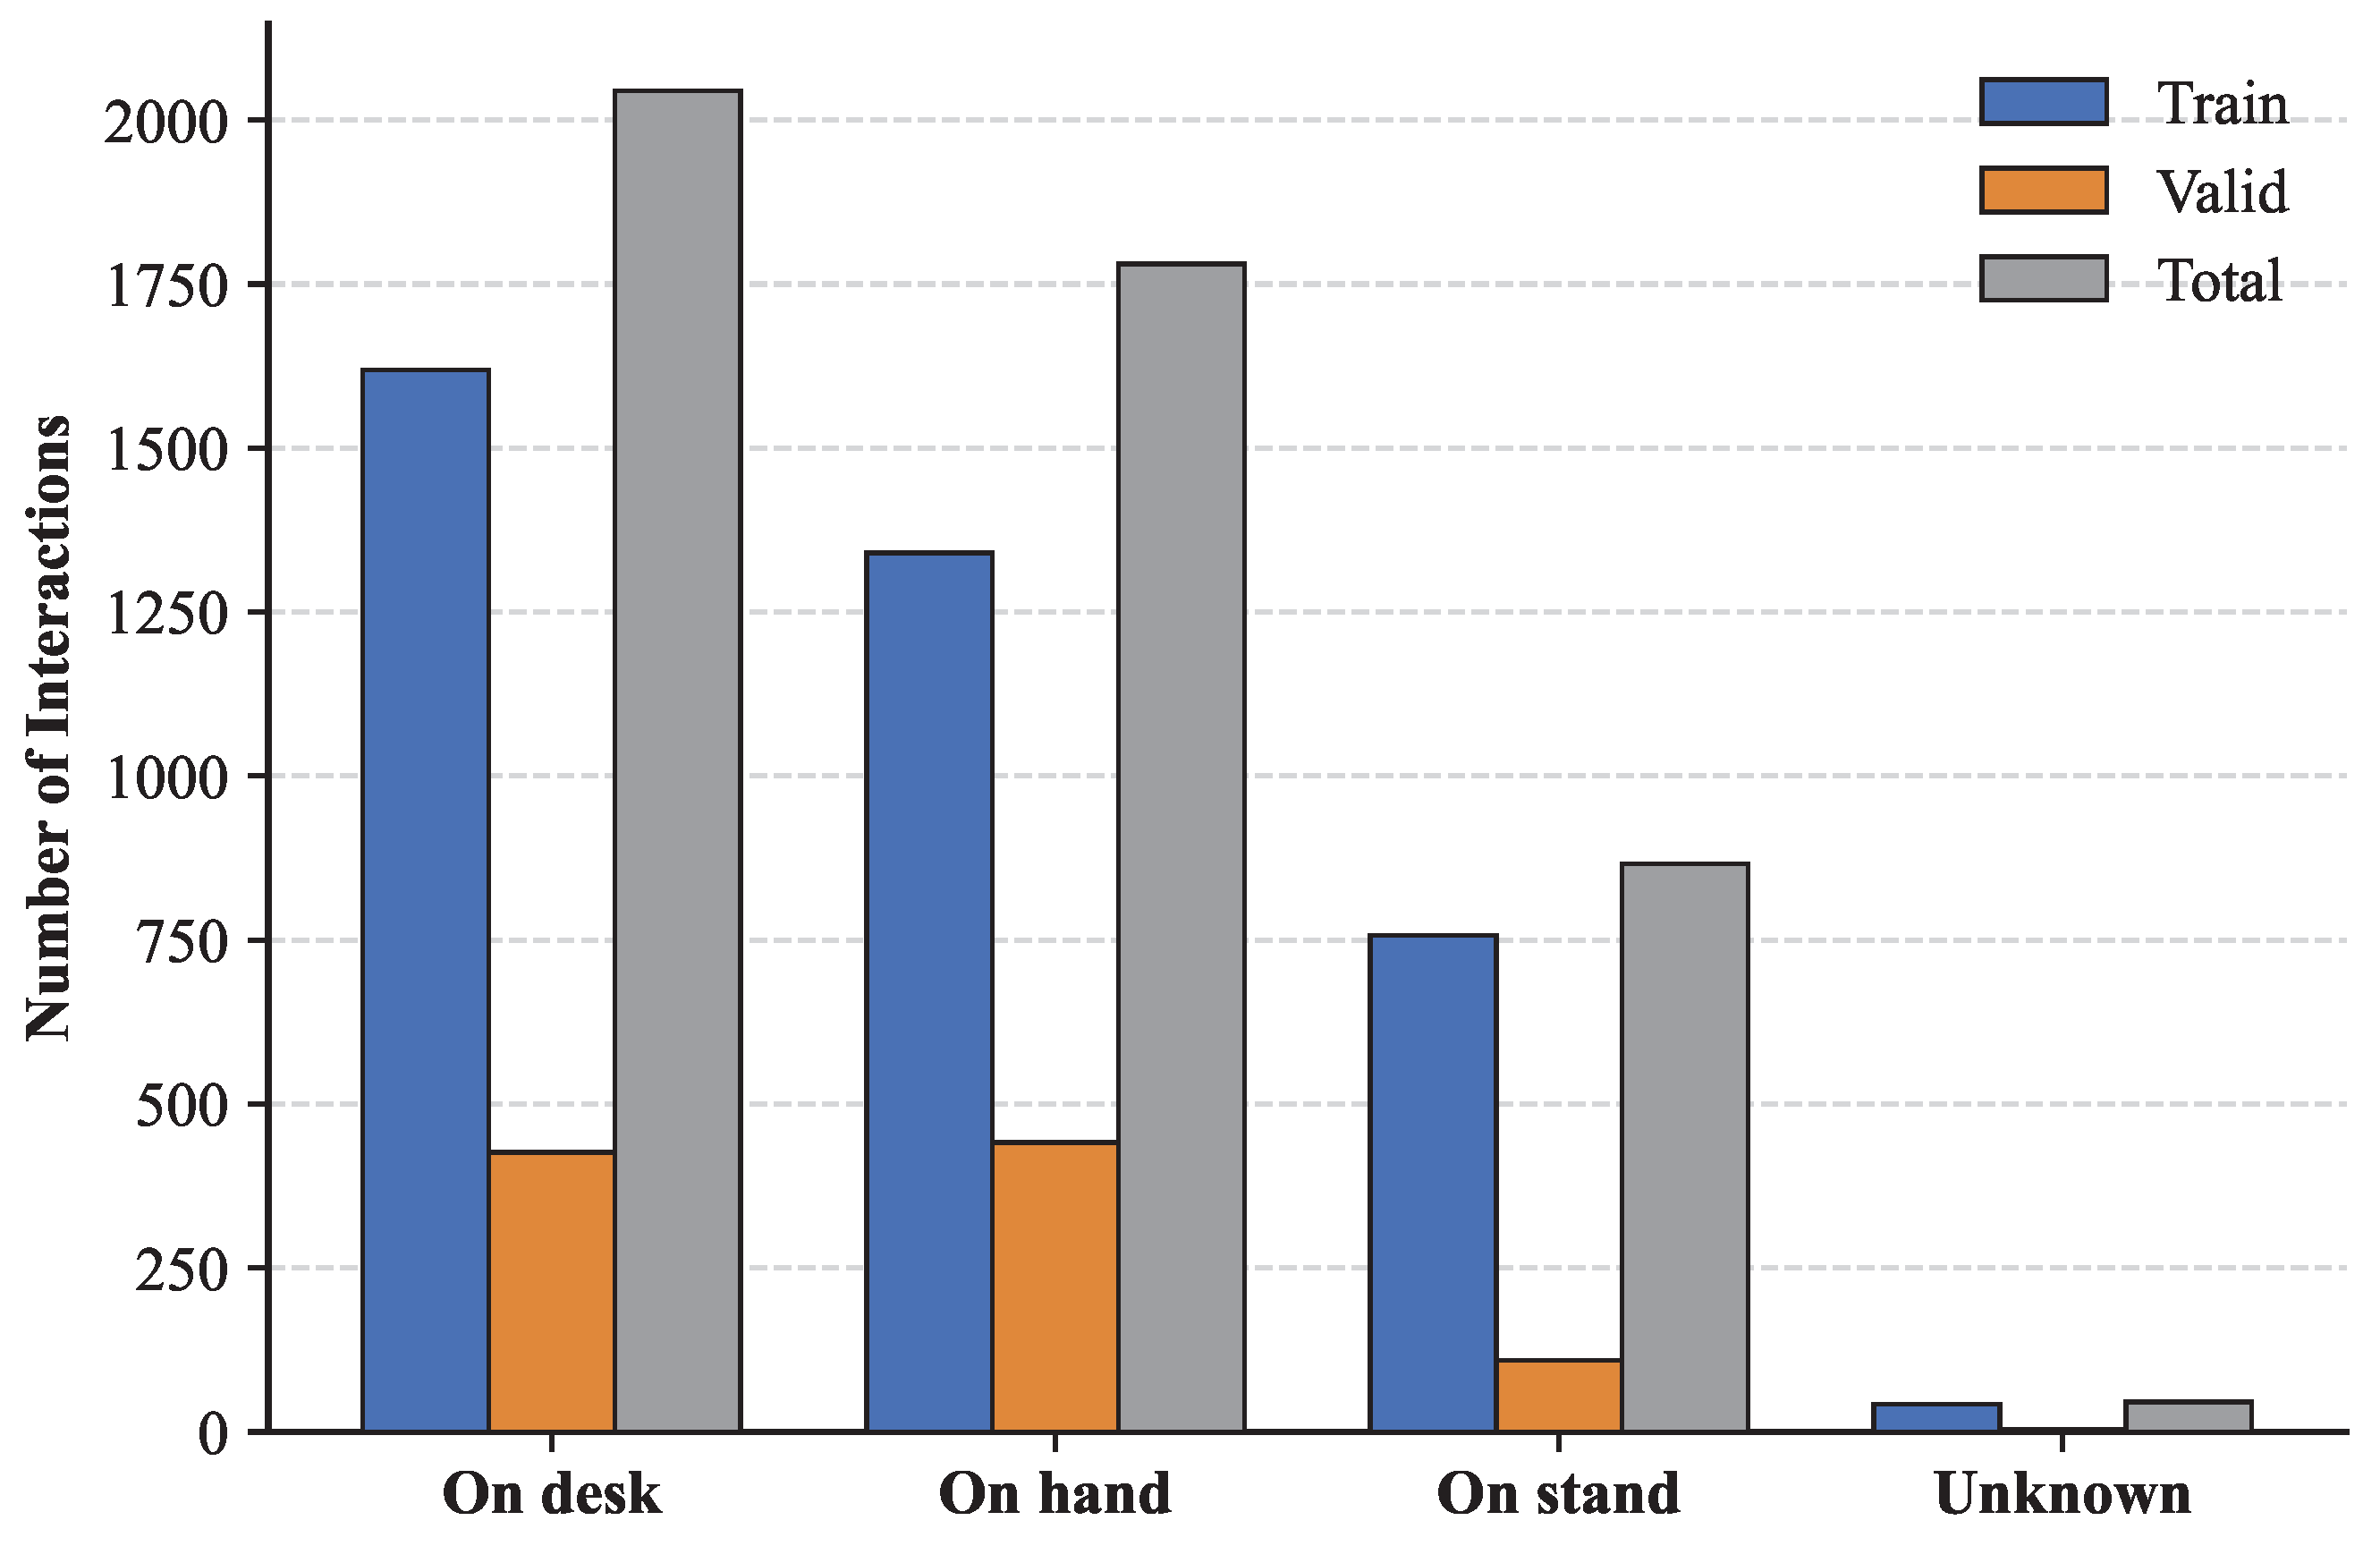
Figure 7 further shows the distribution of state relations in SISID-Int.
Among the relation labels, on_desk has the largest number of annotations, with 2045 instances. on_hand and on_stand contain 1781 and 866 instances, respectively, whereas unknown contains 46 instances. The three explicit operational states form the primary safety-state recognition targets, with on_desk receiving focused analysis because desk exposure is safety-critical. The unknown label has a different functional role: it represents absent, weak, unreliable, or indeterminate interaction evidence and supports conservative filtering.
For evaluation metrics, this paper mainly reports Overall F1, Overall Precision, Overall Recall, and the F1, Precision, and Recall of the key
on_desk state. FPS is also reported as a reference for real-time performance. Let the true positives, false positives, and false negatives in the overall statistics be denoted as
,
, and
, respectively. Overall Precision, Overall Recall, and Overall F1 are defined as follows:
For the key
on_desk state, the same definitions are used, with the statistics limited to predictions and annotations corresponding to the
on_desk class. Let the true positives, false positives, and false negatives for this state be
,
, and
, respectively. The metrics are defined as follows:
For real-time performance, this paper uses frames per second (FPS) as a reference metric. FPS is defined as the number of images for which inference can be completed per unit time:
where
denotes the total number of images for which inference is completed, and
denotes the corresponding total inference time. The comparative experiments follow a validation-set evaluation protocol. RT-DETR, YOLOv10n, YOLOv8l, YOLOv8m, YOLOv8n, and YOLOv8s are trained on SISID-Direct to predict
iron_on_hand,
iron_on_desk, and
iron_on_stand directly. RISNet is trained using SISID-Det and SISID-Int according to its two-stage workflow. All final state detections are evaluated on the corresponding SISID validation images.
4.2. Comparison with Direct State Detection Baselines
Table 2 compares the final safety-state outputs of the direct detectors and RISNet on the SISID validation split. For the direct baselines,
on_desk corresponds to the
iron_on_desk detector category. RISNet obtains the same final state through candidate detection, object association, state prediction, and quality filtering.
RISNet achieves the highest Overall F1 and Precision, reaching 95.38% and 96.73%, respectively, with a Recall of 94.06%. Relative to YOLOv8l, Overall F1 and Precision increase by 1.22 and 4.16 percentage points. RT-DETR provides higher Recall with substantially lower Precision, while YOLOv10n reaches 96.2 FPS with an Overall F1 of 90.30%. RISNet operates at 57.1 FPS and also exceeds the accuracy and speed of YOLOv8l under the reported settings.
Table 3 reports the class-wise breakdown of the same end-to-end predictions used in
Table 2.
RISNet achieves the highest F1 scores for on_hand and on_desk, reaching 94.59% and 95.93%, respectively. Its on_stand F1 is 96.36%, while YOLOv8l and YOLOv8m obtain slightly higher values on this more constrained state. For on_desk, RISNet achieves the highest Precision at 97.80%, which is 6.63 percentage points above YOLOv8l, and improves F1 by 1.96 percentage points with a moderate reduction in Recall. This indicates stronger false-alarm control in cluttered desk scenes.
4.3. Threshold Sensitivity and Validation Robustness
To examine the effect of the Quality-Head decision threshold,
was swept from 0.00 to 1.00 with a step size of 0.01 on the SISID validation split.
Table 4 reports representative operating points from the end-to-end validation evaluation. Increasing
rejects more low-quality interaction conclusions, generally raising Precision while gradually reducing Recall.
Across
–0.90, Overall F1 ranges from 95.05% to 95.38%, a maximum difference of 0.33 percentage points. The selected value
maximizes Overall F1 on the validation split and yields an Overall F1, Precision, and Recall of 95.38%, 96.73%, and 94.06%, respectively; the state-specific F1 values also match
Table 3. As
increases from 0.70 to 0.90, rejected predictions increase from 42 to 62, showing the trade-off between false-alarm control and retained valid predictions. Threshold selection and final reporting use the same validation split, so transfer to unseen data remains unverified.
To examine the stability of the reported results, we evaluated all fixed models on five stratified 320-image subsets resampled from the SISID validation split using fixed random seeds, keeping all model weights, detector settings, and the RISNet quality threshold () unchanged.
As shown in
Table 5, RISNet achieves an Overall F1 of 95.51 ± 0.29% across the five subsets (range: 95.09–95.77%), ranking first in four of five splits with an average margin of 0.64 percentage points over the strongest baseline per split. This indicates limited performance variation within the current validation distribution. As the resampled subsets are drawn from the same validation data used for model and threshold selection, this analysis provides internal robustness evidence rather than independent test-set evidence.
4.4. Ablation Study
Table 6 reports the ablation results for different module combinations and feature fusion strategies.
Dual-layer feature fusion improves all module combinations in
Table 6. Overall F1 increases from 92.18% to 92.94% for State-Head alone, from 92.32% to 93.43% for Pointer-Head with State-Head, and from 93.91% to 95.02% for the three-head configuration with Pointer-Head, State-Head, and Quality-Head. In this three-head configuration,
on_desk F1 also increases from 94.06% to 95.67%. After learnable adaptive weights are further applied to the dual-layer branches, the final RISNet reaches an Overall F1 of 95.38%, an Overall Precision of 96.73%, and an Overall Recall of 94.06%, matching the main comparison result in
Table 2. These gains support the use of shallow detail and deep semantic features for subsequent interaction reasoning.
The intermediate metrics in
Table 7 clarify the contribution of Pointer-Head. Dual-layer fusion raises Object Acc. from 96.30% to 97.14% in the Pointer-Head-only setting, and the joint Pointer-Head and State-Head configuration reaches a Triplet Acc. of 97.46%. Pointer-Head therefore provides the association basis for state discrimination, while Quality-Head supplies the subsequent false-alarm control.
State-Head reaches State Acc. values of 96.72% and 97.46% with single-layer and dual-layer features, respectively. Its combination with Pointer-Head links state prediction to the selected interaction context, as reflected by the higher Triplet Acc. under dual-layer fusion.
Quality-Head provides the largest direct gain in false-alarm control. Under dual-layer fusion, adding it to Pointer-Head and State-Head raises Overall Precision from 92.13% to 96.32% and on_desk Precision from 88.99% to 98.03%. Overall Recall decreases from 94.77% to 93.75%, and on_desk Recall decreases from 94.84% to 93.43%. The resulting Precision–Recall trade-off is consistent with conservative filtering of low-quality interactions.
4.5. Error Source Analysis
To quantify the sensitivity of RISNet to initial detection errors, we first evaluated the stage-1 detector on the 970-image SISID validation split. The detector achieves an overall Precision of 96.35%, Recall of 94.60%, AP50 of 97.80%, and mAP50–95 of 76.38%. For the soldering iron class, the corresponding values are 95.16%, 92.17%, 96.44%, and 65.47%, respectively. The following diagnostics use online YOLO predictions with the same deployed inference settings and reproduce the standard end-to-end result.
Table 8 reports controlled staged diagnostics. An oracle setting uses ground-truth annotations to replace or verify a designated intermediate decision while retaining the remaining inference pipeline. Because candidate geometry, Pointer-Head context, State-Head predictions, and Quality-Head scores are coupled, differences between rows describe the response of the complete pipeline to each intervention and do not represent isolated module contributions.
Bypassing Quality-Head increases Recall from 94.06% to 95.08%, while Precision decreases from 96.73% to 92.61% and F1 decreases to 93.83%. The bypass retains low-quality and hallucinated interactions that would otherwise be rejected, so the additional false positives outweigh the recovered true positives. The oracle quality decision reaches 100.00% Precision and 97.48% F1, indicating the potential value of improved reliability estimation under the current candidate and state predictions.
For a more direct account of error propagation, each final error was assigned to the earliest stage at which the correct relation became unavailable.
Table 9 reports this mutually exclusive first-failure attribution for all 58 FN and 31 FP.
Soldering iron subject misses account for 56.90% of final FN and form the largest single error source. Including two context misses, upstream entity detection contributes 60.34% of FN, showing that missing candidates remain unrecoverable despite the high detector AP50. Replacing detected entities with ground-truth entities while retaining the normal downstream pipeline changes Overall F1 from 95.38% to 95.80%, an increase of 0.42 percentage points. This modest net change reflects coupled Precision and Recall effects, while the attribution result identifies subject availability as the dominant source of unrecoverable misses.
Pointer association errors account for 22.41% of FN, and Quality-Head false rejection after a correct raw state accounts for 17.24%. The zero count for exclusive state errors does not imply error-free state prediction: 15 raw-state errors occur in the non-exclusive stage diagnostics, with 13 overlapping earlier association errors and two overlapping context detection misses. They are therefore assigned to those earlier failures in
Table 9. Among FP, hallucinated soldering iron subjects account for 54.84%, and association errors account for the remaining 45.16%. These findings identify two complementary priorities for further improvement: increasing soldering iron recall while preserving false-alarm control and improving association robustness for detected subjects.
4.6. Computational Complexity and Deployment Considerations
Table 10 reports the module-level parameter count, arithmetic cost, and measured latency of RISNet. Profiling was conducted on the 970-image SISID validation split with an image size of 640 and batch size 1. The reported arithmetic cost and latency therefore reflect the observed candidate distribution under the end-to-end evaluation setting.
The interaction stage adds 5.496M parameters and accounts for approximately 33.1% of the complete model parameters. Feature Fusion contains 4.950M of these parameters and is the main source of parameter growth. The countable arithmetic cost of the interaction stage is 0.0569 GFLOPs/image, compared with 28.4441 GFLOPs/image for the YOLO detector. Its measured latency remains substantial because ROIAlign, candidate preparation, and Pointer-Head process a variable candidate set. Pointer-Head is the largest second-stage latency component at 5.91 ms/image.
The strict end-to-end timing used for the main comparison gives 9.49 ms/image for YOLO and 8.01 ms/image for the interaction stage, for a total of 17.51 ms/image or 57.1 FPS. The instrumented profile in
Table 10 gives 18.37 ms/image or 54.4 FPS. The 0.86 ms/image difference arises from runtime variation and the finer timing boundaries introduced by module-level instrumentation. The strict end-to-end value of 57.1 FPS remains the main speed result, while the instrumented measurement is used to locate internal costs. Both measurements satisfy the processing requirement of the centralized single-frame polling setting considered in this work.
The added computation brings measurable gains in state recognition and false-alarm control. Relative to YOLOv8l, RISNet improves Overall F1 by 1.22 percentage points and on_desk Precision by 6.63 percentage points, while still running at 57.1 FPS. Relative to YOLOv8n, RISNet achieves higher accuracy at the cost of reduced speed. Together with the Quality-Head ablation, these results show the accuracy–efficiency trade-off introduced by relation modeling and reliability filtering.
The current deployment evidence is limited to centralized inference on an RTX 3060. Practical lightweight paths for resource-constrained deployment include reducing the hidden dimension of Feature Fusion, limiting the number of candidates processed by Pointer-Head, sharing projection layers, applying structured pruning or knowledge distillation, and using FP16/INT8 inference with an optimized runtime such as TensorRT. These options define a concrete deployment direction without changing the task formulation or the reliability-filtering objective.
4.7. Qualitative Analysis
Figure 8 shows representative false positives produced by RT-DETR in cluttered training scenes.
In the upper-left panel, a black pen is labeled as on_desk, and the small visible tail of a soldering iron is labeled as on_stand. The other panels show clothing folds, a chair, a phone-holding hand, and the edge of a stationery bag being interpreted as soldering iron states. These cases illustrate the sensitivity of direct state detection to elongated shapes, local edges, and background structures.
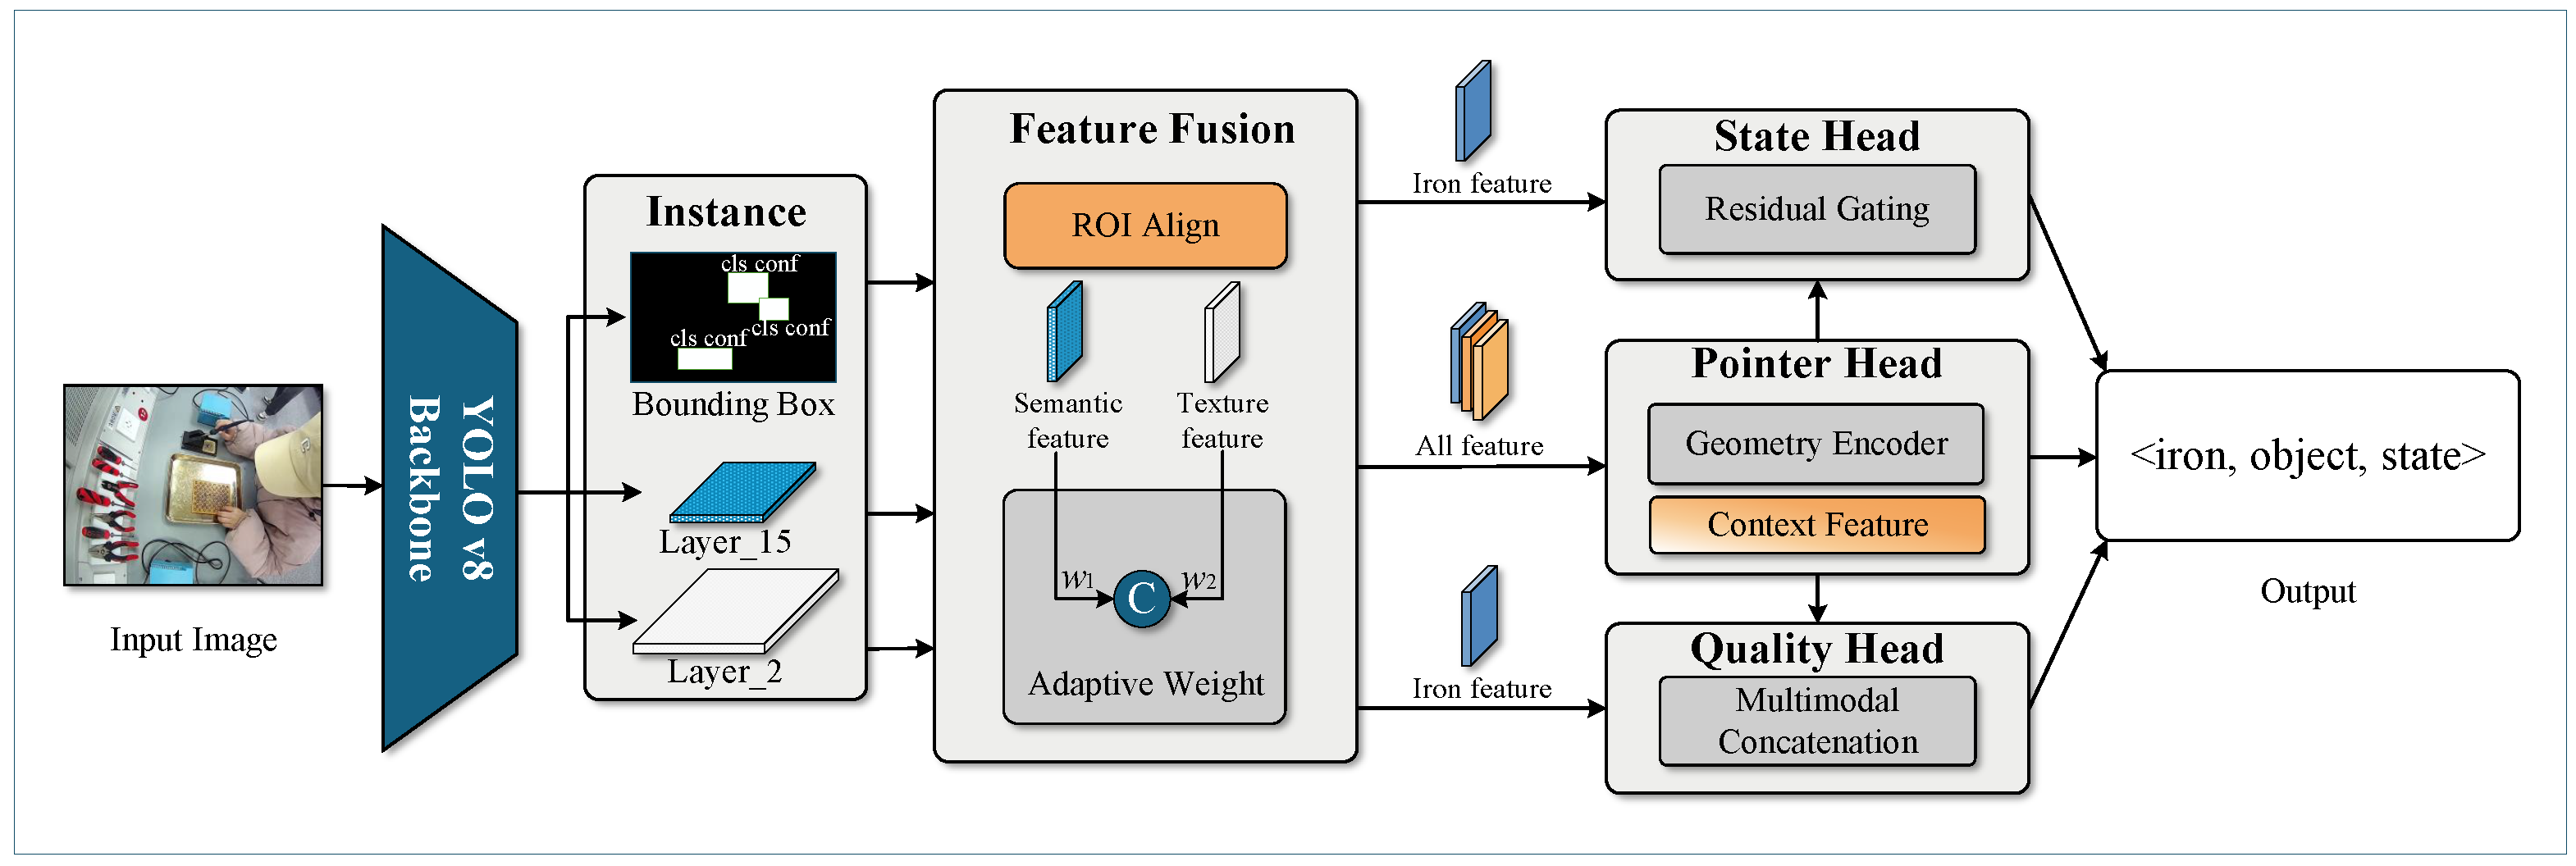
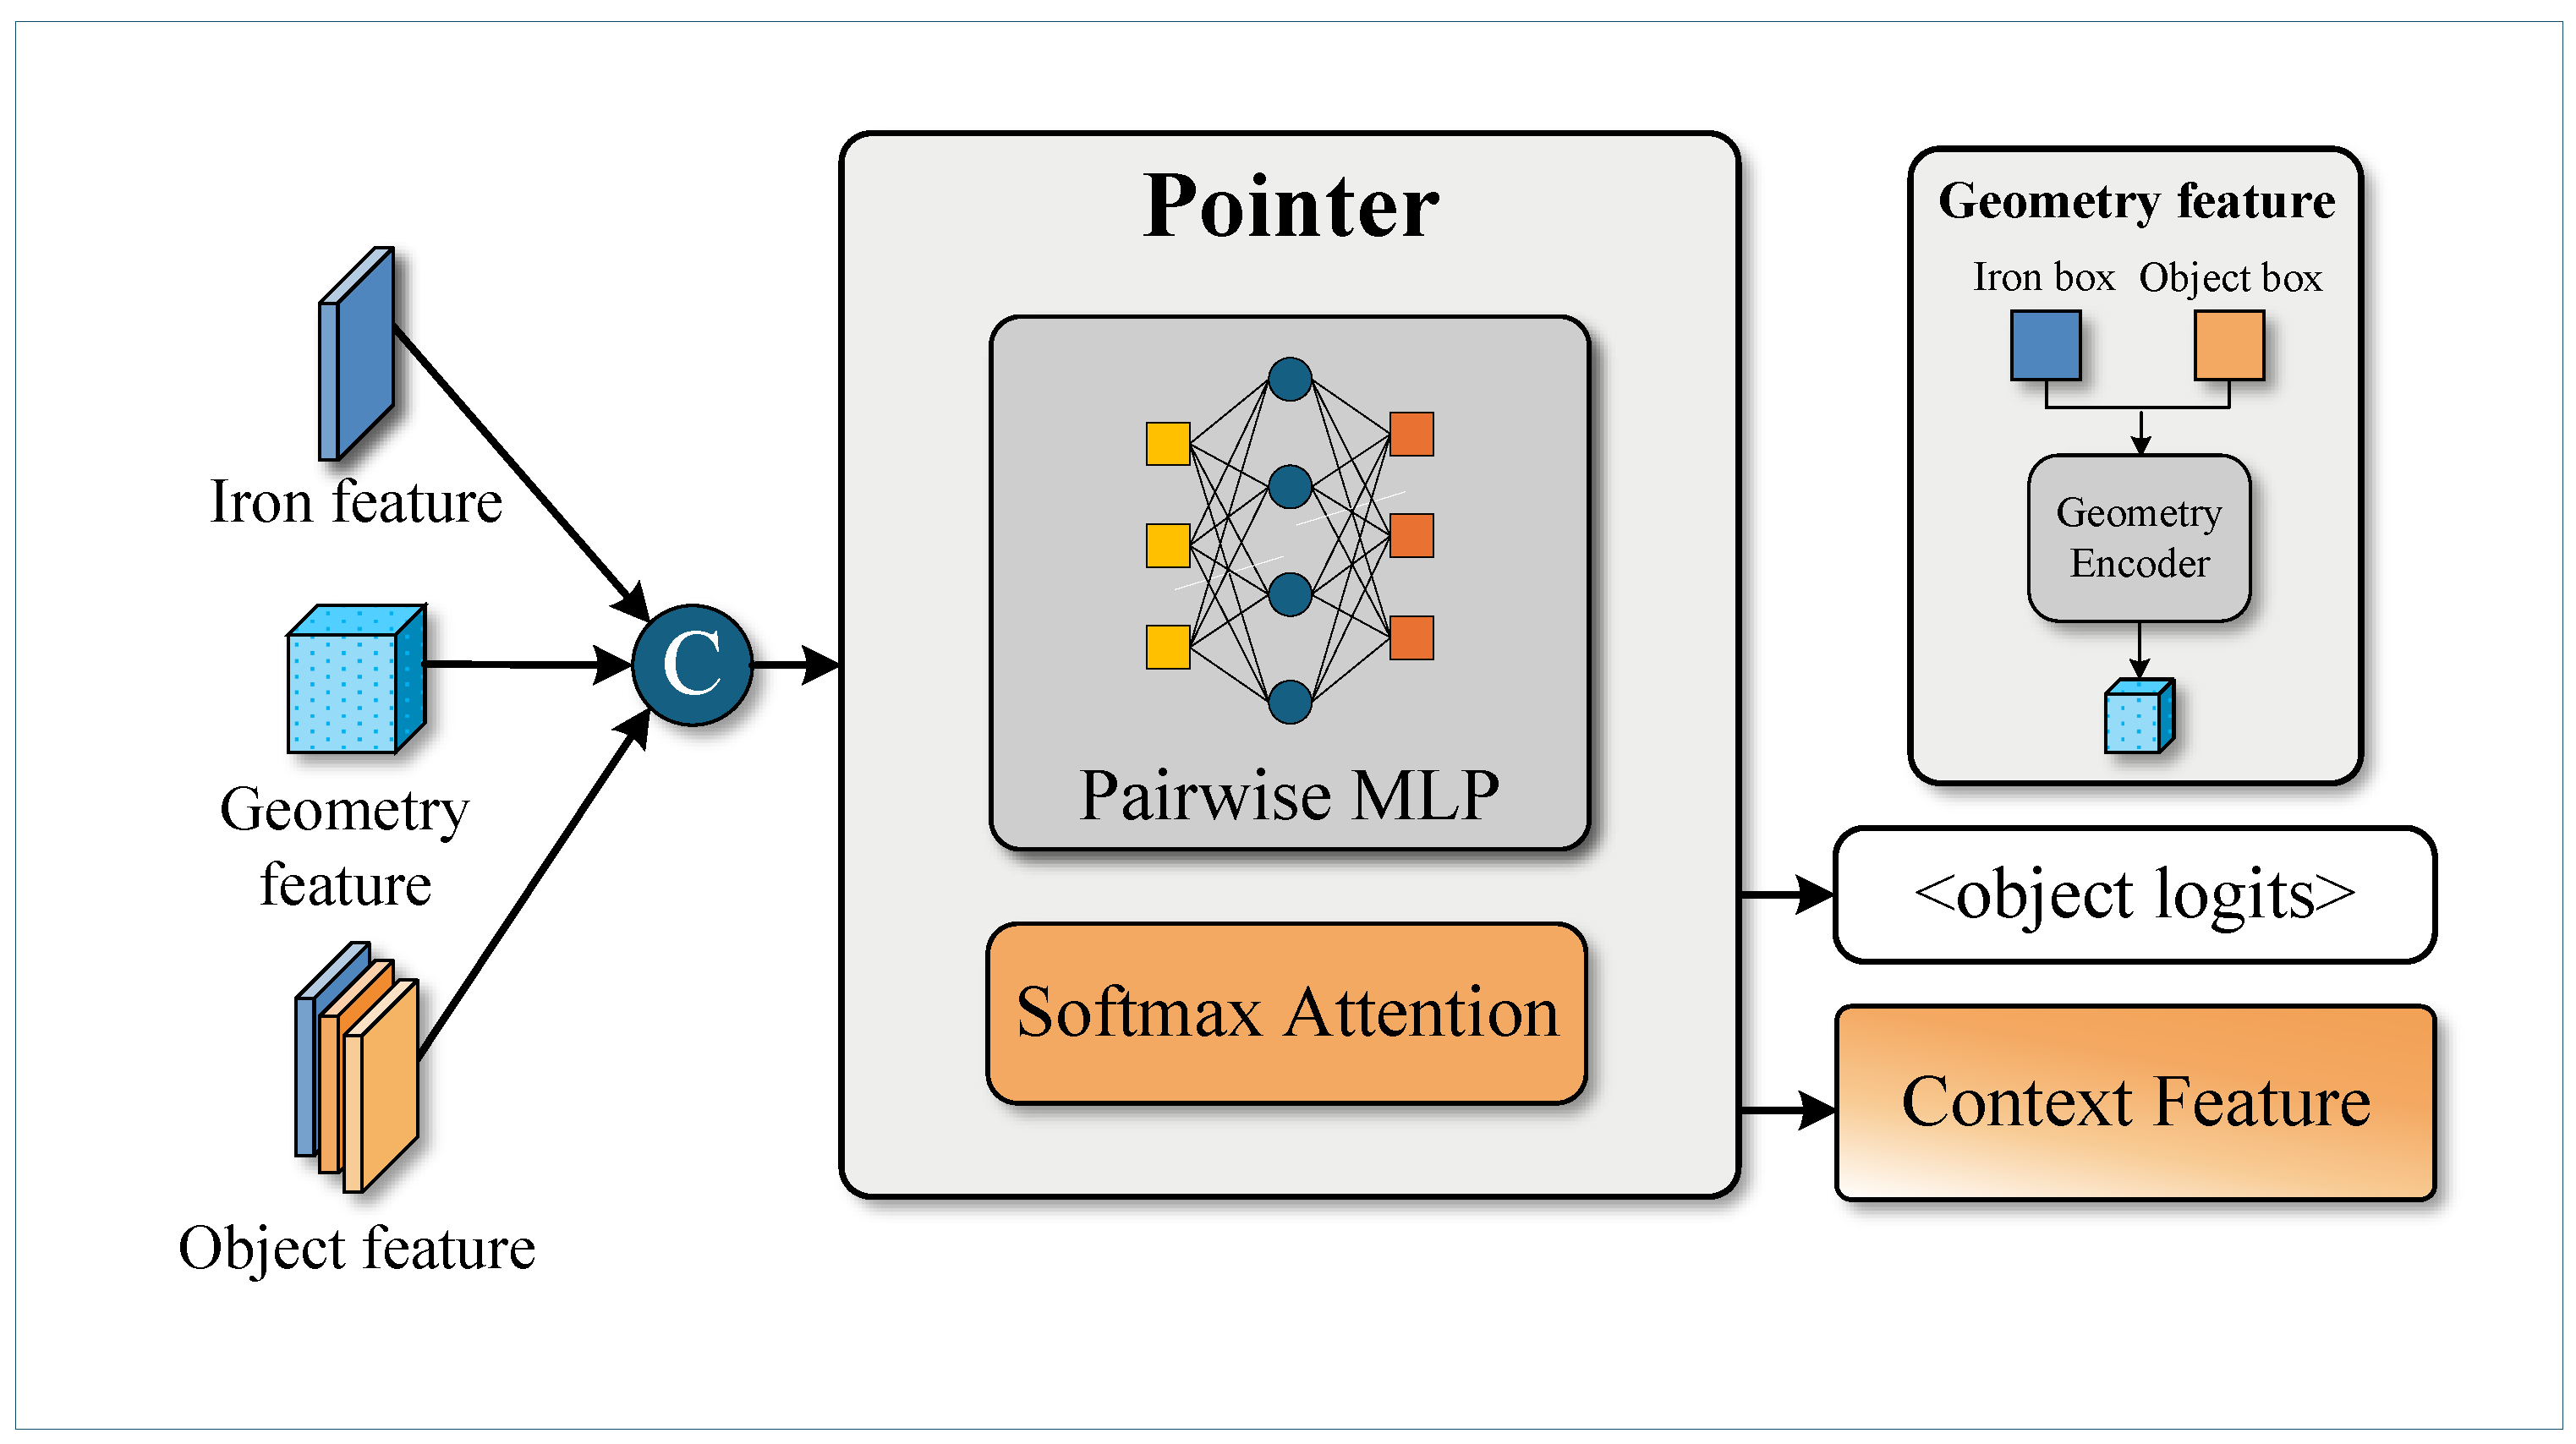
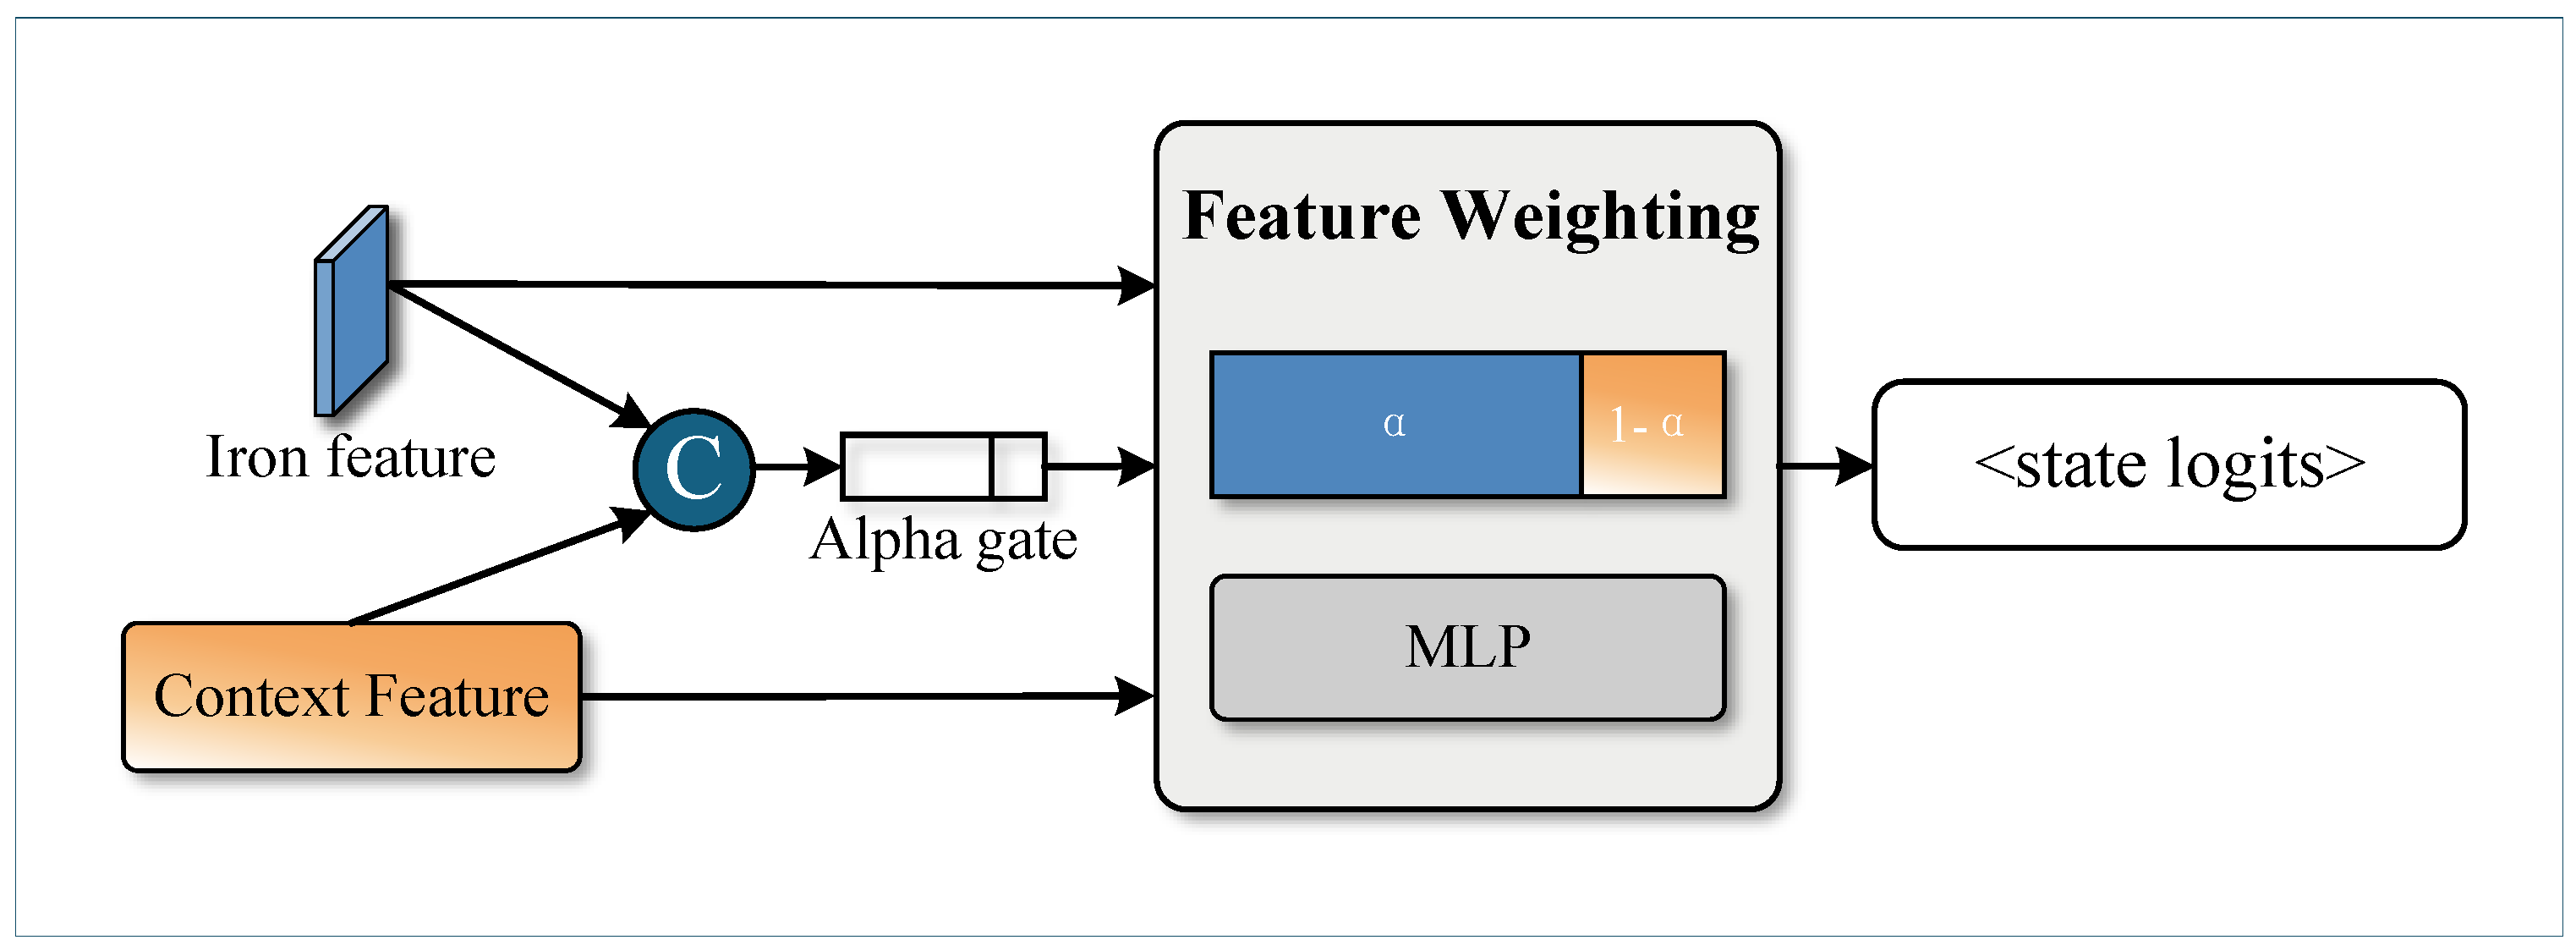
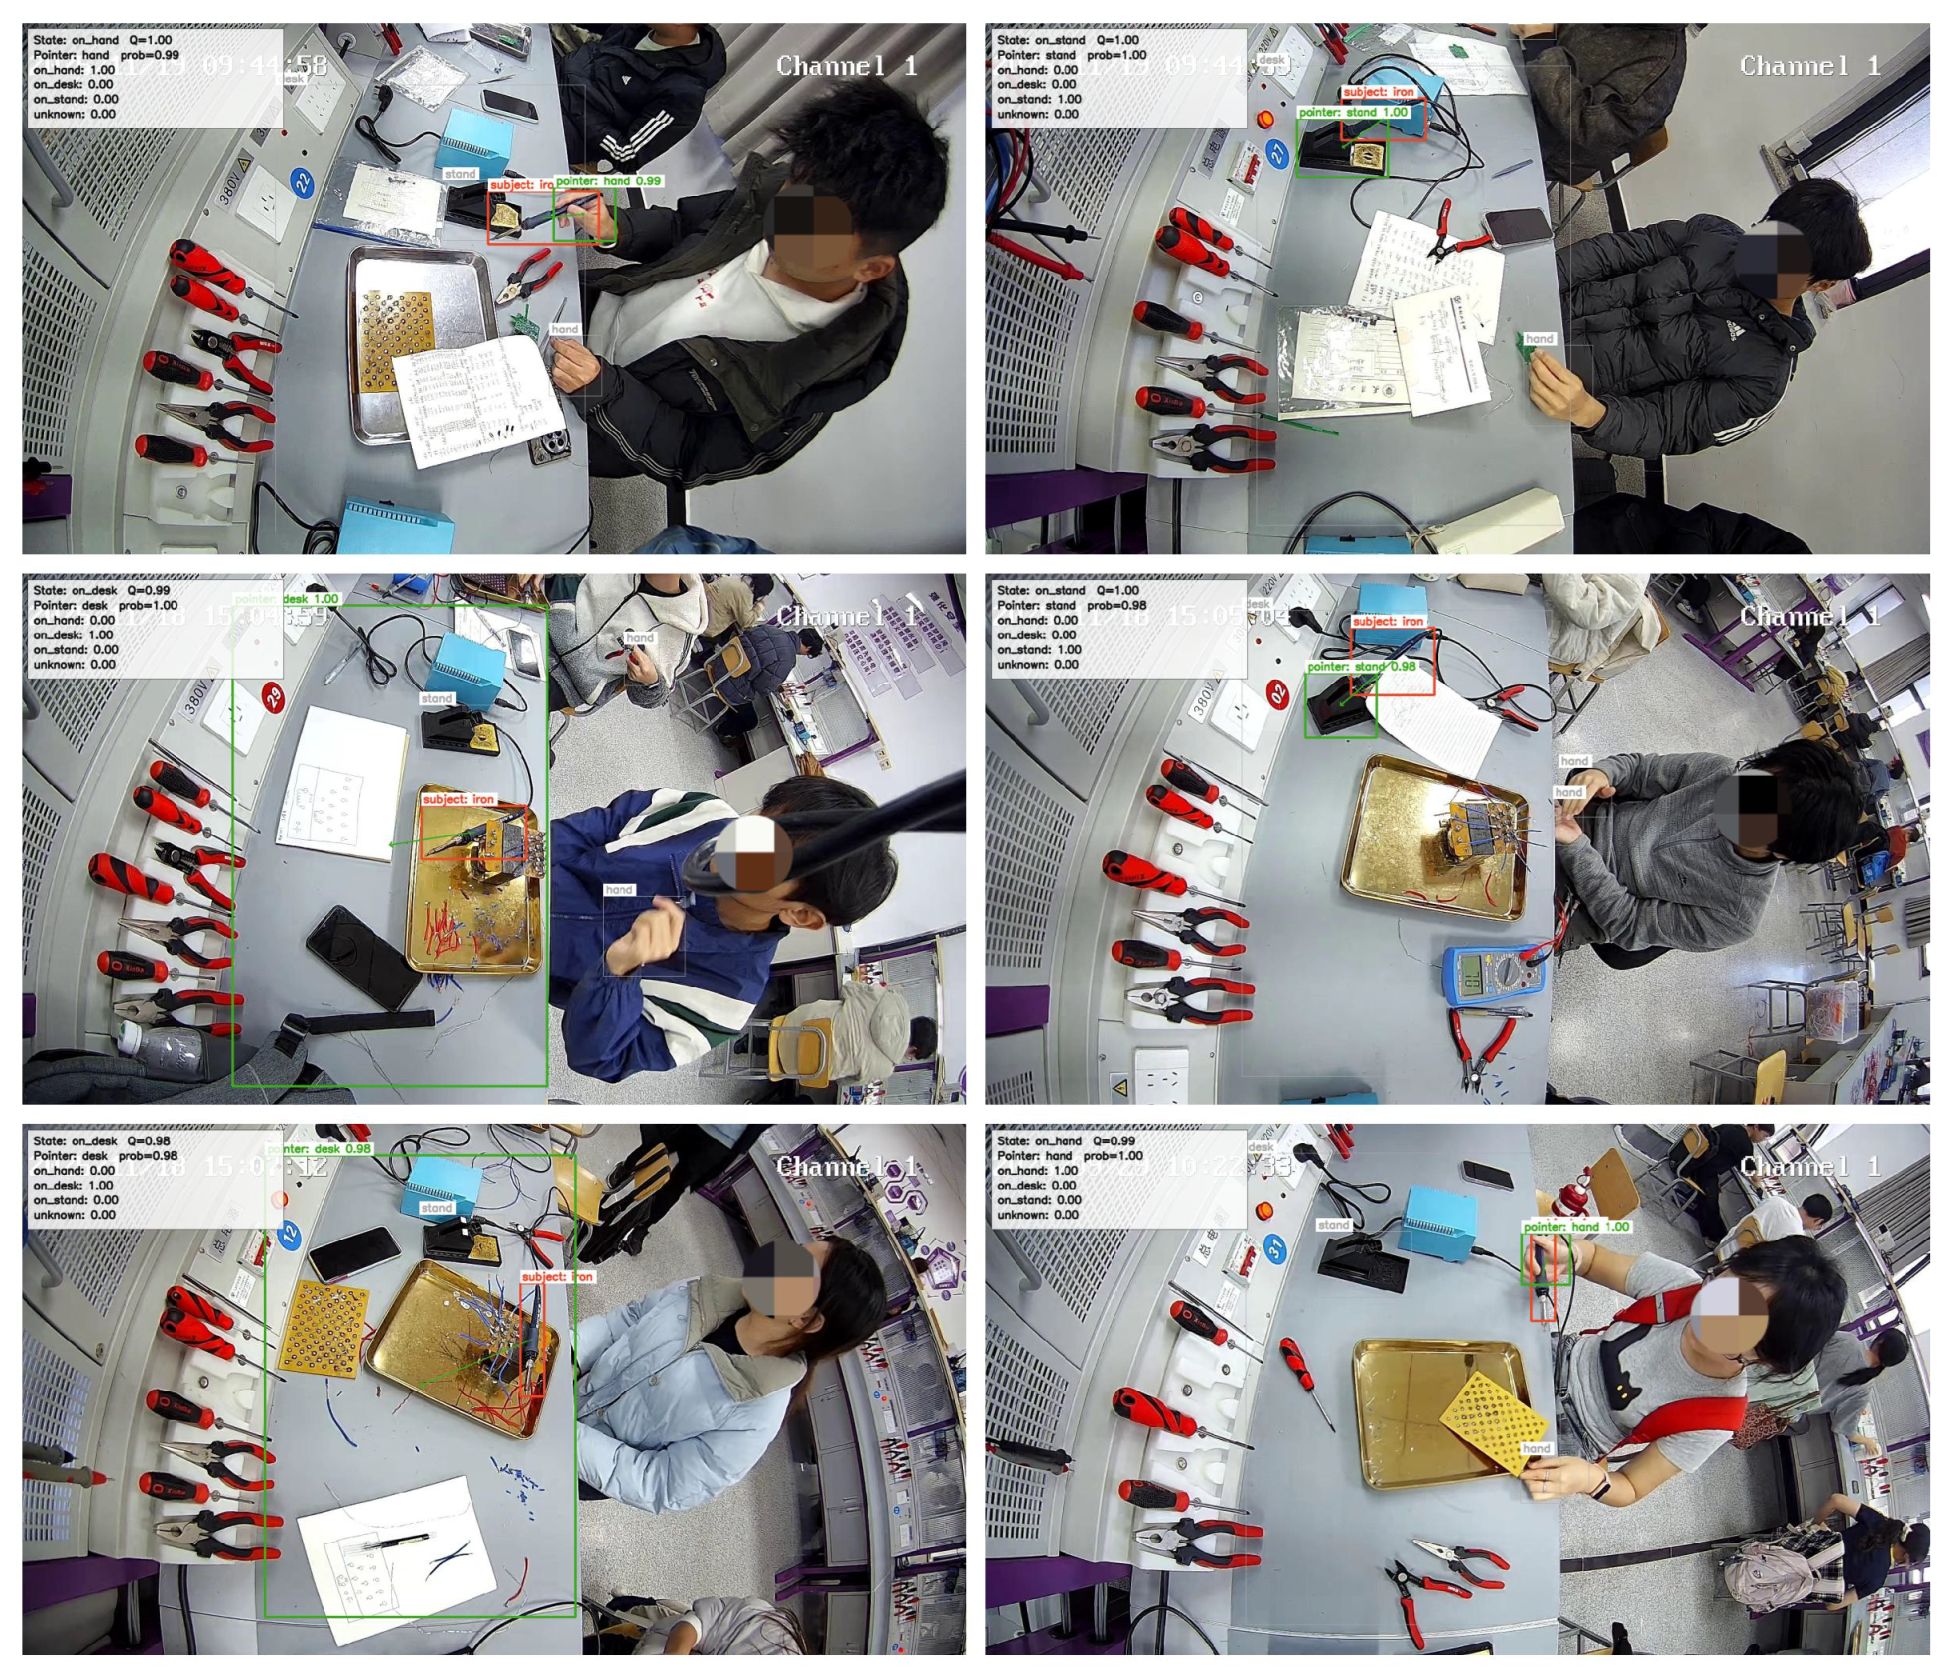
Figure 9 presents representative correct predictions together with the intermediate outputs of Pointer-Head, State-Head, and Quality-Head. Each panel displays the selected environmental object, pointer probability, state distribution, and reliability score. The examples show that the selected hand, stand, or desk provides context for the corresponding state decision and makes the module sequence directly observable.
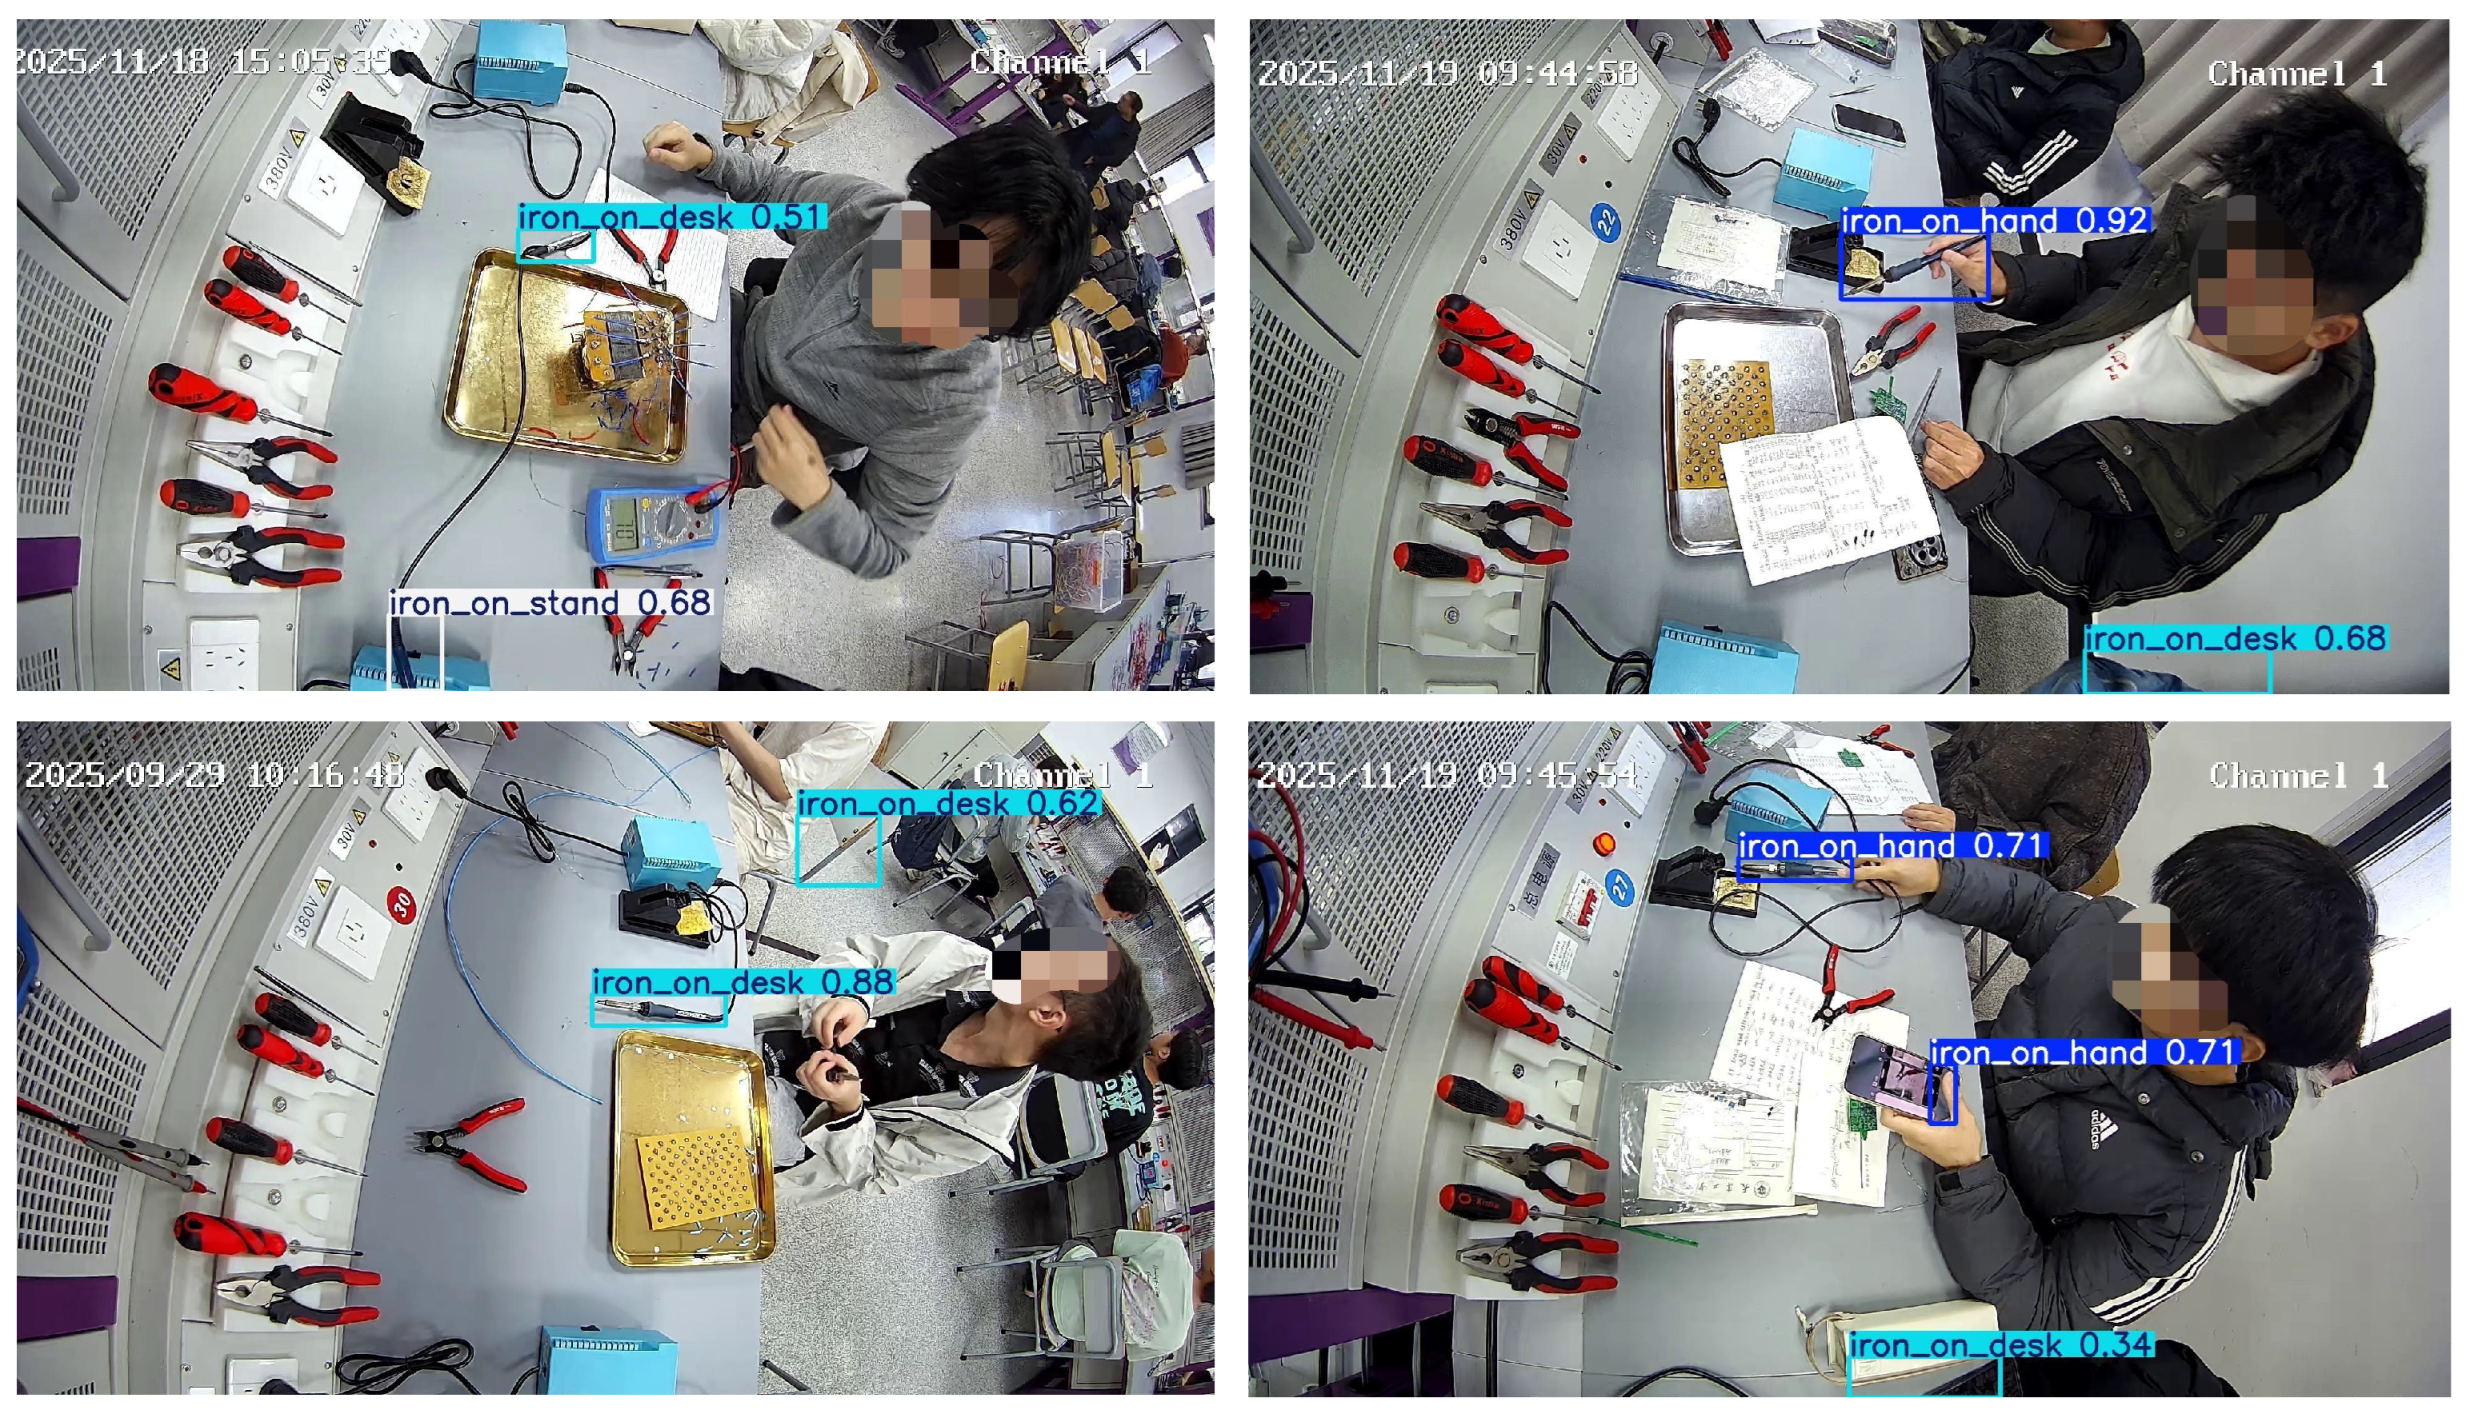
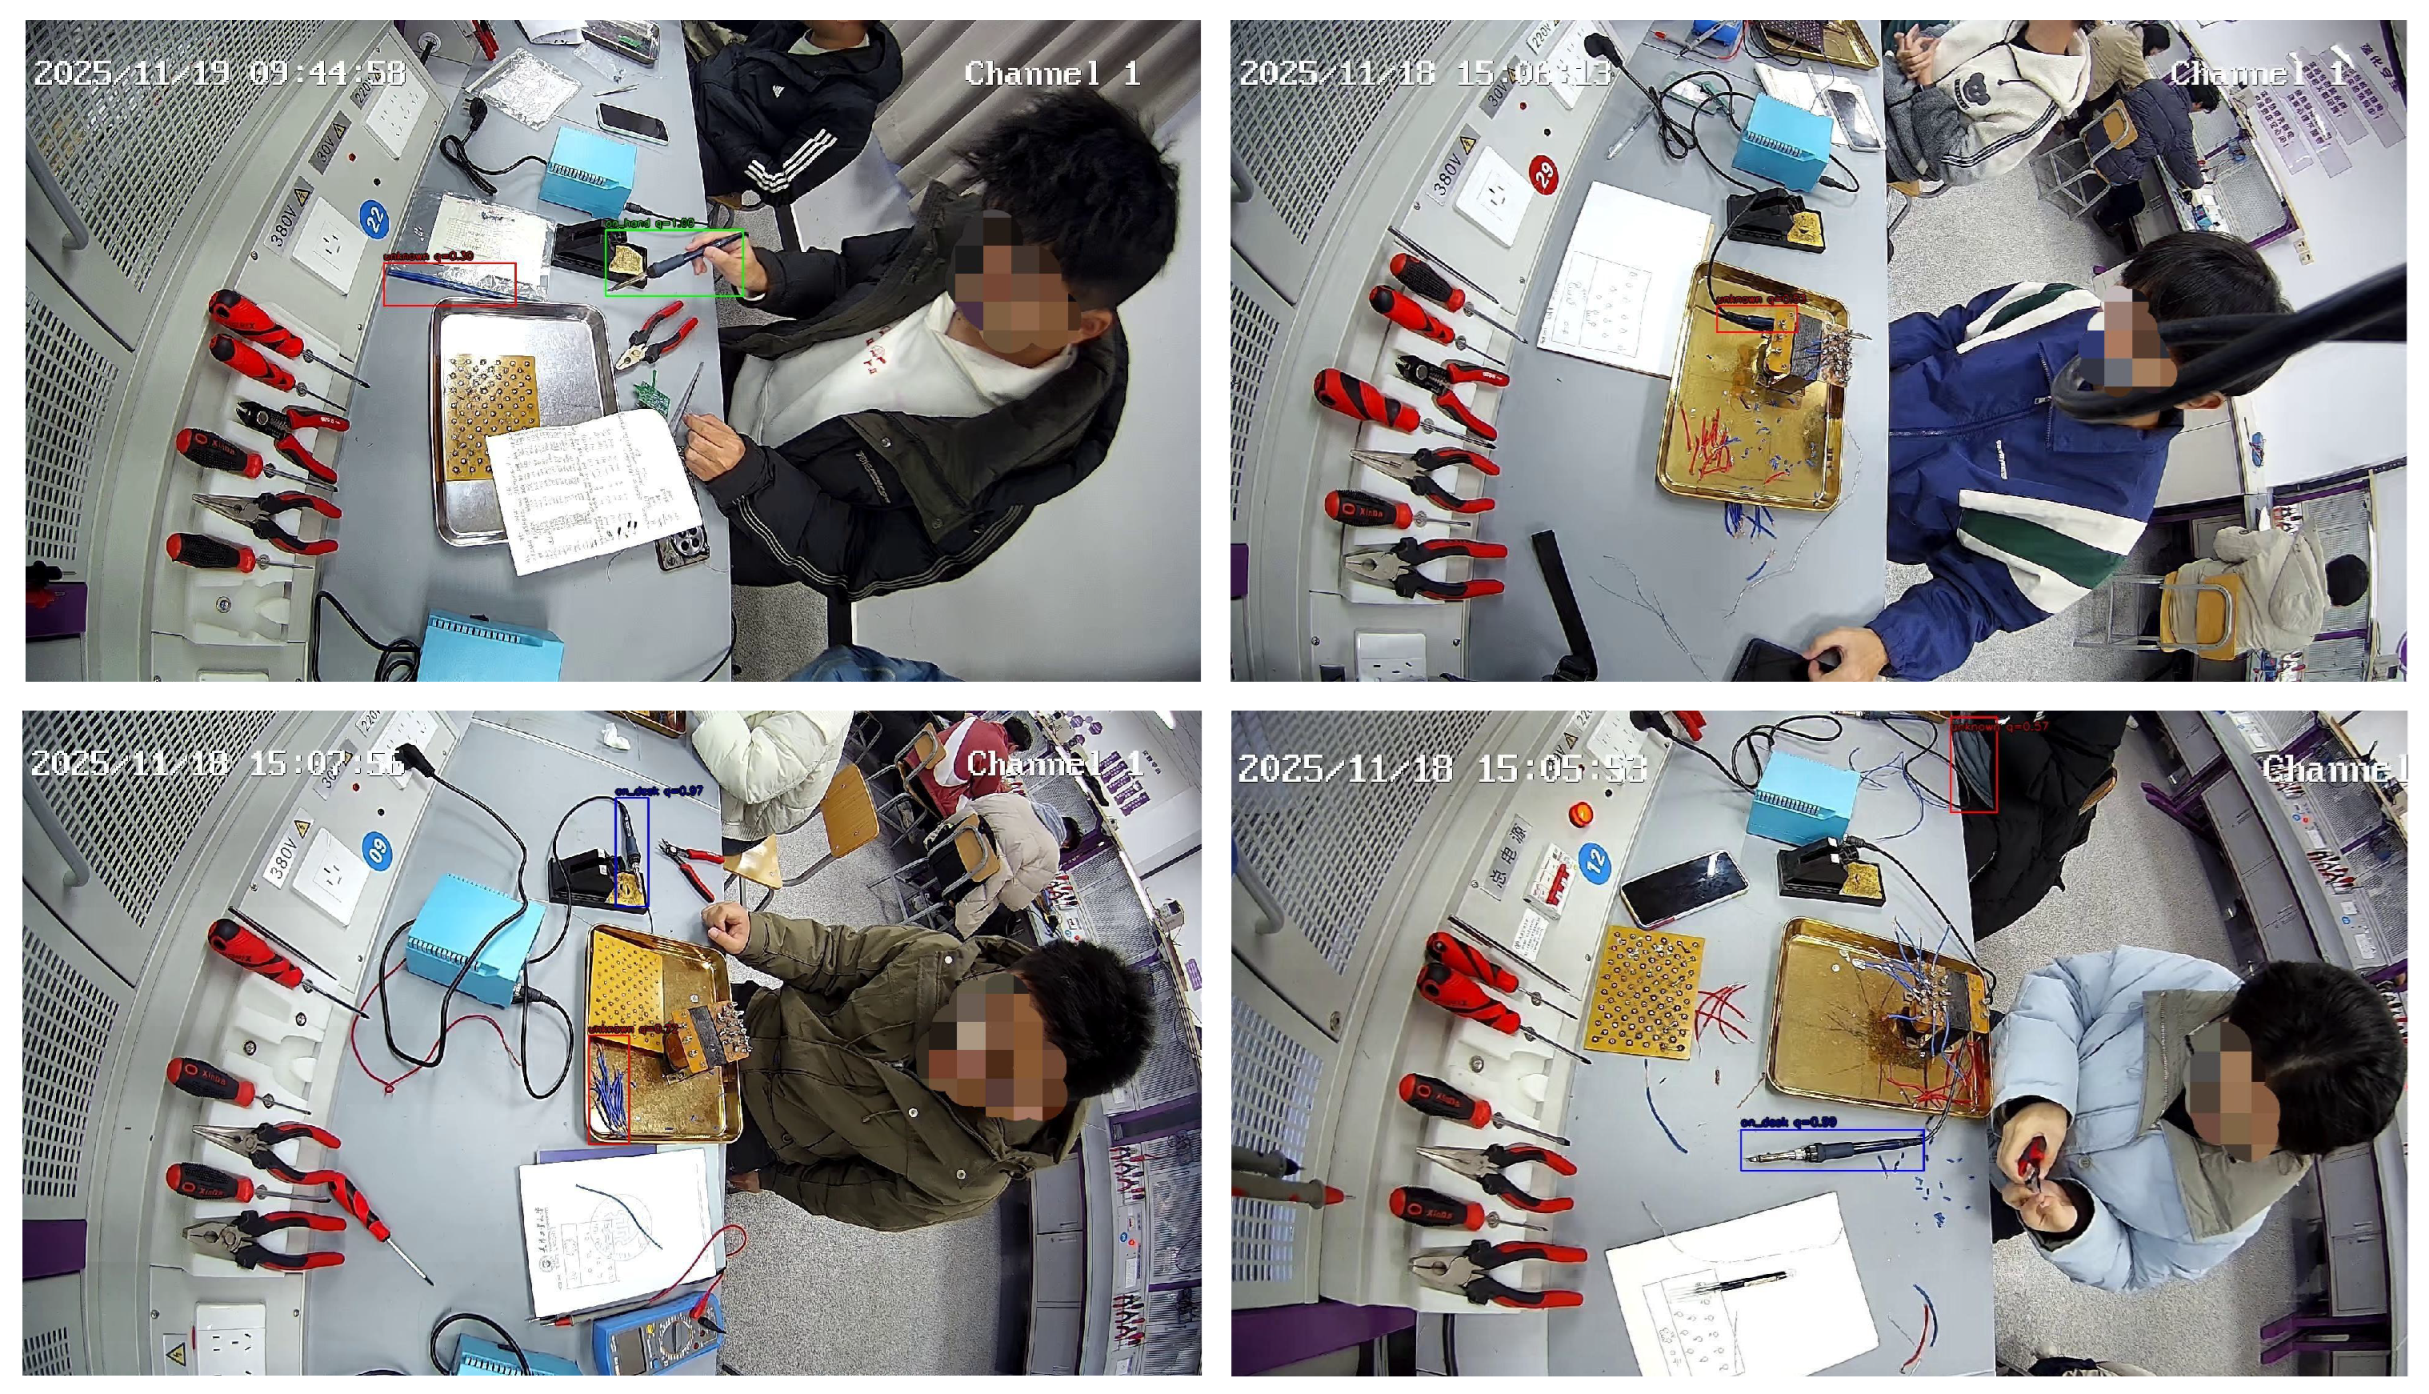
Figure 10 presents typical examples in which Quality-Head rejects low-quality candidates.
The upper-left panel contains a transparent bag edge detected as a soldering iron with
; the upper-right panel contains a heavily occluded soldering iron with
. The lower panels show a blue wire bundle and a clothing fold detected as soldering irons with
and
, respectively. All four conclusions fall below
and are rejected. These examples complement the Precision gains in
Table 6 by showing how Quality-Head suppresses visually plausible but unreliable candidates.
Together, the visualizations connect typical appearance-driven errors with RISNet’s object association, state prediction, and reliability filtering behavior.
4.8. Limitations
The present evaluation is limited by dataset scale and scene diversity. SISID was collected from a restricted set of training scenes, cameras, and soldering equipment, and broader variation in background, lighting, viewpoint, and device appearance remains underrepresented. The unknown relation provides a conservative label for absent or uncertain interaction evidence, but its current annotation volume is still limited. These limitations are being addressed through ongoing data collection in additional scenes and camera settings, together with a future fixed cross-scene test split that will remain independent of model selection and threshold tuning.
The current validation split is used for model selection, threshold choice, and final reporting, so the reported results should be interpreted as validation-set performance rather than fully independent test-set performance. The five-split resampling analysis indicates limited variation within the present validation distribution, and the threshold sweep further shows that Overall F1 remains stable over –0.90. Transfer to unseen scenes and devices will be evaluated on the planned fixed test set.
At the system level, soldering iron subject misses remain the main source of unrecoverable errors, which indicates that future work should jointly improve candidate recall and false-alarm control. Deployment on resource-constrained platforms will further require latency, memory, and accuracy trade-off studies.