
Prototype of a Multimodal and Multichannel Electro-Physiological and General-Purpose Signal Capture System: Evaluation in Sleep-Research-like Scenario

 , ,
, ,  , , and
Abstract
1. Introduction
2. Materials and Methods
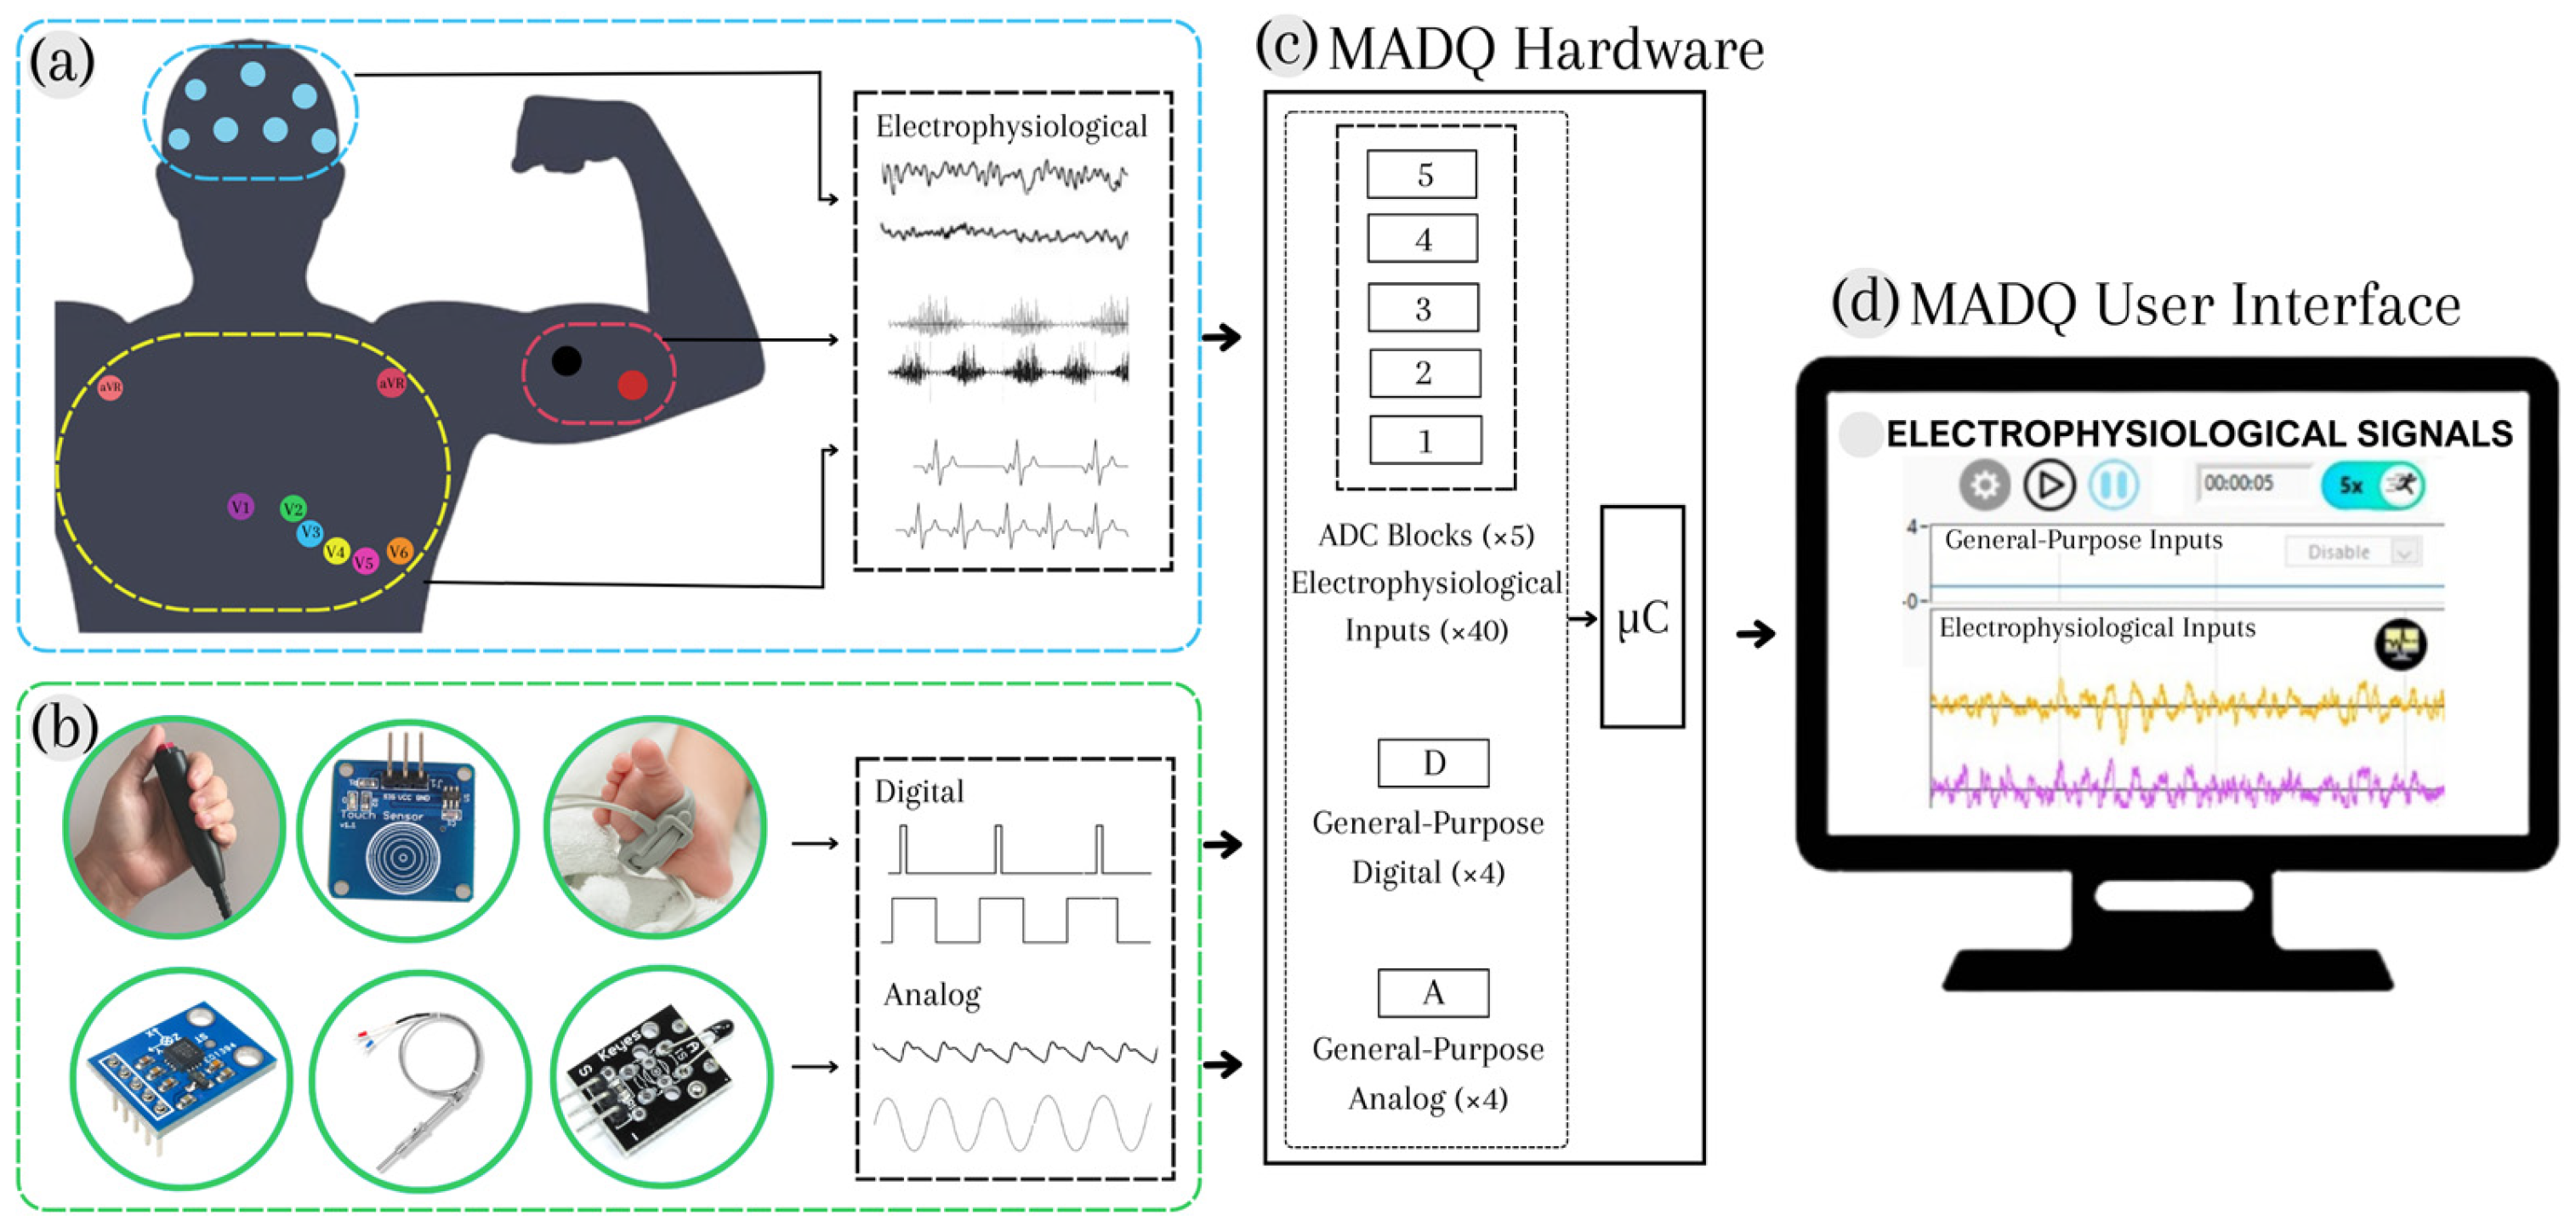
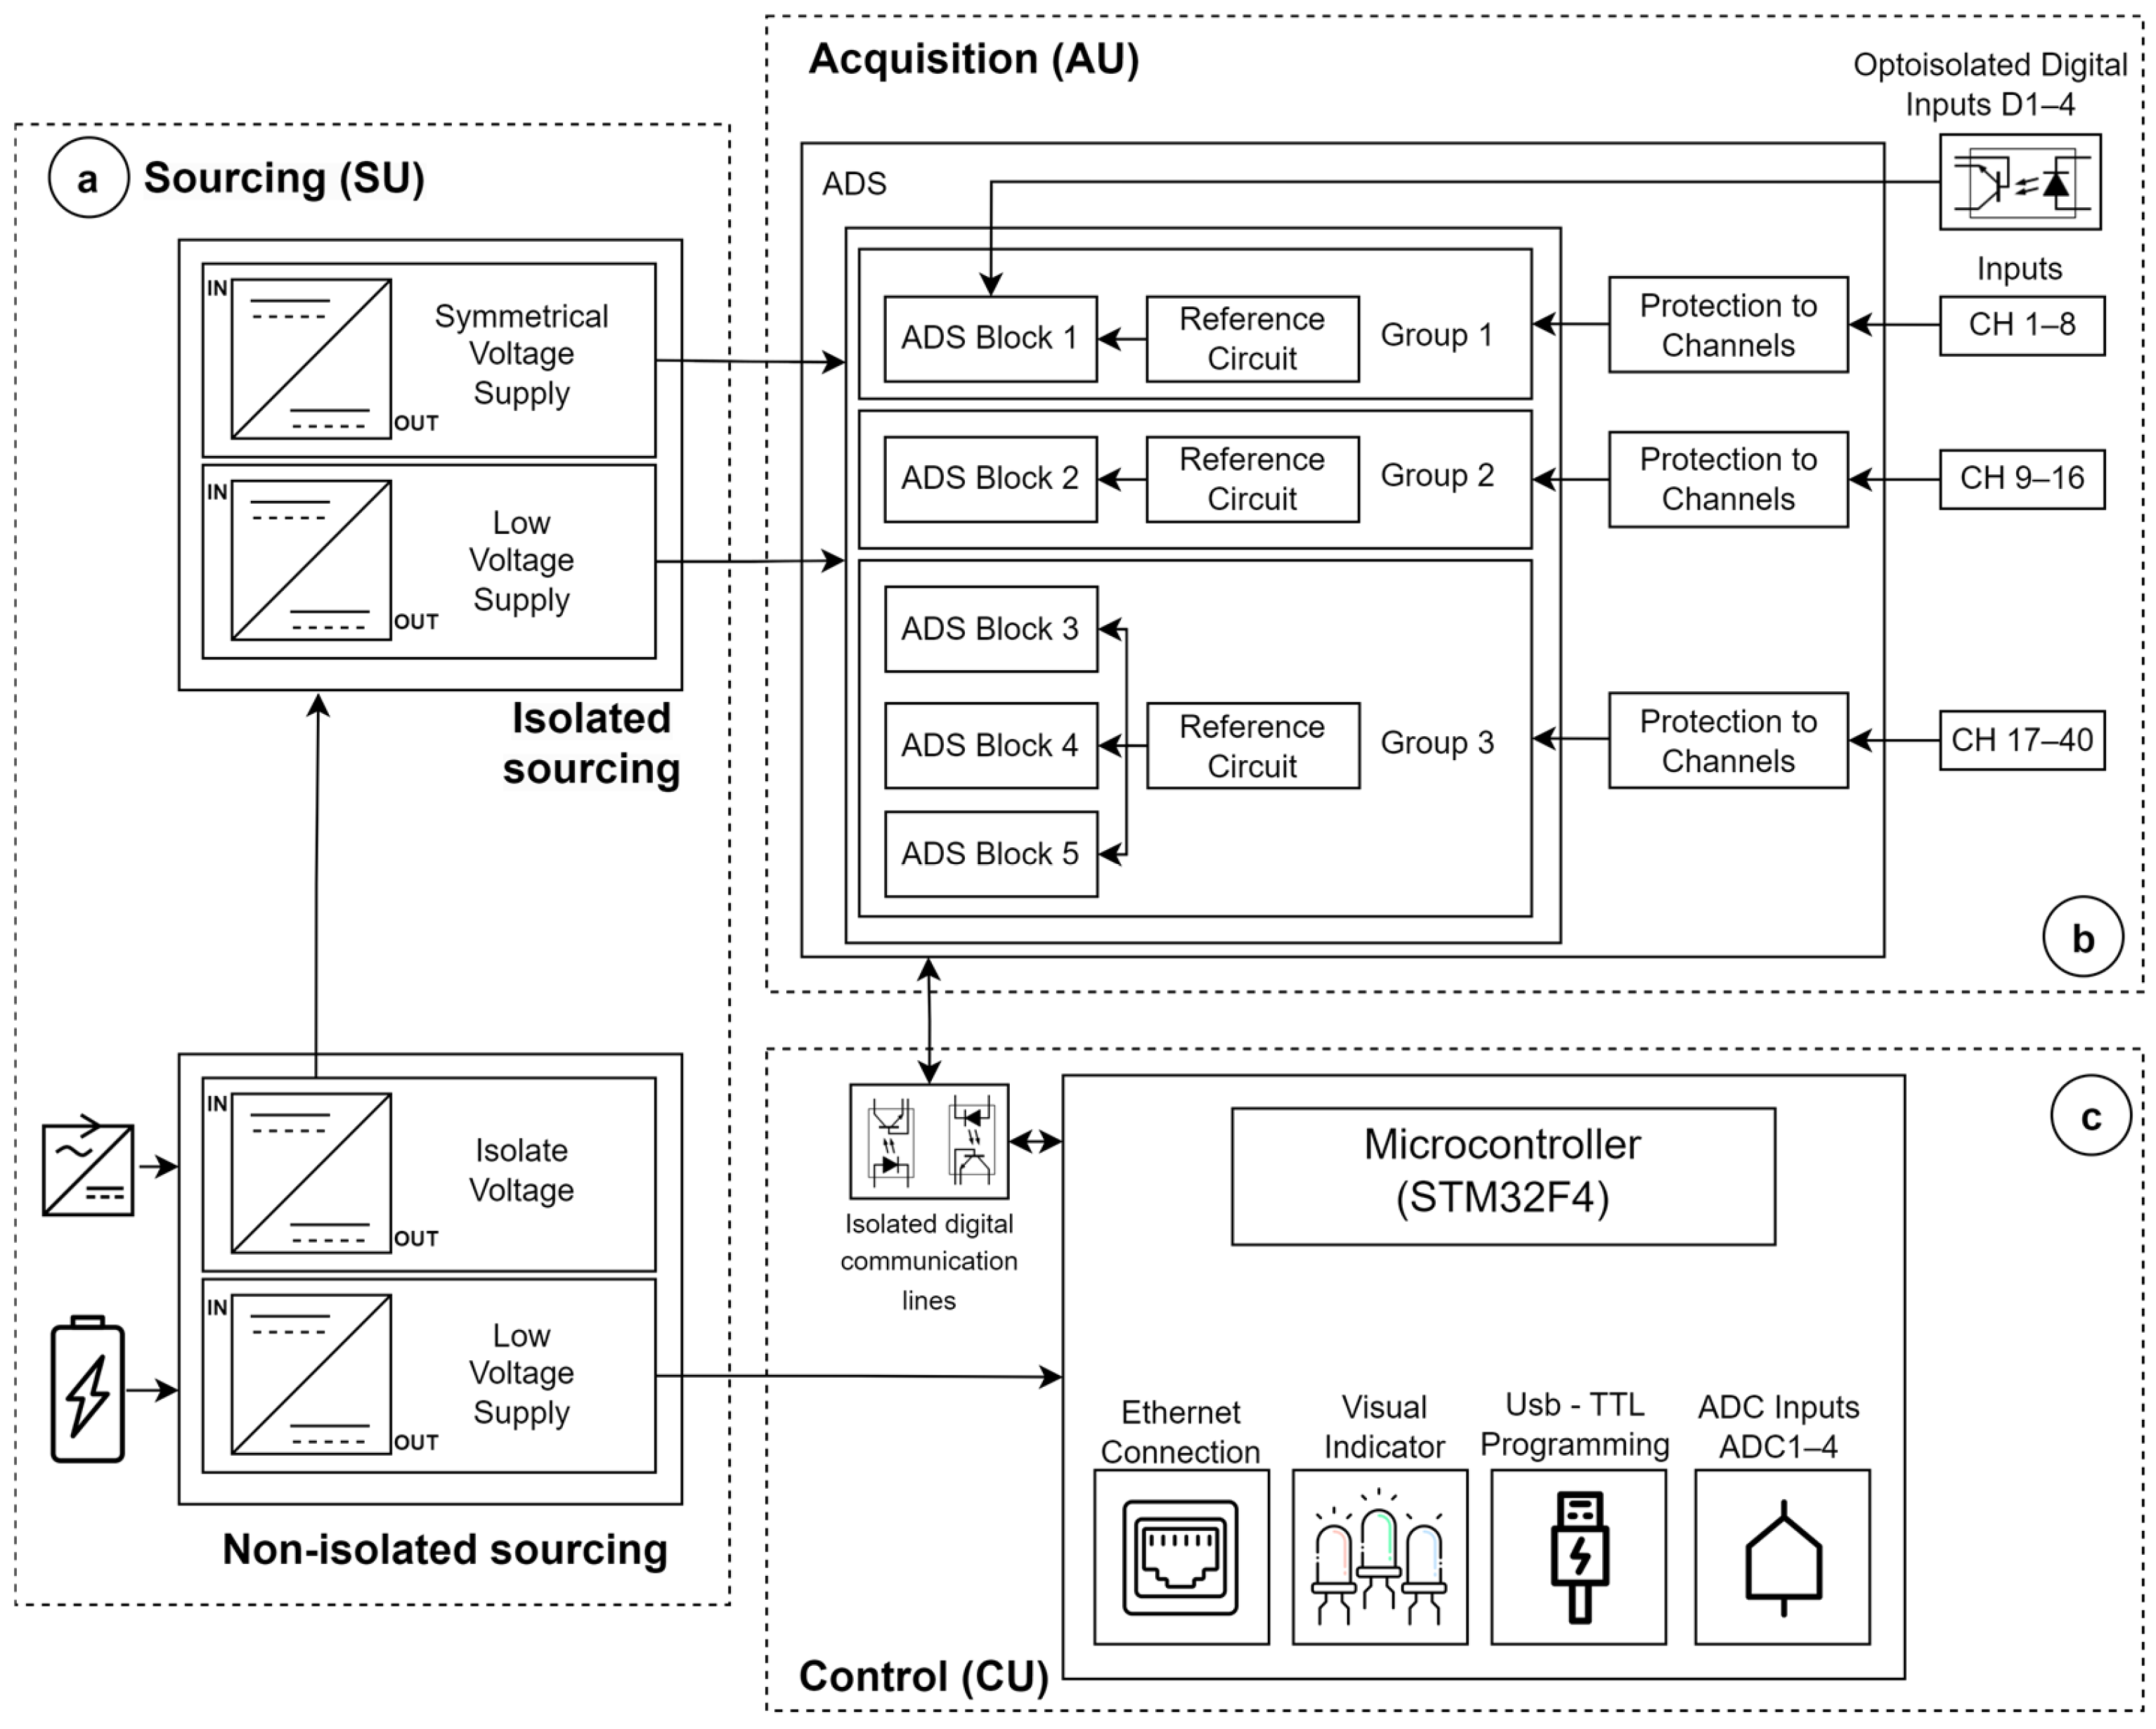
2.1. Design
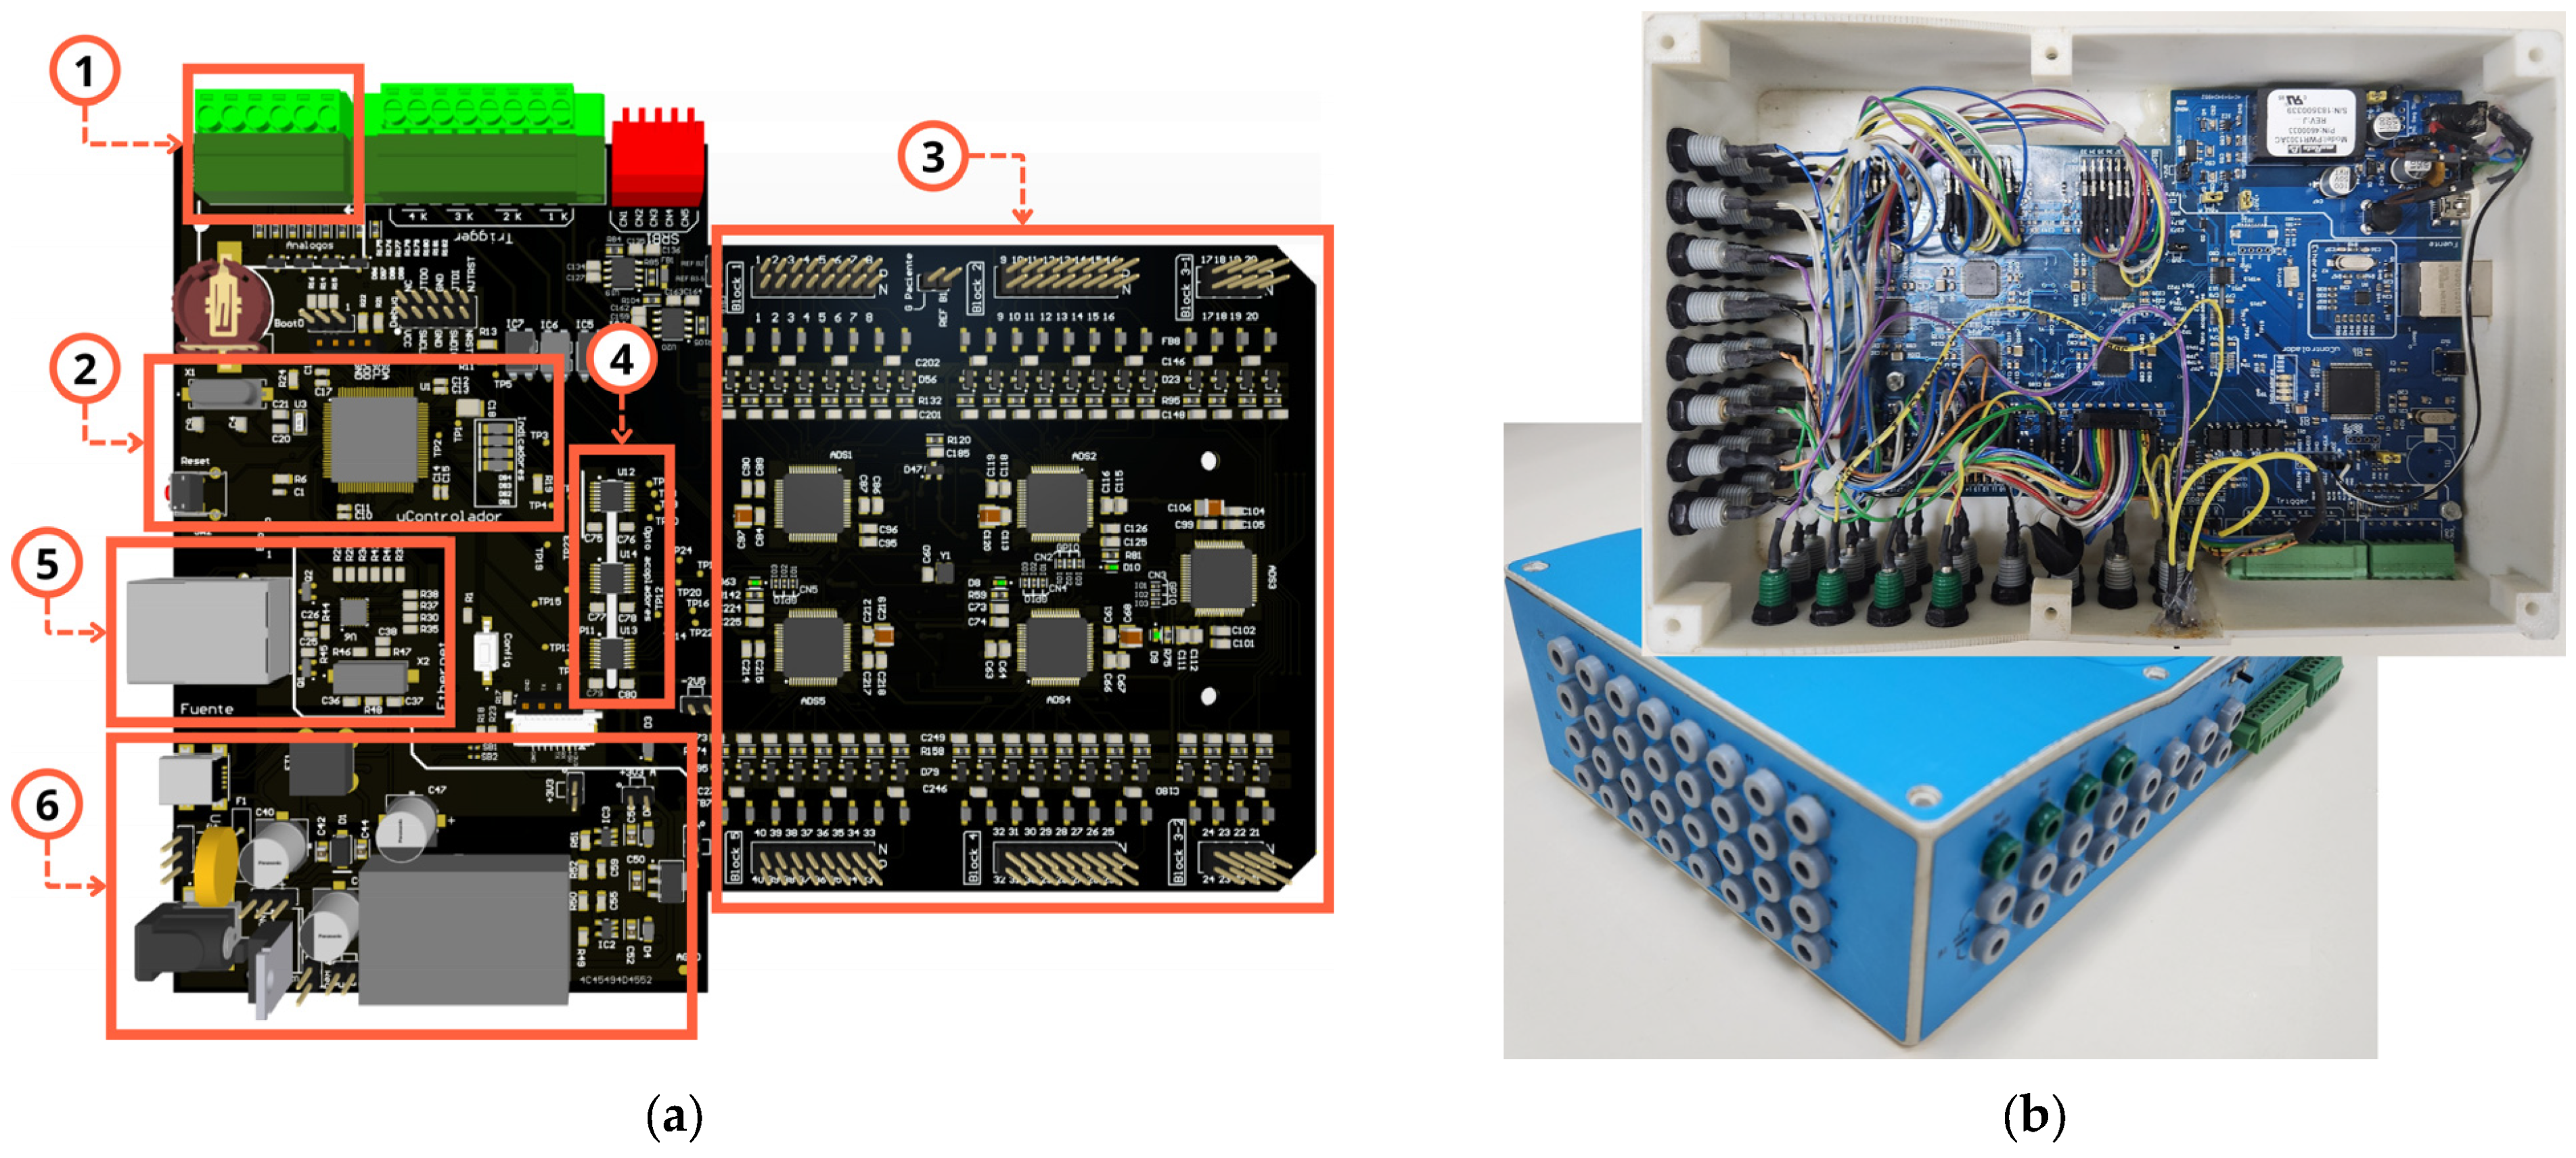
2.1.1. Hardware
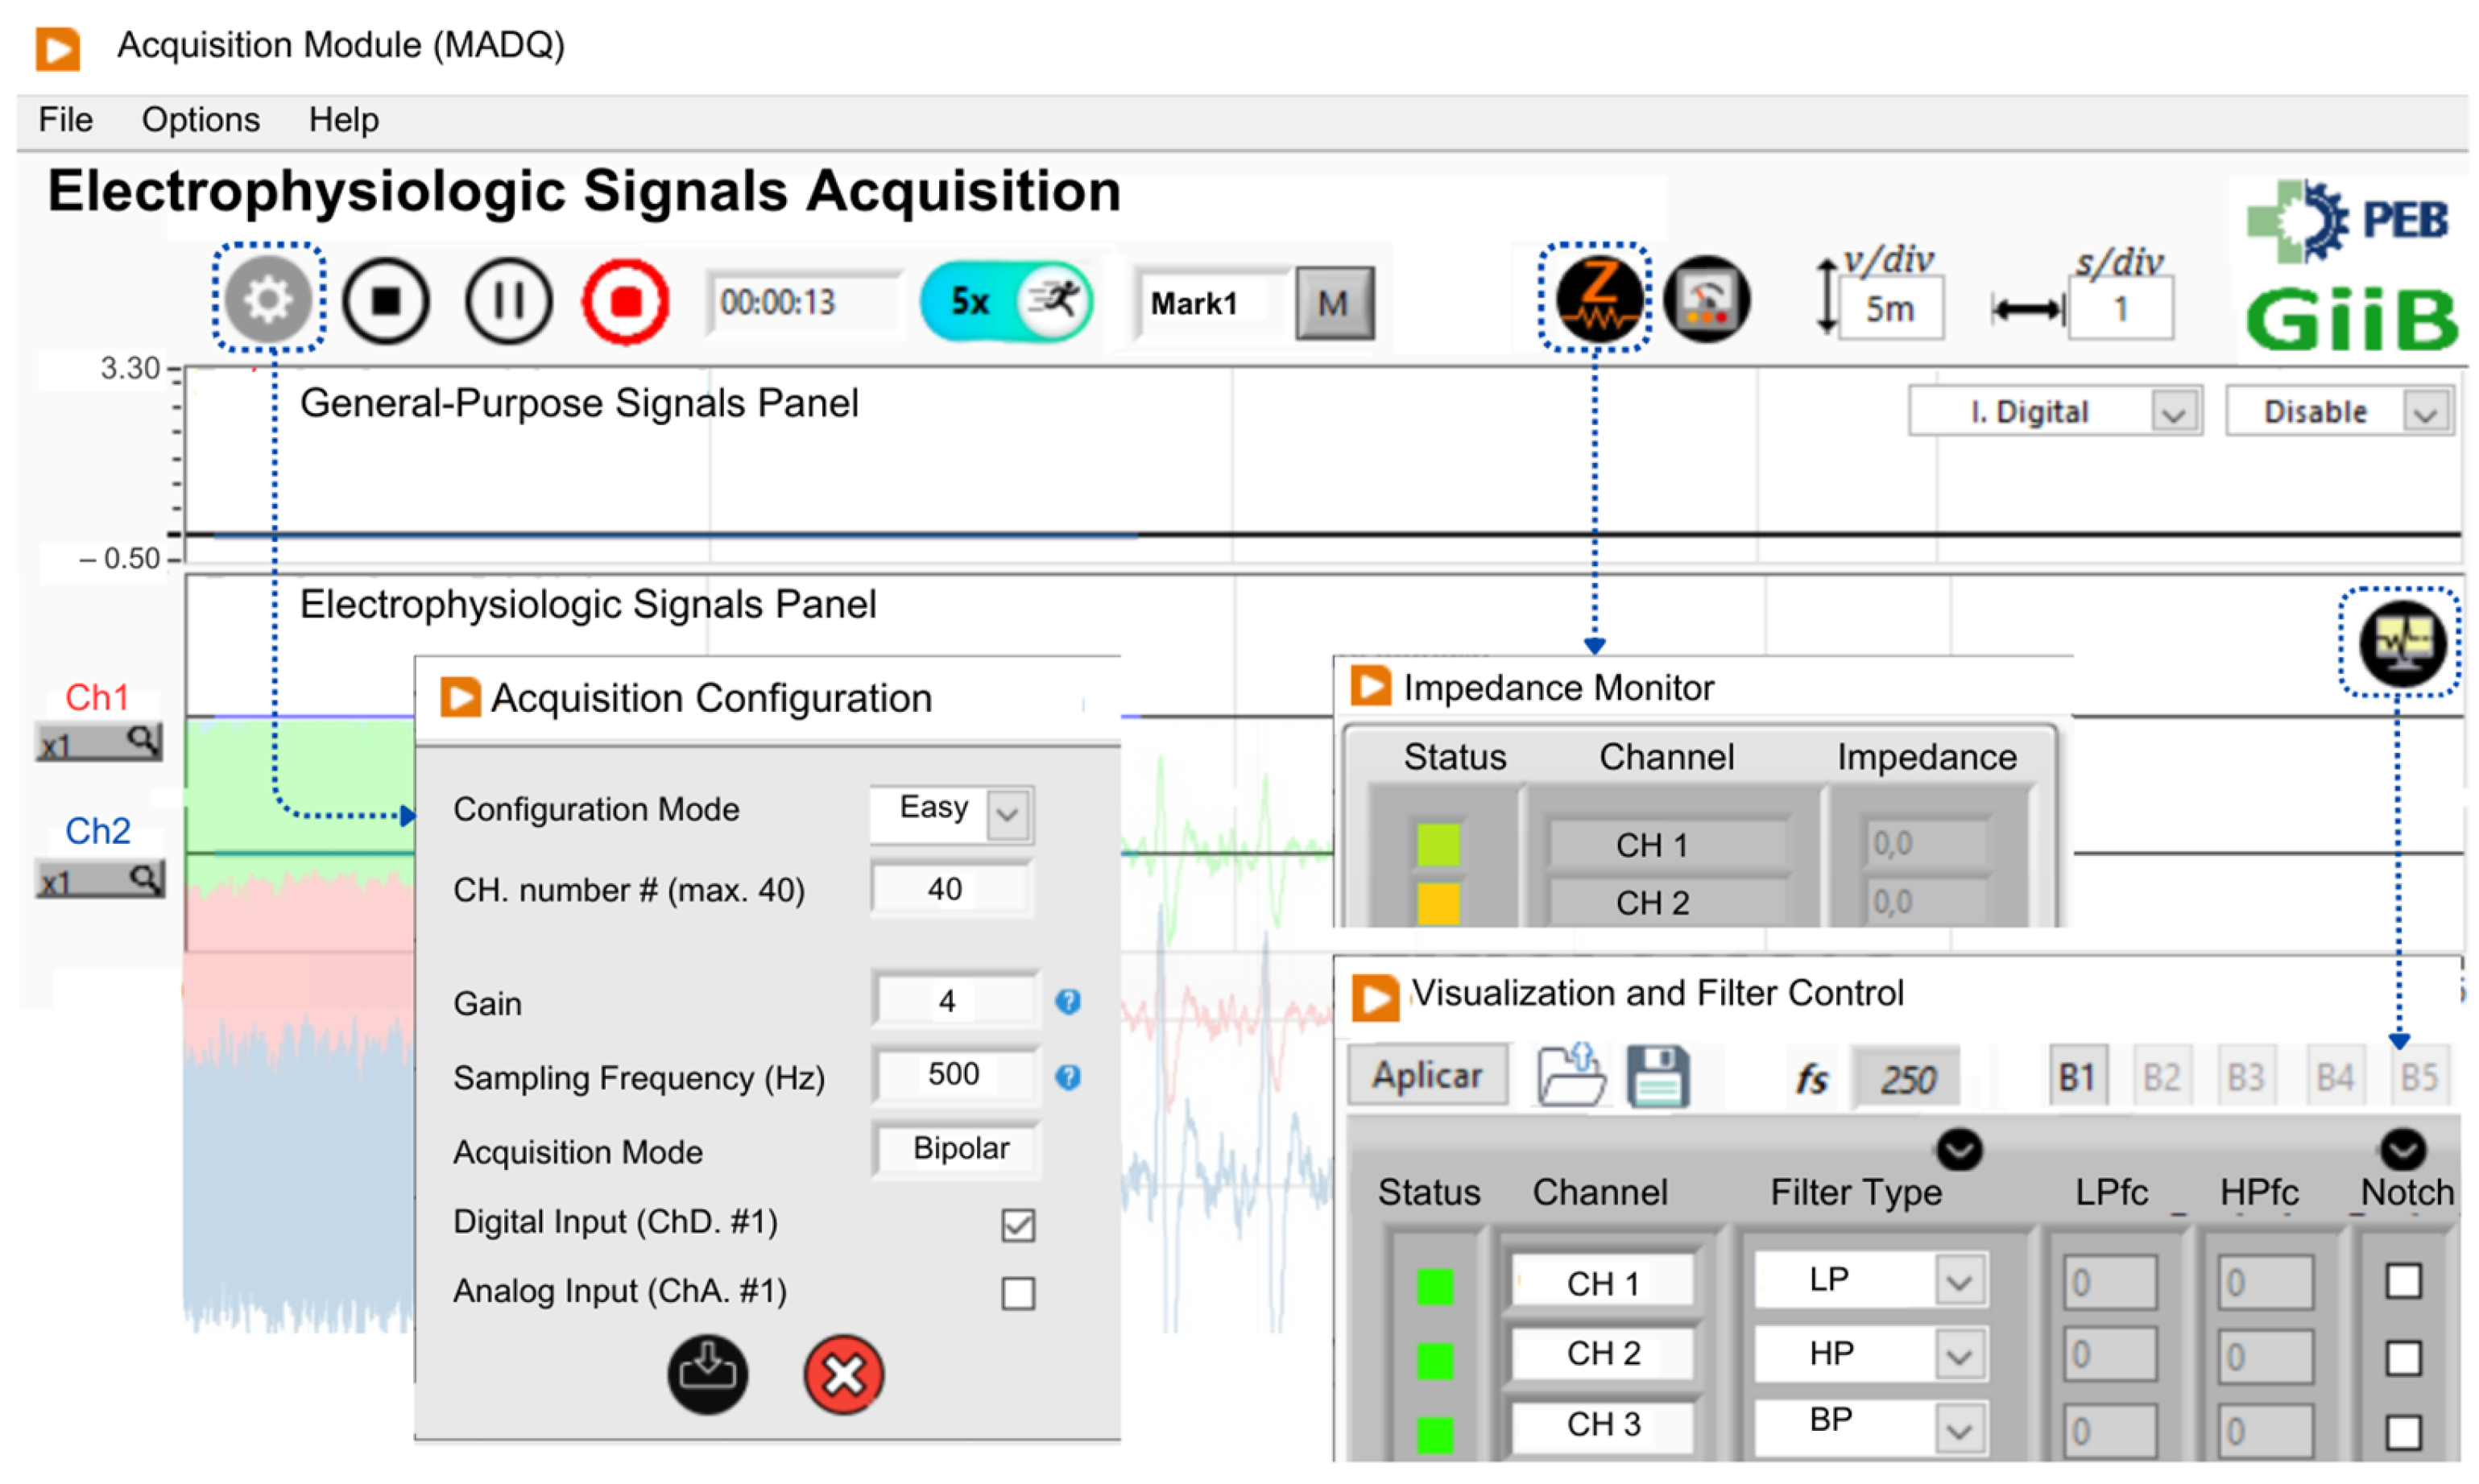
2.1.2. Software
2.2. Functional Tests
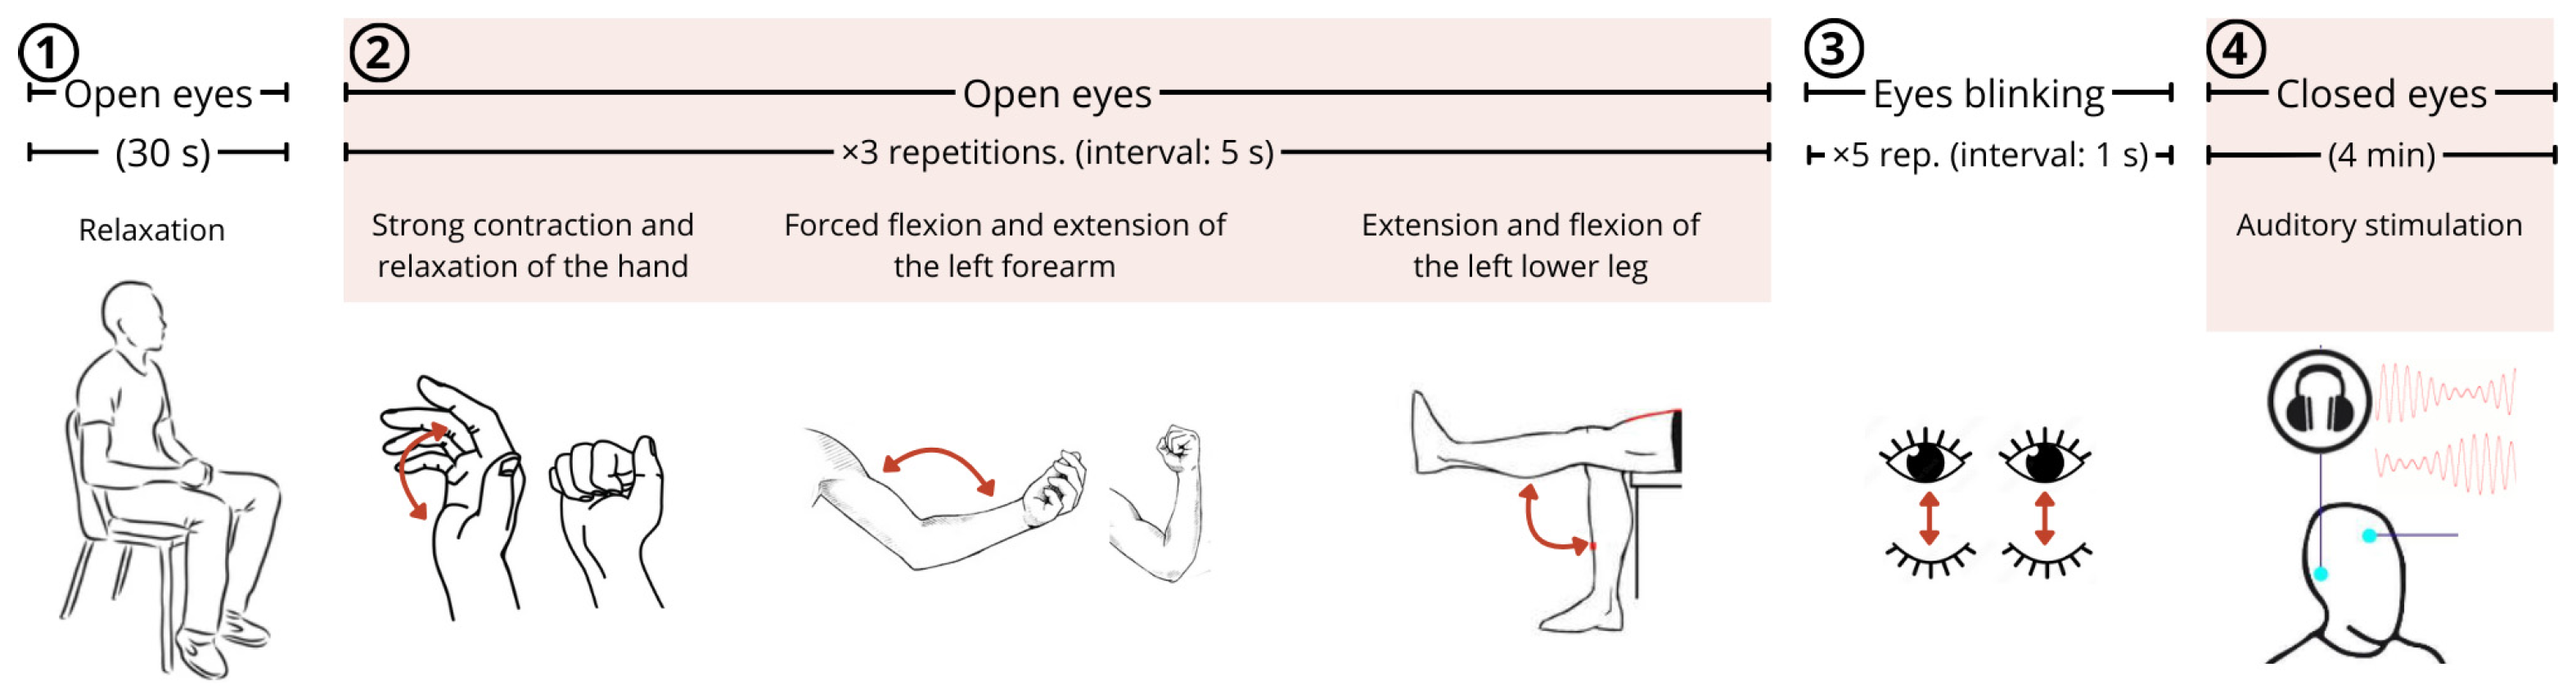
2.3. Preliminary Experimental Test
- Maintaining muscle relaxation with eyes open (at rest) for thirty seconds;
- Performing three repetitions of specific muscular movements with five-second interval: (i) contraction and relaxation of the hand (gripping and releasing), (ii) flexion and extension of the left forearm, (iii) extension and flexion of the left lower leg;
- Blinking eyes five times with 1 s intervals;
- Closing the eyes and maintaining a resting state for 4 min while being subjected to auditory stimulation.
3. Results
3.1. Functional Evaluation
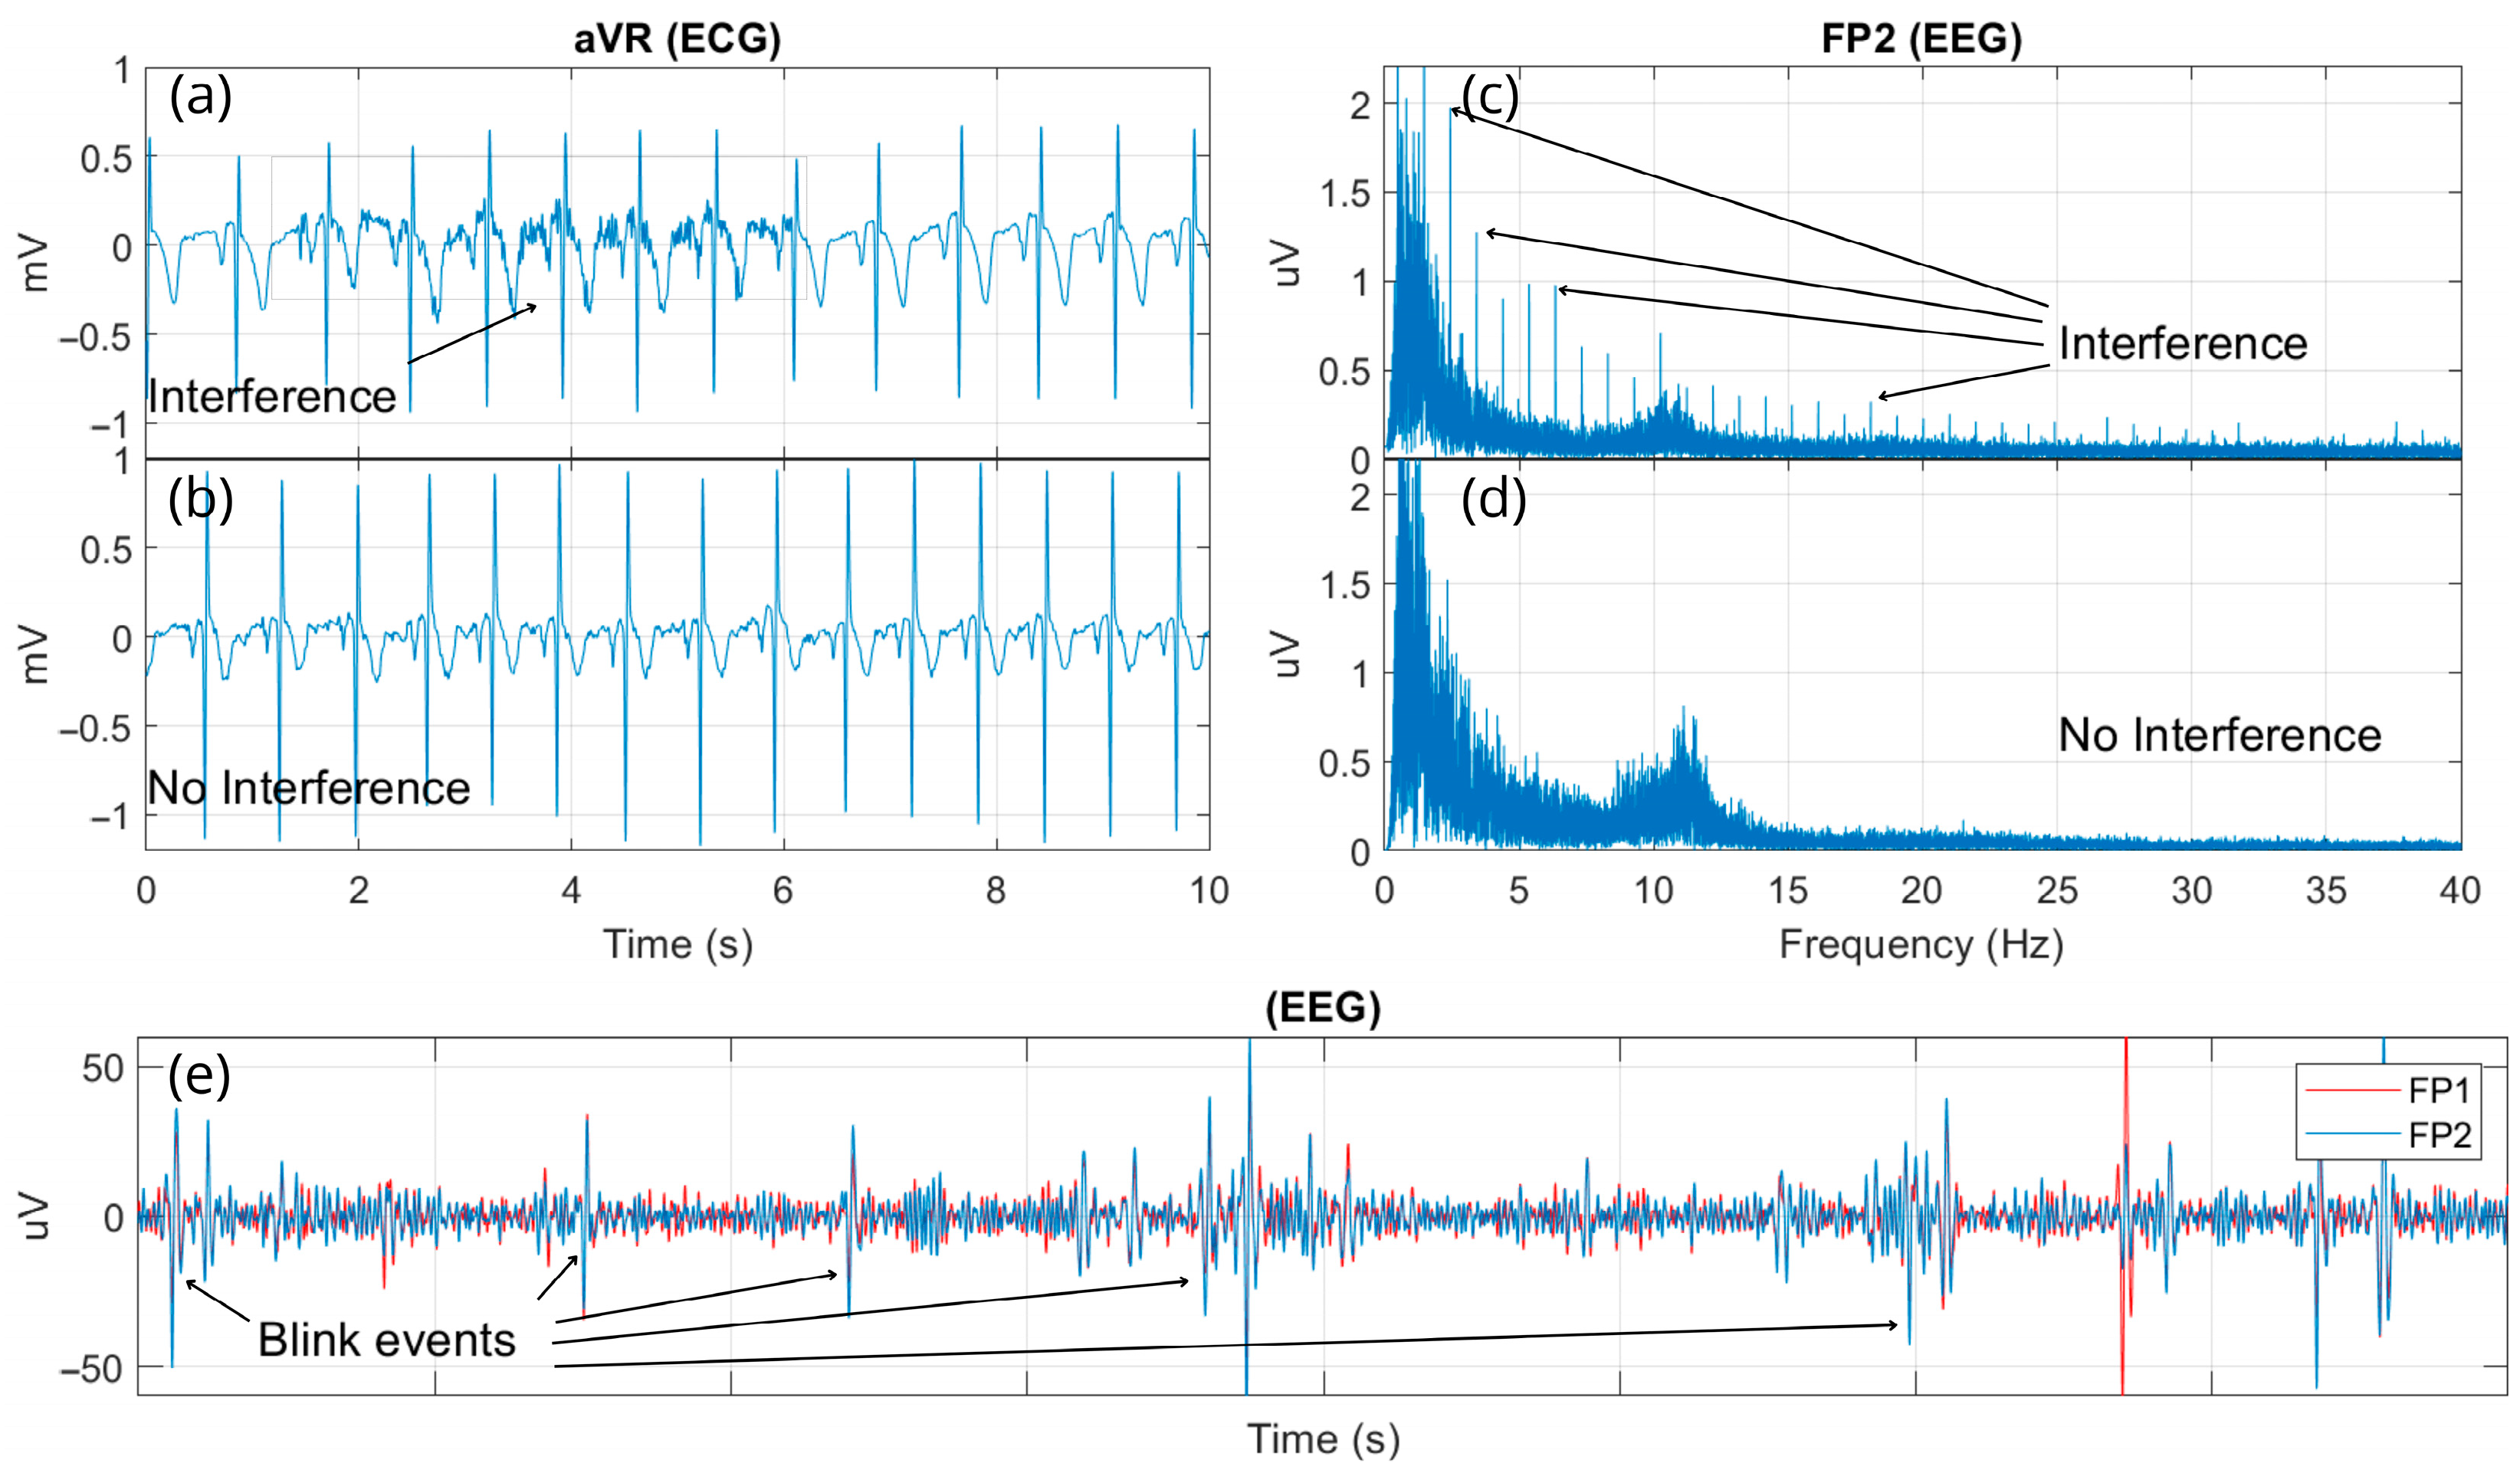
3.2. Experimental Evaluation
4. Discussion
5. Conclusions
Author Contributions
Funding
Institutional Review Board Statement
Informed Consent Statement
Data Availability Statement
Acknowledgments
Conflicts of Interest
References
- Niedermeyer, E. Niedermeyer’s Electroencephalography: Basic Principles, Clinical Applications, and Related Fields; Lippincott Williams & Wilkins: Philadelphia, PA, USA, 2011; ISBN 0781789427. [Google Scholar]
- Vertes, R.P.; Linley, S.B.; Viena, T.D. Nucleus Reuniens: Circuitry, Function, and Dysfunction BT—Electrophysiological Recording Techniques; Vertes, R.P., Allen, T., Eds.; Springer: New York, NY, USA, 2022; pp. 55–101. ISBN 978-1-0716-2631-3. [Google Scholar]
- Ibrahim, S.; Djemal, R.; Alsuwailem, A. Electroencephalography (EEG) Signal Processing for Epilepsy and Autism Spectrum Disorder Diagnosis. Biocybern. Biomed. Eng. 2018, 38, 16–26. [Google Scholar] [CrossRef]
- Anadure, R.K.; Goel, J.; Saxena, R.; Gupta, S.; Vidhale, T. A Study on the Clinical and Electrographic Profile of Nonconvulsive Status Epilepticus (NCSE) in Comatose ICU Patients Using Portable Electroencephalography (EEG). Med. J. Armed Forces India 2023, 79, 292–299. [Google Scholar] [CrossRef] [PubMed]
- Zheng, Y.; Luo, Y.; Zou, B.; Zhang, L.; Li, L. MMASleepNet: A Multimodal Attention Network Based on Electrophysiological Signals for Automatic Sleep Staging. Front. Neurosci. 2022, 16, 973761. [Google Scholar]
- Pilkar, R.; Momeni, K.; Ramanujam, A.; Ravi, M.; Garbarini, E.; Forrest, G.F. Use of Surface EMG in Clinical Rehabilitation of Individuals with SCI: Barriers and Future Considerations. Front. Neurol. 2020, 11, 578559. [Google Scholar] [CrossRef]
- Jose, S.; George, S.T.; Subathra, M.S.P.; Handiru, V.S.; Jeevanandam, P.K.; Amato, U.; Suviseshamuthu, E.S. Robust Classification of Intramuscular EMG Signals to Aid the Diagnosis of Neuromuscular Disorders. IEEE Open J. Eng. Med. Biol. 2020, 1, 235–242. [Google Scholar] [CrossRef]
- Goen, A. Classification of EMG Signals for Assessment of Neuromuscular Disorders. Int. J. Electron. Electr. Eng. 2014, 2, 242–248. [Google Scholar] [CrossRef]
- Pollet, A.-G.; Guenancia, C.; Garcia, R.; Viart, G.; Dubois, D.; Bourgois, M.; Chapelet, F.; Loyez, T.; Dautriche, B.; Guyomar, Y. EASITM 12-lead ECG with a Handheld Computer Refines Cardiovascular Diagnosis in General Practice. J. Electrocardiol. 2022, 73, 96–102. [Google Scholar] [CrossRef]
- Rahman, M.M.; Bhuiyan, M.I.H.; Hassan, A.R. Sleep Stage Classification Using Single-Channel EOG. Comput. Biol. Med. 2018, 102, 211–220. [Google Scholar] [CrossRef]
- Sateia, M.J. International Classification of Sleep Disorders. Chest 2014, 146, 1387–1394. [Google Scholar] [CrossRef]
- Guo, H.; Di, Y.; An, X.; Wang, Z.; Ming, D. A Novel Approach to Automatic Sleep Stage Classification Using Forehead Electrophysiological Signals. Heliyon 2022, 8, e12136. [Google Scholar] [CrossRef]
- Tagluk, M.E.; Sezgin, N.; Akin, M. Estimation of Sleep Stages by an Artificial Neural Network Employing EEG, EMG and EOG. J. Med. Syst. 2010, 34, 717–725. [Google Scholar] [CrossRef]
- Hanert, A.; Schönfeld, R.; Weber, F.D.; Nowak, A.; Döhring, J.; Philippen, S.; Granert, O.; Burgalossi, A.; Born, J.; Berg, D. Reduced Overnight Memory Consolidation and Associated Alterations in Sleep Spindles and Slow Oscillations in Early Alzheimer’s Disease. Neurobiol. Dis. 2024, 190, 106378. [Google Scholar] [CrossRef]
- Amato, N.; Caverzasio, S.; Galati, S. Clinical Implication of High-Density EEG Sleep Recordings in Parkinson’s Disease. J. Neurosci. Methods 2020, 340, 108746. [Google Scholar] [CrossRef]
- IWorx IWORX. Available online: https://www.iworx.com/ (accessed on 4 August 2024).
- Brainvision Brainvision. Available online: https://brainvision.com/products/recorder-add-on-brainvision-video-recorder-kit/ (accessed on 4 August 2024).
- BIOPAC Systems, I. BIOPAC Systems. Available online: https://www.biopac.com/product/mp160-data-acquisition-system/ (accessed on 4 August 2024).
- Gtec, G. Tec Medical Engineering GmbH. Available online: https://www.gtec.at/product/g-nautilus-pro-flexible/ (accessed on 4 August 2024).
- Lopez, J.M.; González, F.; Bohorquez, J.C.; Bohórquez, J.; Valderrama, M.A.; Segura-Quijano, F. Open Source EEG Platform with Reconfigurable Features for Multiple-Scenarios. Indones. J. Electr. Eng. Inform. 2018, 6, 253–264. [Google Scholar]
- Zou, B.; Zheng, Y.; Shen, M.; Luo, Y.; Li, L.; Zhang, L. BEATS: An Open-Source, High-Precision, Multi-Channel EEG Acquisition Tool System. IEEE Trans. Biomed. Circuits Syst. 2022, 16, 1287–1298. [Google Scholar] [CrossRef]
- Memon, S.A.; Waheed, A.; Başaklar, T. Low-Cost Portable 4-Channel Wireless EEG Data Acquisition System for BCI Applications. In Proceedings of the 2018 Medical Technologies National Congress (TIPTEKNO), Magusa, Cyprus, 8–10 November 2018; pp. 1–4. [Google Scholar]
- Wang, Z.; Chen, C.; Li, W.; Yuan, W.; Han, T.; Sun, C.; Tao, L.; Zhao, Y.; Chen, W. A Multichannel EEG Acquisition System with Novel Ag NWs/PDMS Flexible Dry Electrodes. In Proceedings of the 2018 40th Annual International Conference of the IEEE Engineering in Medicine and Biology Society (EMBC), Honolulu, HI, USA, 17–21 July 2018; pp. 1299–1302. [Google Scholar]
- Zanetti, R.; Assunção, M.L.M.; Corrêa, M.F.S.; Tierra-Criollo, C.J.; Melges, D.B. Sistema de Aquisição De Sinais Biomédicos Baseado No Front-End ADS1299. In Proceedings of the XXIV Brazilian Congress on Biomedical Engineering, Uberlândia, Brazil, 13–17 October 2014; pp. 1649–1652. [Google Scholar]
- Moridani, M.K.; Heydar, M.; Behnam, S.S.J. A Reliable Algorithm Based on Combination of EMG, ECG and EEG Signals for Sleep Apnea Detection: A Reliable Algorithm for Sleep Apnea Detection. In Proceedings of the 2019 5th Conference on Knowledge Based Engineering and Innovation (KBEI), Tehran, Iran, 28 February–1 March 2019; pp. 256–262. [Google Scholar]
- Lai, D.; Bin Heyat, M.B.; Khan, F.I.; Zhang, Y. Prognosis of Sleep Bruxism Using Power Spectral Density Approach Applied on EEG Signal of Both EMG1-EMG2 and ECG1-ECG2 Channels. IEEE Access 2019, 7, 82553–82562. [Google Scholar] [CrossRef]
- Chiesi, M.; Guermandi, M.; Placati, S.; Scarselli, E.F.; Guerrieri, R. Creamino: A Cost-Effective, Open-Source EEG-Based BCI System. IEEE Trans. Biomed. Eng. 2018, 66, 900–909. [Google Scholar] [CrossRef]
- Friedenthal, S.; Moore, A.; Steiner, R. A Practical Guide to SysML: The Systems Modeling Language; Morgan Kaufmann: Burlington, MA, USA, 2014; ISBN 0128008008. [Google Scholar]
- IEC 60601-1:2005; Medical Electrical Equipment—Part 1: General Requirements for Basic Safety and Essential Performance. International Electrotechnical Commission (IEC): Geneva, Switzerland, 2005.
- Ramos, I.F.P. Manutenção de Equipamentos de Fisioterapia: Estágio Na Empresa S4MED–Medical Devices. 2022. Available online: https://comum.rcaap.pt/entities/publication/7ccb0663-60eb-4d41-b40d-0ad388152687 (accessed on 27 April 2025).
- Llamosa, L.E.; Contreras, L.G.M.; Lara, H.P. Fundamentos Para El Diseño de La Prueba de Seguridad Electrica Para Equipo Biomedico Con Base En La Norma Ntc-Iso-Iec-60601-1. Sci. Tech. 2006, 12, 321–326. [Google Scholar]
- Texas Instruments. Datasheet ADS1299: Low-Noise, 8-Channel, 24-Bit Analog Front-End for Biopotential Measurements; Texas Instruments: Dallas, TX, USA, 2012. [Google Scholar]
- Cevallos-Larrea, P.F.; Frota, S.M.; Ichinose, R.M.; Tierra-Criollo, C.J. Characterization of Interstimulus Interaction in the Multiple Auditory Steady-State Responses at High Sound Levels. J. Acoust. Soc. Am. 2020, 148, 1852–1863. [Google Scholar] [CrossRef]
- Castillo-Guerrero, J.M.; Molina-Vidal, D.A.; Landi-Nieto, C.; Cevallos-Larrea, P.F.; Tierra-Criollo, C.J. Evaluation of an Auditory Stimulation Prototype for Application in Selective Attention. In Proceedings of the IX Congresso Latino-Americano de Engenharia Biomédica (CLAIB 2022) e o XXVIII Congresso Brasileiro de Engenharia Biomédica (CBEB 2022), Florianópolis, Brazil, 24–28 October 2022; pp. 163–173. [Google Scholar]
- Gupta, A.; Singh, S.K.; Yadav, J.S.; Sharma, H.B.; Chakravartty, A. Comparison of Brainstem Auditory Evoked Potentials and Event-Related Potential P300 Parameter among Different Severity Levels of Depression: A Study on Adult Patients. Natl. J. Physiol. Pharm. Pharmacol. 2023, 13, 1917–1922. [Google Scholar]
- Bitter, R.; Mohiuddin, T.; Nawrocki, M. LabVIEW: Advanced Programming Techniques; CRC Press: Boca Raton, FL, USA, 2017; ISBN 1315222094. [Google Scholar]
- Neer, G.F.; Genesis, G. Aplicaciones del Software LabView en Electromedicina; Universidad Tecnóloga Nacional de Argentina: Buenos Aires, Argentina, 2020. [Google Scholar]
- Aydin, S.; Kam, E. Developing of an Automation for Therapy Dosimetry Systems by Using Labview Software. Results Phys. 2018, 9, 1007–1015. [Google Scholar] [CrossRef]
- Molina-Vidal, D.A.; Cevallos Larrea, P.; Guambaña Calle, L.; Liquori, D.; Tierra-Criollo, C.J. Design and Evaluation of a Prototype of Dual Channel Electrical Stimulator: Application in the Assessment of Current Perception Thresholds to Multiple Stimuli BT—Smart Technologies, Systems and Applications; Narváez, F.R., Urgilés, F., Bastos-Filho, T.F., Salgado-Guerrero, J.P., Eds.; Springer Nature: Cham, Switzerland, 2023; pp. 342–355. [Google Scholar]
- Szaj, W.; Wojnarowska, W.; Pajdo, B. First Evaluation of the PTN-104 Plethysmographic Sensor for Heart Rate Measurement. Meas. Sci. Rev. 2021, 21, 117–122. [Google Scholar] [CrossRef]
- Porto, R.C.; Genius, D.; Apvrille, L. Modeling and Virtual Prototyping for Embedded Systems on Mixed-Signal Multicores. In Proceedings of the Rapid Simulation and Performance Evaluation: Methods and Tools, Valencia, Spain, 21–23 January 2019; pp. 1–7. [Google Scholar]
- Gutiérrez, D.V.; Madrid, N.M.; Seepold, R. Non-Invasive System for Measuring Parameters Relevant to Sleep Quality and Detecting Sleep Diseases: The Data Model. In Non-Invasive Health Systems Based on Advanced Biomedical Signal and Image Processing; CRC Press: Boca Raton, FL, USA, 2024; pp. 113–127. [Google Scholar]
- Gagnon Shaigetz, V.; Proulx, C.; Cabral, A.; Choudhury, N.; Hewko, M.; Kohlenberg, E.; Segado, M.; Smith, M.S.D.; Debergue, P. An Immersive and Interactive Platform for Cognitive Assessment and Rehabilitation (BWell): Design and Iterative Development Process. JMIR Rehabil. Assist. Technol. 2021, 8, e26629. [Google Scholar] [CrossRef] [PubMed]
- Indira, P.B.; Krishna, R.D. Optimized Adaptive Neuro Fuzzy Inference System (OANFIS) Based EEG Signal Analysis for Seizure Recognition on FPGA. Biomed. Signal Process Control 2021, 66, 102484. [Google Scholar] [CrossRef]
- Zhang, Z.; Savolainen, O.W.; Constandinou, T.G. Algorithm and Hardware Considerations for Real-Time Neural Signal on-Implant Processing. J. Neural Eng. 2022, 19, 16029. [Google Scholar] [CrossRef]
- Martinek, R.; Ladrova, M.; Sidikova, M.; Jaros, R.; Behbehani, K.; Kahankova, R.; Kawala-Sterniuk, A. Advanced Bioelectrical Signal Processing Methods: Past, Present, and Future Approach—Part III: Other Biosignals. Sensors 2021, 21, 6064. [Google Scholar] [CrossRef]
- Hoth, S.; Dziemba, O.C. The Role of Auditory Evoked Potentials in the Context of Cochlear Implant Provision. Otol. Neurotol. 2017, 38, e522–e530. [Google Scholar] [CrossRef]
- Rai, K.; Thakur, K.K.; Mane, P.K.; Panigrahi, N. Design of an EEG Acquisition System for Embedded Edge Computing. Adv. Sci. Technol. Eng. Syst. J. 2020, 5, 119–129. [Google Scholar] [CrossRef]
- Peltola, M.E.; Leitinger, M.; Halford, J.J.; Vinayan, K.P.; Kobayashi, K.; Pressler, R.M.; Mindruta, I.; Mayor, L.C.; Lauronen, L.; Beniczky, S. Routine and Sleep EEG: Minimum Recording Standards of the International Federation of Clinical Neurophysiology and the International League Against Epilepsy. Clin. Neurophysiol. 2023, 147, 108–120. [Google Scholar] [CrossRef]
- Uktveris, T.; Jusas, V. Development of a Modular Board for EEG Signal Acquisition. Sensors 2018, 18, 2140. [Google Scholar] [CrossRef]
- Tankisi, H.; Burke, D.; Cui, L.; De Carvalho, M.; Kuwabara, S.; Nandedkar, S.D.; Rutkove, S.; Stålberg, E.; van Putten, M.J.A.M.; Fuglsang-Frederiksen, A. Standards of Instrumentation of EMG. Clin. Neurophysiol. 2020, 131, 243–258. [Google Scholar] [CrossRef] [PubMed]
- Beniczky, S.; Schomer, D.L. Electroencephalography: Basic Biophysical and Technological Aspects Important for Clinical Applications. Epileptic Disord. 2020, 22, 697–715. [Google Scholar] [CrossRef] [PubMed]
- Houssein, E.H.; Kilany, M.; Hassanien, A.E. ECG Signals Classification: A Review. Int. J. Intell. Eng. Inform. 2017, 5, 376–396. [Google Scholar] [CrossRef]
- López, A.; Ferrero, F.; Villar, J.R.; Postolache, O. High-Performance Analog Front-End (AFE) for EOG Systems. Electronics 2020, 9, 970. [Google Scholar] [CrossRef]
- Maby, E. Technical Requirements for High-quality EEG Acquisition. In Brain–Computer Interfaces 2: Technology and Applications; Wiley: Hoboken, NJ, USA, 2016; pp. 143–161. [Google Scholar]
- Sun, Y.; Yu, X.B. Capacitive Biopotential Measurement for Electrophysiological Signal Acquisition: A Review. IEEE Sens. J. 2016, 16, 2832–2853. [Google Scholar] [CrossRef]
- OpenBCI OpenBCI Cyton. Available online: https://docs.openbci.com/GettingStarted/Biosensing-Setups/EEGSetup/ (accessed on 5 April 2025).
- g.tec G.USBAMP RESEARCH. Available online: https://www.gtec.at/product/g-usbamp-research-unleash-remarkable-precision-in-physiological-data-acquisition/ (accessed on 5 April 2025).
- Mind Media Group. NEXUS Q32; Mind Media Group: Herten, The Netherlands, 2025. [Google Scholar]
- Lu, W.; Gong, D.; Xue, X.; Gao, L. Improved Multi-Layer Wavelet Transform and Blind Source Separation Based ECG Artifacts Removal Algorithm from the SEMG Signal: In the Case of Upper Limbs. Front. Bioeng. Biotechnol. 2024, 12, 1367929. [Google Scholar] [CrossRef]
- Ait Yous, M.; Agounad, S.; Elbaz, S. Detection, Identification and Removing of Artifacts from SEMG Signals: Current Studies and Future Challenges. Comput. Biol. Med. 2025, 186, 109651. [Google Scholar] [CrossRef]
- Jiang, X.; Bian, G.-B.; Tian, Z. Removal of Artifacts from EEG Signals: A Review. Sensors 2019, 19, 987. [Google Scholar] [CrossRef]


| Channel Type | Sampling Frequency—fs (kHz) | ||||
|---|---|---|---|---|---|
| Item 1 | 0.25, 0.5, 1 | 2 | 4 | 8 | 16 |
| Electrophysiologic Channels | 40 | 32 | 24 | 16 | 8 |
| Digital GP Channels | 4 | 4 | 4 | 4 | 4 |
| Analog GP Channels | 4 | 3 | 2 | 2 | 1 |
| System | # Channels | fs (kHz) | Noise (RMS) | Functional Features |
|---|---|---|---|---|
| MADQ | 8–40 | 0.25 to 16.0 | 0.24–1.7 µV | Multimodal acquisition, high channel capacity, wide sampling range, low noise floor, customizable and free access. |
| OpenBCI Cyton | 8 | 0.25 | <1 µV | Wireless, compatible with open-source software, EEG-focused. |
| g.USBamp (g.tec) | 16 | Up to 38.4 | <0.2 µV | High precision, proprietary software, medically certified. |
| NeXus Q32 | 32 | Up to 4.0 | <0.8 µV | Multimodal acquisition, portable and stationary setups, medically certified. |
Disclaimer/Publisher’s Note: The statements, opinions and data contained in all publications are solely those of the individual author(s) and contributor(s) and not of MDPI and/or the editor(s). MDPI and/or the editor(s) disclaim responsibility for any injury to people or property resulting from any ideas, methods, instructions or products referred to in the content. |
© 2025 by the authors. Licensee MDPI, Basel, Switzerland. This article is an open access article distributed under the terms and conditions of the Creative Commons Attribution (CC BY) license (https://creativecommons.org/licenses/by/4.0/).
Share and Cite
Cevallos-Larrea, P.; Guambaña-Calle, L.; Molina-Vidal, D.A.; Castillo-Guerrero, M.; Netto, A.d.; Tierra-Criollo, C.J. Prototype of a Multimodal and Multichannel Electro-Physiological and General-Purpose Signal Capture System: Evaluation in Sleep-Research-like Scenario. Sensors 2025, 25, 2816. https://doi.org/10.3390/s25092816
Cevallos-Larrea P, Guambaña-Calle L, Molina-Vidal DA, Castillo-Guerrero M, Netto Ad, Tierra-Criollo CJ. Prototype of a Multimodal and Multichannel Electro-Physiological and General-Purpose Signal Capture System: Evaluation in Sleep-Research-like Scenario. Sensors. 2025; 25(9):2816. https://doi.org/10.3390/s25092816
Chicago/Turabian StyleCevallos-Larrea, Pablo, Leimer Guambaña-Calle, Danilo Andrés Molina-Vidal, Mathews Castillo-Guerrero, Aluizio d’Affonsêca Netto, and Carlos Julio Tierra-Criollo. 2025. "Prototype of a Multimodal and Multichannel Electro-Physiological and General-Purpose Signal Capture System: Evaluation in Sleep-Research-like Scenario" Sensors 25, no. 9: 2816. https://doi.org/10.3390/s25092816
APA StyleCevallos-Larrea, P., Guambaña-Calle, L., Molina-Vidal, D. A., Castillo-Guerrero, M., Netto, A. d., & Tierra-Criollo, C. J. (2025). Prototype of a Multimodal and Multichannel Electro-Physiological and General-Purpose Signal Capture System: Evaluation in Sleep-Research-like Scenario. Sensors, 25(9), 2816. https://doi.org/10.3390/s25092816