
RSA-PT: A Point Transformer-Based Semantic Segmentation Network for Uninterrupted Operation in a Distribution Network Scene

Abstract
1. Introduction
2. Related Work
2.1. Machine Learning
2.2. Deep Learning
2.3. Research on Distribution Network
3. Materials and Methods
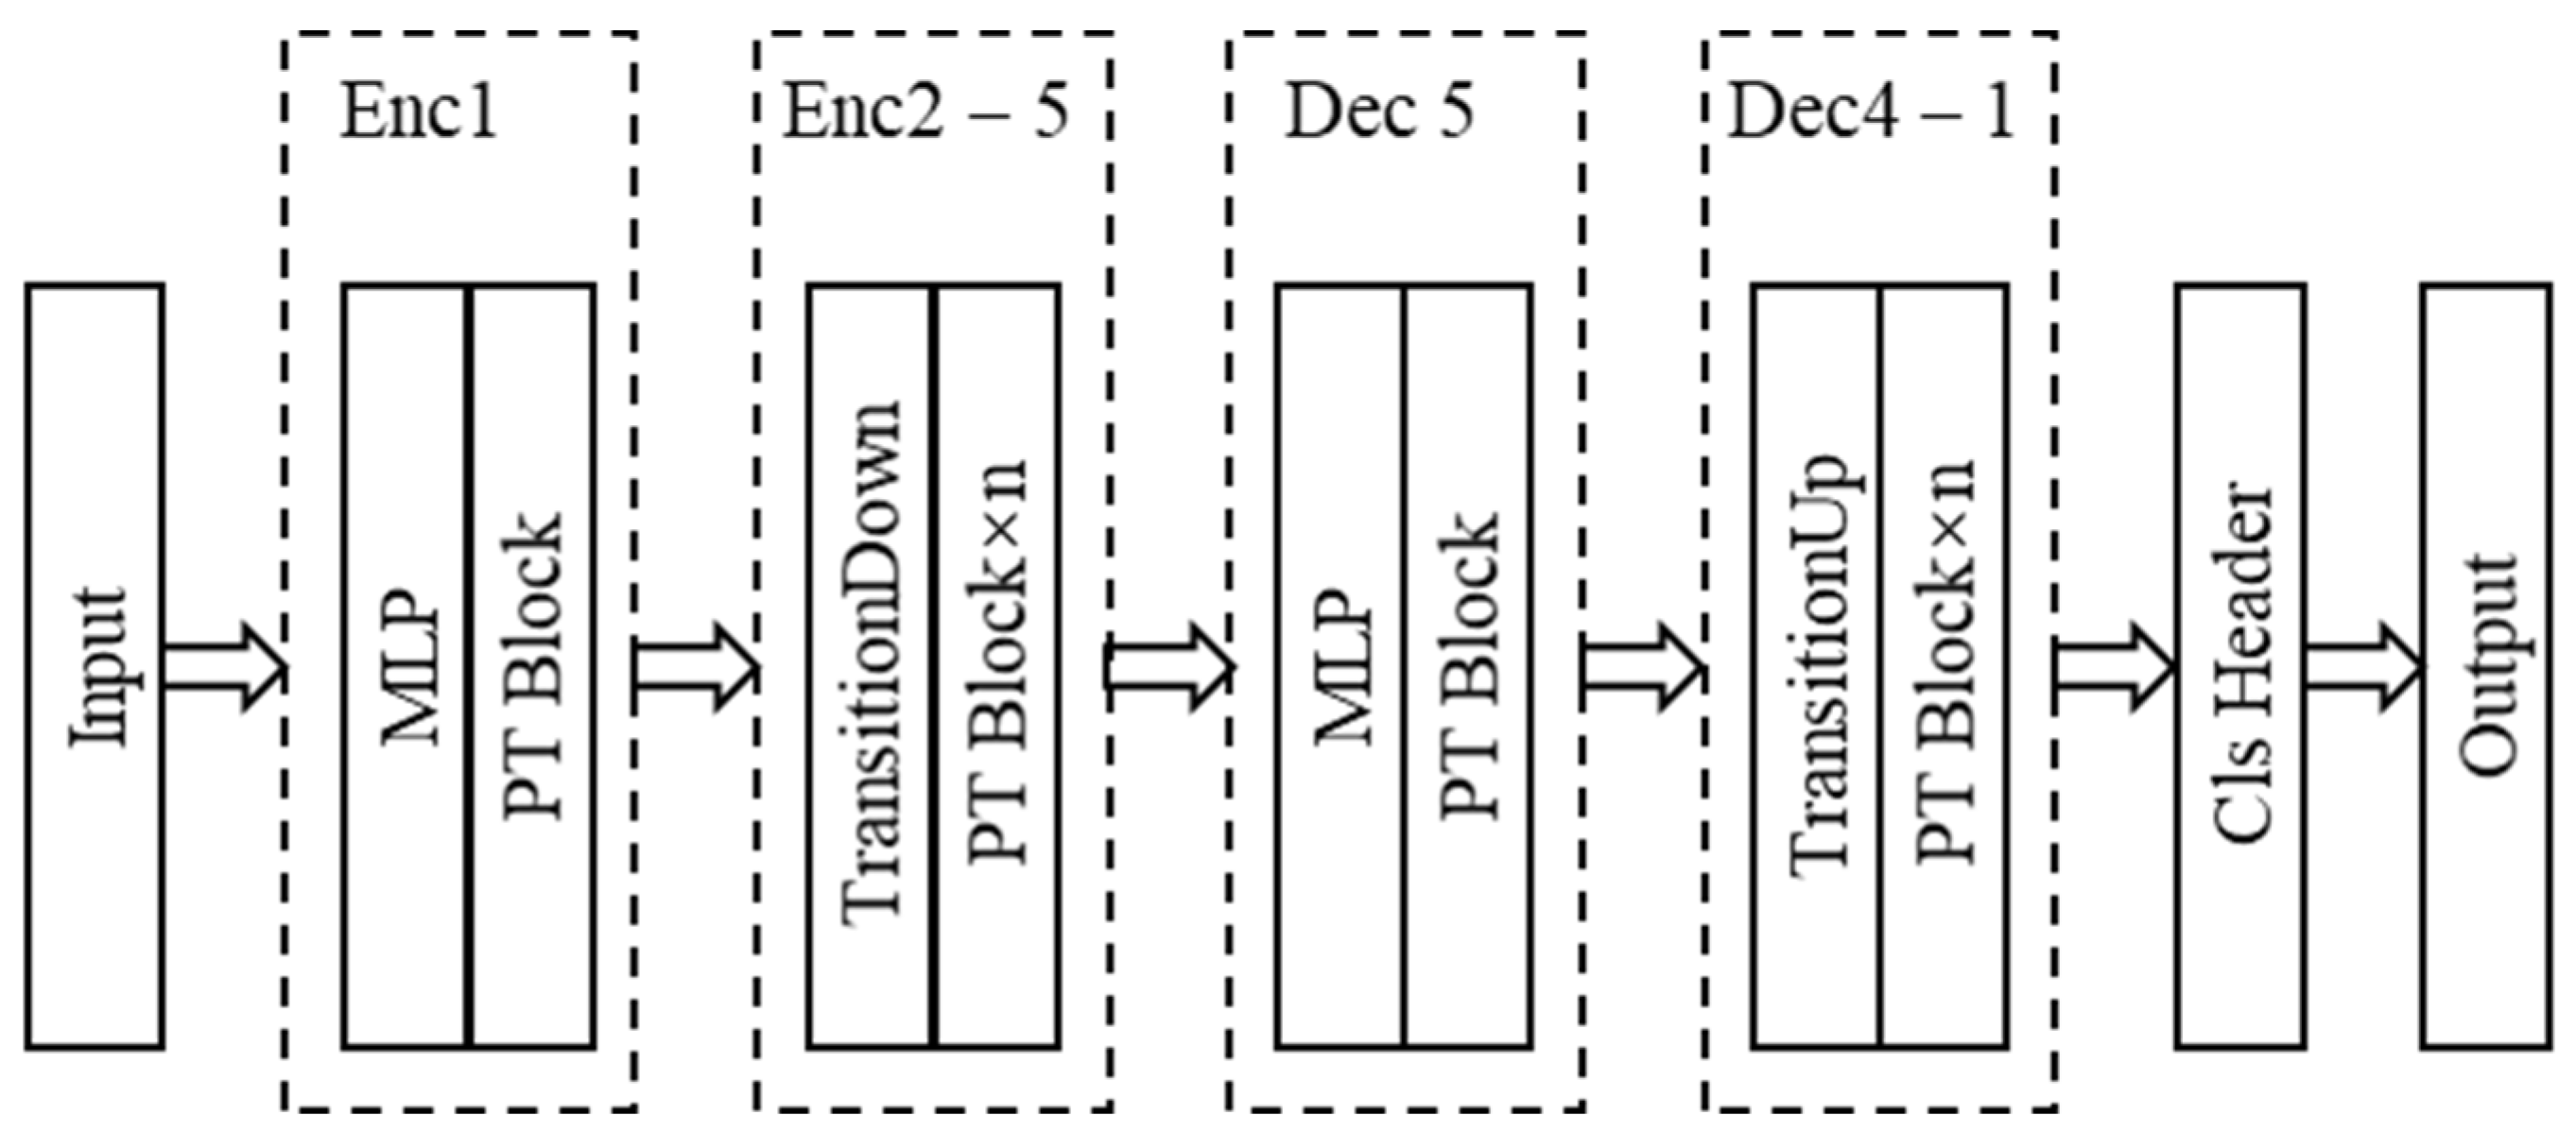
3.1. Baseline Model
3.2. Optimization Design
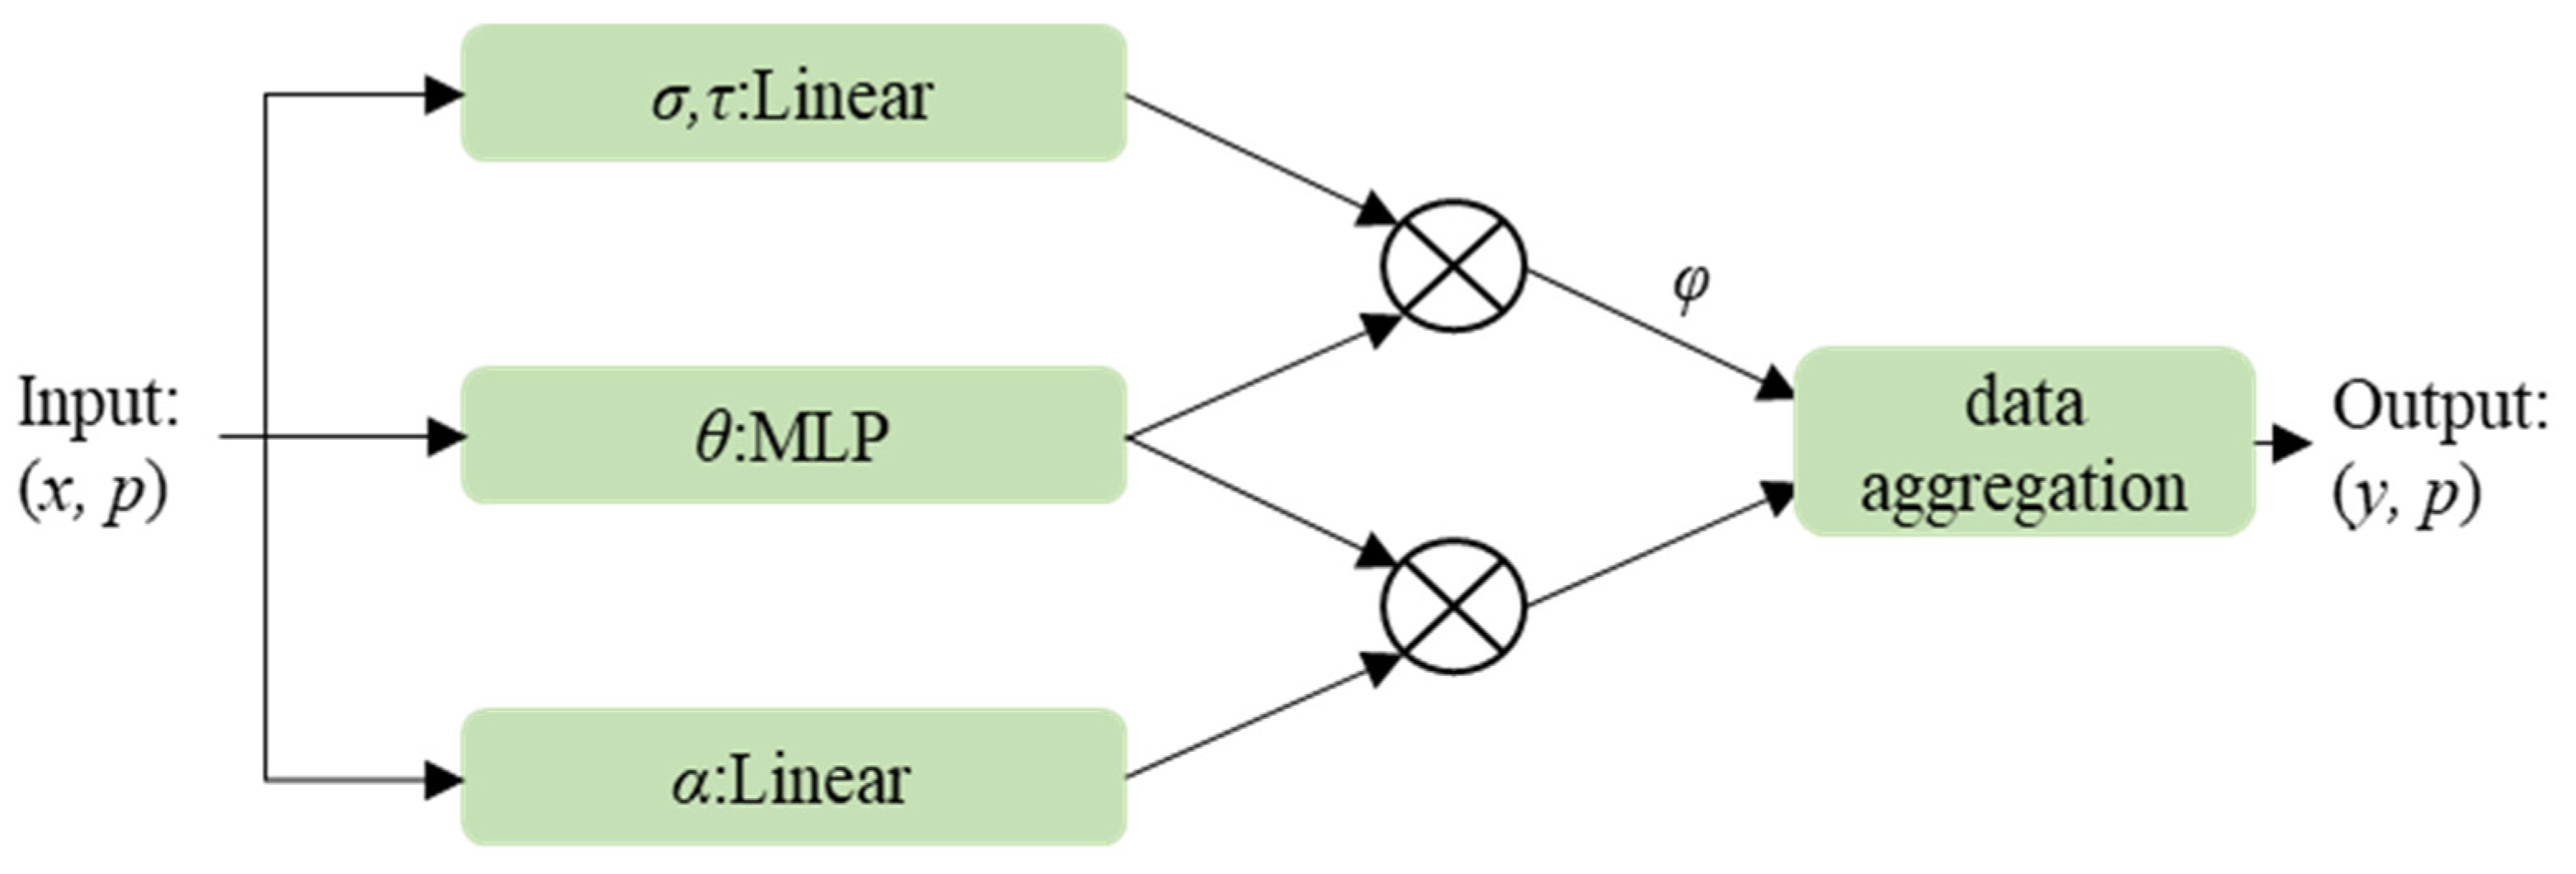
3.2.1. Residual Spatial Attention (RSA) Module
3.2.2. LogWeight Cross-Entropy Loss
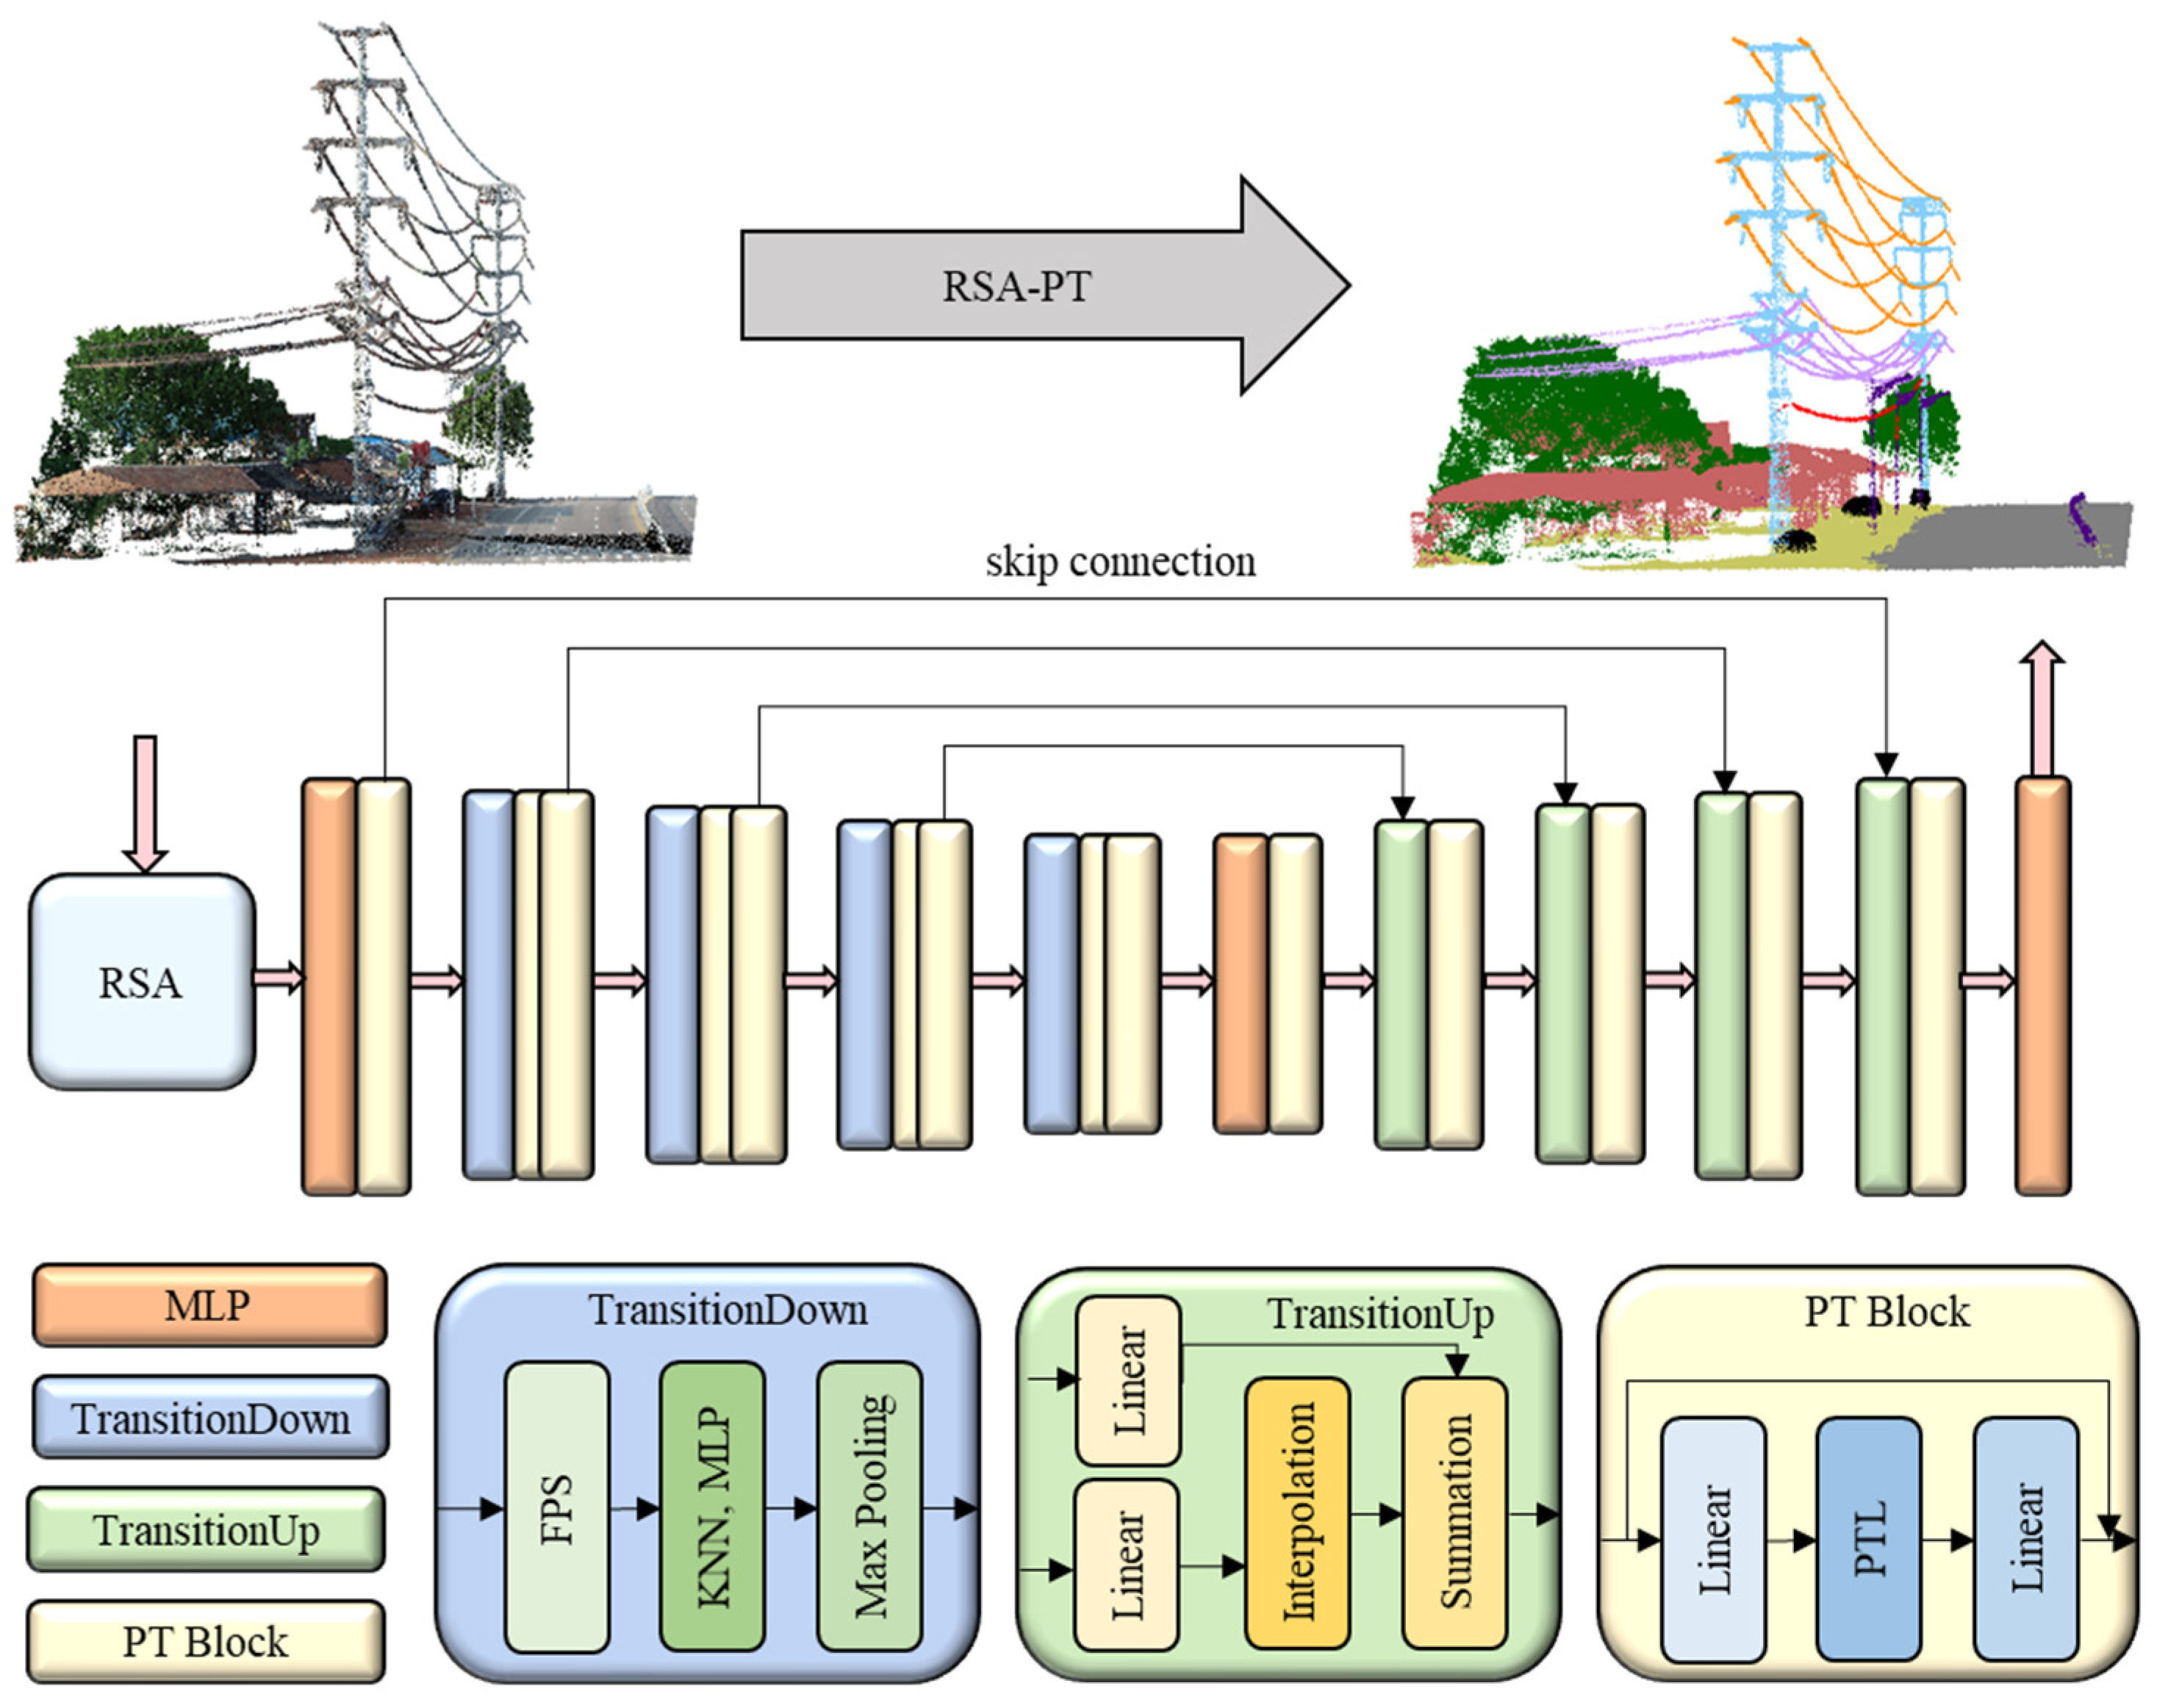
3.3. RSA-PT Architecture
4. Experiment
4.1. Dataset
4.2. Experimental Conditions
4.3. Indicators
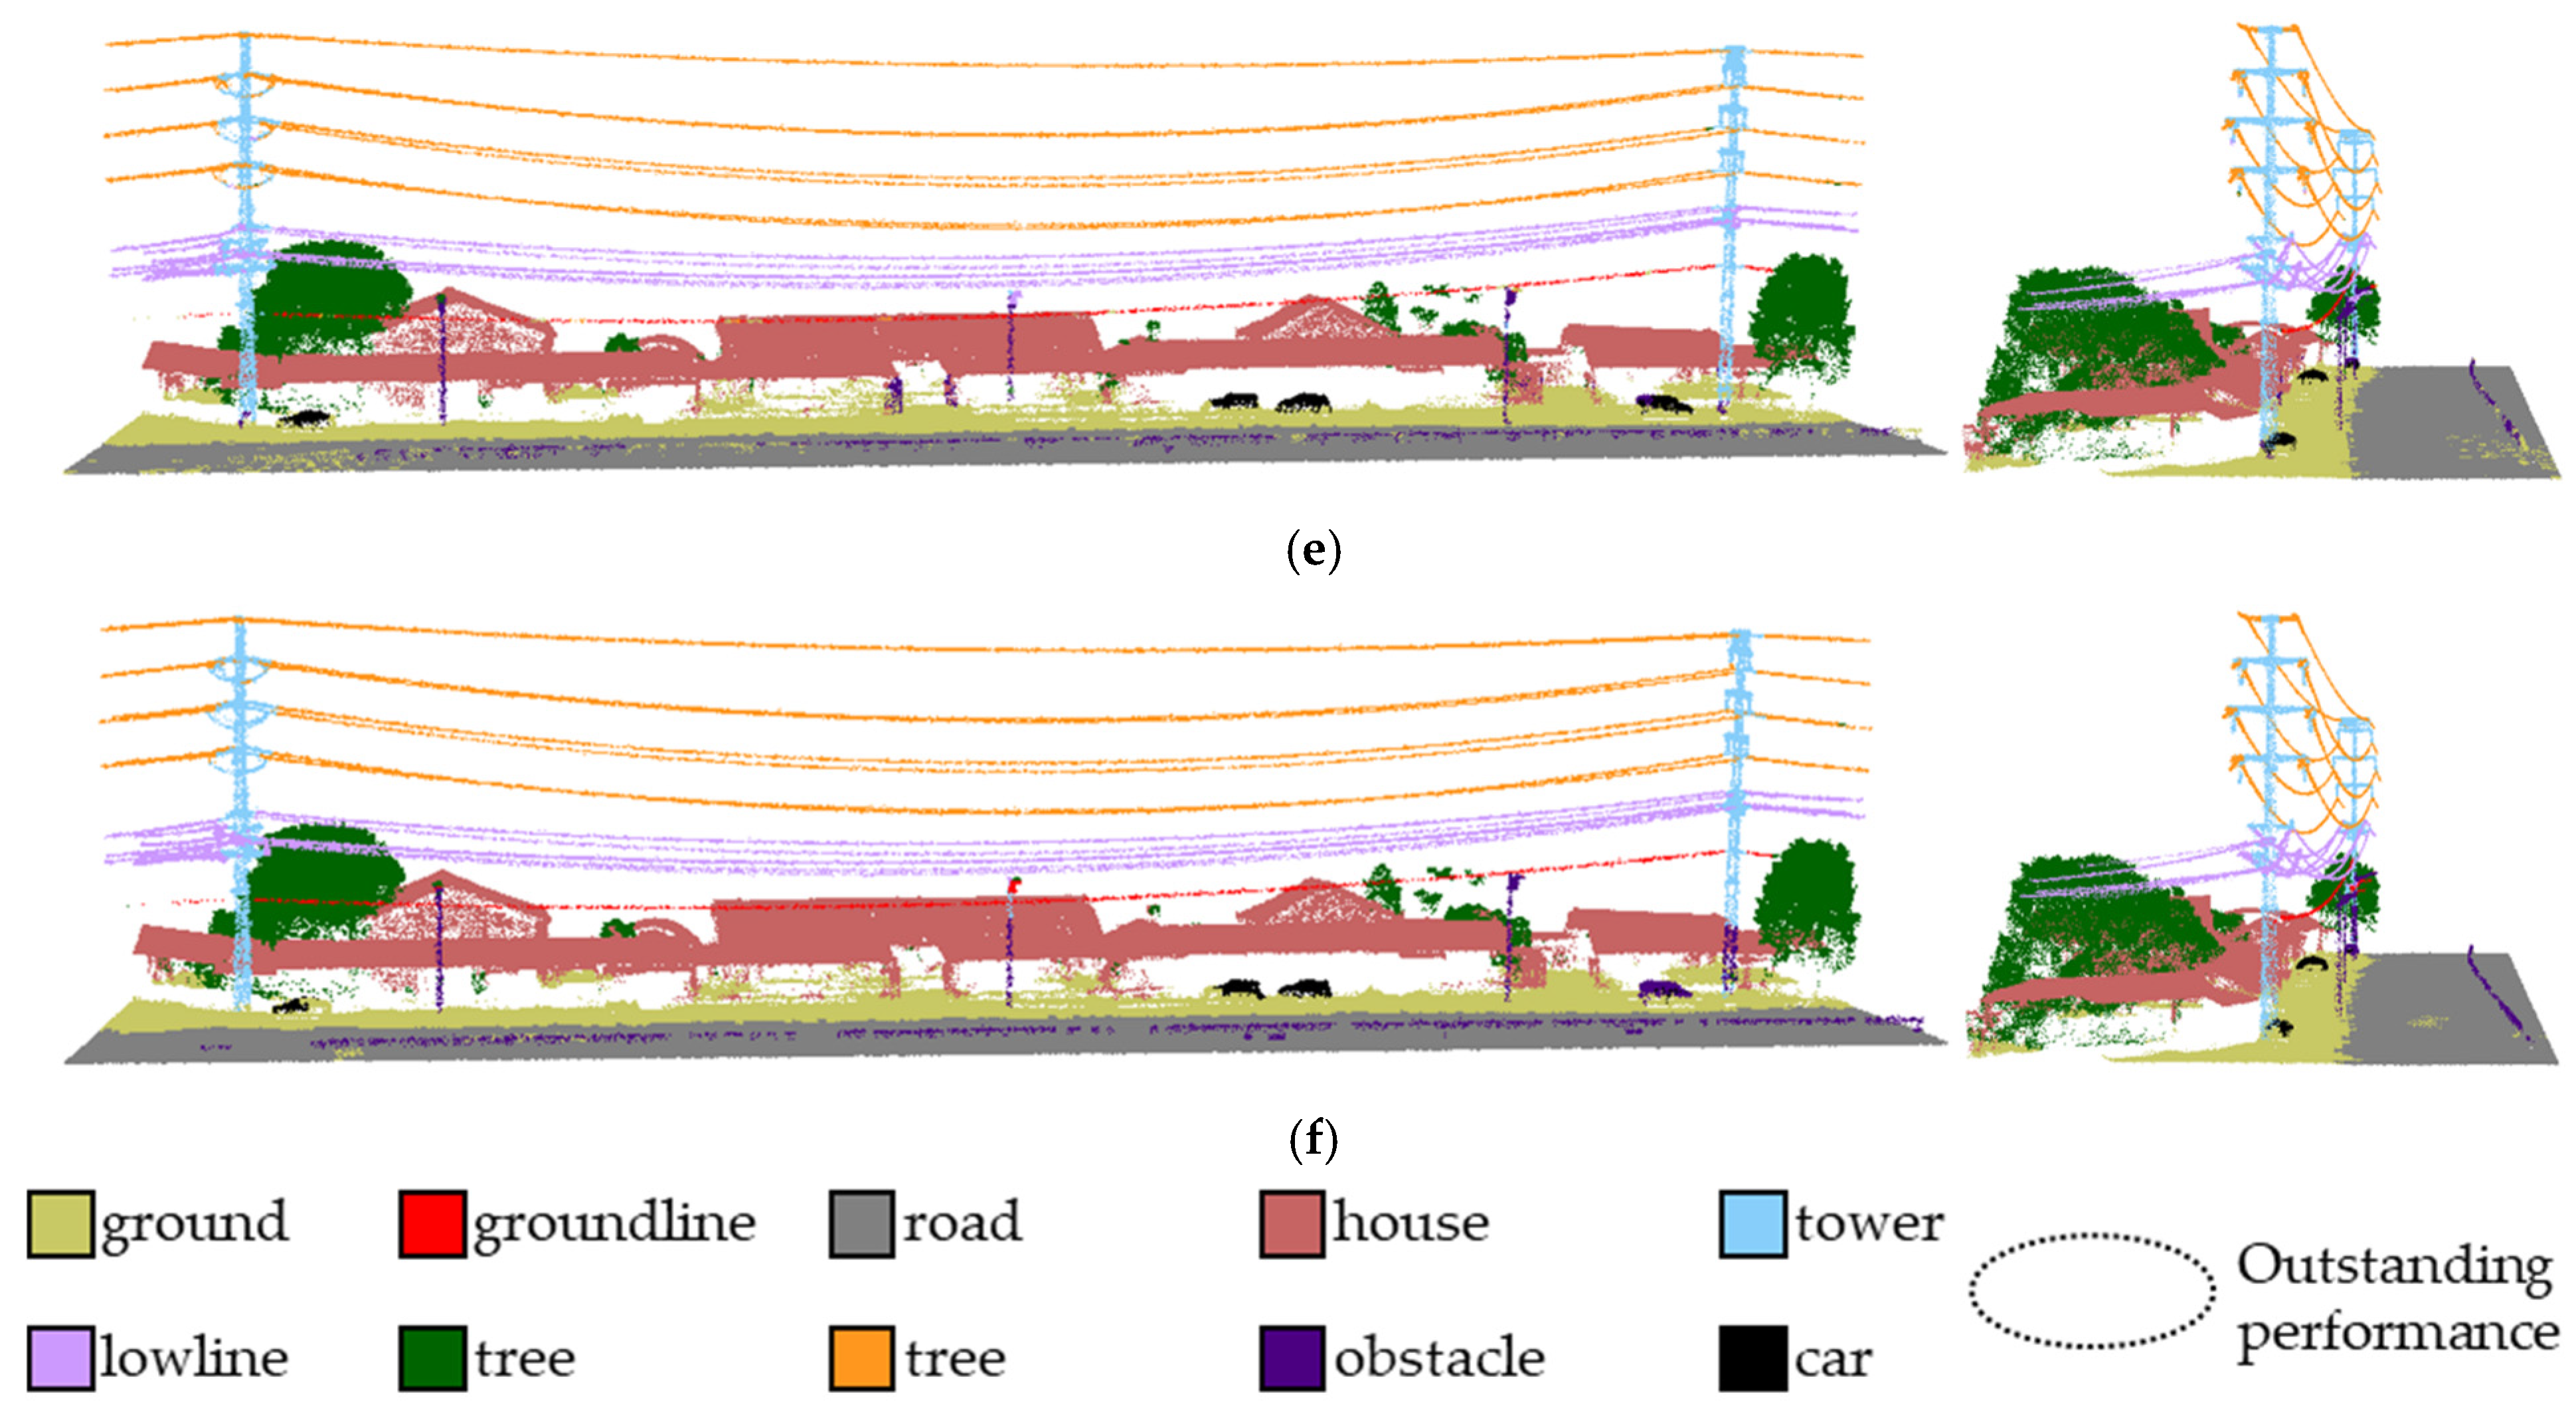
4.4. Results
5. Discussion
5.1. Ablation Experiment of a Single Module
5.2. Attention Mechanism Comparison Experiment
5.3. RSA Kernel Size Comparison Experiment
6. Conclusions
Author Contributions
Funding
Institutional Review Board Statement
Informed Consent Statement
Data Availability Statement
Conflicts of Interest
References
- Gauce, D.; Lektauers, A.; Solovjova, I.; Grants, R.; Kolosovs, D.; Litvinenko, A. Application of Digital Twin in Medium-Voltage Overhead Distribution Network Inspection. Remote Sens. 2023, 15, 489. [Google Scholar] [CrossRef]
- Barai, G.R.; Krishnan, S.; Venkatesh, B. Smart Metering and Functionalities of Smart Meters in Smart Grid—A Review. In Proceedings of the 2015 IEEE Electrical Power and Energy Conference (EPEC), London, ON, Canada, 26–28 October 2015; pp. 138–145. [Google Scholar]
- Kaštelan, N.; Vujović, I.; Krčum, M.; Assani, N. Switchgear Digitalization—Research Path, Status, and Future Work. Sensors 2022, 22, 7922. [Google Scholar] [CrossRef] [PubMed]
- Ghadi, M.J.; Ghavidel, S.; Rajabi, A.; Azizivahed, A.; Li, L.; Zhang, J. A Review on Economic and Technical Operation of Active Distribution Systems. Renew. Sustain. Energy Rev. 2019, 104, 38–53. [Google Scholar] [CrossRef]
- Gururajapathy, S.S.; Mokhlis, H.; Illias, H.A. Fault Location and Detection Techniques in Power Distribution Systems with Distributed Generation: A Review. Renew. Sustain. Energy Rev. 2017, 74, 949–958. [Google Scholar] [CrossRef]
- Al-Rawabdeh, A.; He, F.; Moussa, A.; El-Sheimy, N.; Habib, A. Using an Unmanned Aerial Vehicle-Based Digital Imaging System to Derive a 3D Point Cloud for Landslide Scarp Recognition. Remote Sens. 2016, 8, 95. [Google Scholar] [CrossRef]
- Xu, M.; Zhong, X.; Huang, J.; Ma, H.; Zhong, R. A Method for Accurately Extracting Power Lines and Identifying Potential Intrusion Risks from Urban Laser Scanning Data. Opt. Lasers Eng. 2024, 174, 107987. [Google Scholar] [CrossRef]
- Wan, D.; Zhao, M.; Zhou, H.; Qi, F.; Chen, X.; Liang, G. Analysis of UAV Patrol Inspection Technology Suitable for Distribution Lines. J. Phys. Conf. Ser. 2022, 2237, 012009. [Google Scholar] [CrossRef]
- Song, W.; Fan, Z.; Zhou, Q.; Wang, C.; Wang, D. Design of Auxiliary Robots for Distribution Network Uninterrupted Operation. J. Eng. 2019, 2019, 8556–8560. [Google Scholar] [CrossRef]
- Nguyen, V.N.; Jenssen, R.; Roverso, D. Automatic Autonomous Vision-Based Power Line Inspection: A Review of Current Status and the Potential Role of Deep Learning. Int. J. Electr. Power Energy Syst. 2018, 99, 107–120. [Google Scholar] [CrossRef]
- Guo, Y.; Wang, H.; Hu, Q.; Liu, H.; Liu, L.; Bennamoun, M. Deep Learning for 3D Point Clouds: A Survey. IEEE Trans. Pattern Anal. Mach. Intell. 2021, 43, 4338–4364. [Google Scholar] [CrossRef]
- Zhao, H.; Jiang, L.; Jia, J.; Torr, P.H.S.; Koltun, V. Point Transformer. In Proceedings of the IEEE/CVF International Conference on Computer Vision (ICCV), Montreal, QC, Canada, 10–17 October 2021; pp. 16259–16268. [Google Scholar]
- Bello, S.A.; Yu, S.; Wang, C.; Adam, J.M.; Li, J. Review: Deep Learning on 3D Point Clouds. Remote Sens. 2020, 12, 1729. [Google Scholar] [CrossRef]
- Zhang, J.; Lin, X.; Ning, X. SVM-Based Classification of Segmented Airborne LiDAR Point Clouds in Urban Areas. Remote Sens. 2013, 5, 3749–3775. [Google Scholar] [CrossRef]
- Xue, D.; Cheng, Y.; Shi, X.; Fei, Y.; Wen, P. An Improved Random Forest Model Applied to Point Cloud Classification. IOP Conf. Ser. Mater. Sci. Eng. 2020, 768, 072037. [Google Scholar] [CrossRef]
- Cao, C.; Preda, M.; Zaharia, T. 3D Point Cloud Compression: A Survey. In Proceedings of the 24th International Conference on 3D Web Technology, Los Angeles, CA, USA, 26–28 July 2019; Association for Computing Machinery: New York, NY, USA, 2019; pp. 1–9. [Google Scholar]
- Te, G.; Hu, W.; Zheng, A.; Guo, Z. RGCNN: Regularized Graph CNN for Point Cloud Segmentation. In Proceedings of the 26th ACM International Conference on Multimedia, Seoul, Republic of Korea, 22–26 October 2018; Association for Computing Machinery: New York, NY, USA, 2018; pp. 746–754. [Google Scholar]
- Meng, H.-Y.; Gao, L.; Lai, Y.-K.; Manocha, D. VV-Net: Voxel VAE Net with Group Convolutions for Point Cloud Segmentation. In Proceedings of the IEEE/CVF International Conference on Computer Vision, Seoul, Republic of Korea, 27–28 October 2019; pp. 8500–8508. [Google Scholar]
- Alnaggar, Y.A.; Afifi, M.; Amer, K.; ElHelw, M. Multi Projection Fusion for Real-Time Semantic Segmentation of 3D LiDAR Point Clouds. In Proceedings of the 2021 IEEE Winter Conference on Applications of Computer Vision (WACV 2021), Virtual, 5–9 January 2021; pp. 1800–1809. [Google Scholar]
- Qi, C.R.; Su, H.; Mo, K.; Guibas, L.J. PointNet: Deep Learning on Point Sets for 3D Classification and Segmentation. In Proceedings of the IEEE Conference on Computer Vision and Pattern Recognition, Honolulu, HI, USA, 21–26 July 2017; pp. 652–660. [Google Scholar]
- Qi, C.R.; Yi, L.; Su, H.; Guibas, L.J. PointNet++: Deep Hierarchical Feature Learning on Point Sets in a Metric Space. Adv. Neural Inf. Process. Syst. 2017, 30, 5105–5114. [Google Scholar]
- Tang, H.; Liu, Z.; Li, X.; Lin, Y.; Han, S. TorchSparse: Efficient Point Cloud Inference Engine. Proc. Mach. Learn. Syst. 2022, 4, 302–315. [Google Scholar]
- Graham, B.; Engelcke, M.; van der Maaten, L. 3D Semantic Segmentation with Submanifold Sparse Convolutional Networks. In Proceedings of the IEEE Conference on Computer Vision and Pattern Recognition, Salt Lake City, UT, USA, 18–23 June 2018; pp. 9224–9232. [Google Scholar]
- Li, Y.; Bu, R.; Sun, M.; Wu, W.; Di, X.; Chen, B. PointCNN: Convolution On X-Transformed Points. Adv. Neural Inf. Process. Syst. 2018, 31, 820–830. [Google Scholar]
- Wang, Y. DGCNN: Learning Point Cloud Representations by Dynamic Graph CNN. Master’s Thesis, Massachusetts Institute of Technology, Cambridge, MA, USA, 2020. [Google Scholar]
- Tian, Z.; Cui, J.; Jiang, L.; Qi, X.; Lai, X.; Chen, Y.; Liu, S.; Jia, J. Learning Context-Aware Classifier for Semantic Segmentation. Proc. AAAI Conf. Artif. Intell. 2023, 37, 2438–2446. [Google Scholar] [CrossRef]
- Yu, H.; Wang, Z.; Zhou, Q.; Ma, Y.; Wang, Z.; Liu, H.; Ran, C.; Wang, S.; Zhou, X.; Zhang, X. Deep-Learning-Based Semantic Segmentation Approach for Point Clouds of Extra-High-Voltage Transmission Lines. Remote Sens. 2023, 15, 2371. [Google Scholar] [CrossRef]
- Wang, G.; Wang, L.; Wu, S.; Zu, S.; Song, B. Semantic Segmentation of Transmission Corridor 3D Point Clouds Based on CA-PointNet++. Electronics 2023, 12, 2829. [Google Scholar] [CrossRef]
- Han, L.; Song, B.; Wu, S.; Nie, D.; Chen, Z.; Wang, L. Semantic Segmentation of Distribution Network Point Clouds Based on NF-PTV2. Electronics 2025, 14, 812. [Google Scholar] [CrossRef]
- Armeni, I.; Sener, O.; Zamir, A.R.; Jiang, H.; Brilakis, I.; Fischer, M.; Savarese, S. 3D Semantic Parsing of Large-Scale Indoor Spaces. In Proceedings of the IEEE Conference on Computer Vision and Pattern Recognition, Las Vegas, NV, USA, 27–30 June 2016; pp. 1534–1543. [Google Scholar]
- Wu, W.; Liu, S.; Xia, Y.; Zhang, Y. Dual Residual Attention Network for Image Denoising. Pattern Recognit. 2024, 149, 110291. [Google Scholar] [CrossRef]
- Pointcept Contributors, 2023. Pointcept: A Codebase for Point Cloud Perception Research. Github. Available online: https://github.com/Pointcept/Pointcept (accessed on 31 March 2025).


| Dataset | The Number of Points | |||||||||
|---|---|---|---|---|---|---|---|---|---|---|
| Highline | Lowline | Groundline | Tower | Ground | Road | House | Tree | Obstacle | Car | |
| All | 251,492 | 887,017 | 24,140 | 748,639 | 19,296,511 | 10,154,856 | 8,912,154 | 19,616,119 | 632,100 | 450,739 |
| All (average) | 13,658 | 19,711 | 1609 | 16,636 | 428,811 | 225,663 | 212,194 | 445,820 | 19,753 | 13,658 |
| Validation | 53,901 | 142,491 | 4735 | 129,317 | 2,724,724 | 2,082,916 | 2,269,804 | 2,534,364 | 37,703 | 62,646 |
| Validation (average) | 26,950 | 20,355 | 1578 | 18,473 | 389,246 | 297,559 | 378,300 | 362,052 | 6283 | 10,441 |
| Configuration | Version |
|---|---|
| CPU | 12th Gen Intel(R) core (TM) i5-12400F |
| GPU | NVIDIA GeForce RTX 4080 |
| Operating system | Linux = 6.8 |
| Python | 3.8.19 |
| CUDA | 11.7 |
| Parameter | Value |
|---|---|
| Grid size | 0.6 |
| Kernel size of RSA | 3 |
| Batch size | 2 |
| Epoch | 300 |
| Learning rate | 0.006 |
| Decay weight | 0.05 |
| Model | IoU | mIoU | mA | OA | |||||||||
|---|---|---|---|---|---|---|---|---|---|---|---|---|---|
| Highline | Lowline | Groundline | Tower | Ground | Road | House | Tree | Obstacle | Car | ||||
| Minkunet | 89.10 | 78.76 | 86.87 | 86.84 | 76.10 | 86.35 | 97.70 | 88.03 | 45.40 | 76.98 | 82.21 | 90.82 | 95.78 |
| Spunet | 89.96 | 87.89 | 88.53 | 96.53 | 68.10 | 82.91 | 97.36 | 87.36 | 42.89 | 82.32 | 82.38 | 89.25 | 95.95 |
| Point Transformer | 96.72 | 95.26 | 88.30 | 86.94 | 87.18 | 83.24 | 96.77 | 98.15 | 50.48 | 56.16 | 83.92 | 88.39 | 95.27 |
| RSA-PT (ours) | 96.41 | 96.01 | 93.89 | 93.10 | 92.21 | 93.10 | 97.38 | 98.17 | 67.70 | 79.23 | 90.55 | 94.20 | 97.20 |
| Module | IoU | mIoU | mA | OA | |||||||||
|---|---|---|---|---|---|---|---|---|---|---|---|---|---|
| Highline | Lowline | Groundline | Tower | Ground | Road | House | Tree | Obstacle | Car | ||||
| Point Transformer | 96.58 ± 0.25 | 95.06 ± 0.29 | 88.37 ± 1.34 | 86.63 ± 1.45 | 86.84 ± 1.16 | 83.14 ± 1.40 | 96.62 ± 0.25 | 98.02 ±0.19 | 50.27 ± 1.43 | 56.02 ± 2.06 | 83.41 ± 1.71 | 88.39 ± 1.68 | 95.15 ± 0.82 |
| +RSA | 97.31 ± 0.64 | 93.81 ± 0.68 | 86.47 ± 1.42 | 92.17 ± 1.16 | 88.30 ± 1.44 | 85.43 ± 1.59 | 96.39 ± 0.58 | 97.80 ±0.44 | 70.03 ± 1.95 | 72.58 ± 1.72 | 88.23 ± 1.39 | 91.77 ± 1.58 | 95.70 ± 0.66 |
| +Loss | 90.65 ± 0.63 | 94.56 ± 0.77 | 92.42 ± 1.09 | 87.56 ± 1.52 | 91.43 ± 1.07 | 90.54 ± 1.34 | 96.82 ± 0.68 | 97.74 ±0.57 | 64.45 ± 1.59 | 70.36 ± 1.53 | 87.63 ± 1.30 | 92.18 ± 1.22 | 96.62 ± 0.70 |
| RSA-PT (ours) | 96.47 ± 0.38 | 96.16 ± 0.38 | 93.75 ± 0.50 | 93.08 ± 0.56 | 92.16 ± 0.68 | 93.24 ± 0.52 | 97.39 ± 0.46 | 98.08 ± 0.34 | 67.54 ± 1.24 | 79.17 ± 1.31 | 90.05 ± 0.82 | 94.18 ± 0.56 | 97.11 ± 0.48 |
| Module | IoU | mIoU | mA | OA | |||||||||
|---|---|---|---|---|---|---|---|---|---|---|---|---|---|
| Highline | Lowline | Groundline | Tower | Ground | Road | House | Tree | Obstacle | Car | ||||
| RSA | 0.73 | −1.25 | −1.90 | 5.54 | 1.46 | 2.29 | −0.23 | −0.22 | 19.76 | 16.56 | 4.82 | 3.38 | 0.55 |
| Loss | −5.93 | −0.5 | 4.05 | 0.93 | 4.59 | 7.40 | 0.20 | −0.28 | 14.18 | 14.34 | 4.22 | 3.79 | 1.47 |
| RSA-PT | −0.11 | 1.10 | 5.38 | 6.45 | 5.32 | 10.10 | 0.77 | 0.06 | 17.27 | 23.15 | 6.64 | 5.79 | 1.96 |
| Attention | IoU | mIoU | mA | OA | |||||||||
|---|---|---|---|---|---|---|---|---|---|---|---|---|---|
| Highline | Lowline | Groundline | Tower | Ground | Road | House | Tree | Obstacle | Car | ||||
| Base | 96.58 ± 0.25 | 95.06 ± 0.29 | 88.37 ± 1.34 | 86.63 ± 1.45 | 86.84 ± 1.16 | 83.14 ± 1.40 | 96.62 ± 0.25 | 98.02 ± 0.19 | 50.27 ± 1.43 | 56.02 ± 2.06 | 83.41 ± 1.71 | 88.39 ± 1.68 | 95.15 ± 0.82 |
| CA | 89.86 ± 0.92 | 69.70 ± 1.35 | 88.64 ± 1.23 | 95.54 ± 0.98 | 92.30 ± 0.89 | 94.30 ± 0.85 | 97.64 ± 0.58 | 96.66 ± 0.72 | 65.31 ± 1.45 | 65.81 ± 1.56 | 85.62 ± 1.42 | 88.97 ± 1.23 | 96.45 ± 0.49 |
| SA | 86.68 ± 0.95 | 91.82 ± 0.60 | 83.41 ± 1.15 | 92.84 ± 0.72 | 89.82 ± 0.92 | 93.36 ± 0.80 | 97.48 ± 0.48 | 90.54 ± 0.68 | 54.78 ± 1.07 | 71.12 ± 1.23 | 85.87 ± 0.92 | 91.65 ± 0.72 | 96.05 ± 0.40 |
| CBAM | 89.07 ± 0.55 | 88.68 ± 0.85 | 86.48 ± 0.92 | 96.54 ± 0.34 | 86.15 ± 0.92 | 95.79 ± 0.60 | 97.38 ± 0.34 | 83.44 ± 0.72 | 51.78 ± 1.95 | 70.59 ± 1.15 | 84.76 ± 0.92 | 91.52 ± 0.68 | 95.89 ± 0.40 |
| SE | 90.60 ± 0.55 | 89.20 ± 0.72 | 89.43 ± 0.80 | 95.59 ± 0.48 | 84.83 ± 0.80 | 93.85 ± 0.68 | 97.63 ± 0.38 | 91.59 ± 0.72 | 45.64 ± 1.92 | 62.12 ± 1.15 | 84.11 ± 0.92 | 91.00 ± 0.85 | 96.05 ± 0.55 |
| RSA | 97.31 ± 0.64 | 93.81 ± 0.68 | 86.47 ± 1.42 | 92.17 ± 1.16 | 88.30 ± 1.44 | 85.43 ± 1.59 | 96.39 ± 0.58 | 97.80 ± 0.44 | 70.03 ± 1.95 | 72.58 ± 1.72 | 88.23 ± 1.39 | 91.77 ± 1.58 | 95.70 ± 0.66 |
| Kernel Size | IoU | mIoU | mA | OA | |||||||||
|---|---|---|---|---|---|---|---|---|---|---|---|---|---|
| Highline | Lowline | Groundline | Tower | Ground | Road | House | Tree | Obatacle | Car | ||||
| 1 × 1 | 92.42 ± 0.85 | 88.57 ± 0.92 | 91.47 ± 0.85 | 96.05 ± 0.87 | 91.18 ± 1.01 | 94.99 ± 0.73 | 97.94 ± 0.31 | 86.00 ± 1.72 | 56.05 ± 1.95 | 55.31 ± 2.45 | 86.75 ± 1.56 | 91.25 ± 0.89 | 97.06 ± 0.45 |
| 3 × 3 (ours) | 96.47 ± 0.38 | 96.16 ± 0.38 | 93.75 ± 0.50 | 93.08 ± 0.56 | 92.16 ± 0.68 | 93.24 ± 0.52 | 97.39 ± 0.46 | 98.08 ± 0.34 | 67.54 ± 1.24 | 79.17 ± 1.31 | 90.05 ± 0.82 | 94.18 ± 0.56 | 97.11 ± 0.48 |
| 5 × 5 | 91.24 ± 0.85 | 90.07 ± 0.92 | 90.03 ± 1.15 | 96.81 ± 0.98 | 86.37 ± 1.45 | 97.14 ± 1.23 | 97.94 ± 0.41 | 86.10 ± 1.02 | 64.32 ± 1.95 | 74.07 ± 2.05 | 86.75 ± 1.46 | 92.20 ± 0.89 | 97.34 ± 0.45 |
| 7 × 7 | 86.23 ± 0.92 | 94.26 ± 0.65 | 82.26 ± 1.16 | 96.56 ± 0.63 | 85.12 ± 1.72 | 94.28 ± 1.45 | 98.04 ± 0.45 | 85.17 ± 1.67 | 70.40 ± 2.12 | 65.41 ± 2.34 | 85.47 ± 1.72 | 90.72 ± 0.78 | 95.10 ± 0.89 |
Disclaimer/Publisher’s Note: The statements, opinions and data contained in all publications are solely those of the individual author(s) and contributor(s) and not of MDPI and/or the editor(s). MDPI and/or the editor(s) disclaim responsibility for any injury to people or property resulting from any ideas, methods, instructions or products referred to in the content. |
© 2025 by the authors. Licensee MDPI, Basel, Switzerland. This article is an open access article distributed under the terms and conditions of the Creative Commons Attribution (CC BY) license (https://creativecommons.org/licenses/by/4.0/).
Share and Cite
Nie, D.; Wang, L.; Wu, S.; Chen, Z.; Li, Y.; Song, B. RSA-PT: A Point Transformer-Based Semantic Segmentation Network for Uninterrupted Operation in a Distribution Network Scene. Sensors 2025, 25, 2370. https://doi.org/10.3390/s25082370
Nie D, Wang L, Wu S, Chen Z, Li Y, Song B. RSA-PT: A Point Transformer-Based Semantic Segmentation Network for Uninterrupted Operation in a Distribution Network Scene. Sensors. 2025; 25(8):2370. https://doi.org/10.3390/s25082370
Chicago/Turabian StyleNie, Deyu, Linong Wang, Shaocheng Wu, Zhenyang Chen, Yongwen Li, and Bin Song. 2025. "RSA-PT: A Point Transformer-Based Semantic Segmentation Network for Uninterrupted Operation in a Distribution Network Scene" Sensors 25, no. 8: 2370. https://doi.org/10.3390/s25082370
APA StyleNie, D., Wang, L., Wu, S., Chen, Z., Li, Y., & Song, B. (2025). RSA-PT: A Point Transformer-Based Semantic Segmentation Network for Uninterrupted Operation in a Distribution Network Scene. Sensors, 25(8), 2370. https://doi.org/10.3390/s25082370