
EEG Signal Prediction for Motor Imagery Classification in Brain–Computer Interfaces

 , , and
Abstract
1. Introduction
2. Materials and Methods
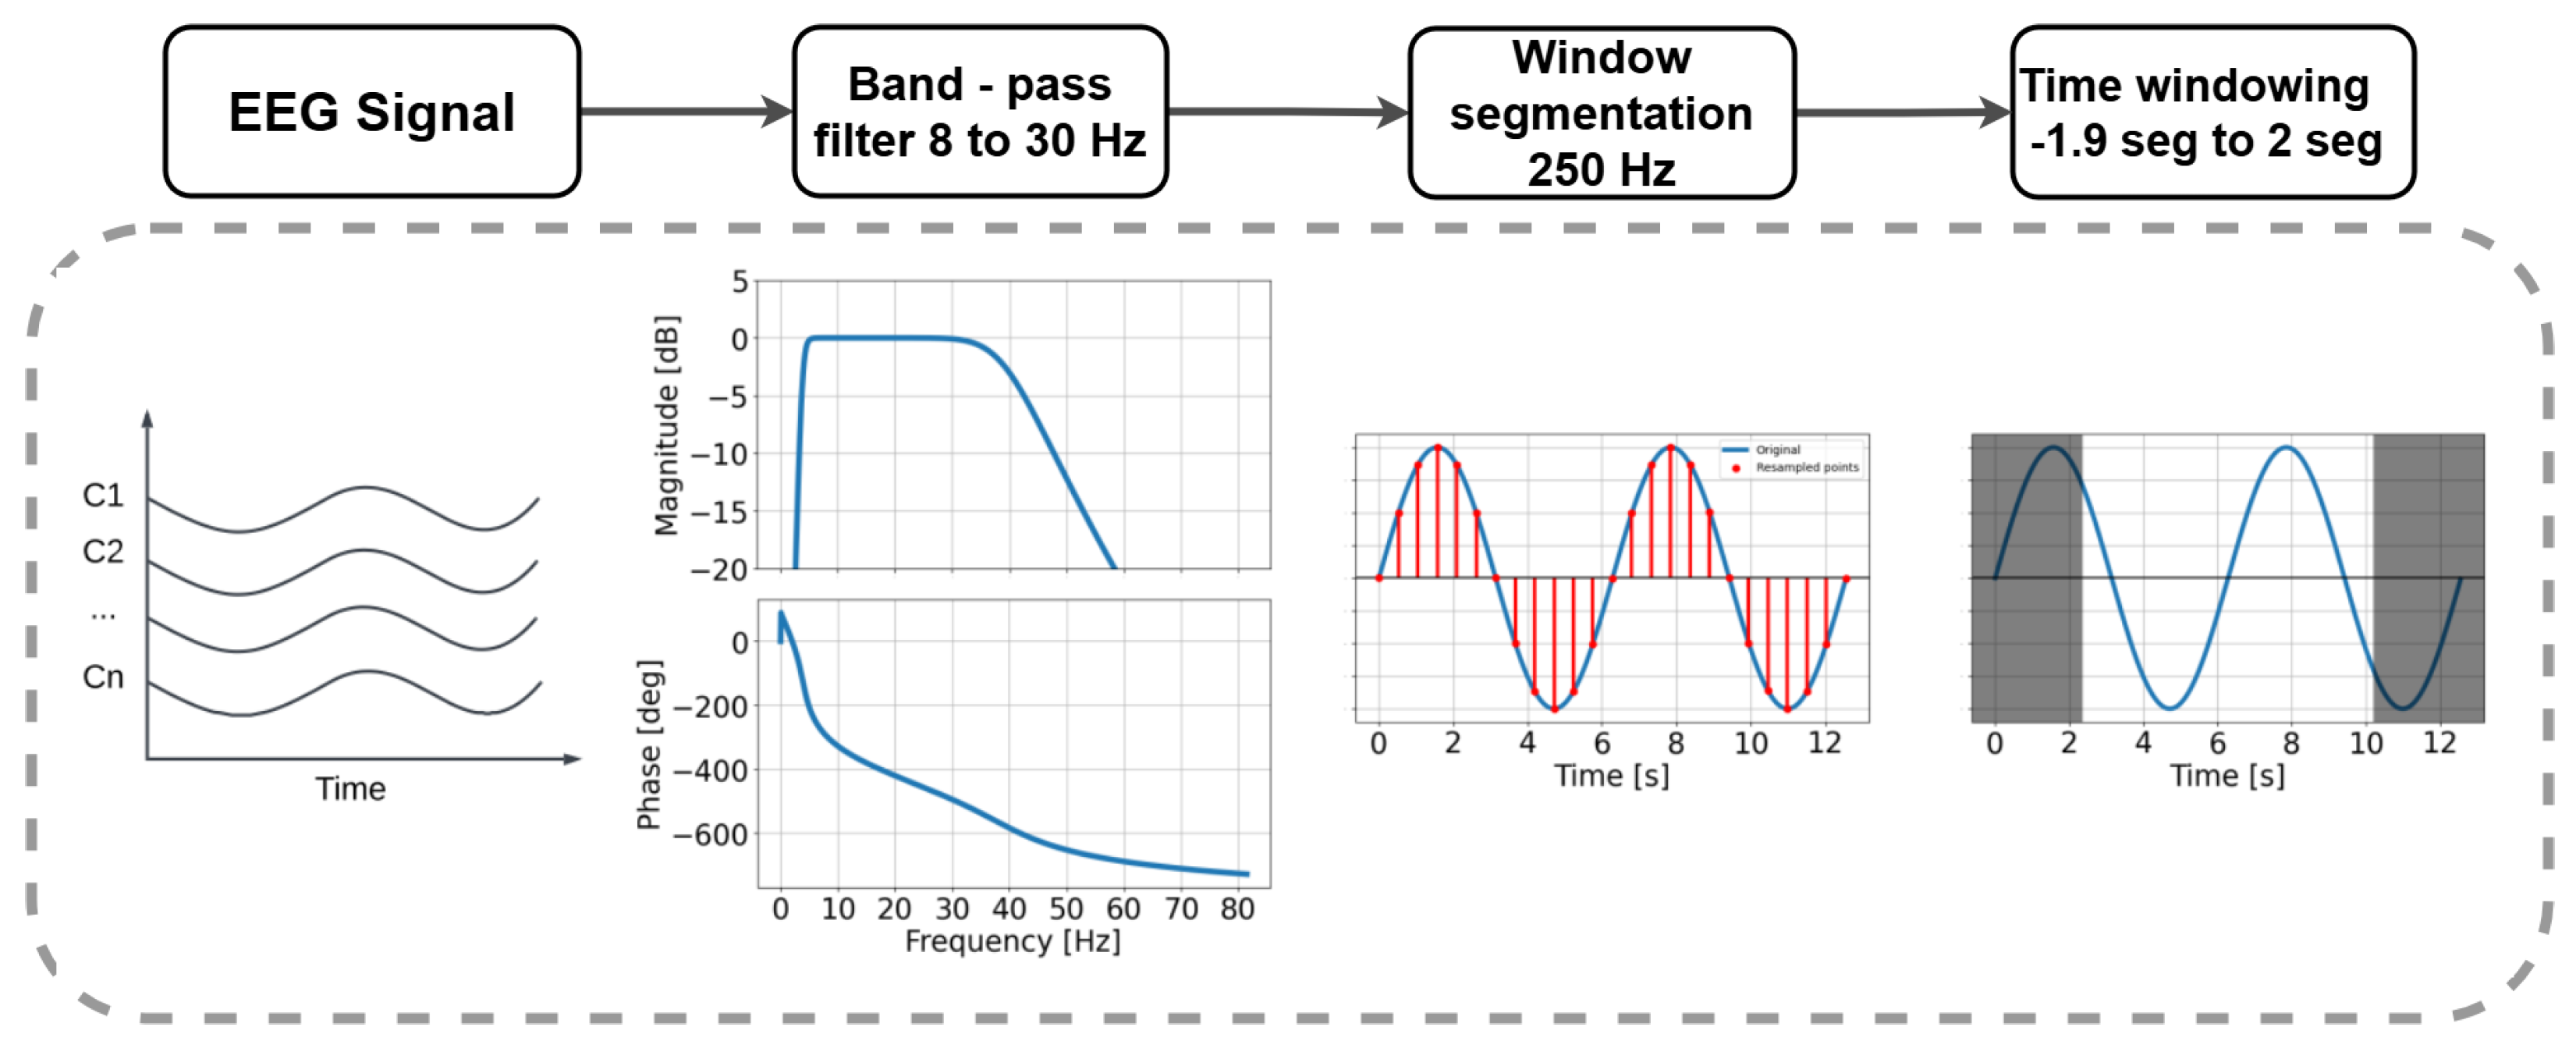
2.1. Signal Processing
2.2. Elastic Net
2.3. Common Spatial Pattern (CSP)
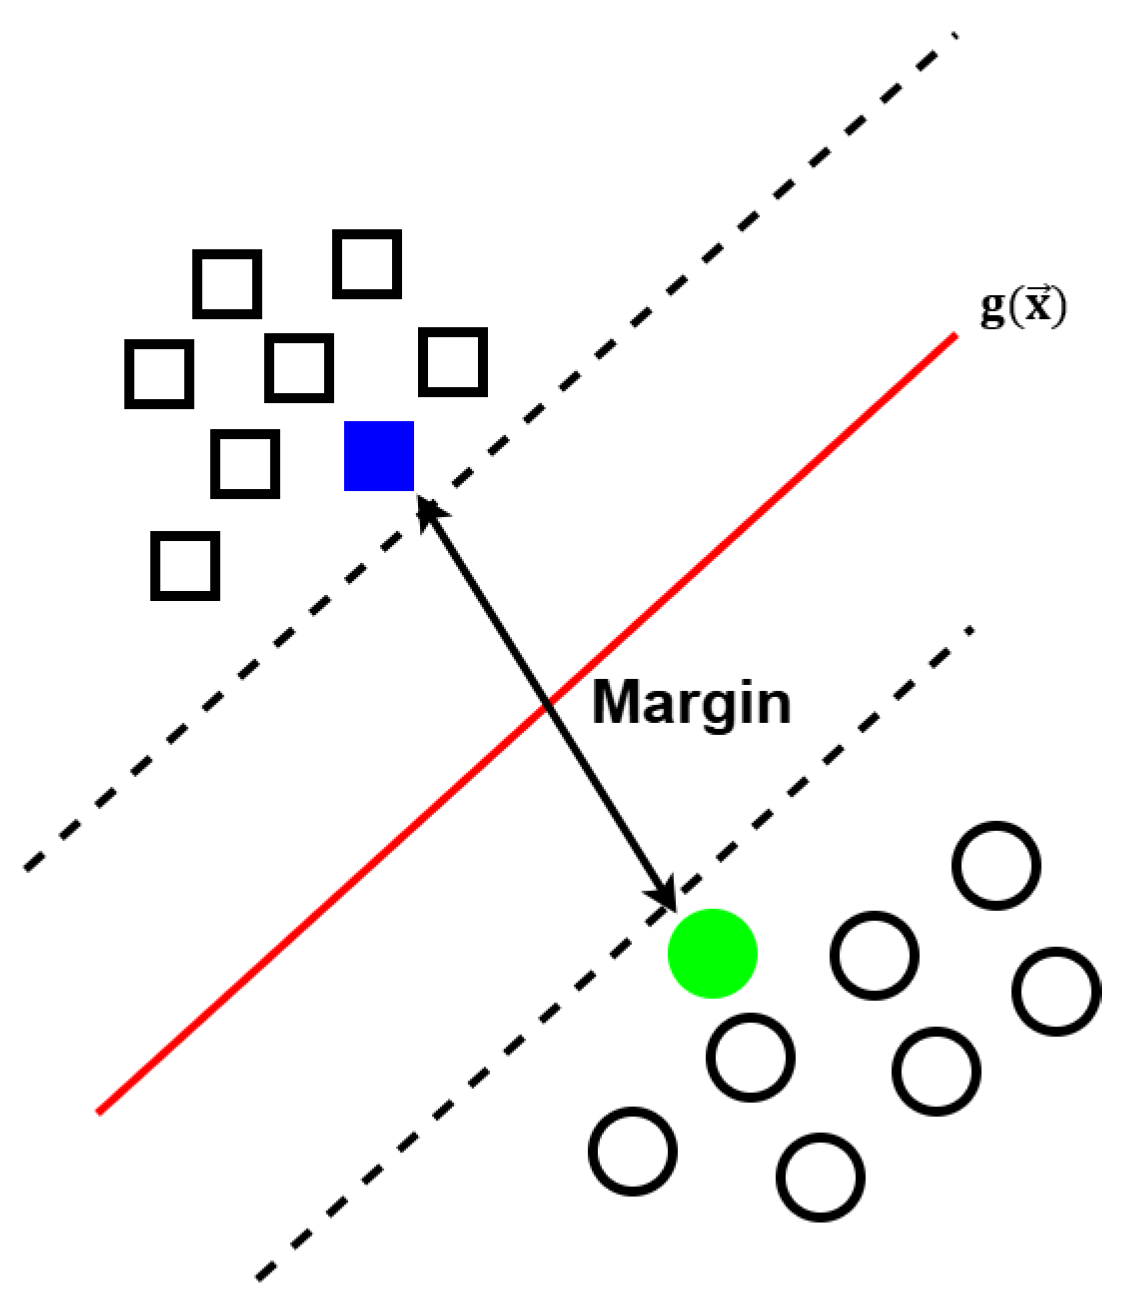
2.4. Support Vector Machines (SVMs)
3. Experimental Setup
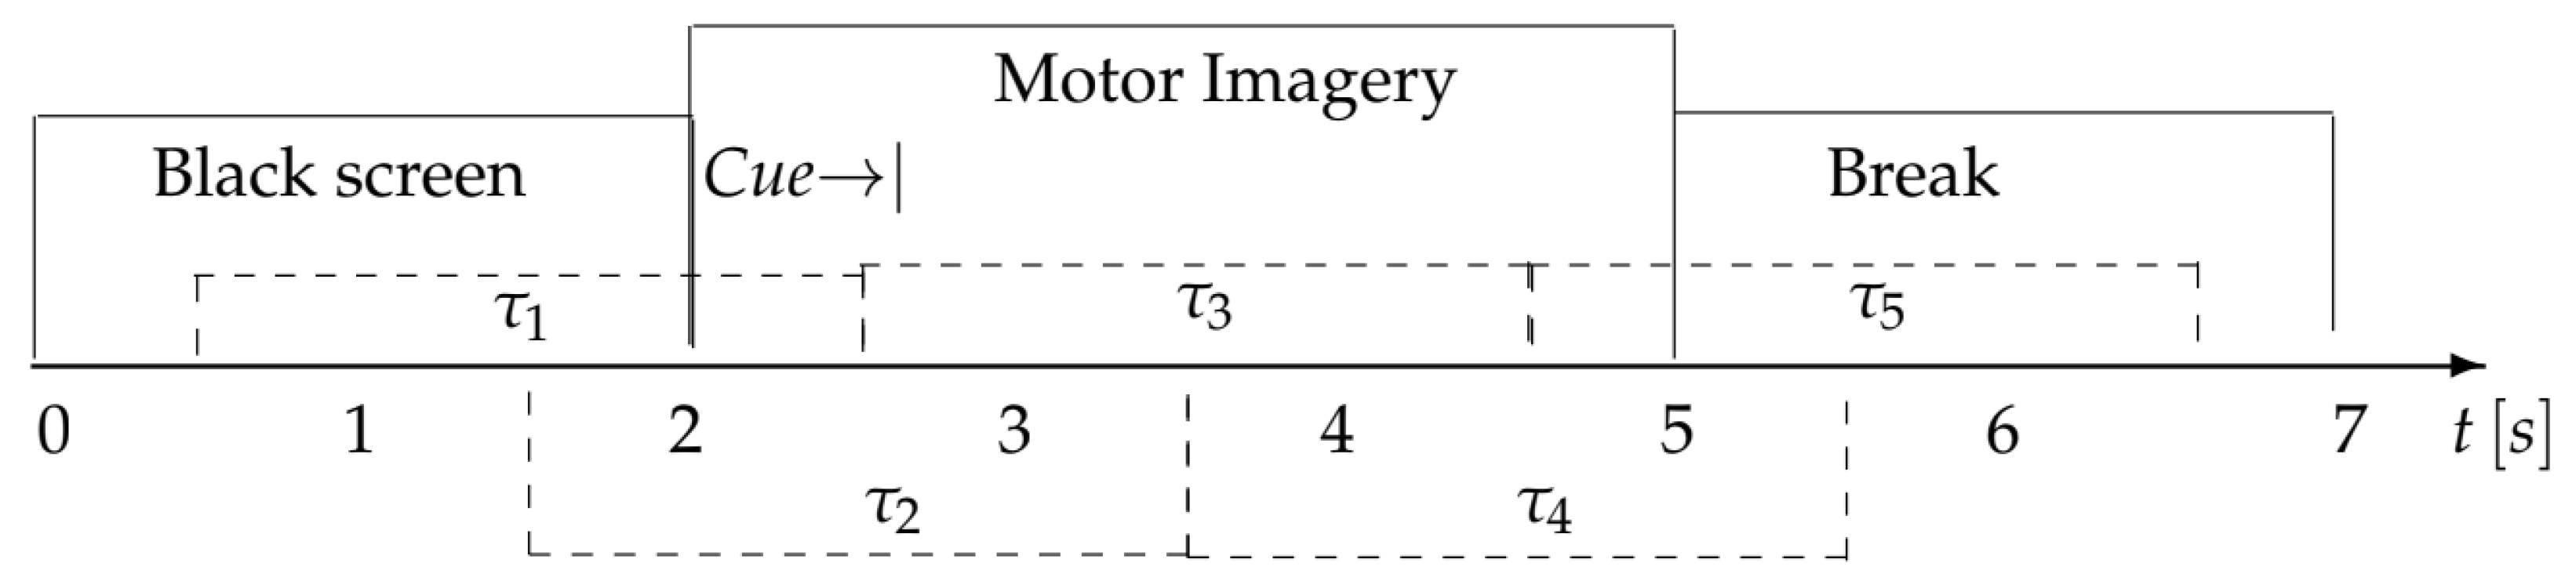
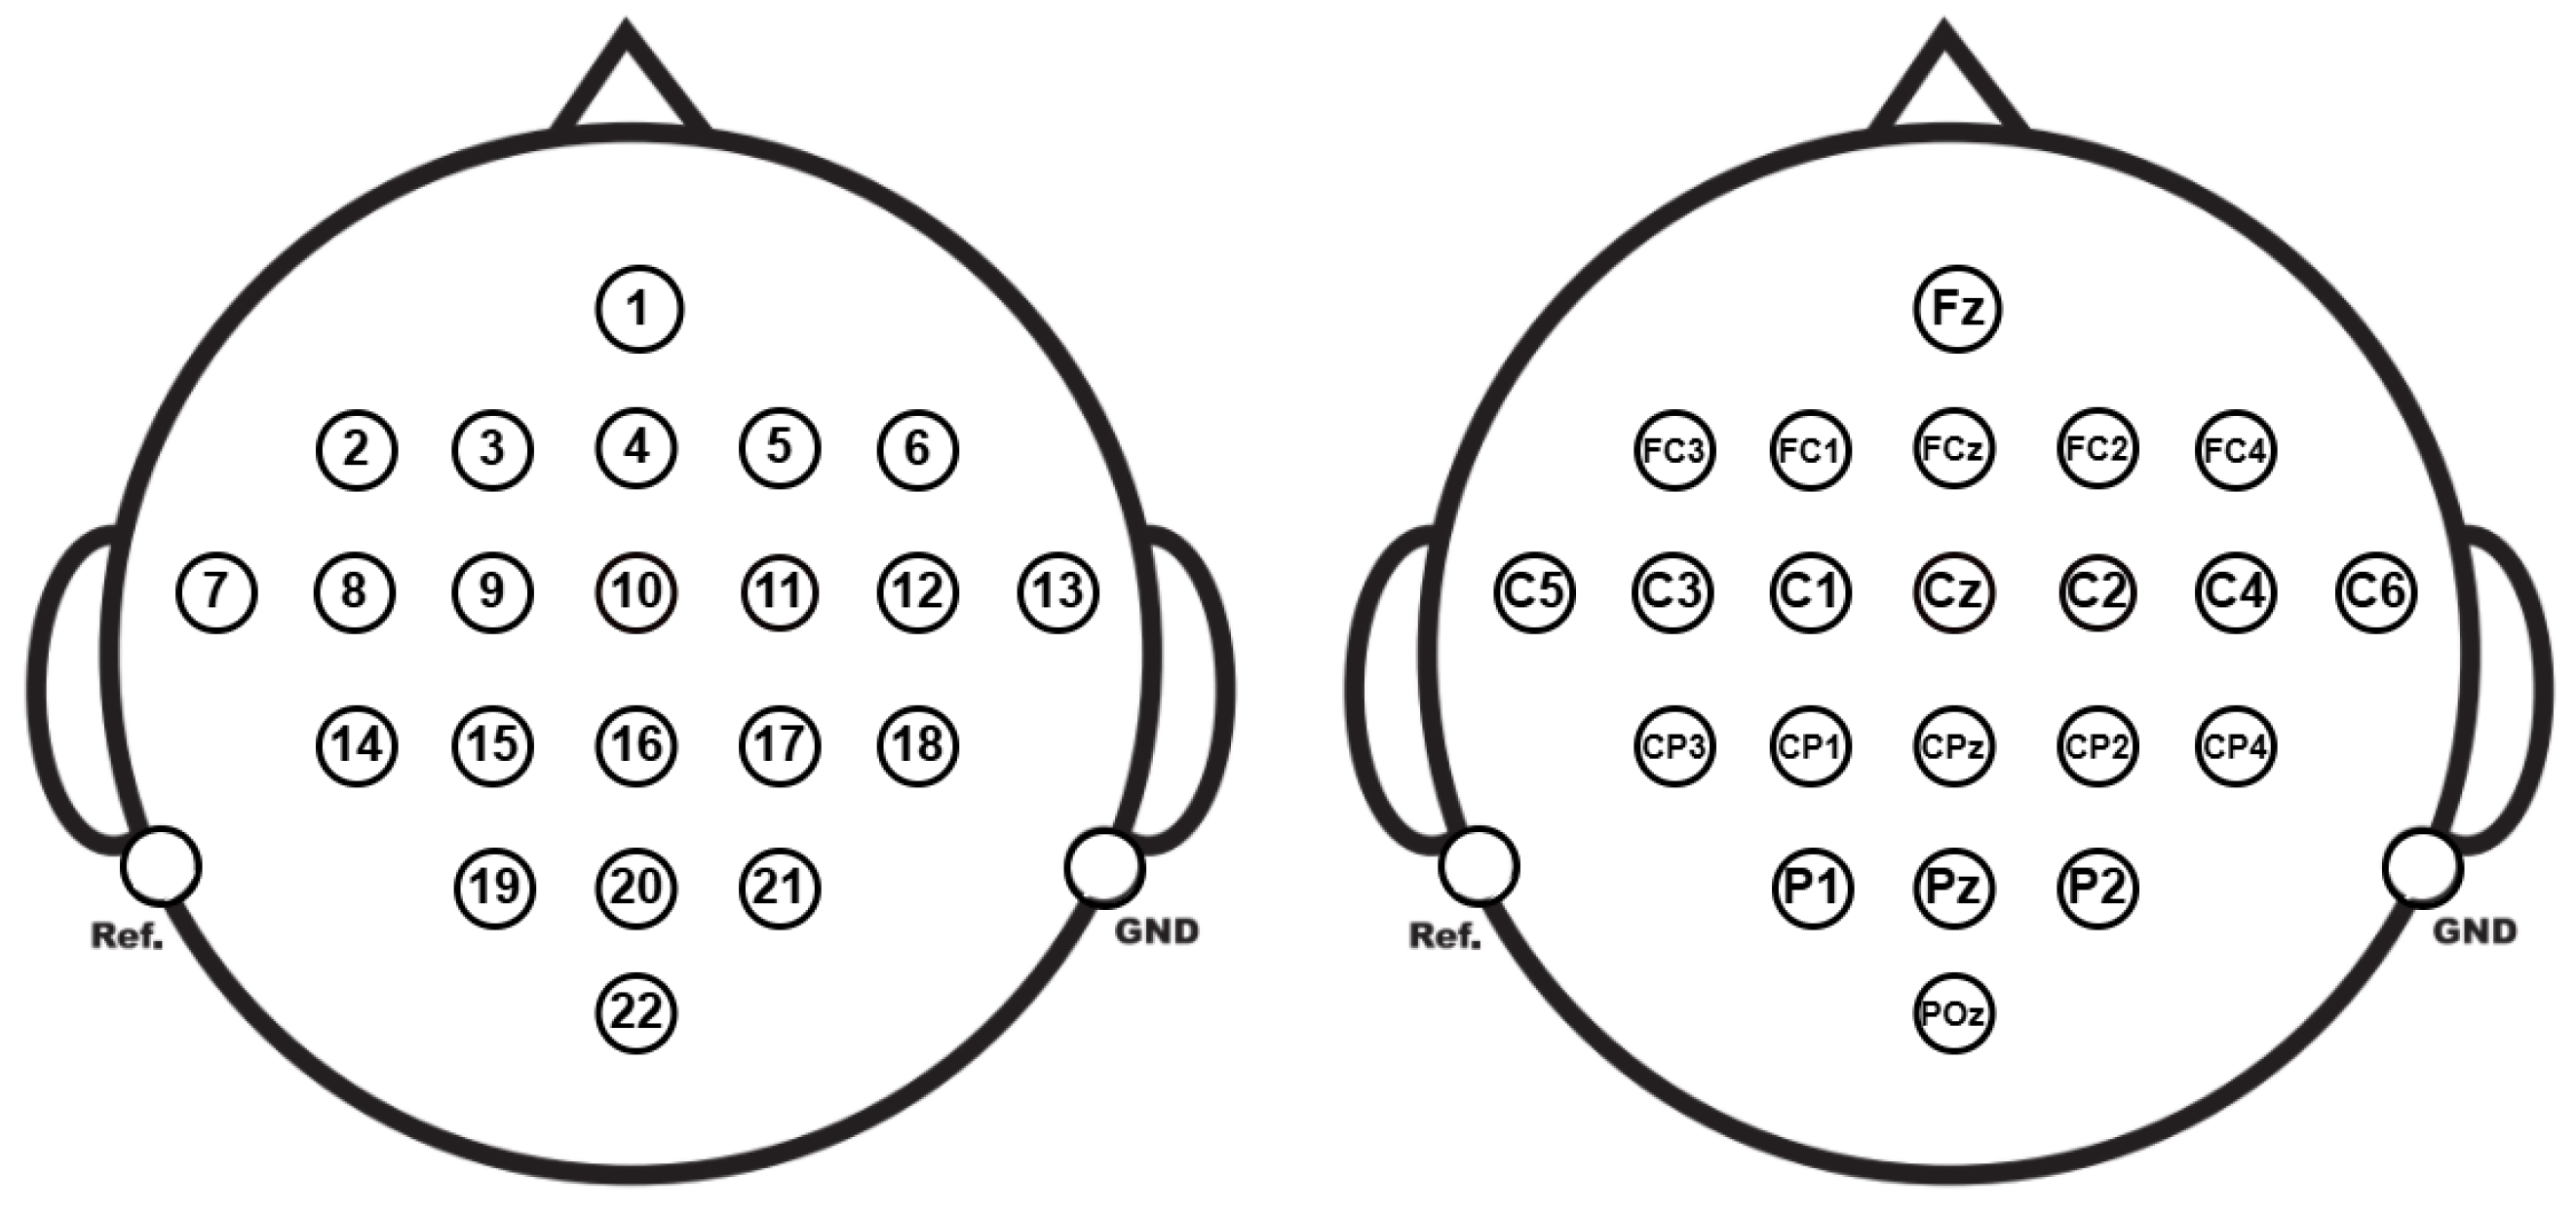
3.1. BCI Competition IV Dataset IIa
3.2. Data Setup and Preprocessing
4. Results
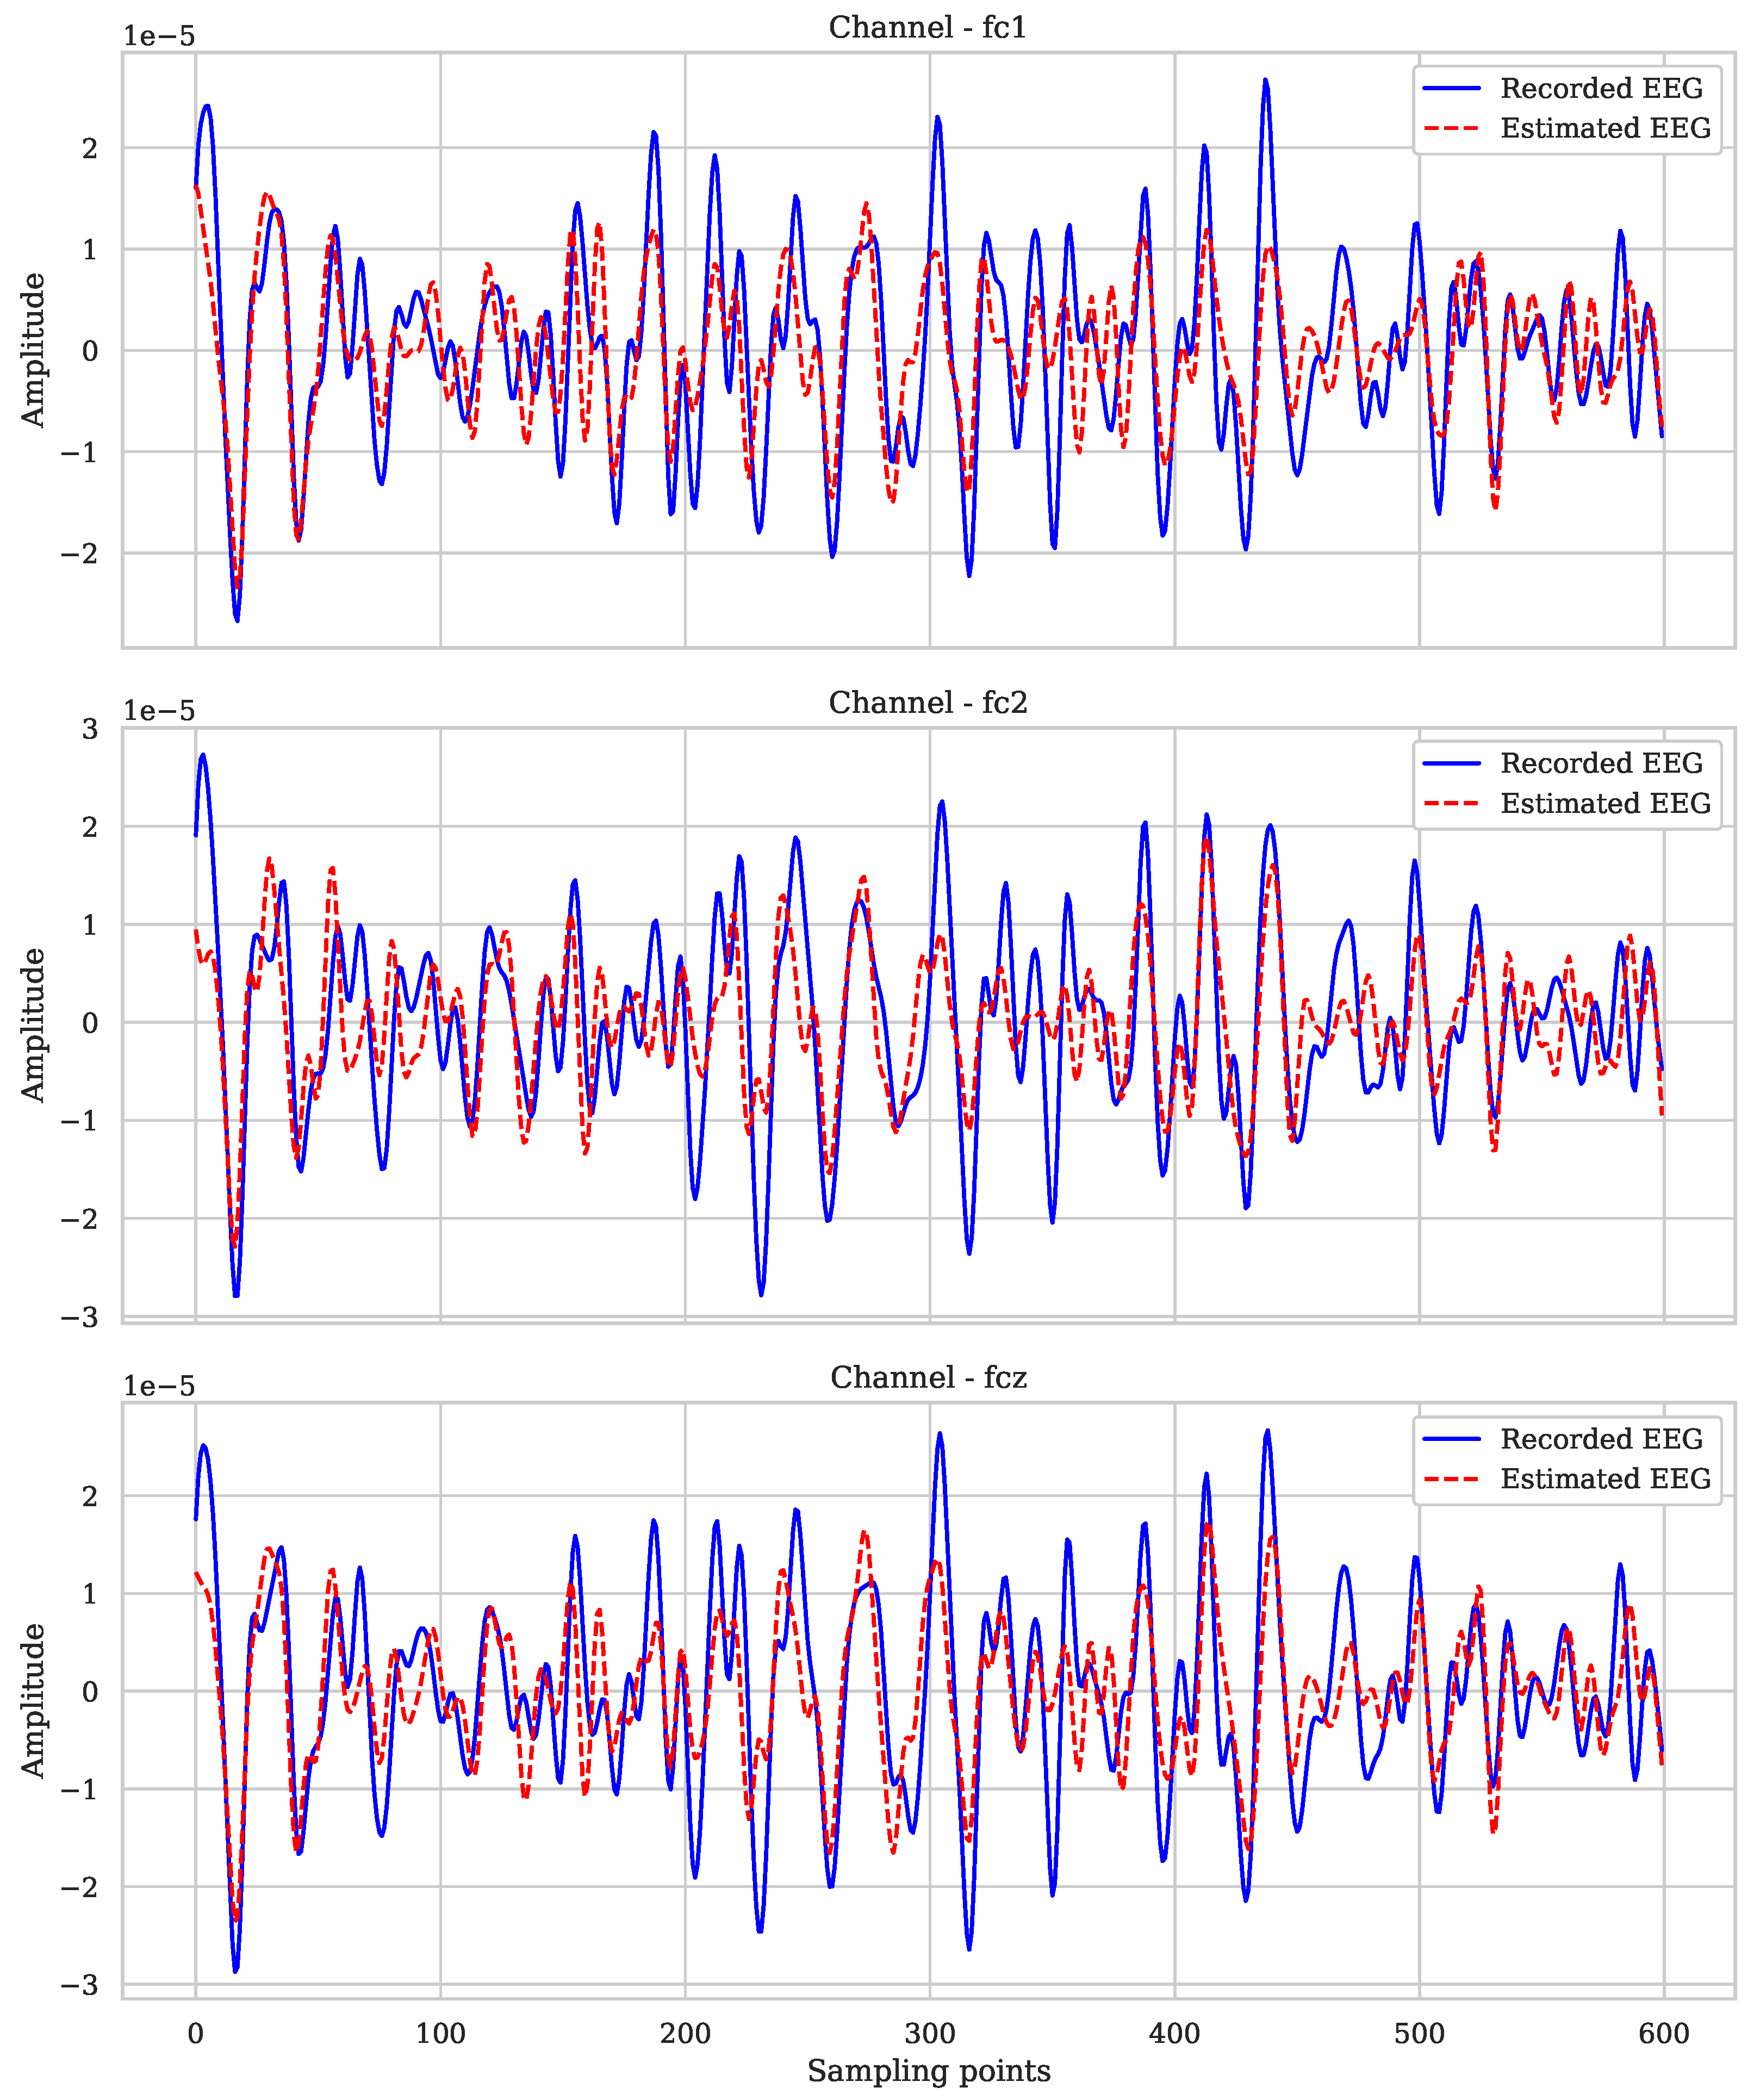
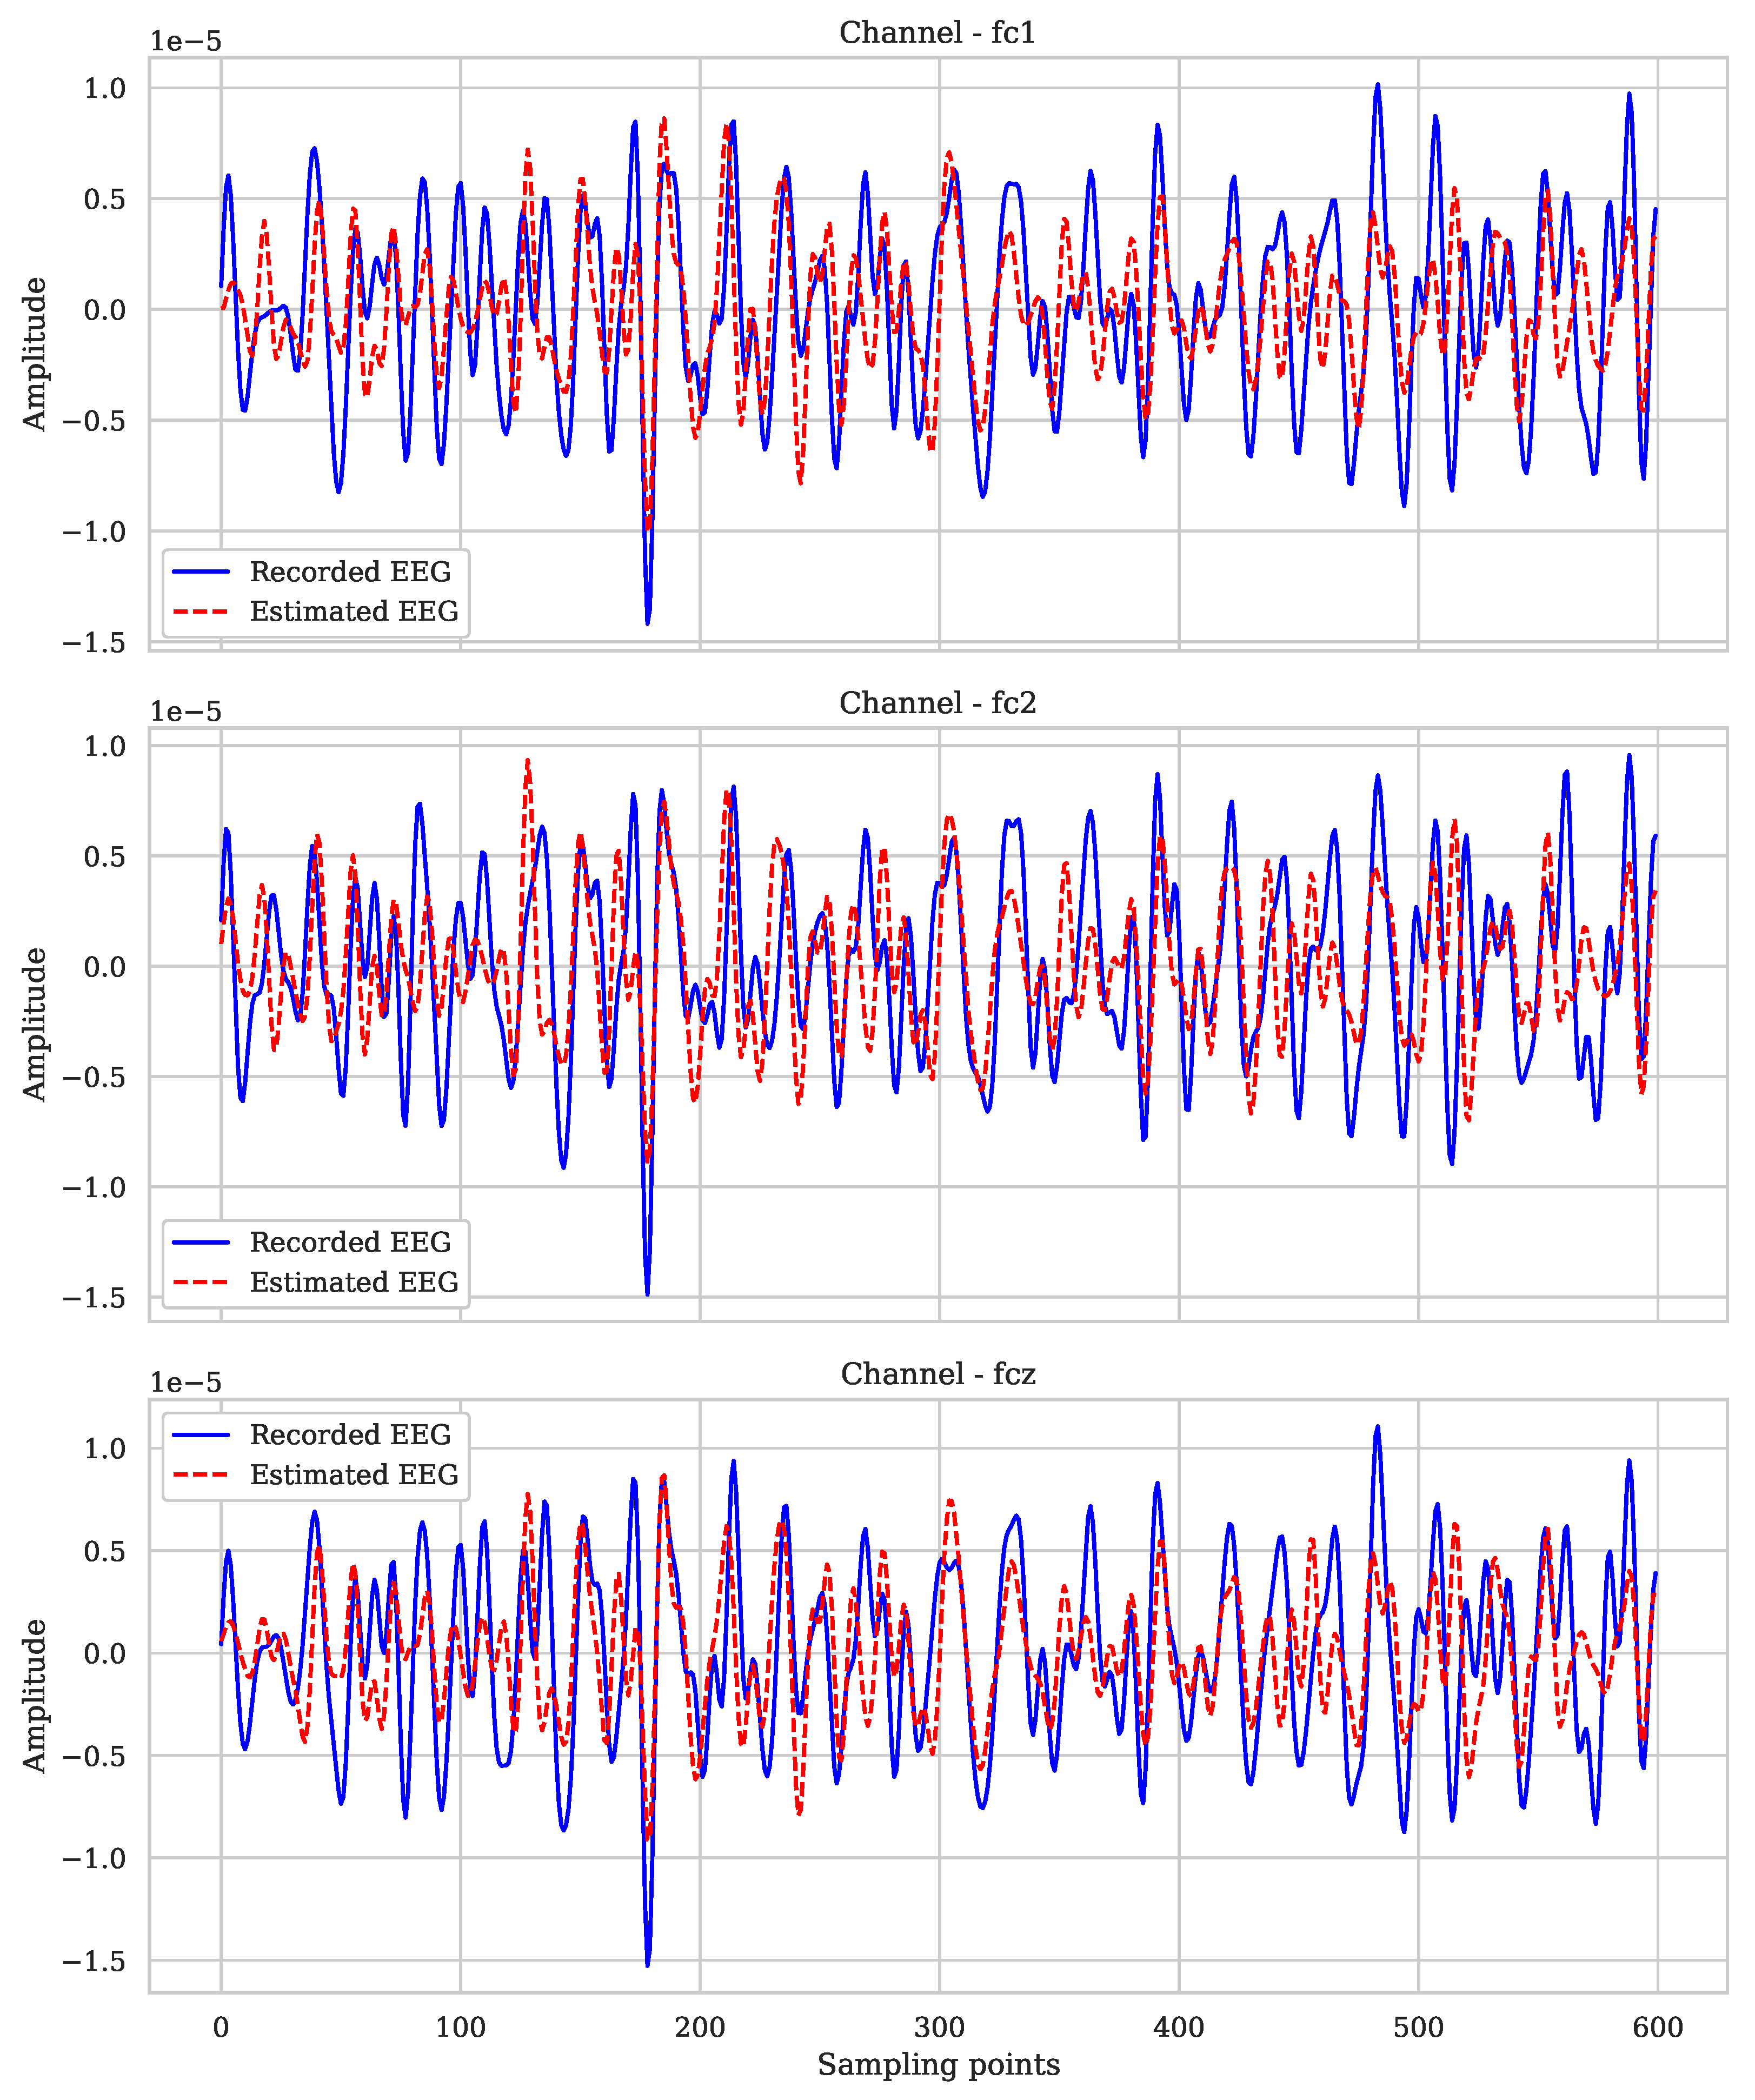
4.1. Elastic Net Regularization Results
4.2. Model Results for Common Spatial Patterns
4.3. Classification Model
4.4. Performance of the Classification Model with Respect to MI Tasks
5. Discussion and Concluding Remarks
Author Contributions
Funding
Institutional Review Board Statement
Informed Consent Statement
Data Availability Statement
Conflicts of Interest
References
- Zhu, H.Y.; Hieu, N.Q.; Hoang, D.T.; Nguyen, D.N.; Lin, C.T. A human-centric metaverse enabled by brain-computer interface: A survey. IEEE Commun. Surv. Tutorials 2024, 26, 2120–2145. [Google Scholar] [CrossRef]
- Ladda, A.M.; Lebon, F.; Lotze, M. Using motor imagery practice for improving motor performance—A review. Brain Cogn. 2021, 150, 105705. [Google Scholar] [CrossRef]
- Ibrahim, E.F.; Richardson, M.D.; Nestel, D. Mental imagery and learning: A qualitative study in orthopaedic trauma surgery. Med. Educ. 2015, 49, 888–900. [Google Scholar] [CrossRef]
- Al-Qaysi, Z.; Ahmed, M.; Hammash, N.M.; Hussein, A.F.; Albahri, A.; Suzani, M.; Al-Bander, B.; Shuwandy, M.L.; Salih, M.M. Systematic review of training environments with motor imagery brain–computer interface: Coherent taxonomy, open issues and recommendation pathway solution. Health Technol. 2021, 11, 783–801. [Google Scholar] [CrossRef]
- Amin, S.U.; Altaheri, H.; Muhammad, G.; Alsulaiman, M.; Abdul, W. Attention based Inception model for robust EEG motor imagery classification. In Proceedings of the 2021 IEEE International Instrumentation and Measurement Technology Conference (I2MTC), Glasgow, UK, 17–20 May 2021; pp. 1–6. [Google Scholar]
- Matsuo, M.; Iso, N.; Fujiwara, K.; Moriuchi, T.; Matsuda, D.; Mitsunaga, W.; Nakashima, A.; Higashi, T. Comparison of cerebral activation between motor execution and motor imagery of self-feeding activity. Neural Regen. Res. 2021, 16, 778–782. [Google Scholar]
- Du, B.; Yu, H.; Yao, H.; Wang, Y.; Wang, C. Research on δ-γ phase-amplitude coupling characteristics of motor imagery based on EEG. Biomed. Signal Process. Control 2025, 100, 106958. [Google Scholar] [CrossRef]
- Gaur, P.; McCreadie, K.; Pachori, R.B.; Wang, H.; Prasad, G. An automatic subject specific channel selection method for enhancing motor imagery classification in EEG-BCI using correlation. Biomed. Signal Process. Control 2021, 68, 102574. [Google Scholar] [CrossRef]
- Katona, J.; Kovari, A. The evaluation of bci and pebl-based attention tests. Acta Polytech. Hung. 2018, 15, 225–249. [Google Scholar]
- Katona, J. Measuring cognition load using eye-tracking parameters based on algorithm description tools. Sensors 2022, 22, 912. [Google Scholar] [CrossRef]
- Yang, H.; Hu, Z.; Imai, F.; Yang, Y.; Ogawa, K. Effects of neurofeedback on the activities of motor-related areas by using motor execution and imagery. Neurosci. Lett. 2021, 746, 135653. [Google Scholar] [CrossRef]
- Becker, S.; Dhindsa, K.; Mousapour, L.; Al Dabagh, Y. BCI illiteracy: It’s us, not them. Optimizing BCIs for individual brains. In Proceedings of the 2022 10th International Winter Conference on Brain-Computer Interface (BCI), Gangwon-do, Republic of Korea, 21–23 February 2022; pp. 1–3. [Google Scholar]
- Bhattacharjee, S.; Kashyap, R.; Abualait, T.; Annabel Chen, S.H.; Yoo, W.K.; Bashir, S. The role of primary motor cortex: More than movement execution. J. Mot. Behav. 2021, 53, 258–274. [Google Scholar] [CrossRef] [PubMed]
- Jiang, X.; Meng, L.; Chen, X.; Xu, Y.; Wu, D. CSP-Net: Common spatial pattern empowered neural networks for EEG-based motor imagery classification. Knowl.-Based Syst. 2024, 305, 112668. [Google Scholar]
- Altaheri, H.; Muhammad, G.; Alsulaiman, M.; Amin, S.U.; Altuwaijri, G.A.; Abdul, W.; Bencherif, M.A.; Faisal, M. Deep learning techniques for classification of electroencephalogram (EEG) motor imagery (MI) signals: A review. Neural Comput. Appl. 2023, 35, 14681–14722. [Google Scholar]
- Hameed, A.; Fourati, R.; Ammar, B.; Ksibi, A.; Alluhaidan, A.S.; Ayed, M.B.; Khleaf, H.K. Temporal–spatial transformer based motor imagery classification for BCI using independent component analysis. Biomed. Signal Process. Control 2024, 87, 105359. [Google Scholar] [CrossRef]
- Liu, H.; Wei, P.; Wang, H.; Lv, X.; Duan, W.; Li, M.; Zhao, Y.; Wang, Q.; Chen, X.; Shi, G.; et al. An EEG motor imagery dataset for brain computer interface in acute stroke patients. Sci. Data 2024, 11, 131. [Google Scholar] [CrossRef]
- Echtioui, A.; Zouch, W.; Ghorbel, M.; Mhiri, C.; Hamam, H. Classification of BCI multiclass motor imagery task based on artificial neural network. Clin. EEG Neurosci. 2024, 55, 455–464. [Google Scholar]
- Collazos-Huertas, D.F.; Álvarez-Meza, A.M.; Castellanos-Dominguez, G. Image-based learning using gradient class activation maps for enhanced physiological interpretability of motor imagery skills. Appl. Sci. 2022, 12, 1695. [Google Scholar] [CrossRef]
- Velasquez-Martinez, L.; Caicedo-Acosta, J.; Acosta-Medina, C.; Alvarez-Meza, A.; Castellanos-Dominguez, G. Regression networks for neurophysiological indicator evaluation in practicing motor imagery tasks. Brain Sci. 2020, 10, 707. [Google Scholar] [CrossRef]
- Collazos-Huertas, D.F.; Álvarez-Meza, A.M.; Cárdenas-Peña, D.A.; Castaño-Duque, G.A.; Castellanos-Domínguez, C.G. Posthoc interpretability of neural responses by grouping subject motor imagery skills using cnn-based connectivity. Sensors 2023, 23, 2750. [Google Scholar] [CrossRef]
- Caicedo-Acosta, J.; Castaño, G.A.; Acosta-Medina, C.; Alvarez-Meza, A.; Castellanos-Dominguez, G. Deep neural regression prediction of motor imagery skills using EEG functional connectivity indicators. Sensors 2021, 21, 1932. [Google Scholar] [CrossRef]
- García-Murillo, D.G.; Alvarez-Meza, A.; Castellanos-Dominguez, G. Single-trial kernel-based functional connectivity for enhanced feature extraction in motor-related tasks. Sensors 2021, 21, 2750. [Google Scholar] [CrossRef] [PubMed]
- Velasquez-Martinez, L.; Caicedo-Acosta, J.; Castellanos-Dominguez, G. Entropy-based estimation of event-related de/synchronization in motor imagery using vector-quantized patterns. Entropy 2020, 22, 703. [Google Scholar] [CrossRef] [PubMed]
- Verboom, M. Electroencephalography Monitoring in the Critically Ill. Master’s Thesis, Delft University of Technology, Delft, The Netherlands, 2023. [Google Scholar]
- Swaminathan, A. Current Techniques and Engineering Opportunities for Advancement and Improvement in Electroencephalographic Acquisition and Analyses. J. Exp. Neurol. 2024, 5, 192–209. [Google Scholar]
- Phadikar, S.; Sinha, N.; Ghosh, R. Unsupervised feature extraction with autoencoders for EEG based multiclass motor imagery BCI. Expert Syst. Appl. 2023, 213, 118901. [Google Scholar]
- Luo, J.; Wang, Y.; Xia, S.; Lu, N.; Ren, X.; Shi, Z.; Hei, X. A shallow mirror transformer for subject-independent motor imagery BCI. Comput. Biol. Med. 2023, 164, 107254. [Google Scholar]
- Alnaanah, M.; Wahdow, M.; Alrashdan, M. CNN models for EEG motor imagery signal classification. Signal, Image Video Process. 2023, 17, 825–830. [Google Scholar]
- Yin, K.; Lim, E.Y.; Lee, S.W. GITGAN: Generative inter-subject transfer for EEG motor imagery analysis. Pattern Recognit. 2024, 146, 110015. [Google Scholar] [CrossRef]
- Thanigaivelu, P.; Sridhar, S.; Sulthana, S.F. OISVM: Optimal Incremental Support Vector Machine-based EEG Classification for Brain-computer Interface Model. Cogn. Comput. 2023, 15, 888–903. [Google Scholar]
- Hu, M.; Ren, J.; Pan, Y.; Cheng, L.; Xu, X.; Tan, C.L.; Sun, H.; Shi, Y.; Yan, S. Scaled Elastic Hydrogel Interfaces for Brain Electrophysiology. Adv. Funct. Mater. 2024, 34, 2407926. [Google Scholar]
- Carrara, I.; Aristimunha, B.; Corsi, M.C.; de Camargo, R.Y.; Chevallier, S.; Papadopoulo, T. Geometric neural network based on phase space for BCI decoding. arXiv 2024, arXiv:2403.05645. [Google Scholar]
- Molcho, L.; Maimon, N.B.; Zeimer, T.; Chibotero, O.; Rabinowicz, S.; Armoni, V.; On, N.B.; Intrator, N.; Sasson, A. Evaluating Cognitive Decline Detection in Aging Populations with Single-Channel EEG Features: Insights from Studies and Meta-Analysis. 2024. Available online: https://www.researchgate.net/publication/384626839_Evaluating_Cognitive_Decline_Detection_in_Aging_Populations_with_Single-Channel_EEG_Features_Insights_from_Studies_and_Meta-Analysis (accessed on 2 February 2025).
- Liang, S.; Hang, W.; Lei, B.; Wang, J.; Qin, J.; Choi, K.S.; Zhang, Y. Adaptive multimodel knowledge transfer matrix machine for EEG classification. IEEE Trans. Neural Netw. Learn. Syst. 2024, 35, 7726–7739. [Google Scholar] [CrossRef] [PubMed]
- Liuzzi, P.; Grippo, A.; Campagnini, S.; Scarpino, M.; Draghi, F.; Romoli, A.; Hakiki, B.; Sterpu, R.; Maiorelli, A.; Macchi, C.; et al. Merging clinical and EEG biomarkers in an elastic-net regression for disorder of consciousness prognosis prediction. IEEE Trans. Neural Syst. Rehabil. Eng. 2022, 30, 1504–1513. [Google Scholar] [CrossRef]
- Alizadeh, N.; Afrakhteh, S.; Mosavi, M.R. Multi-task EEG signal classification using correlation-based IMF selection and multi-class CSP. IEEE Access 2023, 11, 52712–52725. [Google Scholar] [CrossRef]
- Gaur, P.; Gupta, H.; Chowdhury, A.; McCreadie, K.; Pachori, R.B.; Wang, H. A sliding window common spatial pattern for enhancing motor imagery classification in EEG-BCI. IEEE Trans. Instrum. Meas. 2021, 70, 4002709. [Google Scholar] [CrossRef]
- Ramkumar, E.; Paulraj, M. Optimized FFNN with multichannel CSP-ICA framework of EEG signal for BCI. Comput. Methods Biomech. Biomed. Eng. 2025, 28, 61–78. [Google Scholar] [CrossRef]
- Hu, H.; Pu, Z.; Li, H.; Liu, Z.; Wang, P. Learning optimal time-frequency-spatial features by the cissa-csp method for motor imagery eeg classification. Sensors 2022, 22, 8526. [Google Scholar] [CrossRef]
- Carrara, I.; Papadopoulo, T. Classification of BCI-EEG Based on the Augmented Covariance Matrix. IEEE Trans. Biomed. Eng. 2024, 71, 2651–2662. [Google Scholar] [CrossRef]
- Pirasteh, A.; Shamseini Ghiyasvand, M.; Pouladian, M. EEG-based brain-computer interface methods with the aim of rehabilitating advanced stage ALS patients. Disabil. Rehabil. Assist. Technol. 2024, 19, 3183–3193. [Google Scholar] [CrossRef]
- Maher, O.N.; Haikal, A.Y.; Elhosseini, M.A.; Saafan, M. An Optimized Quadratic Support Vector Machine for EEG Based Brain Computer Interface. Int. J. Electr. Comput. Eng. Syst. 2023, 14, 83–91. [Google Scholar] [CrossRef]
- Rajalakshmi, A.; Sridhar, S. Classification of yoga, meditation, combined yoga–meditation EEG signals using L-SVM, KNN, and MLP classifiers. Soft Comput. 2024, 28, 4607–4619. [Google Scholar] [CrossRef]
- Moufassih, M.; Tarahi, O.; Hamou, S.; Agounad, S.; Idrissi Azami, H. Boosting motor imagery brain-computer interface classification using multiband and hybrid feature extraction. Multimed. Tools Appl. 2024, 83, 49441–49472. [Google Scholar] [CrossRef]
- Antony, M.J.; Sankaralingam, B.P.; Mahendran, R.K.; Gardezi, A.A.; Shafiq, M.; Choi, J.G.; Hamam, H. Classification of EEG using adaptive SVM classifier with CSP and online recursive independent component analysis. Sensors 2022, 22, 7596. [Google Scholar] [CrossRef] [PubMed]
- An, Y.; Lam, H.K.; Ling, S.H. Multi-classification for EEG motor imagery signals using data evaluation-based auto-selected regularized FBCSP and convolutional neural network. Neural Comput. Appl. 2023, 35, 12001–12027. [Google Scholar] [CrossRef]
- Xu, S.; Zhu, L.; Kong, W.; Peng, Y.; Hu, H.; Cao, J. A novel classification method for EEG-based motor imagery with narrow band spatial filters and deep convolutional neural network. Cogn. Neurodyn. 2022, 16, 379–389. [Google Scholar] [CrossRef]
- Zolfaghari, S.; Yousefi Rezaii, T.; Meshgini, S. Applying Common Spatial Pattern and Convolutional Neural Network to Classify Movements via EEG Signals. Clin. EEG Neurosci. 2024, 55, 486–495. [Google Scholar] [CrossRef]
- Alizadeh, D.; Omranpour, H. EM-CSP: An efficient multiclass common spatial pattern feature method for speech imagery EEG signals recognition. Biomed. Signal Process. Control 2023, 84, 104933. [Google Scholar] [CrossRef]
- Zhou, A.; Zhang, L.; Yuan, X.; Li, C. A signal prediction-based method for motor imagery EEG classification. Biomed. Signal Process. Control 2023, 86, 105139. [Google Scholar] [CrossRef]
- Arpaia, P.; Esposito, A.; Natalizio, A.; Parvis, M. How to successfully classify EEG in motor imagery BCI: A metrological analysis of the state of the art. J. Neural Eng. 2022, 19, 031002. [Google Scholar] [CrossRef]
- Borgheai, S.B.; Zisk, A.H.; McLinden, J.; Mcintyre, J.; Sadjadi, R.; Shahriari, Y. Multimodal pre-screening can predict BCI performance variability: A novel subject-specific experimental scheme. Comput. Biol. Med. 2024, 168, 107658. [Google Scholar] [CrossRef]
- Kutlu, İ.Ç.; Tashan, W.; Shayea, I.; Albatyrova, M. An Introductory Guide on Creating a Pandas-based EEG Analysis and Action Prediction Tool for BCI Systems. In Proceedings of the 2024 IEEE 13th International Conference on Communication Systems and Network Technologies (CSNT), Jabalpur, India, 6–7 April 2024; pp. 1372–1378. [Google Scholar]
- Lin, P.J.; Li, W.; Zhai, X.; Li, Z.; Sun, J.; Xu, Q.; Pan, Y.; Ji, L.; Li, C. Explainable deep-learning prediction for brain-computer interfaces supported lower extremity motor gains based on multi-state fusion. IEEE Trans. Neural Syst. Rehabil. Eng. 2024, 32, 1546–1555. [Google Scholar]
- Wang, W.; Liang, J.; Liu, R.; Song, Y.; Zhang, M. A robust variable selection method for sparse online regression via the elastic net penalty. Mathematics 2022, 10, 2985. [Google Scholar] [CrossRef]
- Geisser, S.; Eddy, W.F. A Predictive Approach to Model Selection. J. Am. Stat. Assoc. 1979, 74, 153–160. [Google Scholar] [CrossRef]
- Tibshirani, R. Regression Shrinkage and Selection Via the Lasso. J. R. Stat. Soc. Ser. B (Methodol.) 2018, 58, 267–288. [Google Scholar] [CrossRef]
- Mohammadi, M.; Mosavi, M. Improving the efficiency of an EEG-based brain computer interface using Filter Bank Common Spatial Pattern. In Proceedings of the 2017 IEEE 4th International Conference on Knowledge-Based Engineering and Innovation (KBEI), Tehran, Iran, 22 December 2017; pp. 0878–0882. [Google Scholar]
- Cortes, C.; Vapnik, V. Support-vector networks. Mach. Learn. 1995, 20, 273–297. [Google Scholar] [CrossRef]
- Choi, W.; Kim, J.; Lee, B. EEG classification of word perception using common spatial pattern filter. In Proceedings of the 3rd International Winter Conference on Brain-Computer Interface, Gangwon, Republic of Korea, 12–14 January 2015; pp. 1–4. [Google Scholar]
- Brunner, C.; Leeb, R.; Müller-Putz, G.; Schlögl, A.; Pfurtscheller, G. BCI Competition 2008–Graz Data Set A. Available online: https://lampx.tugraz.at/~bci/database/001-2014/description.pdf (accessed on 11 February 2025).
- Pan, H.; Ding, P.; Wang, F.; Li, T.; Zhao, L.; Nan, W.; Fu, Y.; Gong, A. Comprehensive evaluation methods for translating BCI into practical applications: Usability, user satisfaction and usage of online BCI systems. Front. Hum. Neurosci. 2024, 18, 1429130. [Google Scholar]
- Kumar, Y.; Kumar, J.; Sheoran, P. Integration of cloud computing in BCI: A review. Biomed. Signal Process. Control 2024, 87, 105548. [Google Scholar] [CrossRef]
- Tangermann, M.; Müller, K.R.; Aertsen, A.; Birbaumer, N.; Braun, C.; Brunner, C.; Leeb, R.; Mehring, C.; Miller, K.J.; Müller-Putz, G.R.; et al. Review of the BCI competition IV. Front. Neurosci. 2012, 6, 55. [Google Scholar]
- Ayoobi, N.; Sadeghian, E.B. Unsupervised motor imagery saliency detection based on self-attention mechanism. In Proceedings of the 2022 44th Annual International Conference of the IEEE Engineering in Medicine & Biology Society (EMBC), Glasgow, UK, 11–15 July 2022; pp. 4817–4820. [Google Scholar]
- Korkan, N.; Olmez, T.; Dokur, Z. Generating Ten BCI Commands Using Four Simple Motor Imageries. arXiv 2021, arXiv:2105.14493. [Google Scholar]
- Lotte, F.; Bougrain, L.; Cichocki, A.; Clerc, M.; Congedo, M.; Rakotomamonjy, A.; Yger, F. A review of classification algorithms for EEG-based brain–computer interfaces: A 10 year update. J. Neural Eng. 2018, 15, 031005. [Google Scholar]
- Schirrmeister, R.T.; Springenberg, J.T.; Fiederer, L.D.J.; Glasstetter, M.; Eggensperger, K.; Tangermann, M.; Hutter, F.; Burgard, W.; Ball, T. Deep learning with convolutional neural networks for EEG decoding and visualization. Hum. Brain Mapp. 2017, 38, 5391–5420. [Google Scholar] [CrossRef]
- Roy, Y.; Banville, H.; Albuquerque, I.; Gramfort, A.; Falk, T.H.; Faubert, J. Deep learning-based electroencephalography analysis: A systematic review. J. Neural Eng. 2019, 16, 051001. [Google Scholar] [CrossRef] [PubMed]
- Xie, J.; Zhang, J.; Sun, J.; Ma, Z.; Qin, L.; Li, G.; Zhou, H.; Zhan, Y. A transformer-based approach combining deep learning network and spatial-temporal information for raw EEG classification. IEEE Trans. Neural Syst. Rehabil. Eng. 2022, 30, 2126–2136. [Google Scholar] [CrossRef] [PubMed]
- Zhang, C.; Kim, Y.K.; Eskandarian, A. EEG-inception: An accurate and robust end-to-end neural network for EEG-based motor imagery classification. J. Neural Eng. 2021, 18, 046014. [Google Scholar] [CrossRef] [PubMed]
- Gallo, A.; Phung, M.D. Classification of EEG Motor Imagery Using Deep Learning for Brain-Computer Interface Systems. arXiv 2022, arXiv:2206.07655. [Google Scholar]
- Chen, S.; Kong, X.; Han, J.; Wu, C.; Zhang, T. Improved Motor Imagery Classification Using Elastic Net-based Feature Optimization and a Heterogeneous Ensemble Classifier. In Proceedings of the 2024 IEEE International Symposium on Parallel and Distributed Processing with Applications (ISPA), Kaifeng, China, 30 October–2 November 2024; pp. 997–1006. [Google Scholar]


| Subjects | Coefficient of Determination (r2) |
|---|---|
| Subject 1 | 0.576 |
| Subject 2 | 0.641 |
| Subject 3 | 0.590 |
| Subject 4 | 0.568 |
| Subject 5 | 0.613 |
| Subject 6 | 0.567 |
| Subject 7 | 0.567 |
| Subject 8 | 0.595 |
| Subject 9 | 0.568 |
| Average | 0.587 |
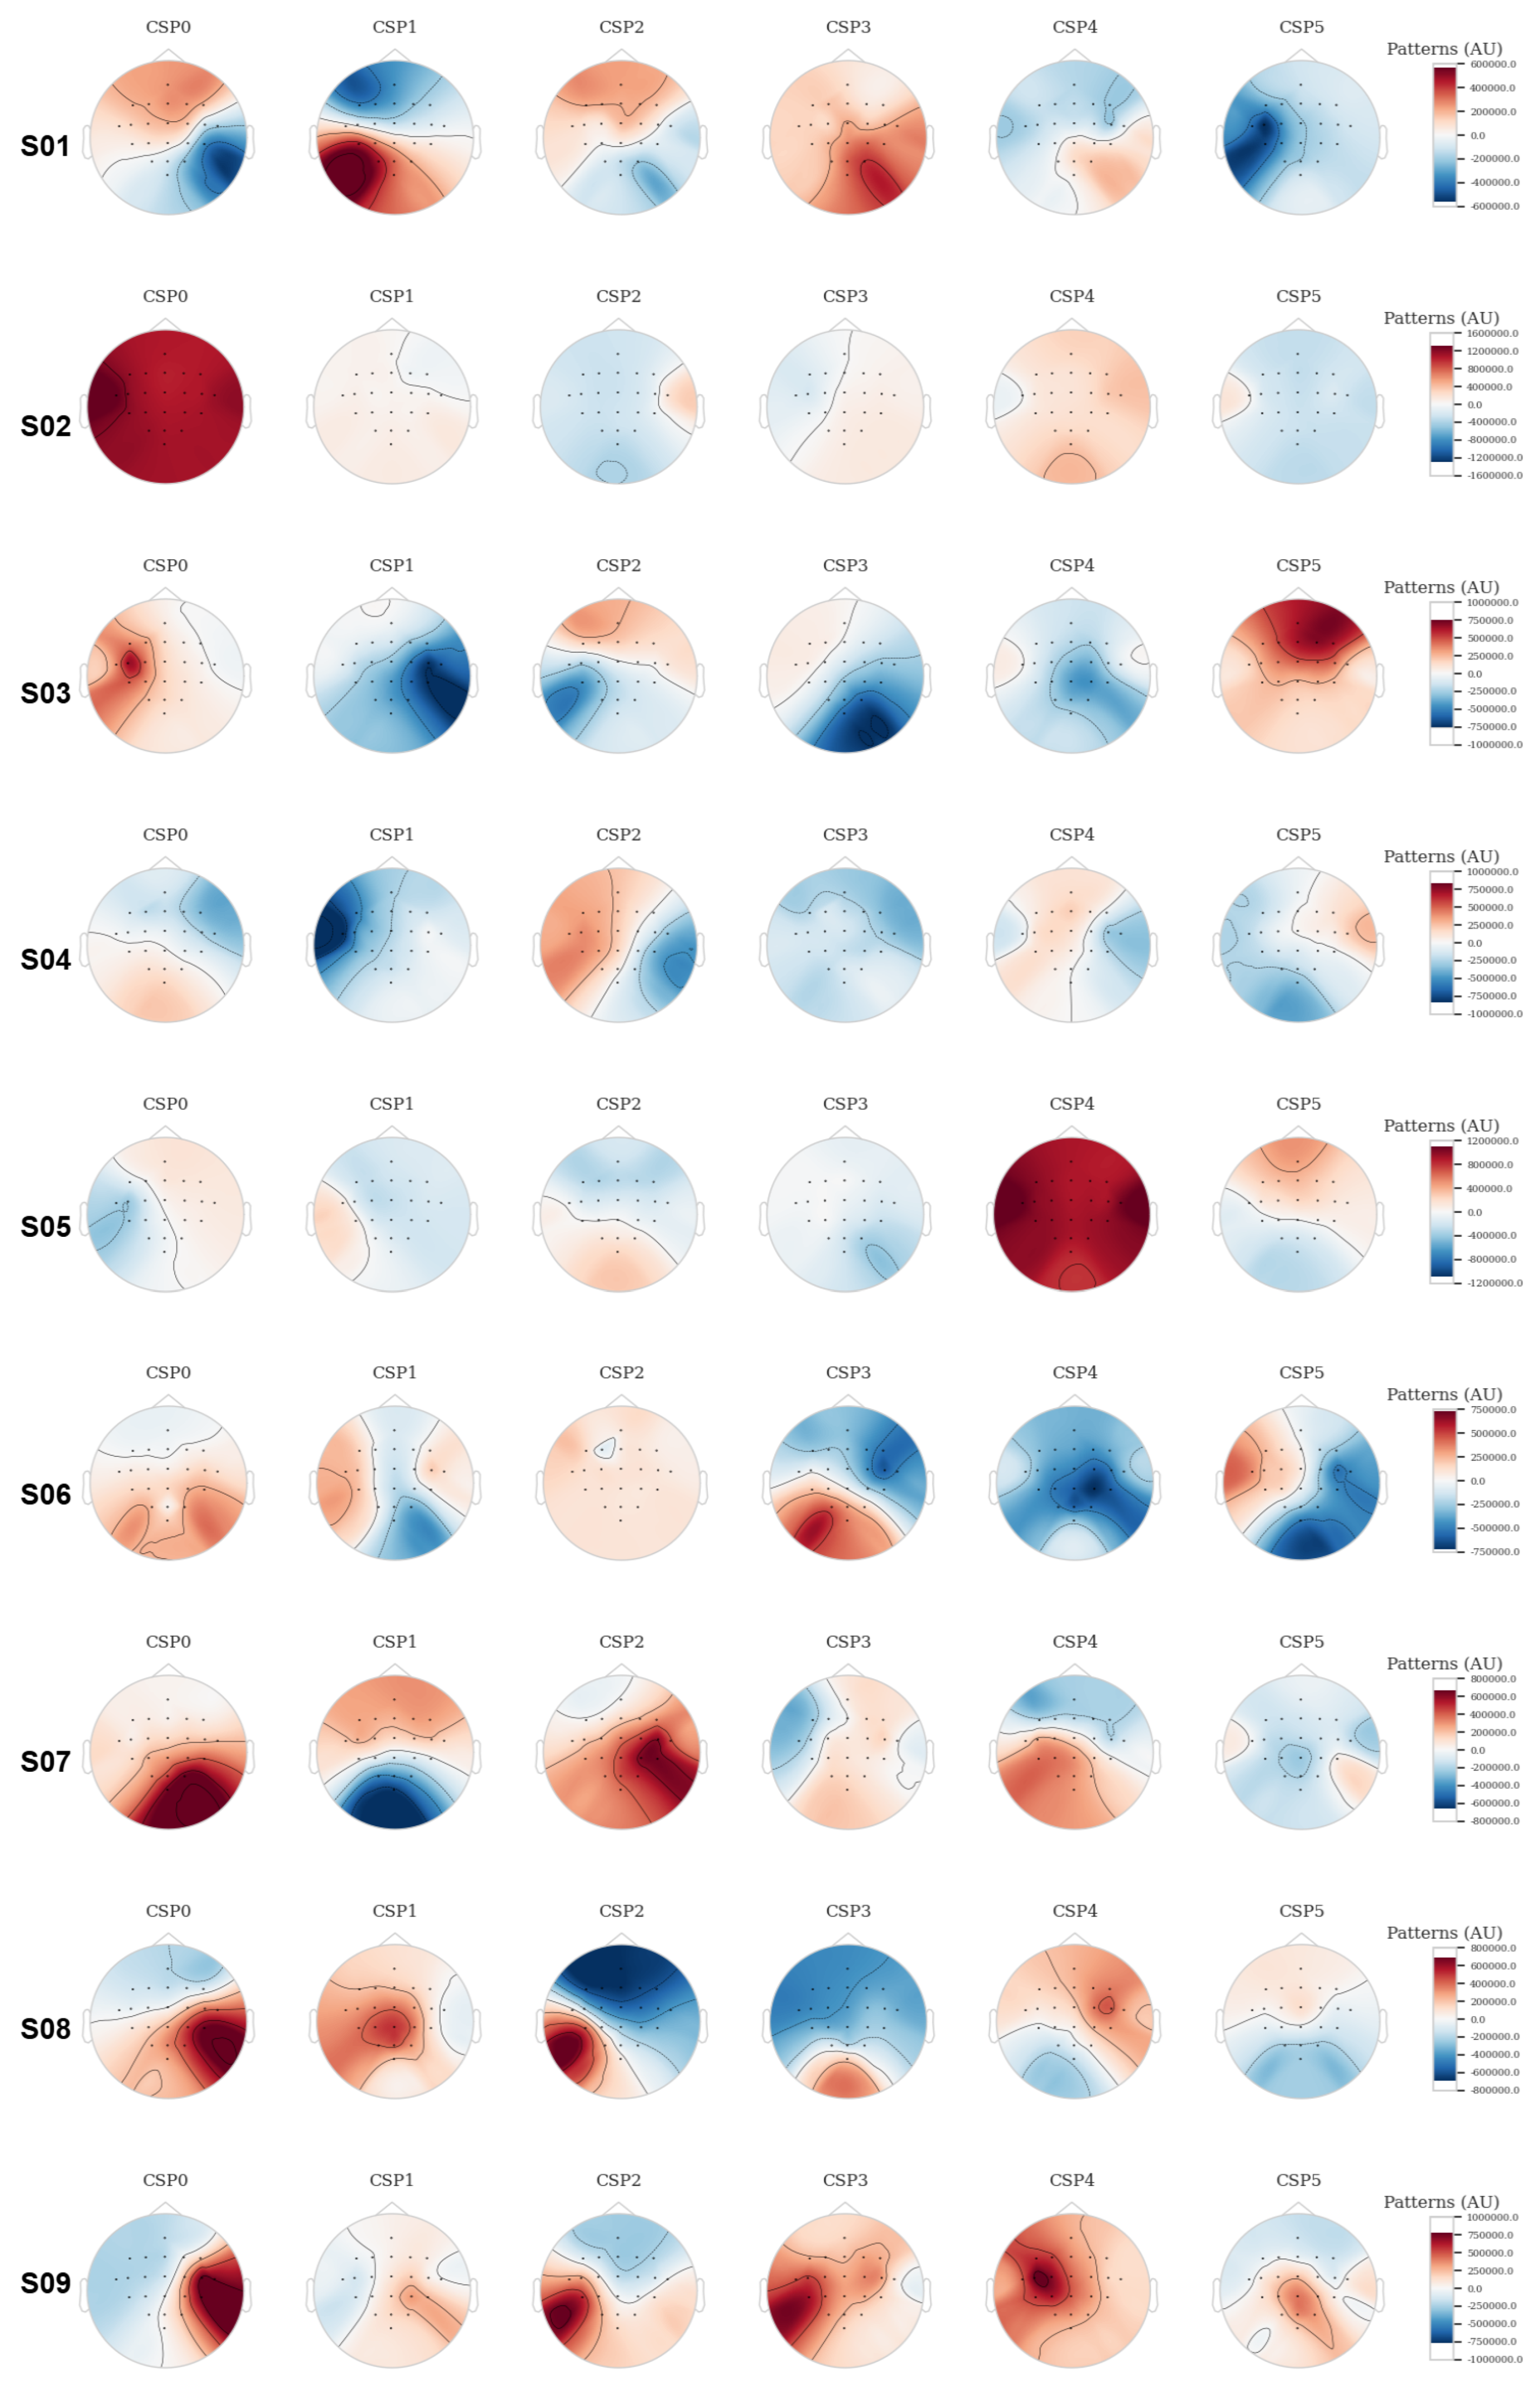
| Subject | CSP0 | CSP1 | CSP2 | CSP3 | CSP4 | CSP5 |
|---|---|---|---|---|---|---|
| Subject 1 | Bilateral distribution | Moderate activation | Uniform distribution | Moderate activity | Lateral activation | Low activation |
| Subject 2 | Strong frontal and lateral activation | Weak central activation | Low distribution | Low activation | Low activation | Low activation |
| Subject 3 | Moderate lateral activation | Diffuse activation | Lateralized activation | Strong activation | Strong lateral activation | Parietal high activity |
| Subject 4 | Uniform distribution | Bilateral activation | Moderate activation | Low activation | Bilateral activation | Bilateral activation |
| Subject 5 | Strong parietal activation | Moderate activation | Diffuse activation | Strong lateral activation | High activity | High activity |
| Subject 6 | Diffuse activation | Moderate lateral activation | Low activation | Diffuse distribution | Low activation | Low activation |
| Subject 7 | Strong negative lateral activation | Motor areas activation | Moderate lateralization | Diffuse activation | Bilateral activation | Strong lateral activation |
| Subject 8 | Centralized activation in CSP1 and CSP3 | Diffuse activation | Diffuse activation | Primary motor areas activation | Moderate activation | Lateral areas activation |
| Subject 9 | Symmetry in activations | Moderate activation | Moderate lateral activation | Moderate bilateral activation | Symmetry in activations | Symmetry in activations |
| Subjects | Accuracy % | Kappa |
|---|---|---|
| Subject 1 | 65.57 | 0.313 |
| Subject 2 | 77.05 | 0.536 |
| Subject 3 | 83.61 | 0.674 |
| Subject 4 | 95.24 | 0.891 |
| Subject 5 | 62.30 | 0.242 |
| Subject 6 | 67.21 | 0.344 |
| Subject 7 | 81.97 | 0.634 |
| Subject 8 | 90.16 | 0.801 |
| Subject 9 | 80.33 | 0.605 |
| Average | 78.16 | 0.56 |
| Metrics | S01 | S02 | S03 | S04 | S05 | S06 | S07 | S08 | S09 | Class | Average |
|---|---|---|---|---|---|---|---|---|---|---|---|
| Precision | 0.62 | 0.80 | 0.77 | 0.96 | 0.61 | 0.65 | 0.91 | 0.96 | 0.79 | 1 | 0.785 |
| 0.69 | 0.75 | 0.92 | 0.93 | 0.64 | 0.70 | 0.77 | 0.86 | 0.81 | 2 | 0.785 | |
| Recall | 0.69 | 0.69 | 0.93 | 0.96 | 0.59 | 0.69 | 0.69 | 0.83 | 0.79 | 1 | 0.762 |
| 0.62 | 0.84 | 0.75 | 0.93 | 0.66 | 0.66 | 0.94 | 0.97 | 0.81 | 2 | 0.797 | |
| F1-score | 0.66 | 0.74 | 0.84 | 0.96 | 0.60 | 0.67 | 0.78 | 0.89 | 0.79 | 1 | 0.770 |
| 0.66 | 0.79 | 0.83 | 0.93 | 0.65 | 0.68 | 0.95 | 0.91 | 0.81 | 2 | 0.801 | |
| Support | 29 | 29 | 29 | 27 | 29 | 29 | 29 | 29 | 29 | 1 | 28.77 |
| 32 | 32 | 32 | 15 | 32 | 32 | 32 | 32 | 32 | 2 | 30.11 |
| Study | Number of Channels | Methodology | Accuracy (%) |
|---|---|---|---|
| Our Study | 8 | Elastic Net Regression | 78.16 |
| Tangermann et al. [65] | 22 | CSP + LDA | 70.1 |
| Ayoobi and Sadeghian [66] | 22 | Self-Attention Mechanism | 74.3 |
| Korkan et al. [67] | 22 | Deep Neural Network | 81.8 |
| Method | Advantages | Disadvantages | Hyperparameters |
|---|---|---|---|
| CSP + SVM | Low computational cost, interpretable, effective with small datasets [68]. | Limited for non-stationary data, does not capture complex spatial relationships. | Regularization parameter (C), Kernel type, Gamma parameter |
| CNN | Automatically learns spatial features, robust to noise [69]. | Requires large datasets and higher computational power. | Learning rate, Batch size, Kernel size, Number of convolutional layers, Optimizer type |
| RNN (LSTM, GRU) | Captures temporal dependencies in EEG signals [70]. | Computationally expensive and may overfit with small datasets. | Number of hidden units, Learning rate, Dropout rate, Sequence length, Optimizer type |
| Transformer | Models long-range relationships in EEG signals [71]. | High computational demand, low interpretability. | Number of attention heads, Number of hidden layers, Learning rate, Batch size, Positional encoding type |
Disclaimer/Publisher’s Note: The statements, opinions and data contained in all publications are solely those of the individual author(s) and contributor(s) and not of MDPI and/or the editor(s). MDPI and/or the editor(s) disclaim responsibility for any injury to people or property resulting from any ideas, methods, instructions or products referred to in the content. |
© 2025 by the authors. Licensee MDPI, Basel, Switzerland. This article is an open access article distributed under the terms and conditions of the Creative Commons Attribution (CC BY) license (https://creativecommons.org/licenses/by/4.0/).
Share and Cite
Gómez-Morales, Ó.W.; Collazos-Huertas, D.F.; Álvarez-Meza, A.M.; Castellanos-Dominguez, C.G. EEG Signal Prediction for Motor Imagery Classification in Brain–Computer Interfaces. Sensors 2025, 25, 2259. https://doi.org/10.3390/s25072259
Gómez-Morales ÓW, Collazos-Huertas DF, Álvarez-Meza AM, Castellanos-Dominguez CG. EEG Signal Prediction for Motor Imagery Classification in Brain–Computer Interfaces. Sensors. 2025; 25(7):2259. https://doi.org/10.3390/s25072259
Chicago/Turabian StyleGómez-Morales, Óscar Wladimir, Diego Fabian Collazos-Huertas, Andrés Marino Álvarez-Meza, and Cesar German Castellanos-Dominguez. 2025. "EEG Signal Prediction for Motor Imagery Classification in Brain–Computer Interfaces" Sensors 25, no. 7: 2259. https://doi.org/10.3390/s25072259
APA StyleGómez-Morales, Ó. W., Collazos-Huertas, D. F., Álvarez-Meza, A. M., & Castellanos-Dominguez, C. G. (2025). EEG Signal Prediction for Motor Imagery Classification in Brain–Computer Interfaces. Sensors, 25(7), 2259. https://doi.org/10.3390/s25072259