


Physiological Sensor Modality Sensitivity Test for Pain Intensity Classification in Quantitative Sensory Testing


Abstract
1. Introduction
- The first question is to quantify the sensitivity of different time windows and machine learning classification model selection for pain level classification.
- The second question is to evaluate how excluding individual physiological sensors affects the model performance.
2. Materials and Methods
2.1. Participants
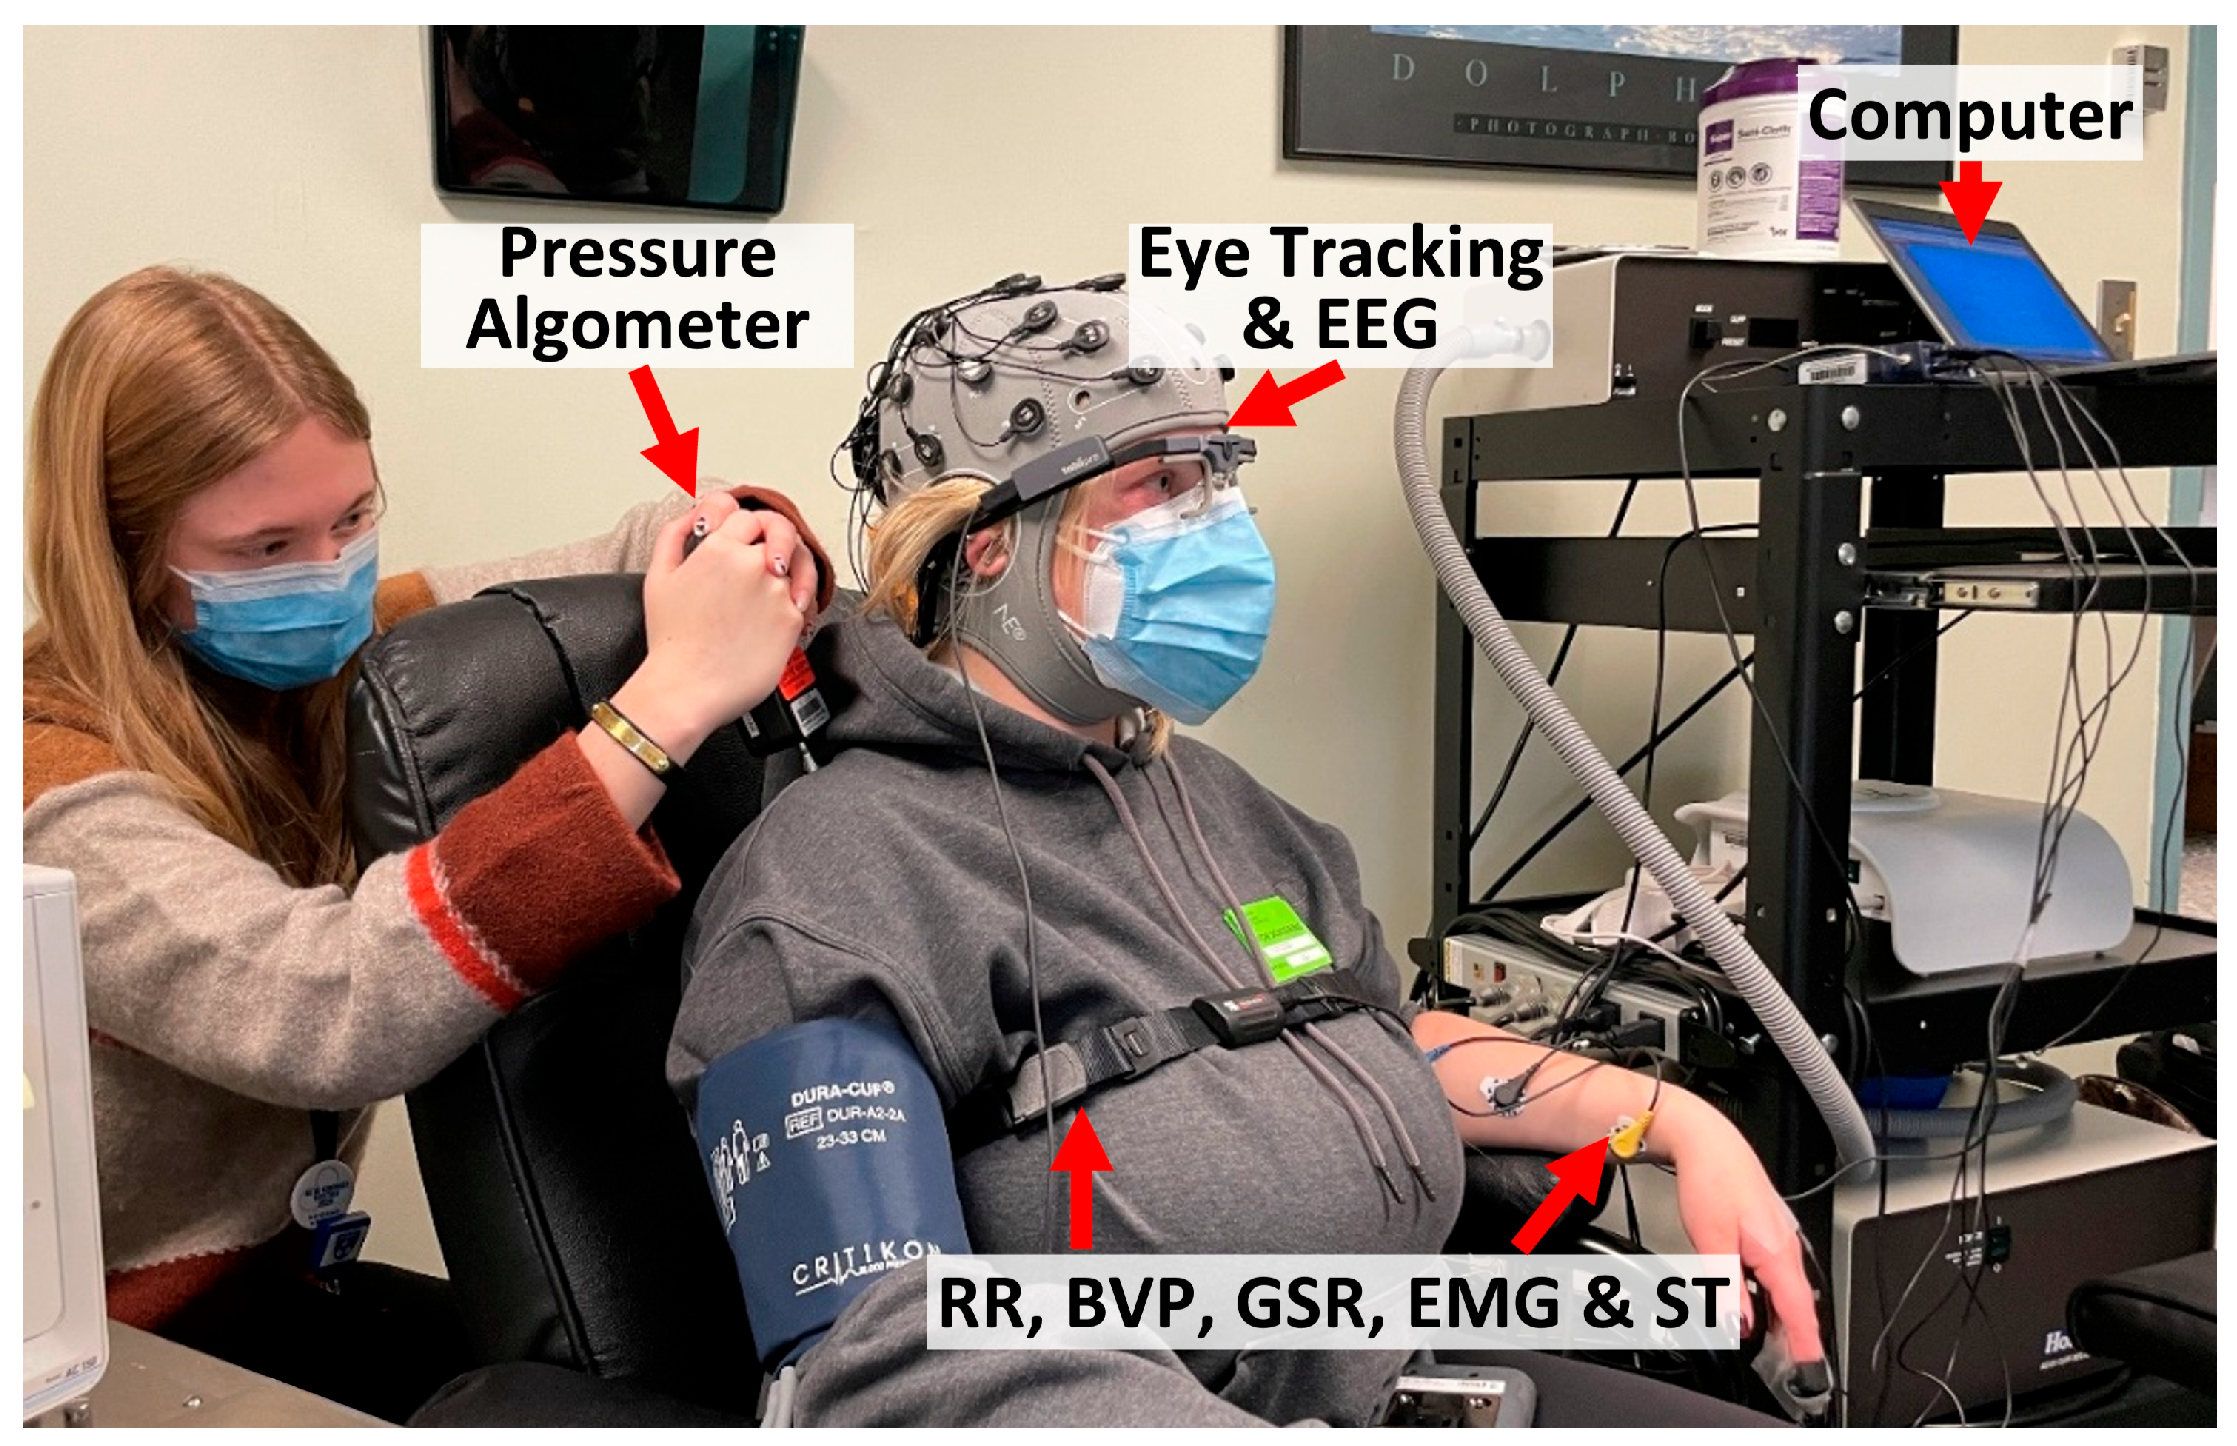
2.2. Apparatus
2.3. Experimental Procedures
- (1)
- Participants were seated comfortably in a reclining chair.
- (2)
- A research assistant helped participants wear all sensors, including pupillometry, BVP, GSR, EMG, ST, and RR. The setup took around 20 min.
- (3)
- A one-minute baseline was recorded, during which the participant stayed in a natural resting condition.
- (4)
- Data collection occurred over 30 min for one round of QST, during which participants followed instructions from the research assistant, reported pain intensities, and were asked to minimize unnecessary movement.
- (5)
- Another one-minute baseline was recorded.
- (6)
- Participants then performed physical maneuvers spanning about 3–5 min, with sensors disconnected.
- (7)
- Participants then repeated steps 3 to 5 for a second round of QST collection.
- (8)
- The sensors were removed, and participants were debriefed and compensated.
2.4. Quantitative Sensory Testing
- (1)
- Pressure pain threshold and tolerance were assessed using a digital pressure algometer. The testing sites were located on the dorsal surface of the forearm and over the trapezius muscle in the upper back and neck region. The researcher increased the pressure pain gradually via a flat round transducer on a small skin area (probe area 0.785 cm2) at a steady speed of ~1 lb./s (0.45 kg/s). The pressure value was first recorded when the participant reported the onset of pain as a pressure pain threshold and was terminated when the participant reached their maximum pain tolerance. Four trials were performed, including the left forearm, the right forearm, the left trapezius, and the right trapezius.
- (2)
- Mechanical pinprick pain was assessed by applying 10 calibrated force pinprick stimuli to the skin at a fixed frequency (1 Hz). Participants were asked to rate their pain intensity after the 1st, 5th, and 10th stimuli. The procedure was first applied on the left index finger and then repeated on the right index finger.
- (3)
- Cuff pain was assessed by inflating a blood pressure cuff on the left leg to a threshold pressure level (5 out of 10 on a scale) and maintained for a fixed duration (2 min). Participants were asked to rate their pain levels every 30 s.
- (4)
- Conditioned pain modulation was assessed by applying a noxious thermal stimulus and an increasing pressure pain simultaneously. Participants were first asked to submerge their dominant hand into the cold-water bath set at 6 degrees Celsius. Meanwhile, increasing pressure was applied to the non-dominant trapezius muscle, as described in the pressure pain steps. The participants then reported their onset of pain and their maximum pain tolerance. The post-pain rating was registered 15 s after the cessation of pressure pain.
2.5. Data Preprocessing
2.6. Feature Extraction and Selection
2.7. Analysis Plan
3. Experimental Results
3.1. Analysis Plan 1—Optimal Time Window Analysis
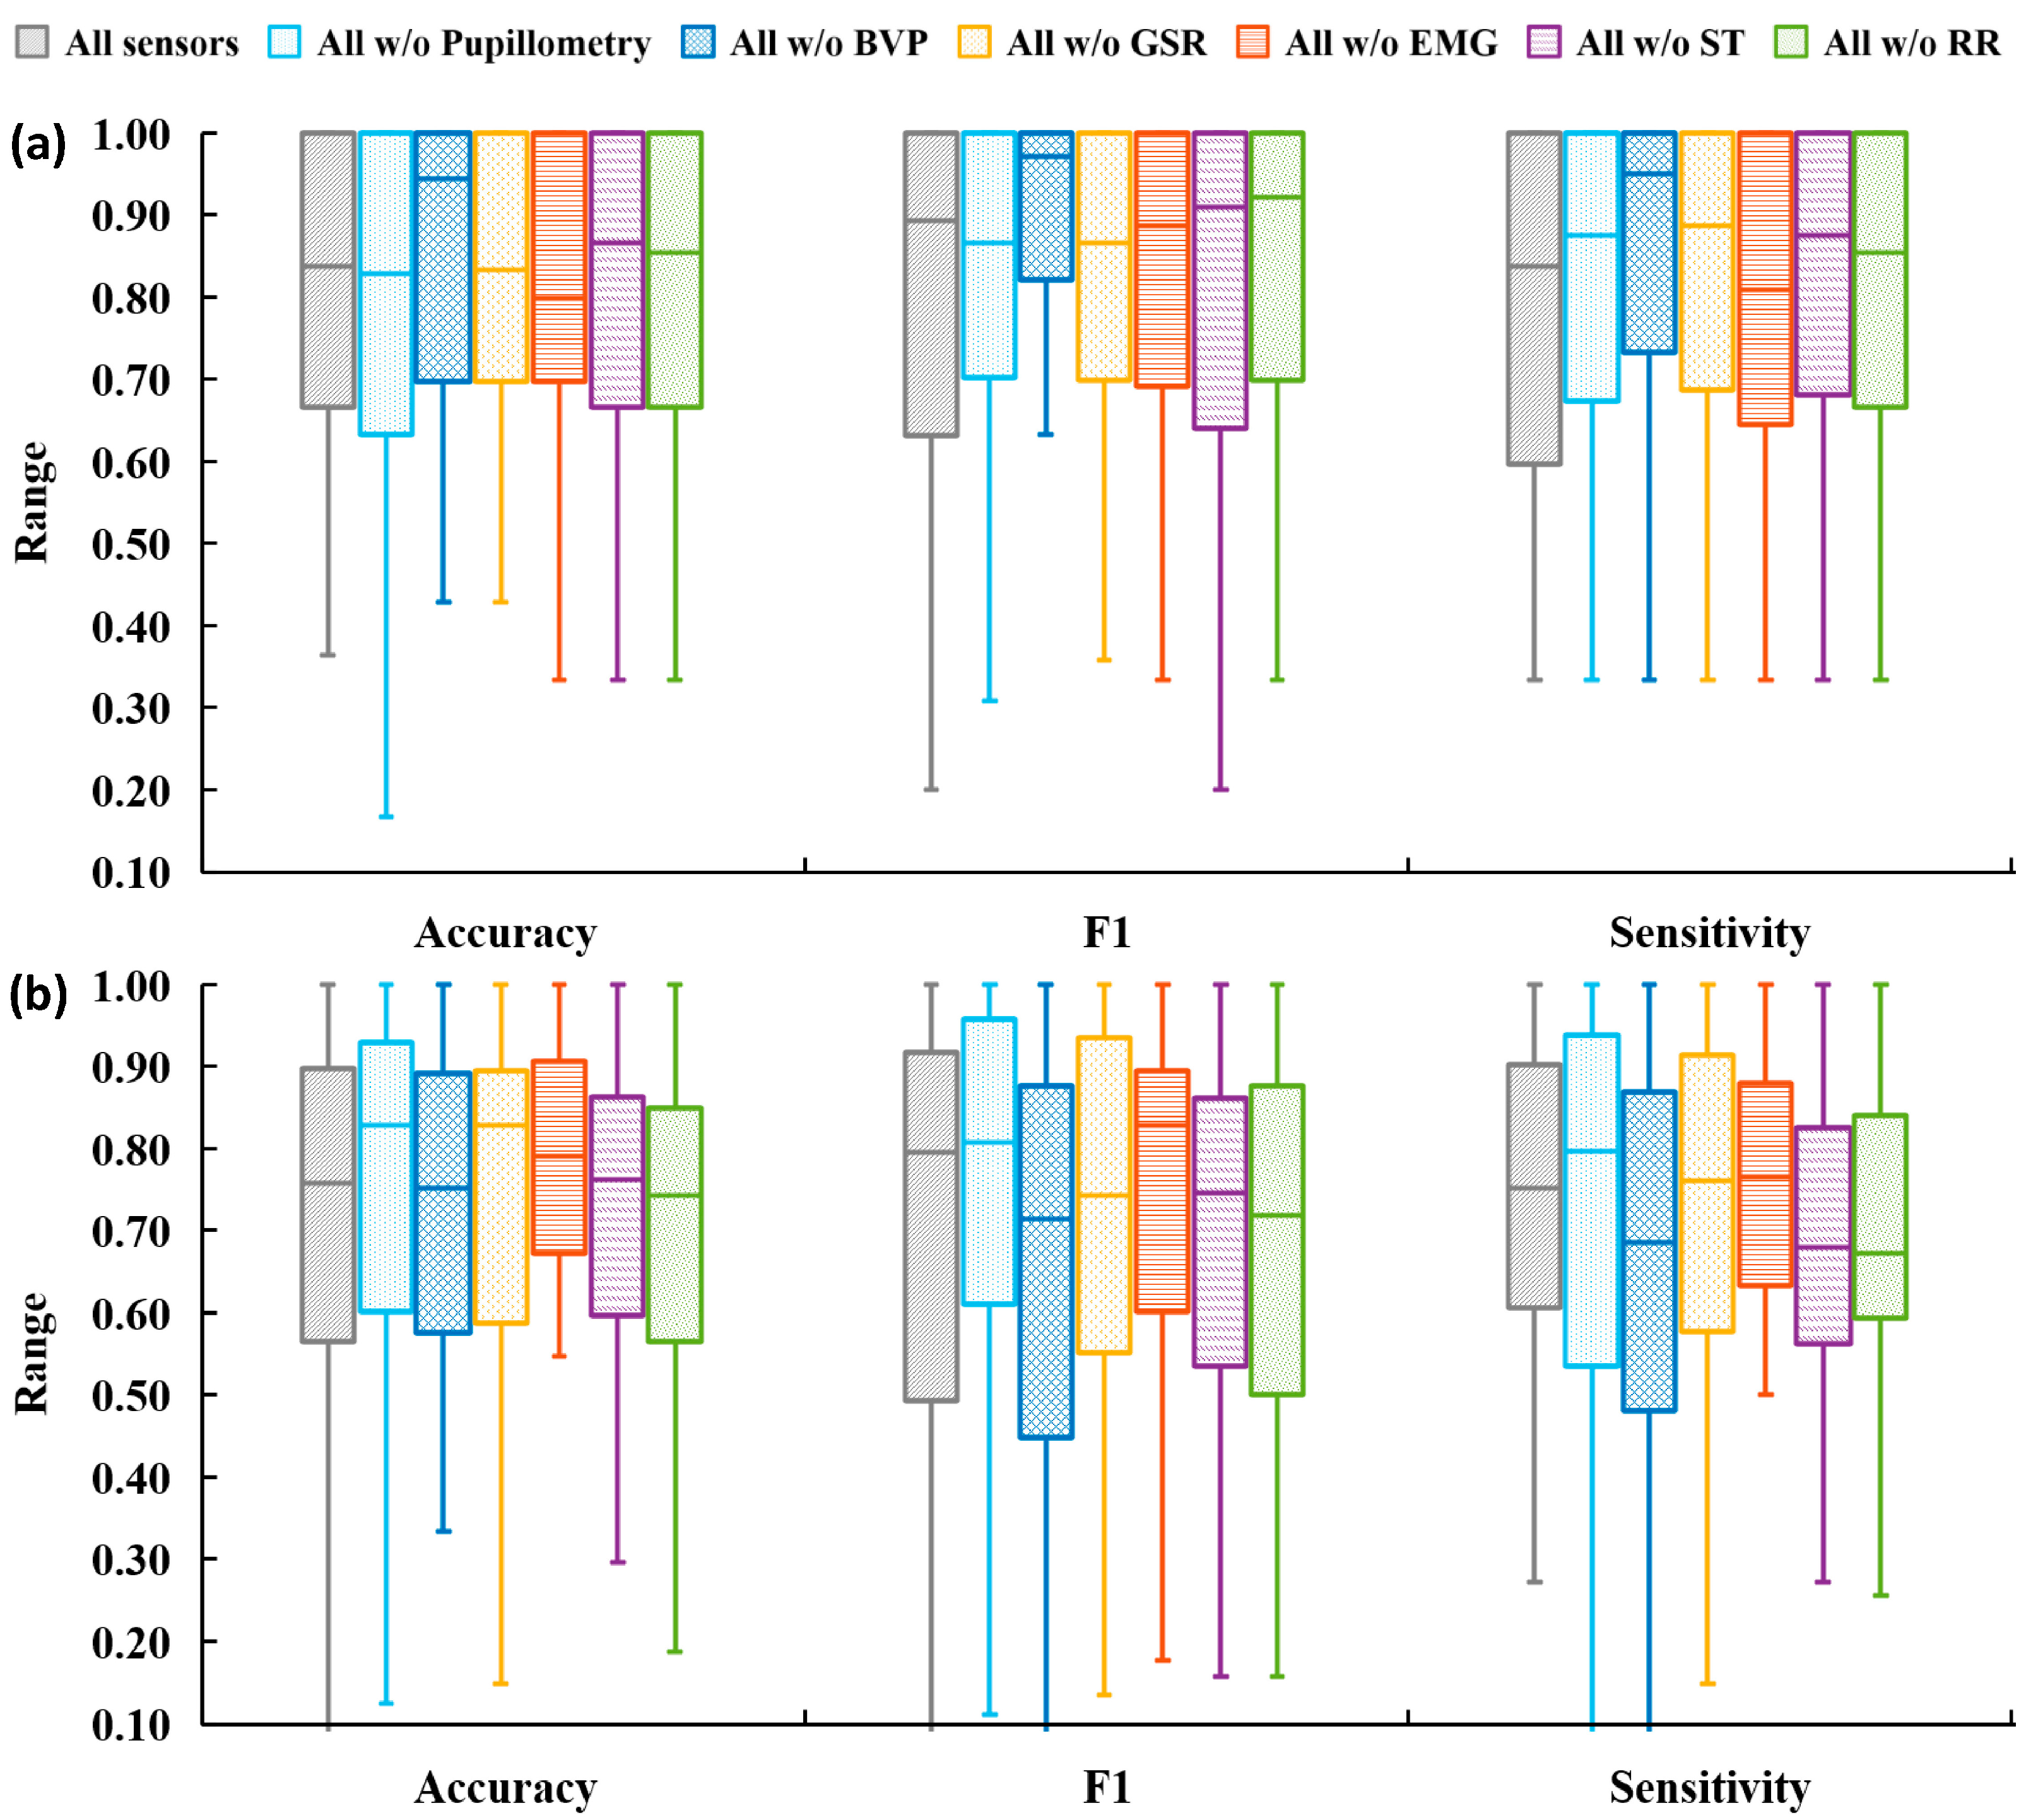
3.2. Analysis Plan 2—Component Sensitivity Analysis
4. Discussion
5. Conclusions
Supplementary Materials
Author Contributions
Funding
Institutional Review Board Statement
Informed Consent Statement
Data Availability Statement
Conflicts of Interest
References
- Rikard, S.M.; Strahan, A.E.; Schmit, K.M.; Guy, G.P. Chronic Pain Among Adults—United States, 2019–2021. MMWR Morb Mortal Wkly Rep. 2023, 72, 379–385. [Google Scholar] [CrossRef] [PubMed]
- Raja, S.N.; Carr, D.B.; Cohen, M.; Finnerup, N.B.; Flor, H.; Gibson, S.; Keefe, F.J.; Mogil, J.S.; Ringkamp, M.; Sluka, K.A.; et al. The revised International Association for the Study of Pain definition of pain: Concepts, challenges, and compromises. Pain 2020, 161, 1976–1982. [Google Scholar] [CrossRef] [PubMed]
- Lee, S.H.; Liang, H.W. Discriminative Changes in Sitting and Standing Postural Steadiness in Patients with Chronic Low Back Pain. IEEE Trans. Neural Syst. Rehabil. Eng. 2023, 31, 3752–3759. [Google Scholar] [CrossRef] [PubMed]
- Slaboda, J.C.; Boston, J.R.; Rudy, T.E.; Lieber, S.J.; Rasetshwane, D.M. The use of splines to calculate jerk for a lifting task involving chronic lower back pain patients. IEEE Trans. Neural Syst. Rehabil. Eng. 2005, 13, 406–414. [Google Scholar] [CrossRef]
- Davis, K.D.; Aghaeepour, N.; Ahn, A.H.; Angst, M.S.; Borsook, D.; Brenton, A.; Burczynski, M.E.; Crean, C.; Edwards, R.; Gaudilliere, B.; et al. Discovery and validation of biomarkers to aid the development of safe and effective pain therapeutics: Challenges and opportunities. Nat. Rev. Neurol. 2020, 16, 381–400. [Google Scholar] [CrossRef]
- Berger, S.E.; Vachon-Presseau, É.; Abdullah, T.B.; Baria, A.T.; Schnitzer, T.J.; Apkarian, A.V. Hippocampal morphology mediates biased memories of chronic pain. Neuroimage 2018, 166, 86–98. [Google Scholar] [CrossRef]
- Naugle, K.M.; Ohlman, T.; Naugle, K.E.; Riley, Z.A.; Keith, N.R. Physical activity behavior predicts endogenous pain modulation in older adults. Pain 2017, 158, 383–390. [Google Scholar] [CrossRef]
- Nijs, J.; Girbés, E.L.; Lundberg, M.; Malfliet, A.; Sterling, M. Exercise therapy for chronic musculoskeletal pain: Innovation by altering pain memories. Man. Ther. 2015, 20, 216–220. [Google Scholar] [CrossRef]
- Deyo, R.A.; Mirza, S.K.; Turner, J.A.; Martin, B.I. Overtreating chronic back pain: Time to back off? J. Am. Board Fam. Med. 2009, 22, 62–68. [Google Scholar] [CrossRef]
- Von Korff, M.R. Health Care for chronic pain: Overuse, underuse, and treatment needs: Commentary on: Chronic pain and health services utilization—Is there overuse of diagnostic tests and inequalities in nonpharmacologic methods utilization? Med. Care 2013, 51, 857–858. [Google Scholar] [CrossRef]
- Edwards, R.R.; Sarlani, E.; Wesselmann, U.; Fillingim, R.B. Quantitative assessment of experimental pain perception: Multiple domains of clinical relevance. Pain 2005, 114, 315–319. [Google Scholar] [CrossRef] [PubMed]
- Meints, S.M.; Mawla, I.; Napadow, V.; Kong, J.; Gerber, J.; Chan, S.-T.; Wasan, A.D.; Kaptchuk, T.J.; McDonnell, C.; Carriere, J.; et al. The relationship between catastrophizing and altered pain sensitivity in patients with chronic low-back pain. Pain 2019, 160, 833–843. [Google Scholar] [CrossRef] [PubMed]
- Fillingim, R.B.; Bruehl, S.; Dworkin, R.H.; Dworkin, S.F.; Loeser, J.D.; Turk, D.C.; Widerstrom-Noga, E.; Arnold, L.; Bennett, R.; Edwards, R.R.; et al. The ACTTION-American Pain Society Pain Taxonomy (AAPT): An evidence-based and multidimensional approach to classifying chronic pain conditions. J. Pain 2014, 15, 241–249. [Google Scholar] [CrossRef] [PubMed]
- Chai, P.R.; Gale, J.Y.; Patton, M.E.; Schwartz, E.; Jambaulikar, G.D.; Taylor, S.W.; Edwards, R.R.; Boyer, E.W.; Schreiber, K.L. The impact of music on nociceptive processing. Pain Med. 2020, 21, 3047–3054. [Google Scholar] [CrossRef]
- Yang, G.; Lin, Y. Using ECG Signal to Quantify Mental Workload Based on Wavelet Transform and Competitive Neural Network Techniques. Biomed. Soft Comput. Hum. Sci. 2009, 14, 17–25. [Google Scholar]
- Liang, B.; Lin, Y. Using Physiological and Behavioral Measurements in a Picture-Based Road Hazard Perception Experiment to Classify Risky and Safe Drivers. Transp. Res. Part F Traffic Psychol. Behav. 2018, 58, 93–105. [Google Scholar] [CrossRef]
- Yang, G.; Lin, Y.; Bhattacharya, P. A driver fatigue recognition model based on information fusion and dynamic Bayesian network. Inf. Sci. 2010, 180, 1942–1954. [Google Scholar] [CrossRef]
- Wu, S.W.; Wang, Y.-C.; Hsieh, P.-C.; Tseng, M.-T.; Chiang, M.-C.; Chu, C.-P.; Feng, F.-P.; Lin, Y.-H.; Hsieh, S.-T.; Chao, C.-C. Biomarkers of neuropathic pain in skin nerve degeneration neuropathy: Contact heat-evoked potentials as a physiological signature. Pain 2017, 158, 516–525. [Google Scholar] [CrossRef]
- Jang, E.H.; Park, B.J.; Park, M.S.; Kim, S.H.; Sohn, J.H. Analysis of physiological signals for recognition of boredom, pain, and surprise emotions. J. Physiol. Anthr. 2015, 34, 25. [Google Scholar] [CrossRef]
- Johnson, A.; Yang, F.; Gollarahalli, S.; Banerjee, T.; Abrams, D.; Jonassaint, J.; Jonassaint, C.; Shah, N. Use of mobile health apps and wearable technology to assess changes and predict pain during treatment of acute pain in sickle cell disease: Feasibility study. JMIR Mhealth Uhealth 2019, 7, e13671. [Google Scholar] [CrossRef]
- Lin, Y.; Xiao, Y.; Wang, L.; Guo, Y.; Zhu, W.; Dalip, B.; Kamarthi, S.; Schreiber, K.L.; Edwards, R.R.; Urman, R.D. Experimental Exploration of Objective Human Pain Assessment Using Multimodal Sensing Signals. Front. Neurosci. 2022, 16, 831627. [Google Scholar] [CrossRef] [PubMed]
- Misra, G.; Wang, W.E.; Archer, D.B.; Roy, A.; Coombes, S.A. Automated classification of pain perception using high-density electroencephalography data. J. Neurophysiol. 2017, 117, 786–795. [Google Scholar] [CrossRef] [PubMed]
- Elsayed, M.; Sim, K.S.; Tan, S.C. A novel approach to objectively quantify the subjective perception of pain through electroencephalogram signal analysis. IEEE Access 2020, 8, 199920–199930. [Google Scholar] [CrossRef]
- Olesen, A.E.; Andresen, T.; Staahl, C.; Drewes, A.M. Human experimental pain models for assessing the therapeutic efficacy of analgesic drugs. Pharmacol. Rev. 2012, 64, 722–779. [Google Scholar] [CrossRef]
- Zhu, W.; Xiao, Y.; Lin, Y. A Novel Labeling Method of Physiological-based Pressure Pain Assessment Among Patients with and Without Chronic Low Back Pain. Proc. Human. Factors Ergon. Soc. Annu. Meet. 2024, 68, 456–459. [Google Scholar] [CrossRef]
- Dolgin, E. How a ‘pain-o-meter’ could improve treatments. Nature 2024, 633, S26–S27. [Google Scholar] [CrossRef]
- Guo, Y.; Wang, L.; Xiao, Y.; Lin, Y. A Personalized Spatial-Temporal Cold Pain Intensity Estimation Model Based on Facial Expression. IEEE J. Transl. Eng. Health Med. 2021, 9, 4901008. [Google Scholar] [CrossRef]
- Wang, L.; Guo, Y.; Dalip, B.; Xiao, Y.; Urman, R.D.; Lin, Y. An experimental study of objective pain measurement using pupillary response based on genetic algorithm and artificial neural network. Appl. Intell. 2021, 52, 1145–1156. [Google Scholar] [CrossRef]
- Wang, L.; Xiao, Y.; Urman, R.D.; Lin, Y. Cold pressor pain assessment based on EEG power spectrum. SN Appl. Sci. 2020, 2, 1976. [Google Scholar] [CrossRef]
- Chen, D.; Zhang, H.; Kavitha, P.T.; Loy, F.L.; Ng, S.H.; Wang, C.; Phua, K.S.; Tjan, S.Y.; Yang, S.-Y.; Guan, C. Scalp EEG-Based Pain Detection Using Convolutional Neural Network. IEEE Trans. Neural Syst. Rehabil. Eng. 2022, 30, 274–285. [Google Scholar] [CrossRef]
- Zheng, J.; Lin, Y. Using Physiological Signals for Pain Assessment: An Evaluation of Deep Learning Models. In Proceedings of the 2024 30th International Conference on Mechatronics and Machine Vision in Practice (M2VIP), Leeds, UK, 3–5 October 2024; IEEE: Piscataway, NJ, USA, 2024; pp. 1–6. [Google Scholar] [CrossRef]
- Zheng, J.; Lin, Y. An Objective Pain Measurement Machine Learning Model through Facial Expressions and Physiological Signals. In Proceedings of the 2022 28th International Conference on Mechatronics and Machine Vision in Practice (M2VIP), Nanjing, China, 16–18 November 2022; IEEE: Piscataway, NJ, USA, 2022; pp. 1–4. [Google Scholar] [CrossRef]
- Khan, M.U.; Aziz, S.; Hirachan, N.; Joseph, C.; Li, J.; Fernandez-Rojas, R. Experimental Exploration of Multilevel Human Pain Assessment Using Blood Volume Pulse (BVP) Signals. Sensors 2023, 23, 3980. [Google Scholar] [CrossRef] [PubMed]
- Pickering, G.; Achard, A.; Corriger, A.; Sickout-Arondo, S.; Macian, N.; Leray, V.; Lucchini, C.; Cardot, J.-M.; Pereira, B. Electrochemical Skin Conductance and Quantitative Sensory Testing on Fibromyalgia. Pain Pract. 2020, 20, 348–356. [Google Scholar] [CrossRef] [PubMed]
- Gray, S.M.; Cuomo, A.M.; Proppe, C.E.; Traylor, M.K.; Hill, E.C.; Keller, J.L. Effects of Sex and Cuff Pressure on Physiological Responses during Blood Flow Restriction Resistance Exercise in Young Adults. Med. Sci. Sports Exerc. 2023, 55, 920–931. [Google Scholar] [CrossRef] [PubMed]
- Tiemann, L.; Achard, A.; Corriger, A.; Sickout-Arondo, S.; Macian, N.; Leray, V.; Lucchini, C.; Cardot, J.; Pereira, B. Distinct patterns of brain activity mediate perceptual and motor and autonomic responses to noxious stimuli. Nat. Commun. 2018, 9, 4487. [Google Scholar] [CrossRef]
- Nickel, M.M.; Hohn, V.D.; Dinh, S.T.; May, E.S.; Nickel, M.M.; Gross, J.; Ploner, M. Temporal–spectral signaling of sensory information and expectations in the cerebral processing of pain. Proc. Natl. Acad. Sci. USA 2022, 119, e2116616119. [Google Scholar] [CrossRef]
- Tan, G.; Jensen, M.P.; Thornby, J.I.; Shanti, B.F. Validation of the brief pain inventory for chronic nonmalignant pain. J. Pain 2004, 5, 133–137. [Google Scholar] [CrossRef]
- Zhu, W.; Kucyi, A.; Kramer, A.F.; Lin, Y. Multimodal Physiological Assessment of the Task-related Attentional States in a VR Driving Environment. In Proceedings of the 2022 28th International Conference on Mechatronics and Machine Vision in Practice (M2VIP), Nanjing, China, 16–18 November 2022; pp. 1–5. [Google Scholar]
- Fernández, A.; García, S.; Herrera, F.; Chawla, N.V. SMOTE for Learning from Imbalanced Data: Progress and Challenges, Marking the 15-year Anniversary. J. Artif. Intell. Res. 2018, 61, 863–905. [Google Scholar]
- Lin, Y.; Wang, L.; Xiao, Y.; Urman, R.D.; Dutton, R.; Ramsay, M. Objective Pain Measurement based on Physiological Signals. Proc. Int. Symp. Hum. Factors Ergon. Health Care 2018, 7, 240–247. [Google Scholar] [CrossRef]
- Zhu, W.; Liu, C.; Yu, H.; Guo, Y.; Xiao, Y.; Lin, Y. COMPASS App: A Patient-centered Physiological based Pain Assessment System. Proc. Hum. Factors Ergon. Soc. Annu. Meet. 2023, 67, 1361–1367. [Google Scholar] [CrossRef]
- Kent, M.L.; Tighe, P.J.; Belfer, I.; Brennan, T.J.; Bruehl, S.; Brummett, C.M.; Buckenmaier, C.C.; Buvanendran, A.; Cohen, R.I.; Desjardins, P.; et al. The ACTTION-APS-AAPM Pain Taxonomy (AAAPT) Multidimensional Approach to Classifying Acute Pain Conditions. Pain Med. 2017, 18, 947–958. [Google Scholar] [CrossRef]
- Cerqueira, M.S.; Costa, E.C.; Oliveira, R.S.; Pereira, R.; Brito Vieira, W.H. Blood Flow Restriction Training: To Adjust or Not Adjust the Cuff Pressure Over an Intervention Period? Front. Media 2021, 12, 678407. [Google Scholar] [CrossRef]
- Pouromran, F.; Lin, Y.; Kamarthi, S. Personalized Deep Bi-LSTM RNN Based Model for Pain Intensity Classification Using EDA Signal. Sensors 2022, 22, 8087. [Google Scholar] [CrossRef] [PubMed]
- Lopez-Martinez, D.; Picard, R. Multi-task Neural Networks for Personalized Pain Recognition from Physiological Signals. August. arXiv 2017, arXiv:1708.08755. [Google Scholar] [CrossRef]
- Aguileta, A.A.; Brena, R.F.; Mayora, O.; Molino-Minero-Re, E.; Trejo, L.A. Multi-Sensor Fusion for Activity Recognition—A Survey. Sensors 2019, 19, 3808. [Google Scholar] [CrossRef]
- Ivanov, P.C. The New Field of Network Physiology: Building the Human Physiolome. Front. Netw. Physiol. 2021, 1, 711778. [Google Scholar] [CrossRef]
- Bashan, A.; Bartsch, R.P.; Kantelhardt, J.W.; Havlin, S.; Ivanov, P.C. Network physiology reveals relations between network topology and physiological function. Nat. Commun. 2012, 3, 702. [Google Scholar] [CrossRef]
- Candia-Rivera, D.; Chavez, M.; De Vico Fallani, F. Measures of the coupling between fluctuating brain network organization and heartbeat dynamics. Netw. Neurosci. 2024, 8, 557–575. [Google Scholar] [CrossRef]
- Bartsch, R.P.; Liu, K.K.L.; Bashan, A.; Ivanov, P.C. Network Physiology: How Organ Systems Dynamically Interact. PLoS ONE 2015, 10, e0142143. [Google Scholar] [CrossRef]
- Rojas, R.F.; Brown, N.; Waddington, G.; Goecke, R. A systematic review of neurophysiological sensing for the assessment of acute pain. NPJ Digit. Med. 2023, 6, 76. [Google Scholar] [CrossRef]
- Lewis, A.; Valla, V.; Charitou, P.; Karapatsia, A.; Koukoura, A.; Tzelepi, K.; Bergsteinsson, J., I; Ouzounelli, M.; Vassiliadis, E. Digital Health Technologies for Medical Devices—Real World Evidence Collection—Challenges and Solutions Towards Clinical Evidence. Int. J. Digit. Health 2022, 2, 8. [Google Scholar] [CrossRef]


| Logistic Regression | C | 10−3, 10−2, 10−1, 1, 10, 102, 103 |
| Penalty | L1, L2 | |
| Decision Tree | Criterion | gini, entropy |
| Max Depth | 4, 5, 6, 7, 8, 9, 10, 11, 12, 15, 20, 30, 40, 50, 70, 90, 120 | |
| K Nearest Neighbors | Algorithm | Ball tree, kd tree, brute |
| Leaf size | Range from 1 to 50 step 3 | |
| N neighbors | 10, 13, 16, 19, 22, 25, 28 | |
| Stochastic Gradient Descent | Alpha | 10−2, 10−3, 10−4 |
| L1 ratio | 0.05, 0.06, 0.07, 0.08, 0.09, 0.1, 0.12, 0.13, 0.14, 0.15, 0.2 | |
| Penalty | L1, L2 | |
| Loss function | hinge, log, modified Huber, squared hinge | |
| AdaBoost | Base estimator | Decision tree |
| Max depth | 2, 5, 8, 11 | |
| Min sample | 5, 10 | |
| N estimators | 10, 50, 100, 250 | |
| Learning rate | 0.01, 0.1 |
| Mean ± SD or % | cLBP Patient | Healthy Group |
|---|---|---|
| Number of participants | 7 | 17 |
| Age, y | 44.4 ± 14.5 | 28.8 ± 13.1 |
| Female sex | 5 | 11 |
| Pain duration, y | 14.0 ± 15.5 | 0 |
| Pain intensity | 5.0 ± 1.4 | 0.3 ± 0.4 |
| Pain interference | 3.7 ± 2.5 | 0.1 ± 0.2 |
| QST Session | Sample Size | Mean ± STD (s) |
|---|---|---|
| Baseline | 32 | 59.80 ± 6.93 |
| Pressure–Threshold | 160 | 6.86 ± 3.74 |
| Pressure–Tolerance | 160 | 13.99 ± 5.34 |
| Pinprick | 128 | 6.99 ± 1.44 |
| Cuff | 128 | 29.95 ± 3.39 |
| Pinprick | Cuff | Pressure | ||||
|---|---|---|---|---|---|---|
| Sensor Set | Accuracy % | F-1 Score % | Accuracy % | F-1 Score % | Accuracy % | F-1 Score % |
| All sensors | 79.8 | 62.9 | 76.5 | 60.8 | 72.3 | 66.4 |
| All w/o BVP | 86 ↑ | 73.8 ↑ | 70.4 ↓ | 47.5 ↓ | 72.3 | 66.4 |
| All w/o EMG | 80.7 | 65.4 | 74.6 | 58.6 | 72.3 | 66.4 |
| All w/o GSR | 82.1 | 67.7 | 79.0 ↑ | 60.7 ↑ | 72.3 | 66.4 |
| All w/o RR | 80.6 | 63.8 | 74.2 ↓ | 53.9 ↓ | 72.4 | 66.7 |
| All w/o ST | 80.7 | 67.4 | 71.0 | 51.1 | 72.3 | 66.4 |
| All w/o pupillometry | 78.4 | 59.9 | 81.8 ↑ | 62.3 ↑ | 72.3 | 66.4 |
Disclaimer/Publisher’s Note: The statements, opinions and data contained in all publications are solely those of the individual author(s) and contributor(s) and not of MDPI and/or the editor(s). MDPI and/or the editor(s) disclaim responsibility for any injury to people or property resulting from any ideas, methods, instructions or products referred to in the content. |
© 2025 by the authors. Licensee MDPI, Basel, Switzerland. This article is an open access article distributed under the terms and conditions of the Creative Commons Attribution (CC BY) license (https://creativecommons.org/licenses/by/4.0/).
Share and Cite
Zhu, W.; Lin, Y. Physiological Sensor Modality Sensitivity Test for Pain Intensity Classification in Quantitative Sensory Testing. Sensors 2025, 25, 2086. https://doi.org/10.3390/s25072086
Zhu W, Lin Y. Physiological Sensor Modality Sensitivity Test for Pain Intensity Classification in Quantitative Sensory Testing. Sensors. 2025; 25(7):2086. https://doi.org/10.3390/s25072086
Chicago/Turabian StyleZhu, Wenchao, and Yingzi Lin. 2025. "Physiological Sensor Modality Sensitivity Test for Pain Intensity Classification in Quantitative Sensory Testing" Sensors 25, no. 7: 2086. https://doi.org/10.3390/s25072086
APA StyleZhu, W., & Lin, Y. (2025). Physiological Sensor Modality Sensitivity Test for Pain Intensity Classification in Quantitative Sensory Testing. Sensors, 25(7), 2086. https://doi.org/10.3390/s25072086