Innovations in Air Quality Monitoring: Sensors, IoT and Future Research

 , ,
, ,  ,
, 
Abstract
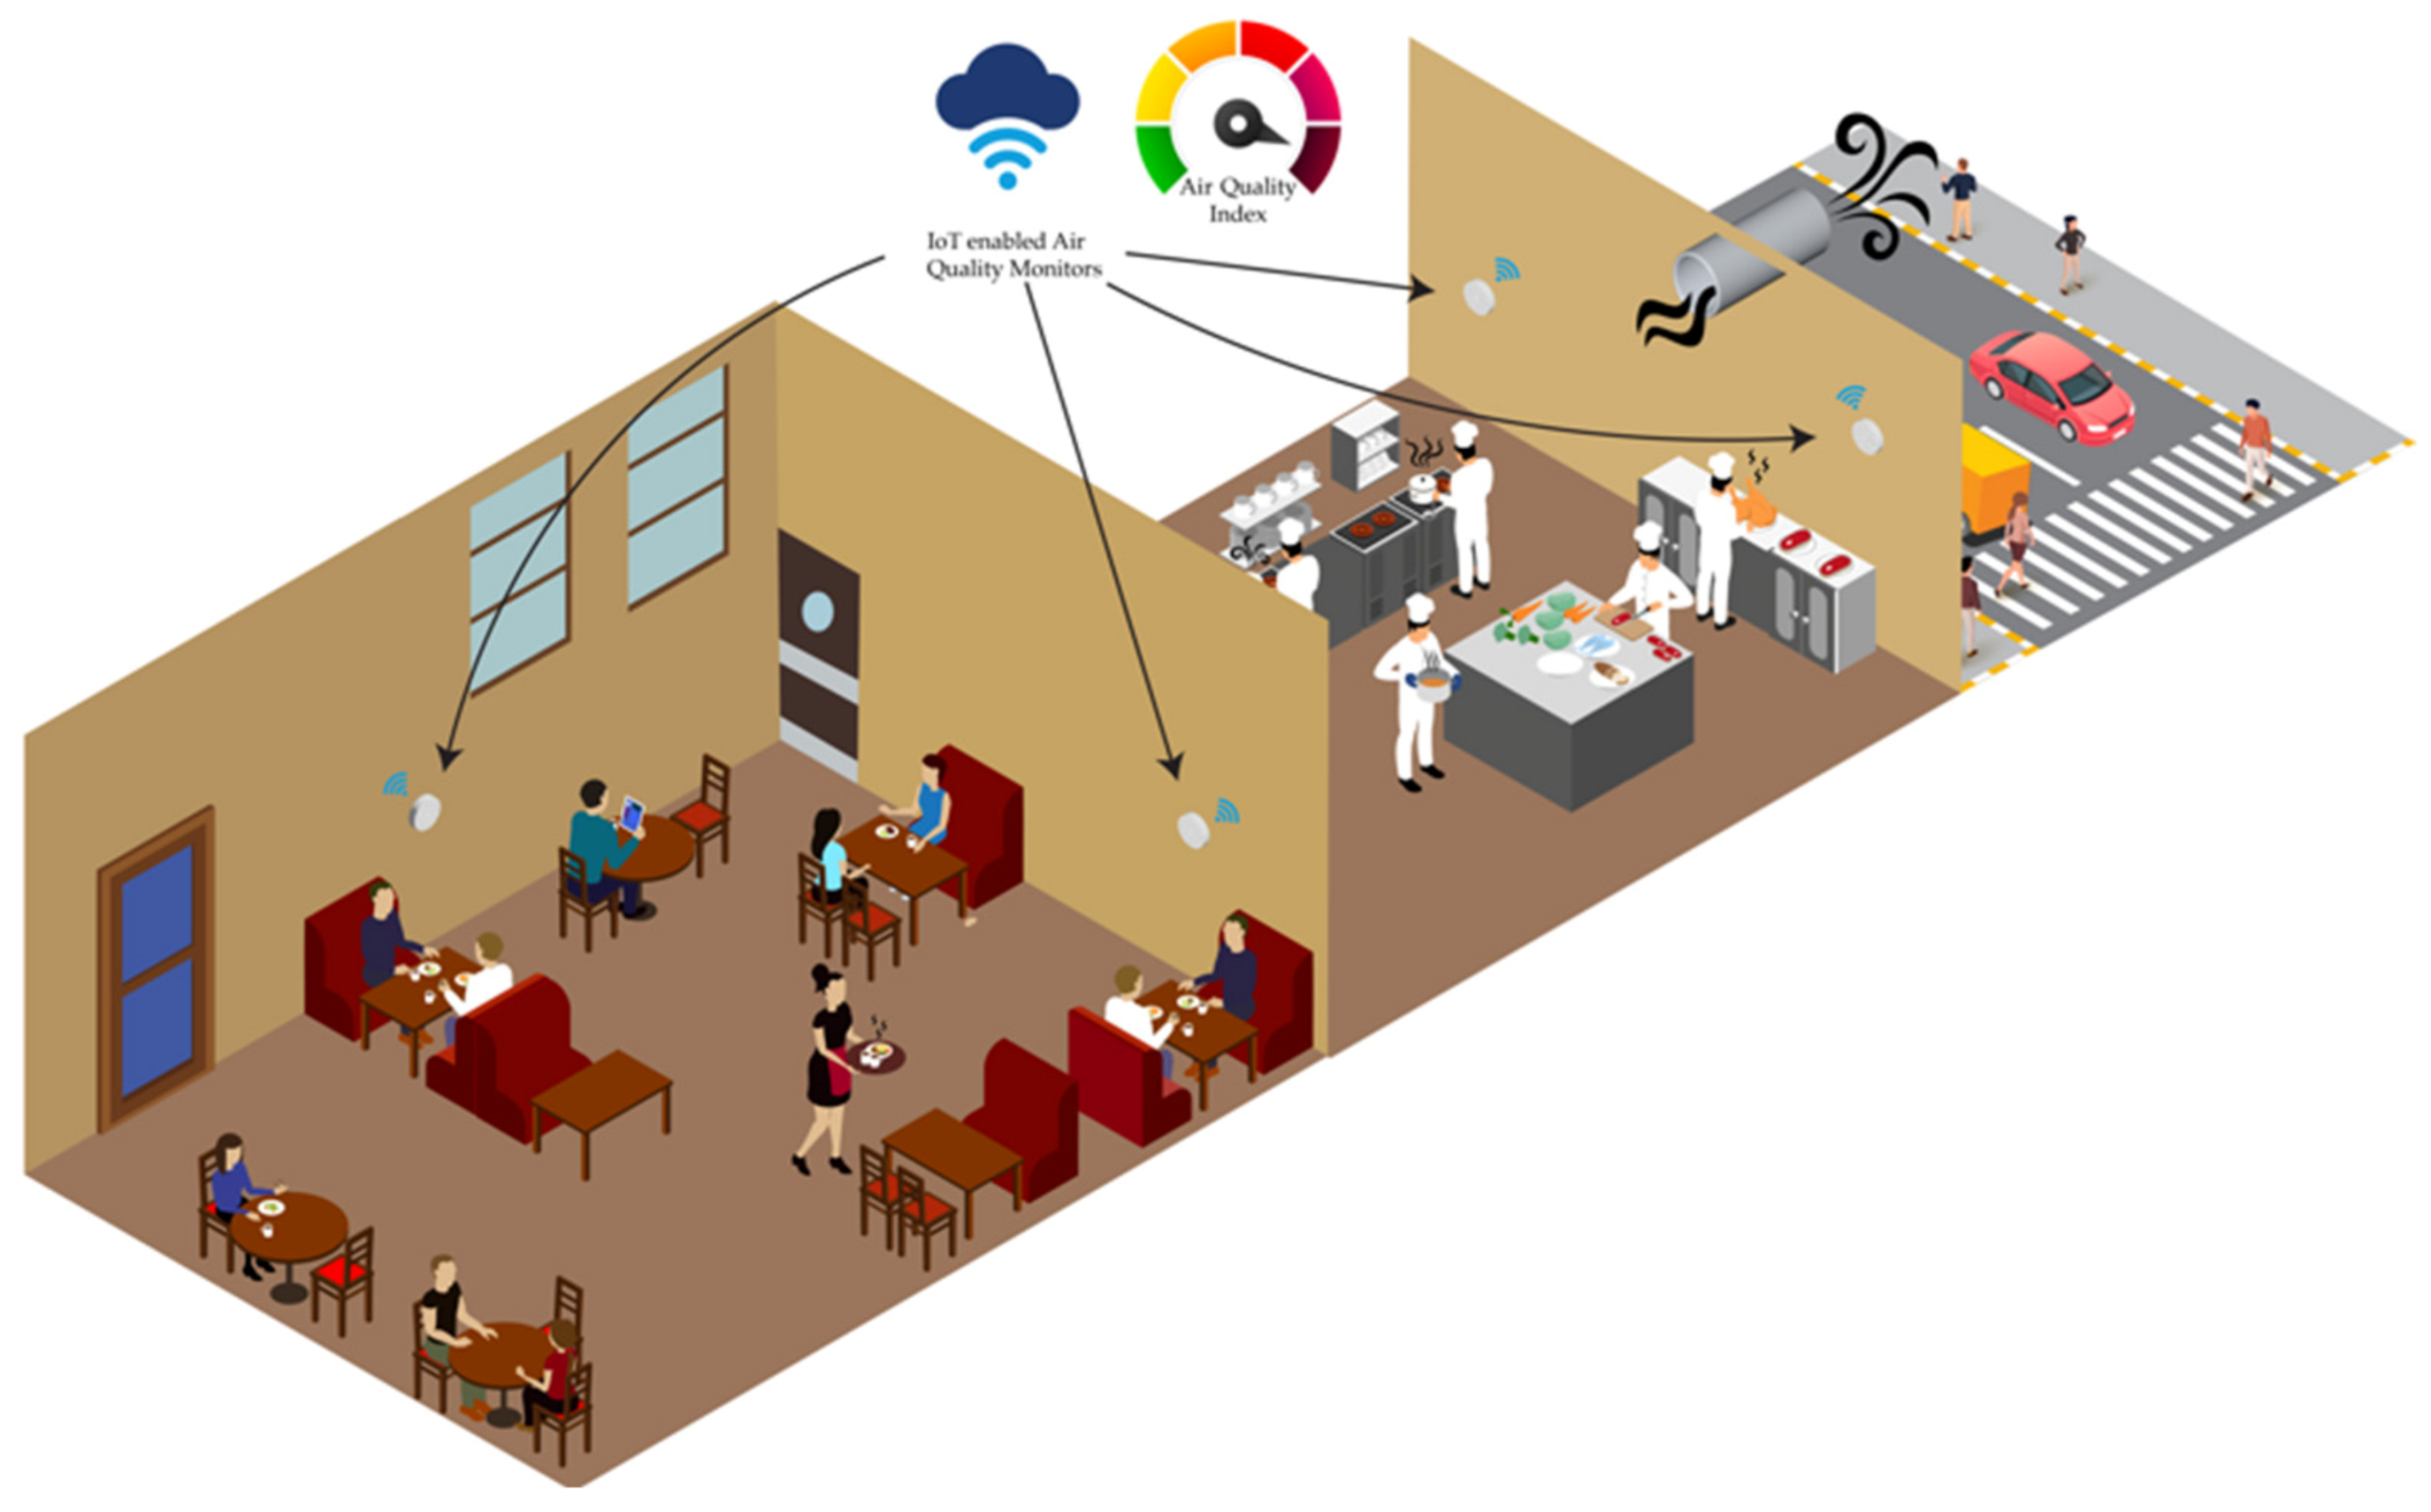
1. Introduction
- Technical details of air quality composition and potential air pollutants are presented.
- AQM sensors are scrutinised in terms of design, materials and methodologies for pollutant monitoring.
- A critical review of IoT frameworks for AQM is carried out alongside an analysis of their strengths and weaknesses.
- Experimental performance evaluation of three commercially available AQM systems in the UK is discussed with a comparative and critical results analysis.
- Future research directions in AQM are also highlighted related to sensor designs and IoT framework development.
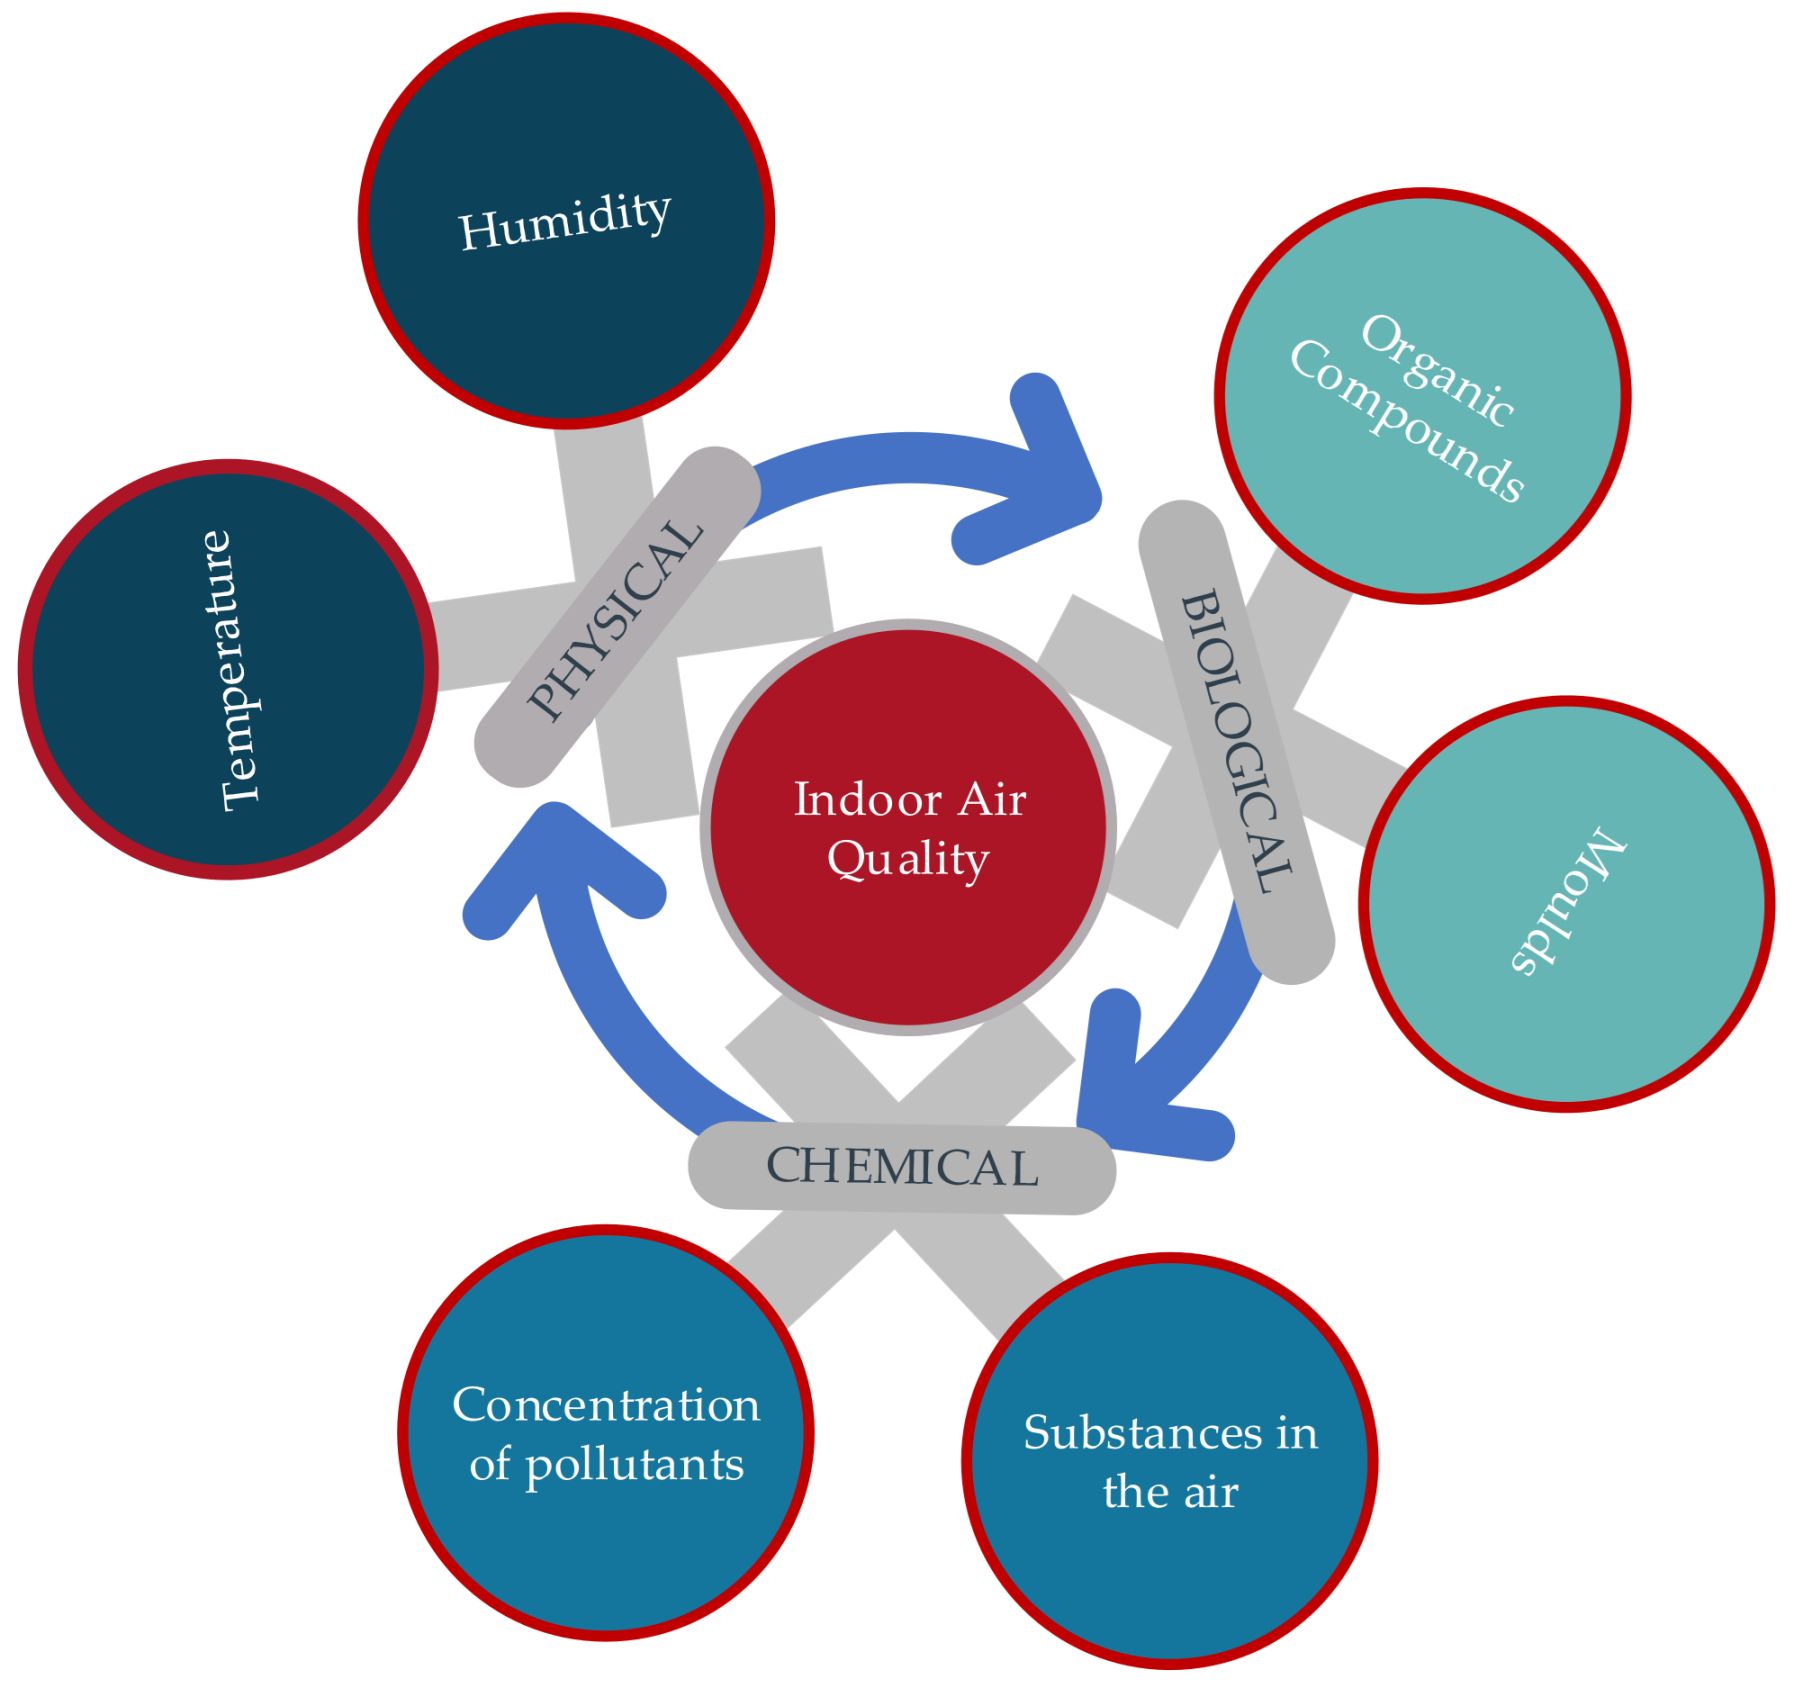
2. Air Composition and Pollutants
2.1. Atmosphere Air Composition
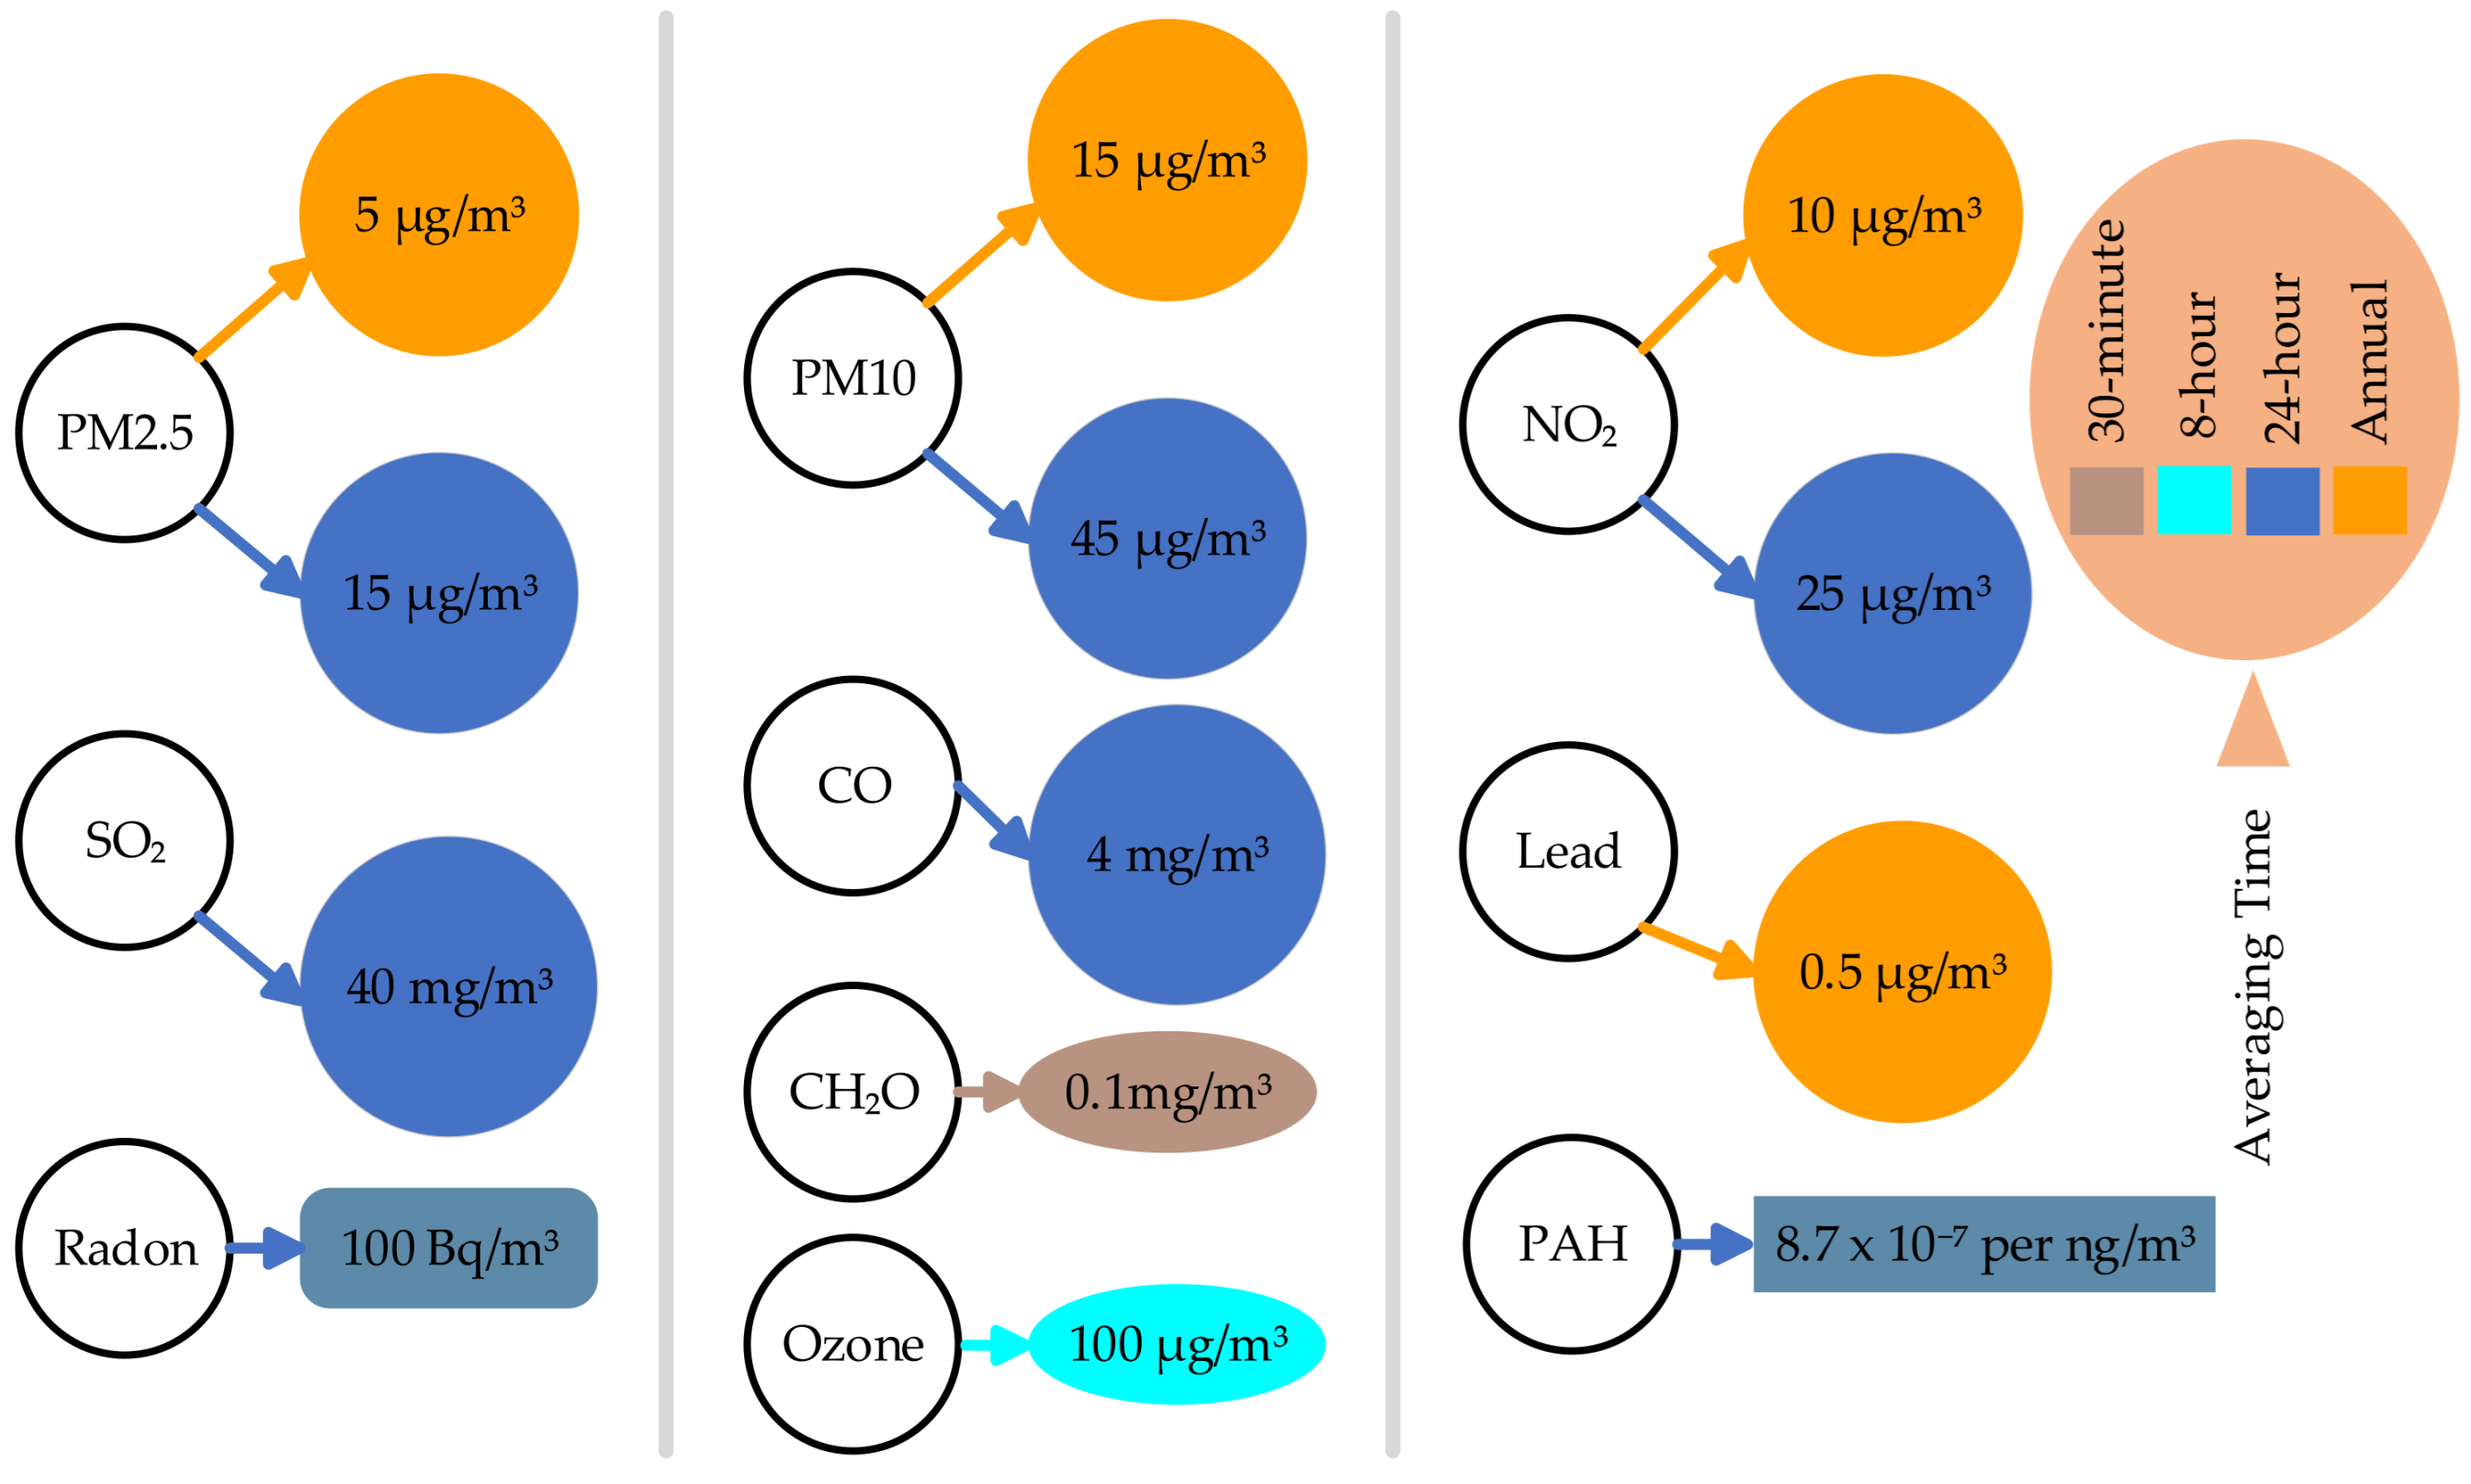
2.2. Air Pollutants
2.2.1. Ammonia
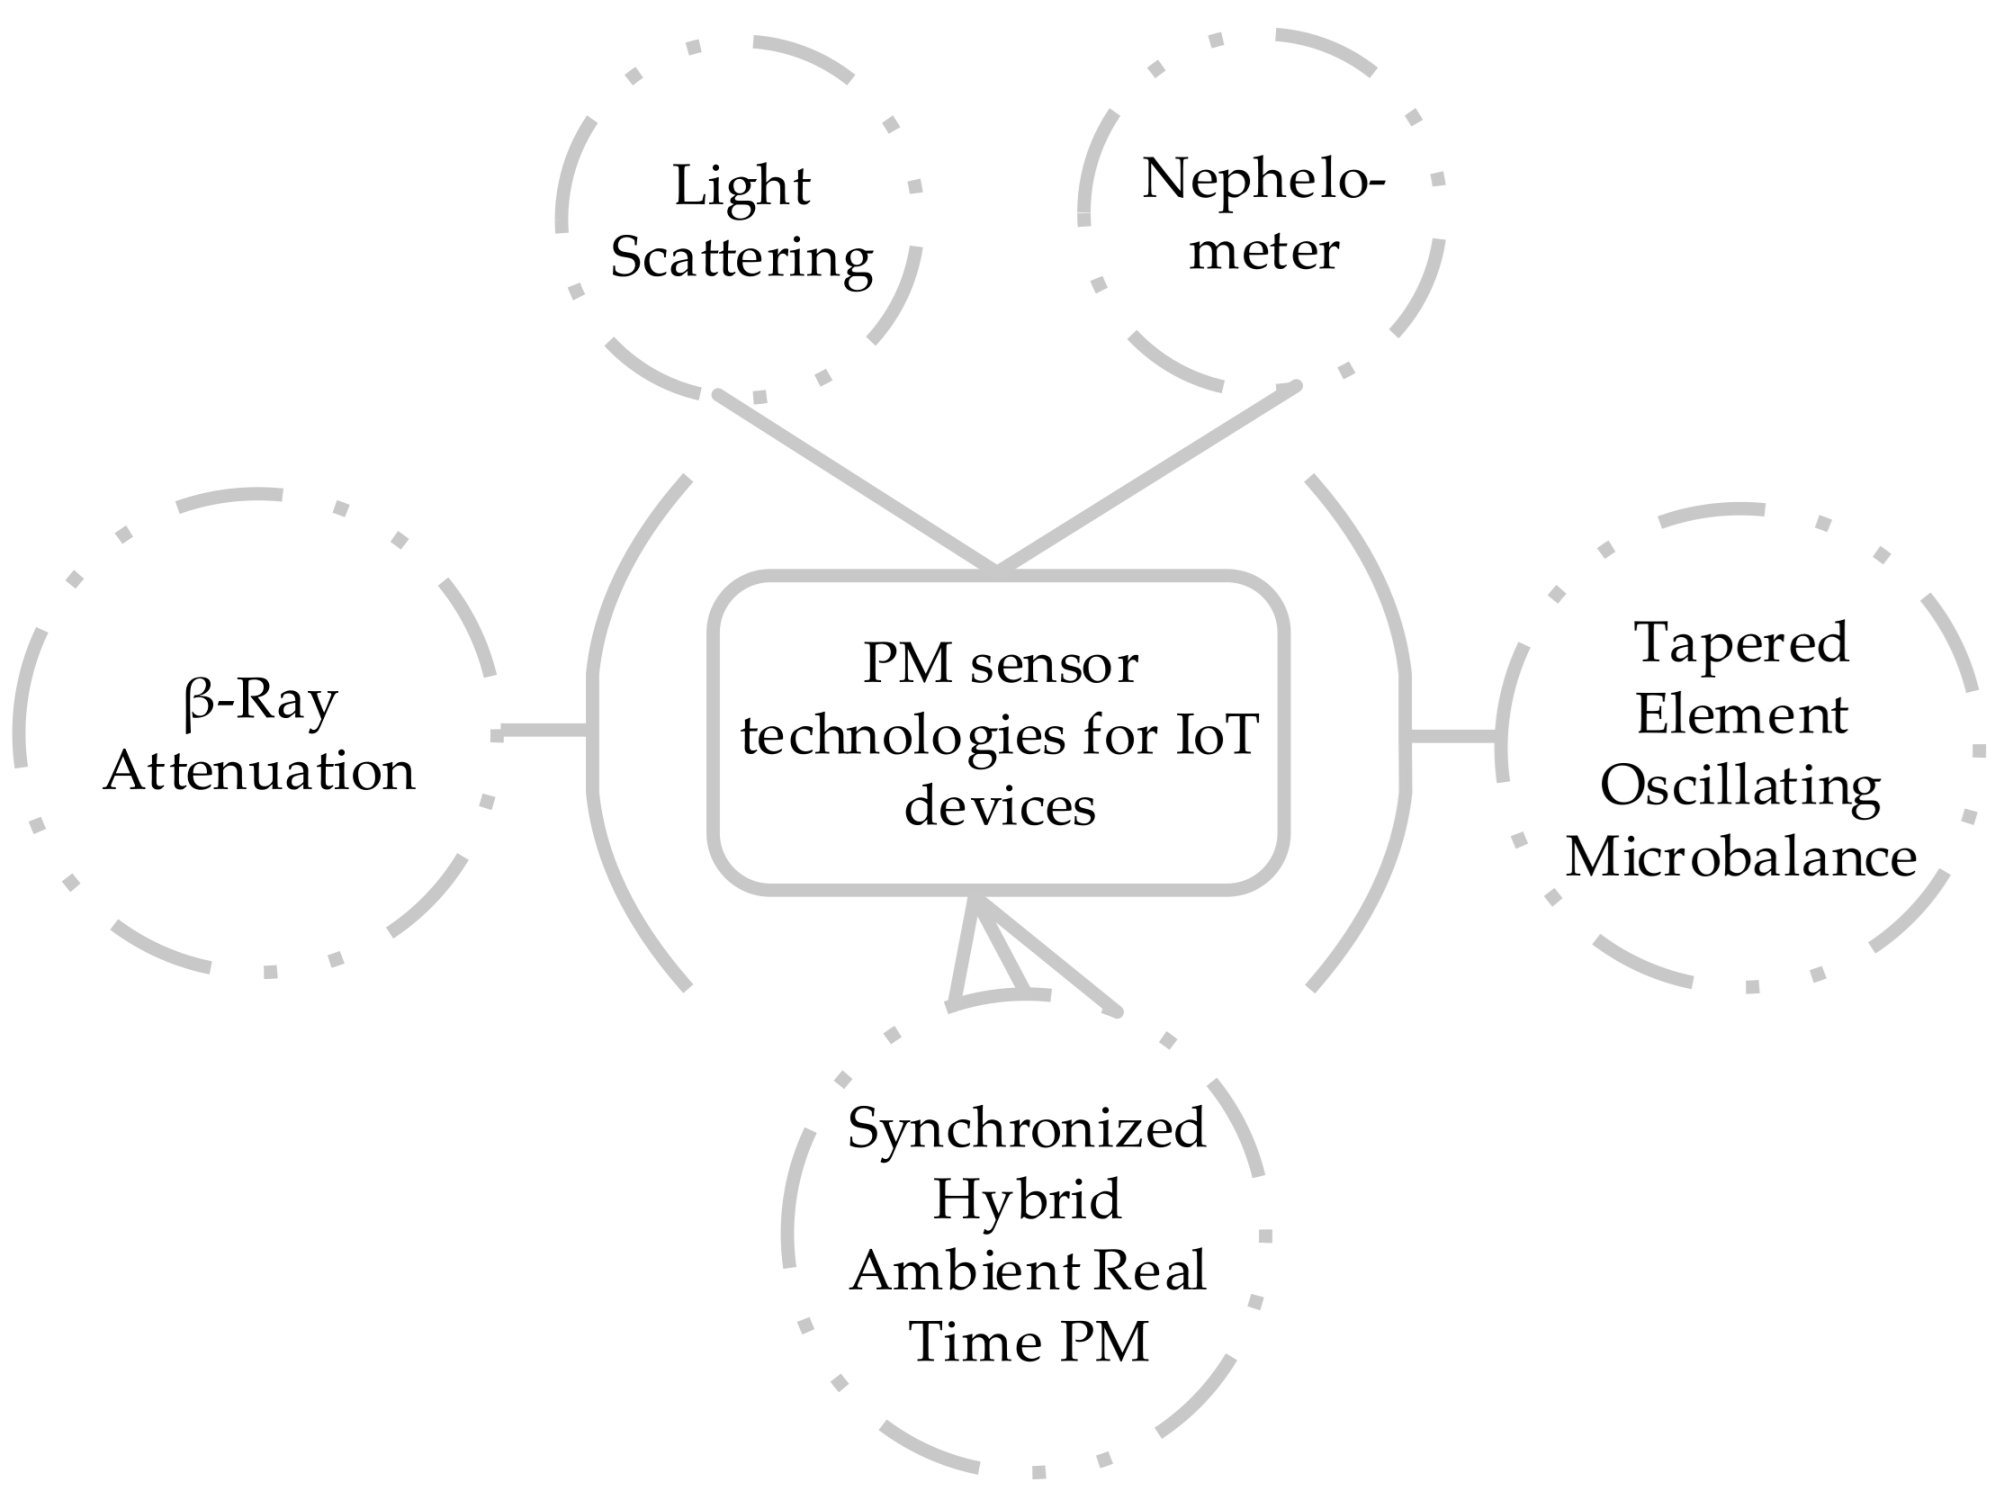
2.2.2. Particulate Matter
2.2.3. Nitrogen Dioxide
2.2.4. Carbon Monoxide
2.2.5. Sulphur Dioxide
2.2.6. Lead
2.2.7. Polycyclic Aromatic Hydrocarbons
2.2.8. Volatile Organic Compounds and Formaldehyde
2.2.9. Ozone
2.2.10. Radon
2.2.11. Hydrogen Sulphide
2.2.12. Black Carbon
2.2.13. Ultrafine Particles
2.2.14. Mould
3. Sensors for AQM
3.1. Gas Sensors
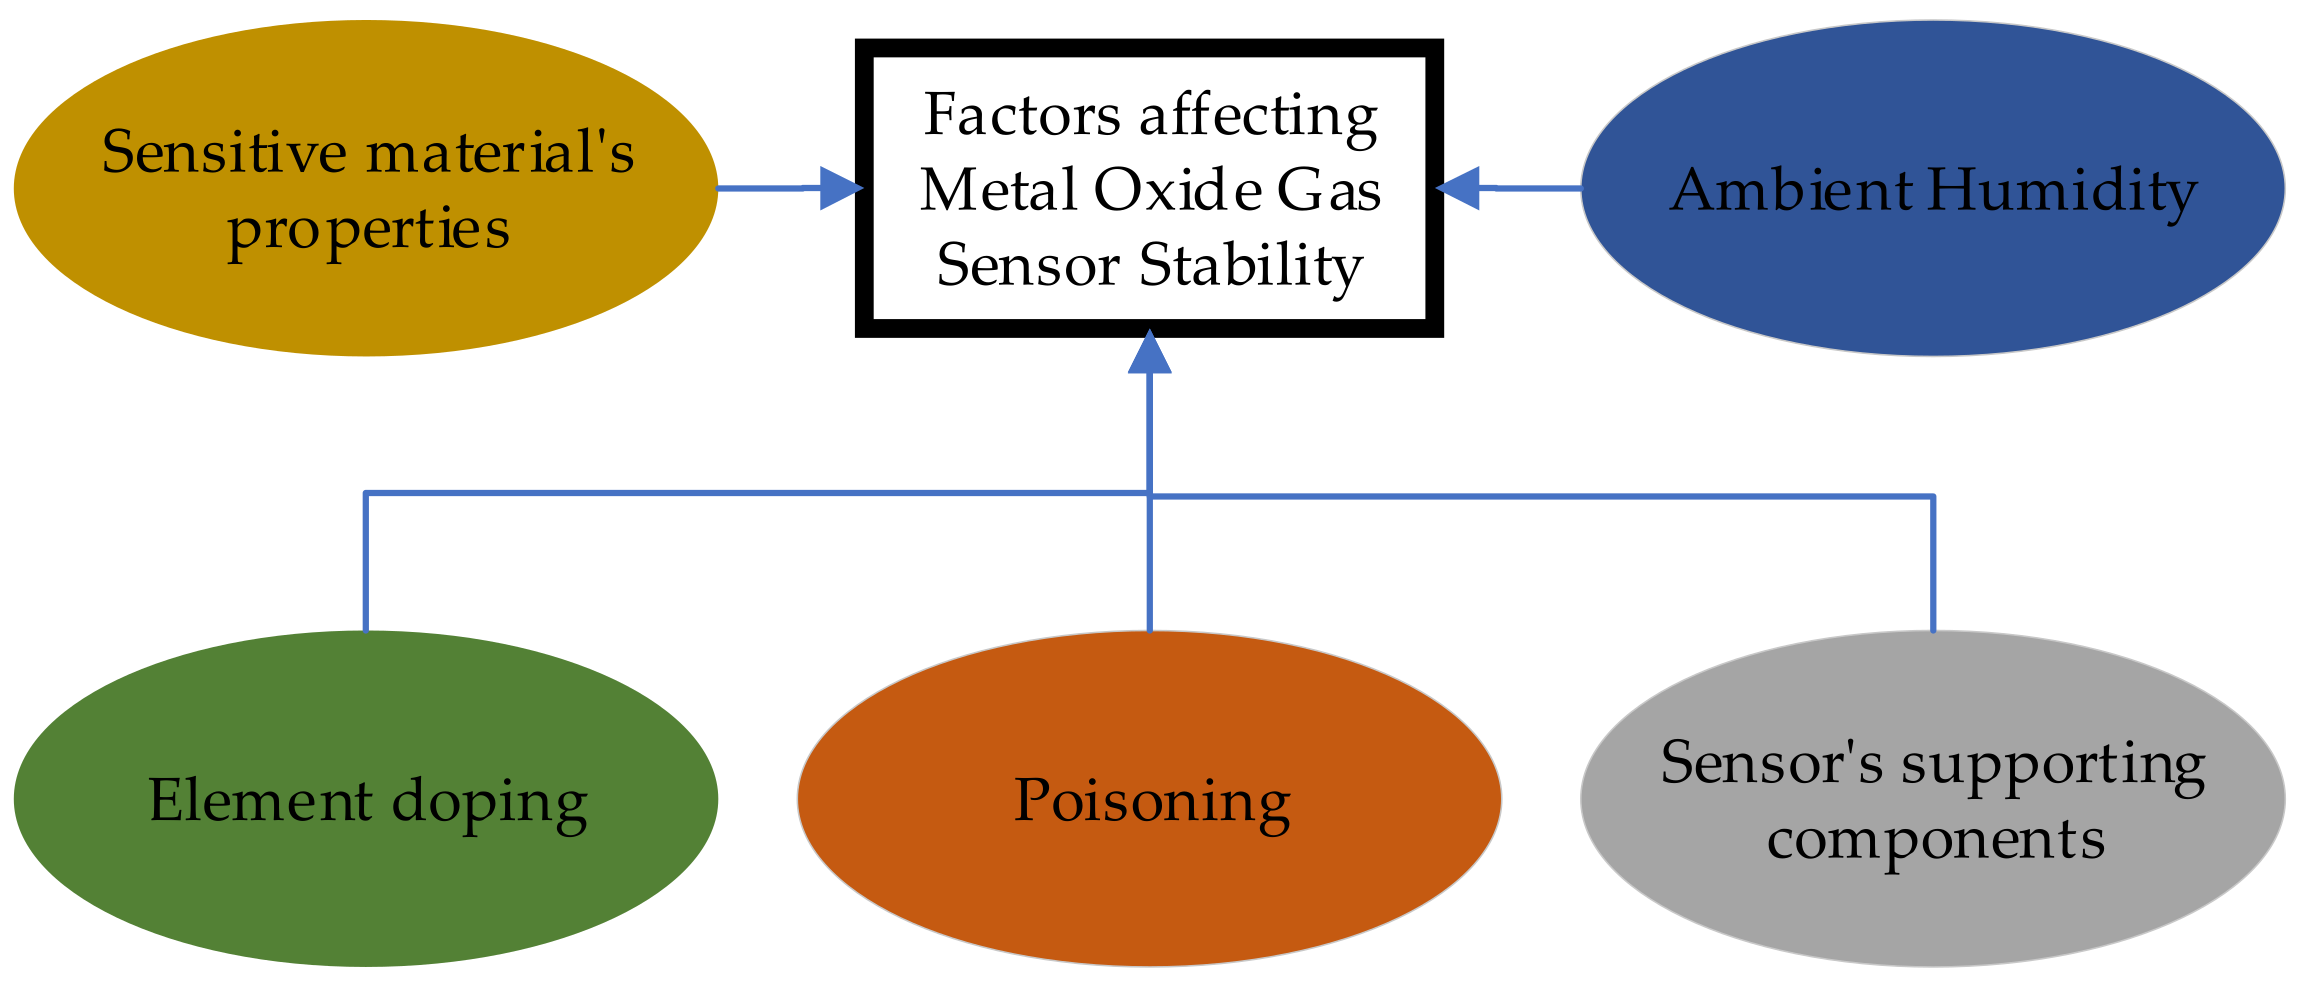
3.2. Stability of Gas Sensors
3.3. 2D NH3 Sensor
3.4. Low-Voltage NH3 Sensor
3.5. Highly Sensitive NH3 Sensor
3.6. OTFT NH3 Sensor
3.7. Nanosheets Enabled Gas Sensor
3.8. H2S Gas Sensor
3.9. Optical Fibre-Based VOC Sensor
3.10. NO2 Gas Sensor
3.11. Visible Light-Aided NO2 Sensor
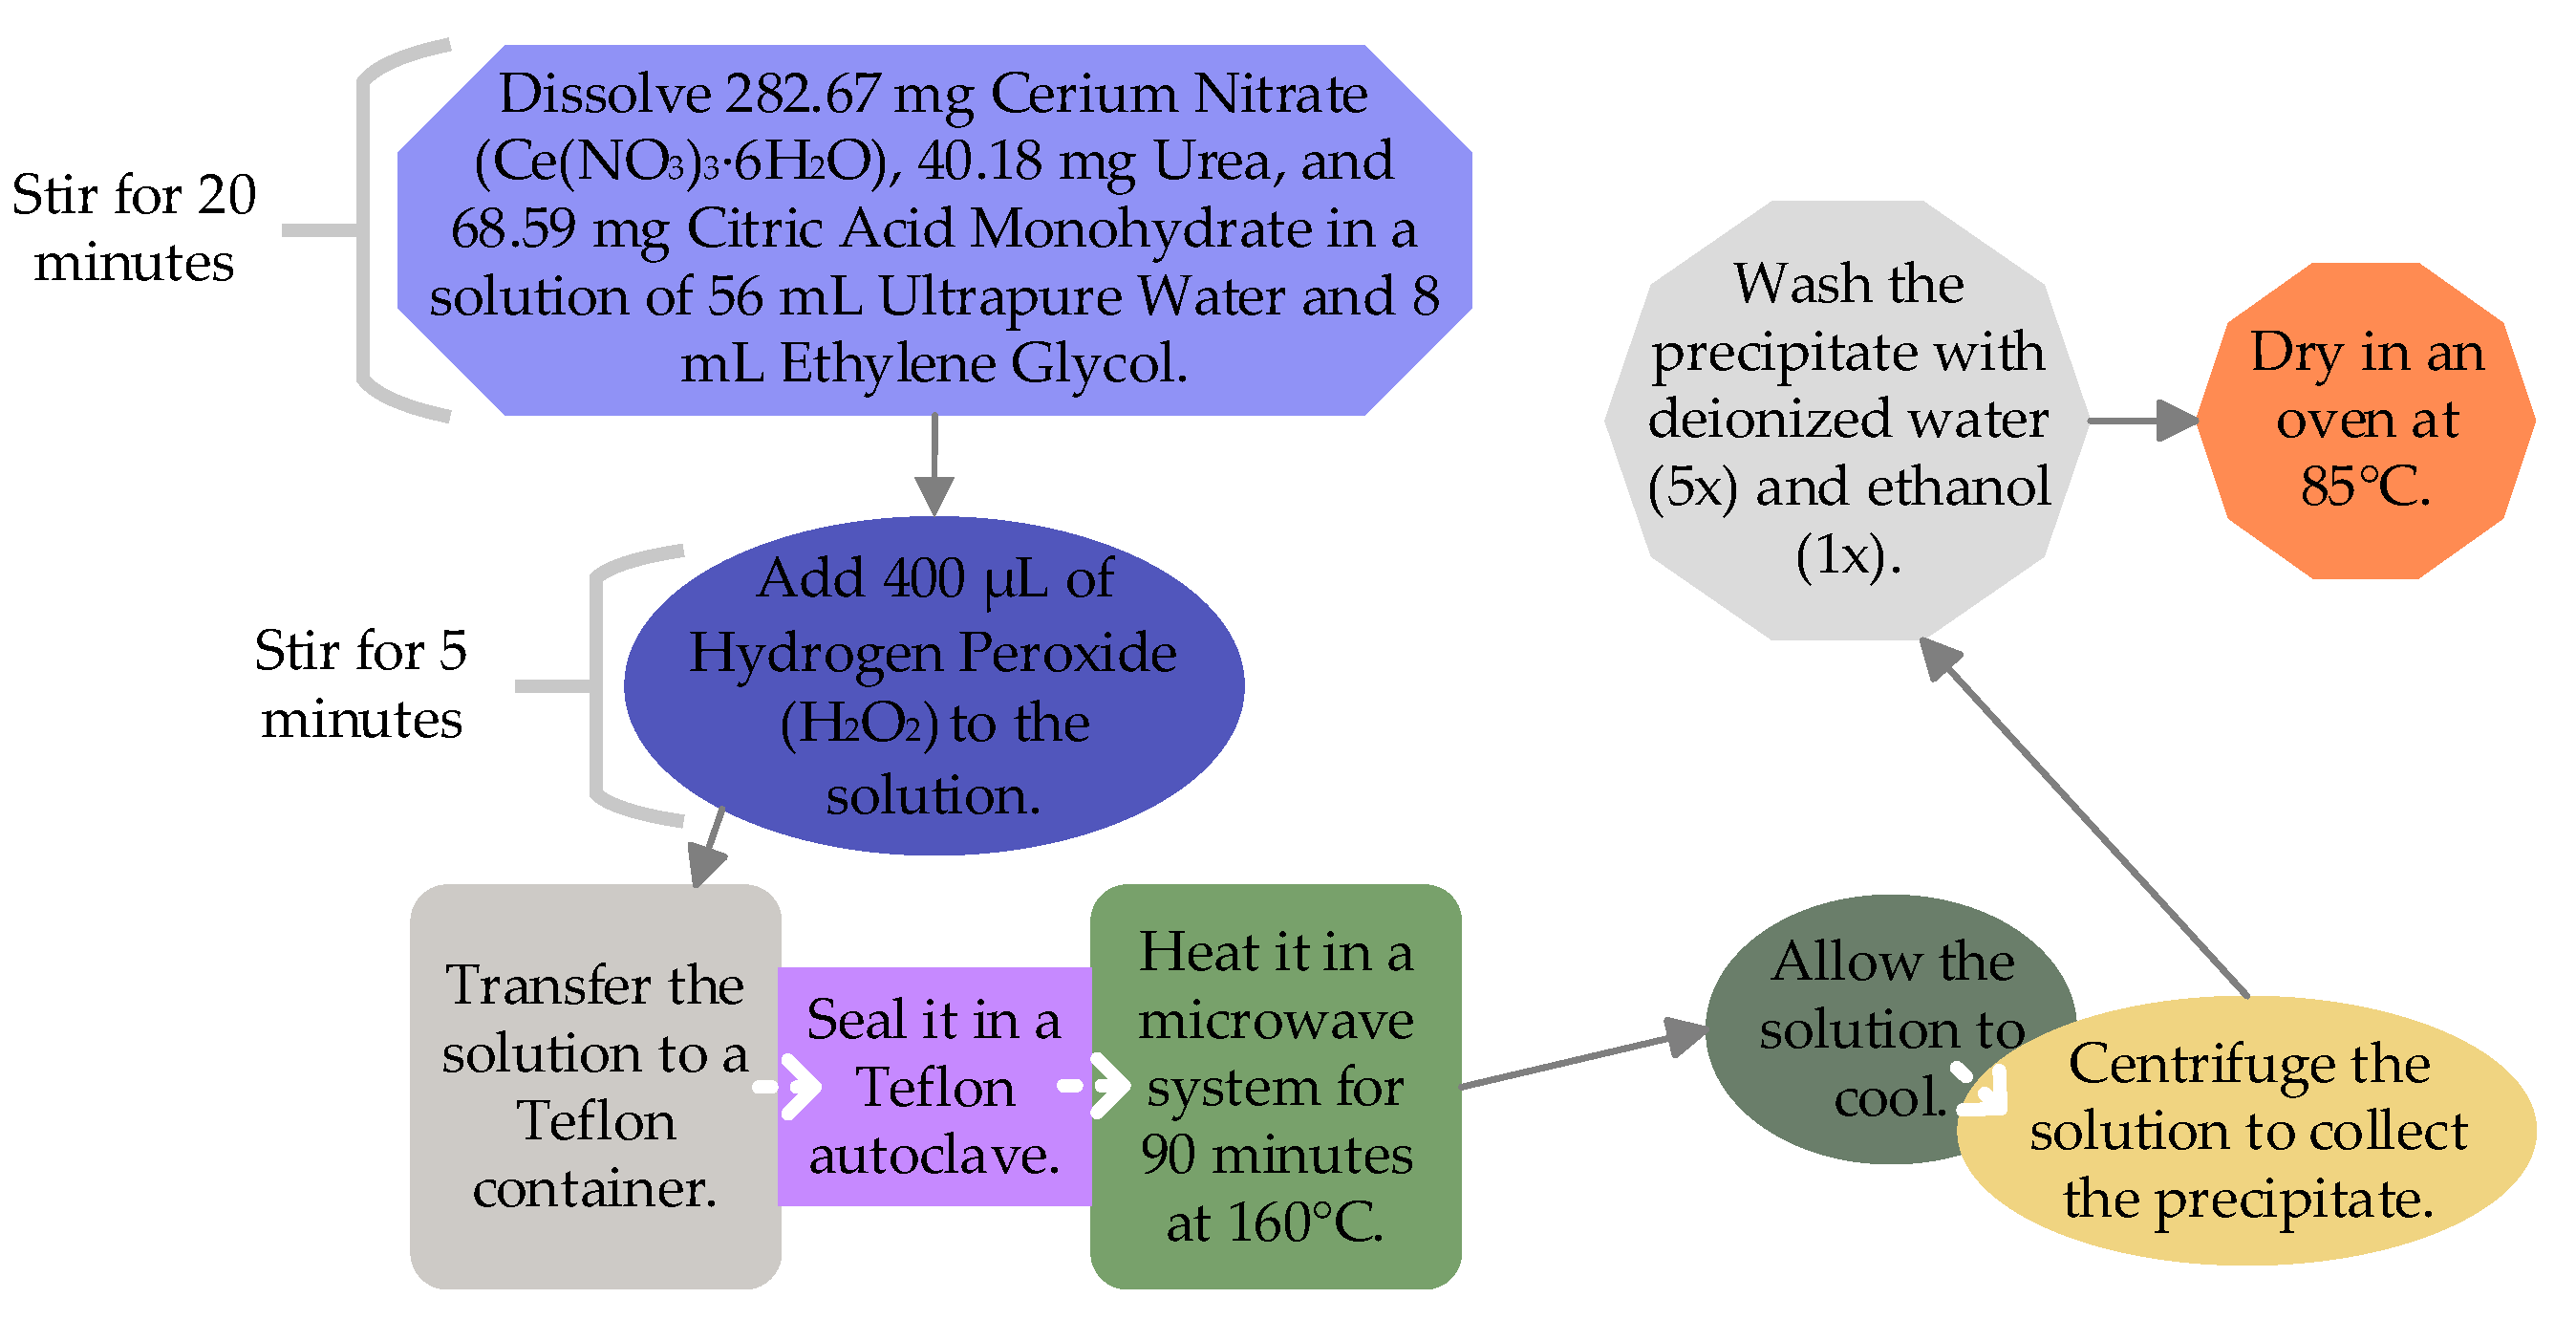
3.12. Low-Temperature CO2 Sensor
3.13. Radon and Alpha Radiation Sensor
3.14. High-Performance SO2 Gas Sensors
3.15. Ozone Gas Sensors with Zinc Oxide and Perovskite Crystals
3.16. PM Sensor
3.17. Highly Sensitive On-Site Lead Sensing in Air
3.18. PAH Detection in Air Using Surface-Enhanced Raman Spectroscopy
4. IoT Frameworks for AQM
4.1. LoRa WAN Enabled IoT
4.2. Low-Cost IoT
4.3. Crowdsource-Based IoT
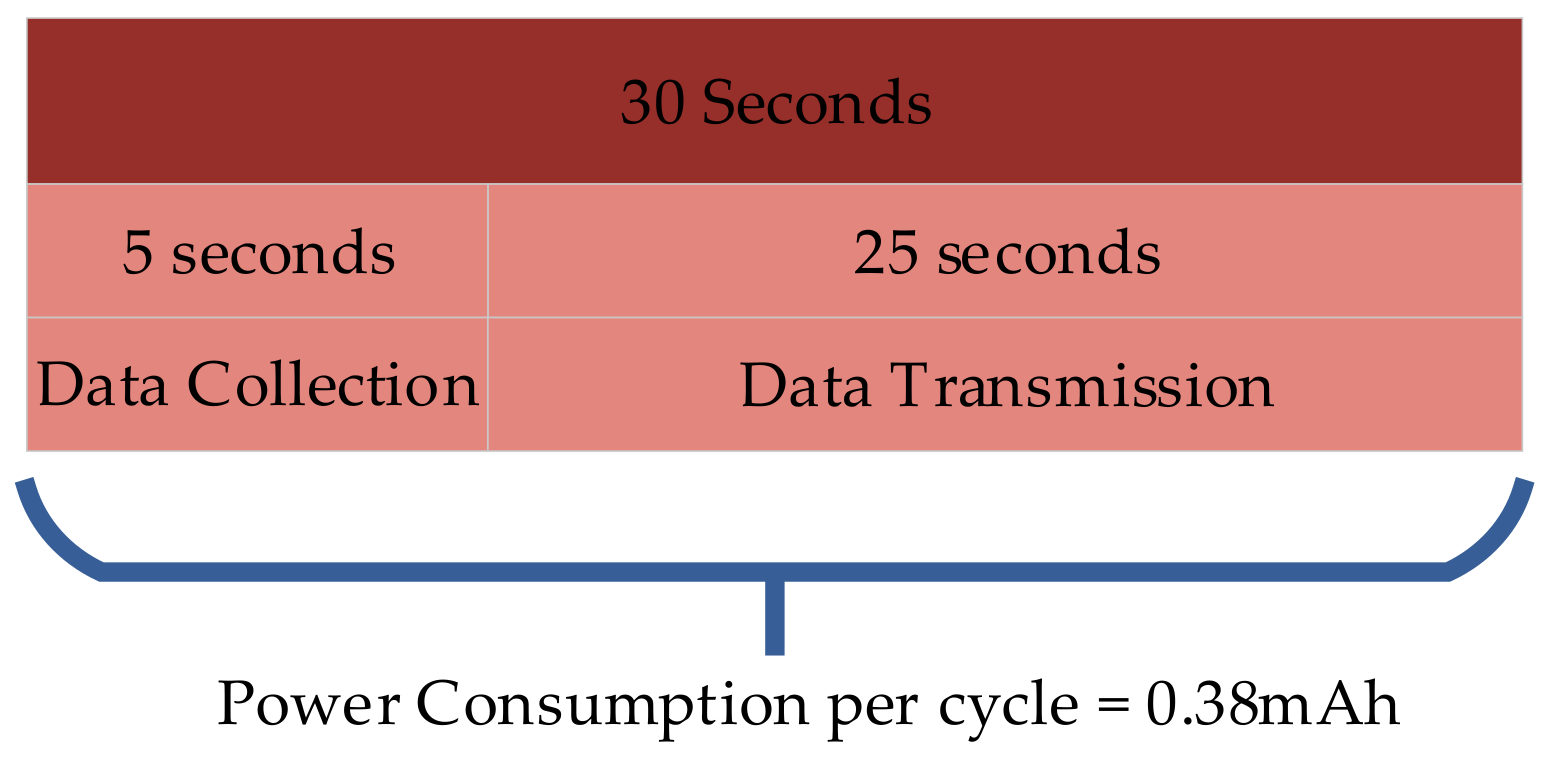
4.4. Energy Efficient IoT
4.5. Multi-Points Indoor IoT
4.6. IoT for Mould
4.7. Hybrid IoT Solutions
4.8. IoT Devices for AQM-Feature Comparison
- Ubibots AQS1 Smart AQ monitor (Arundel, UK) [84].
- Temptop 1000S+ AQ Monitor (London, UK) [85].
- Amazon AQ monitor (London, UK) [86].
5. Performance Evaluation of AQM Systems
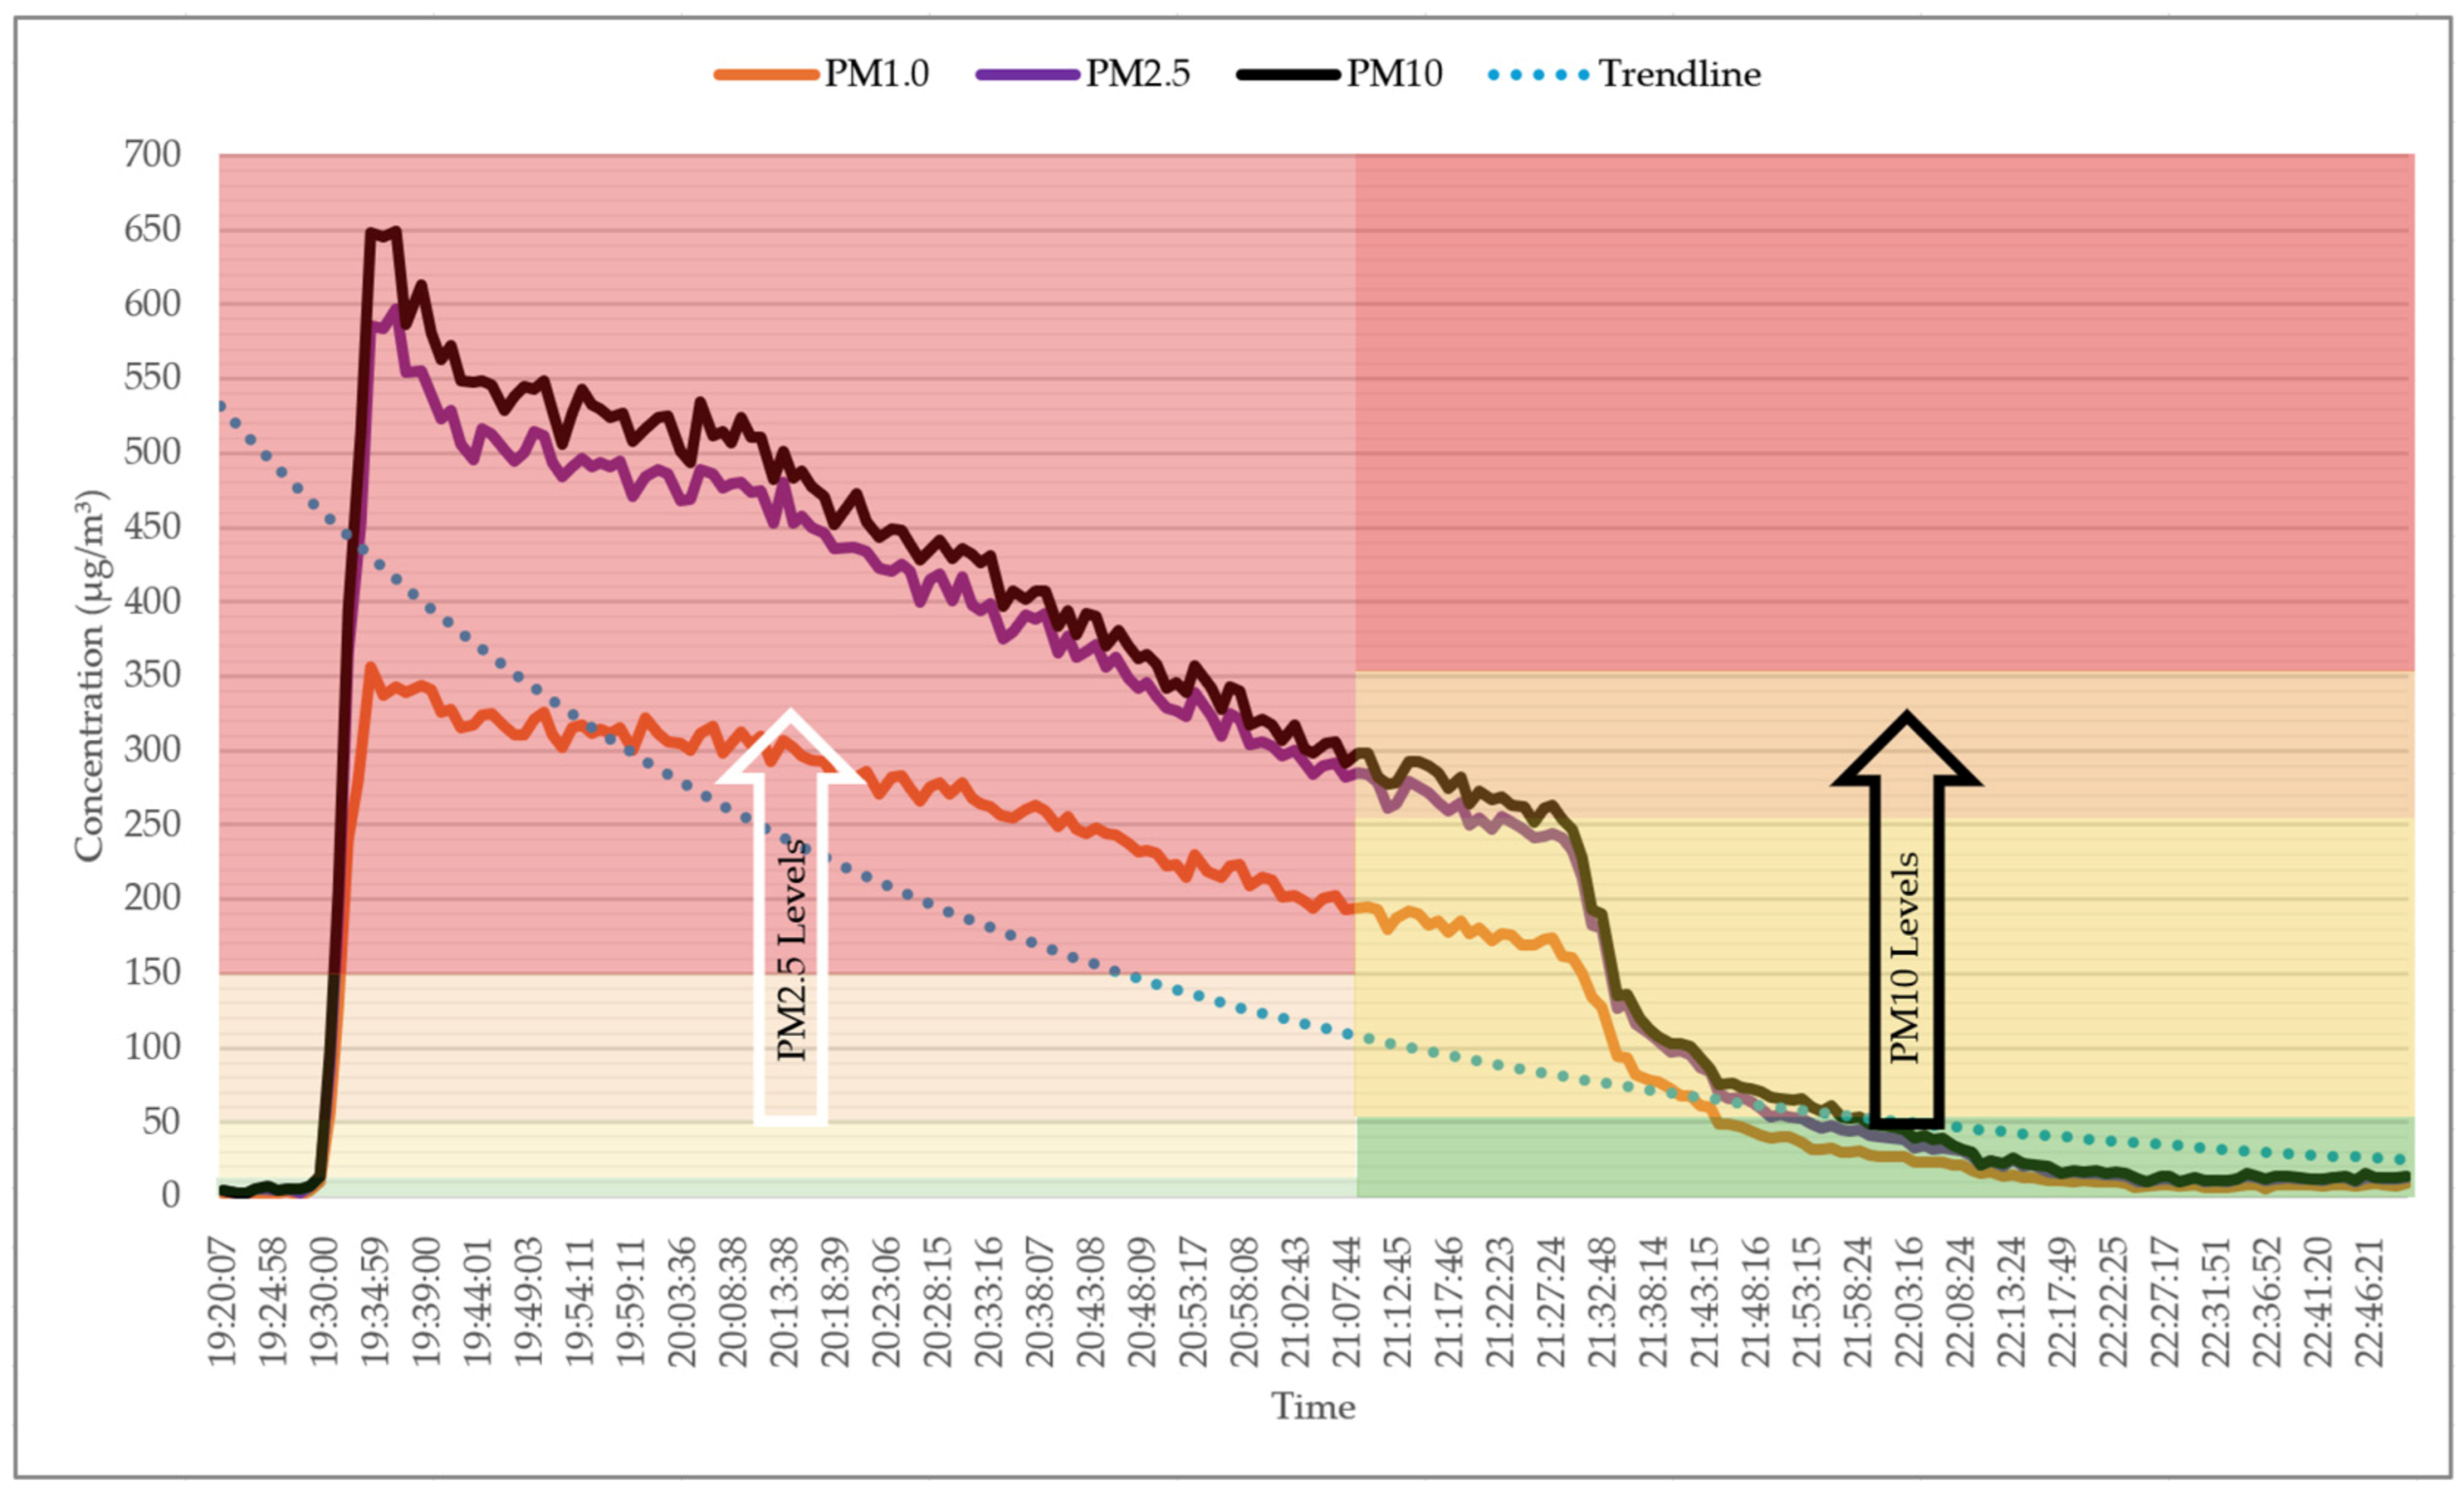
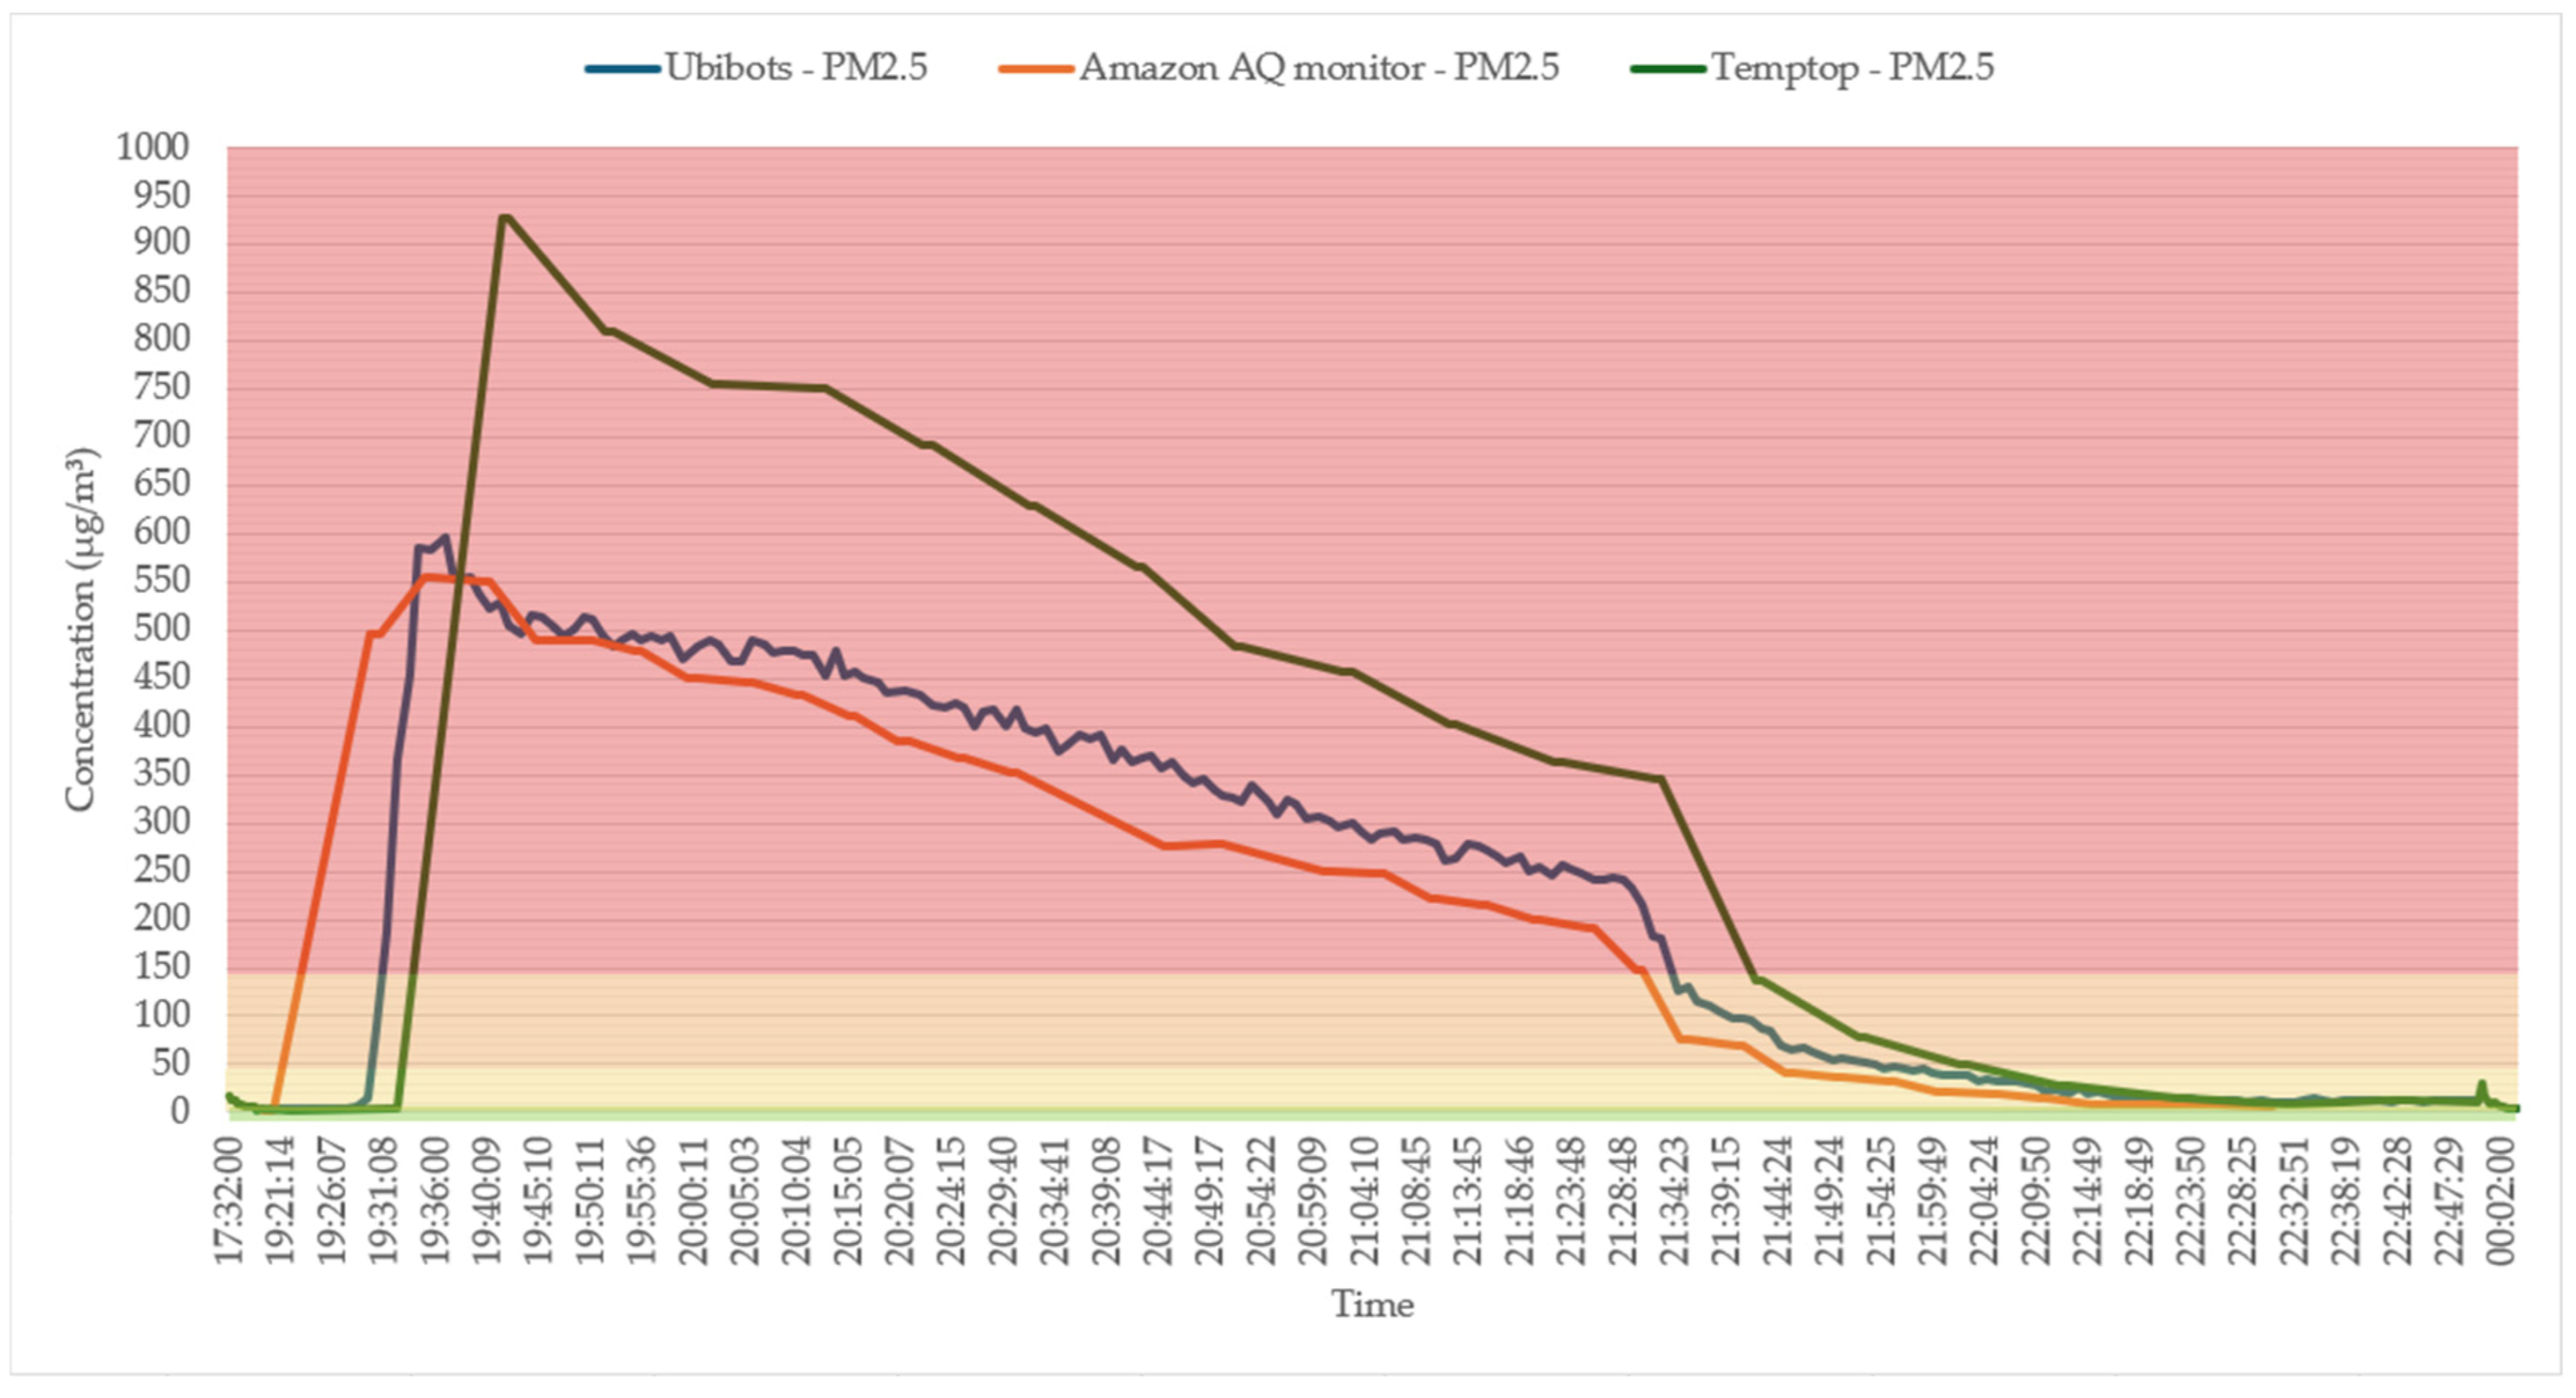
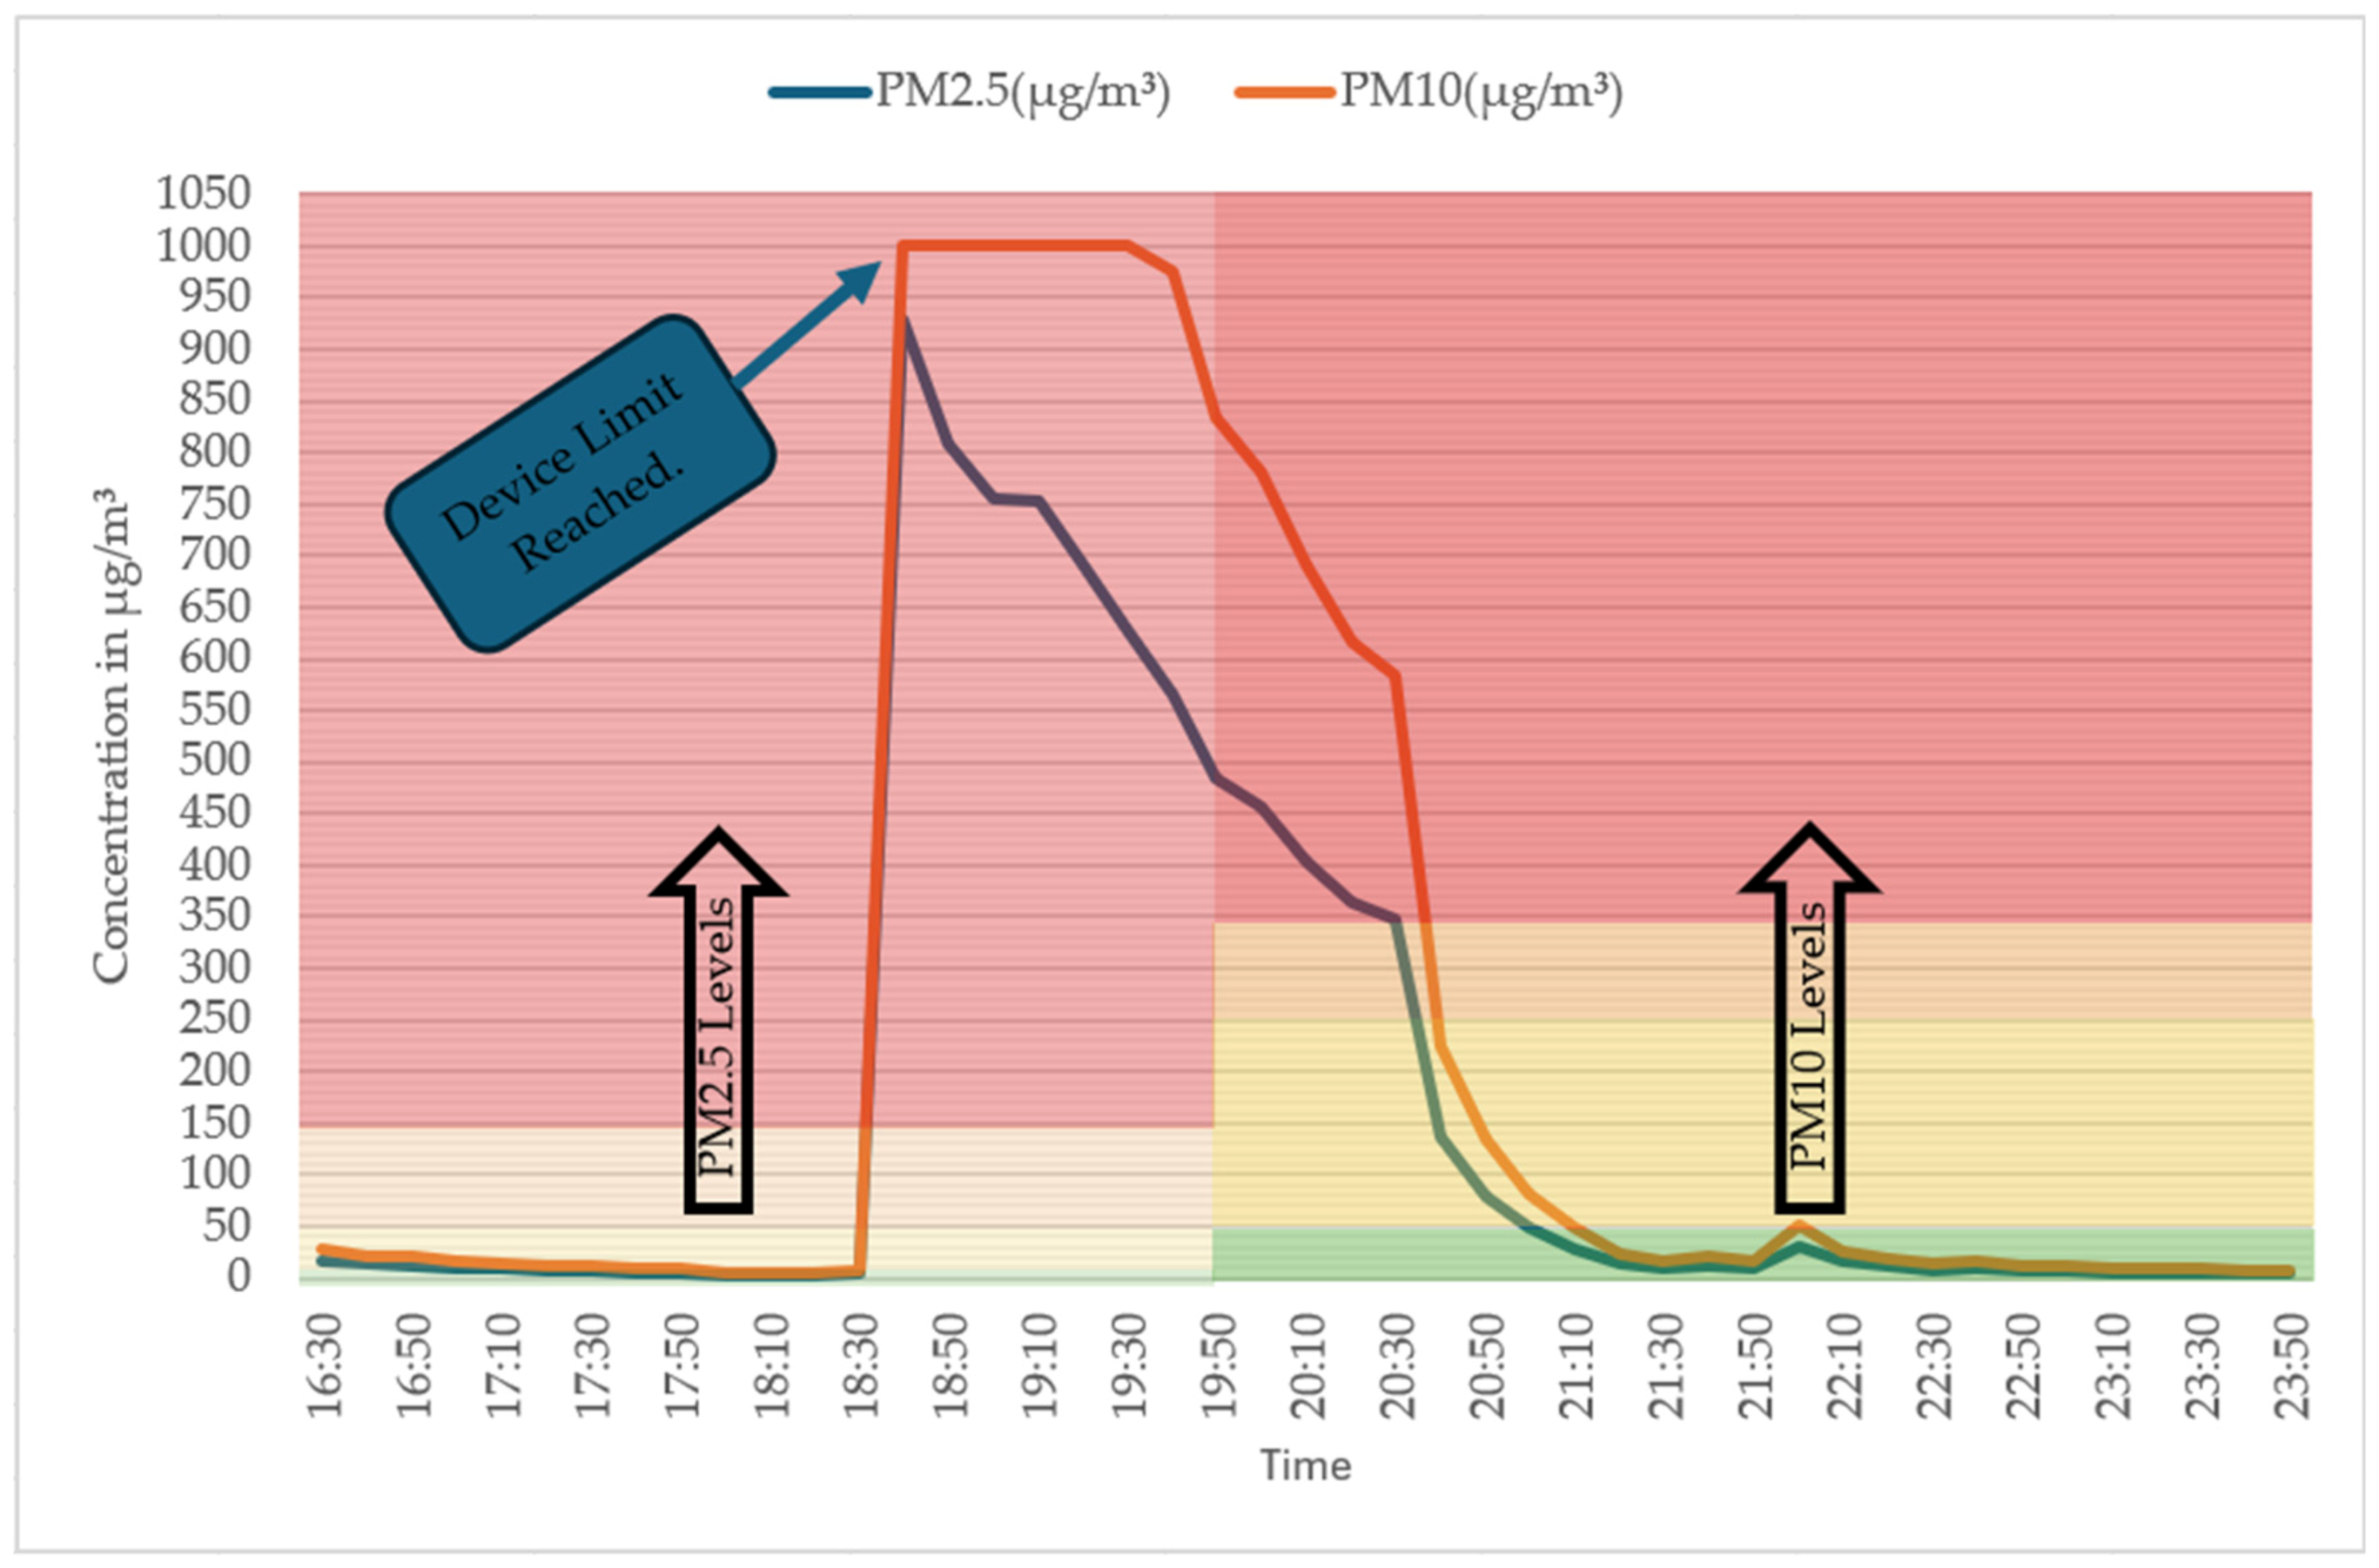
5.1. Impact of Cooking on Air Quality Using Three Commercial Sensors
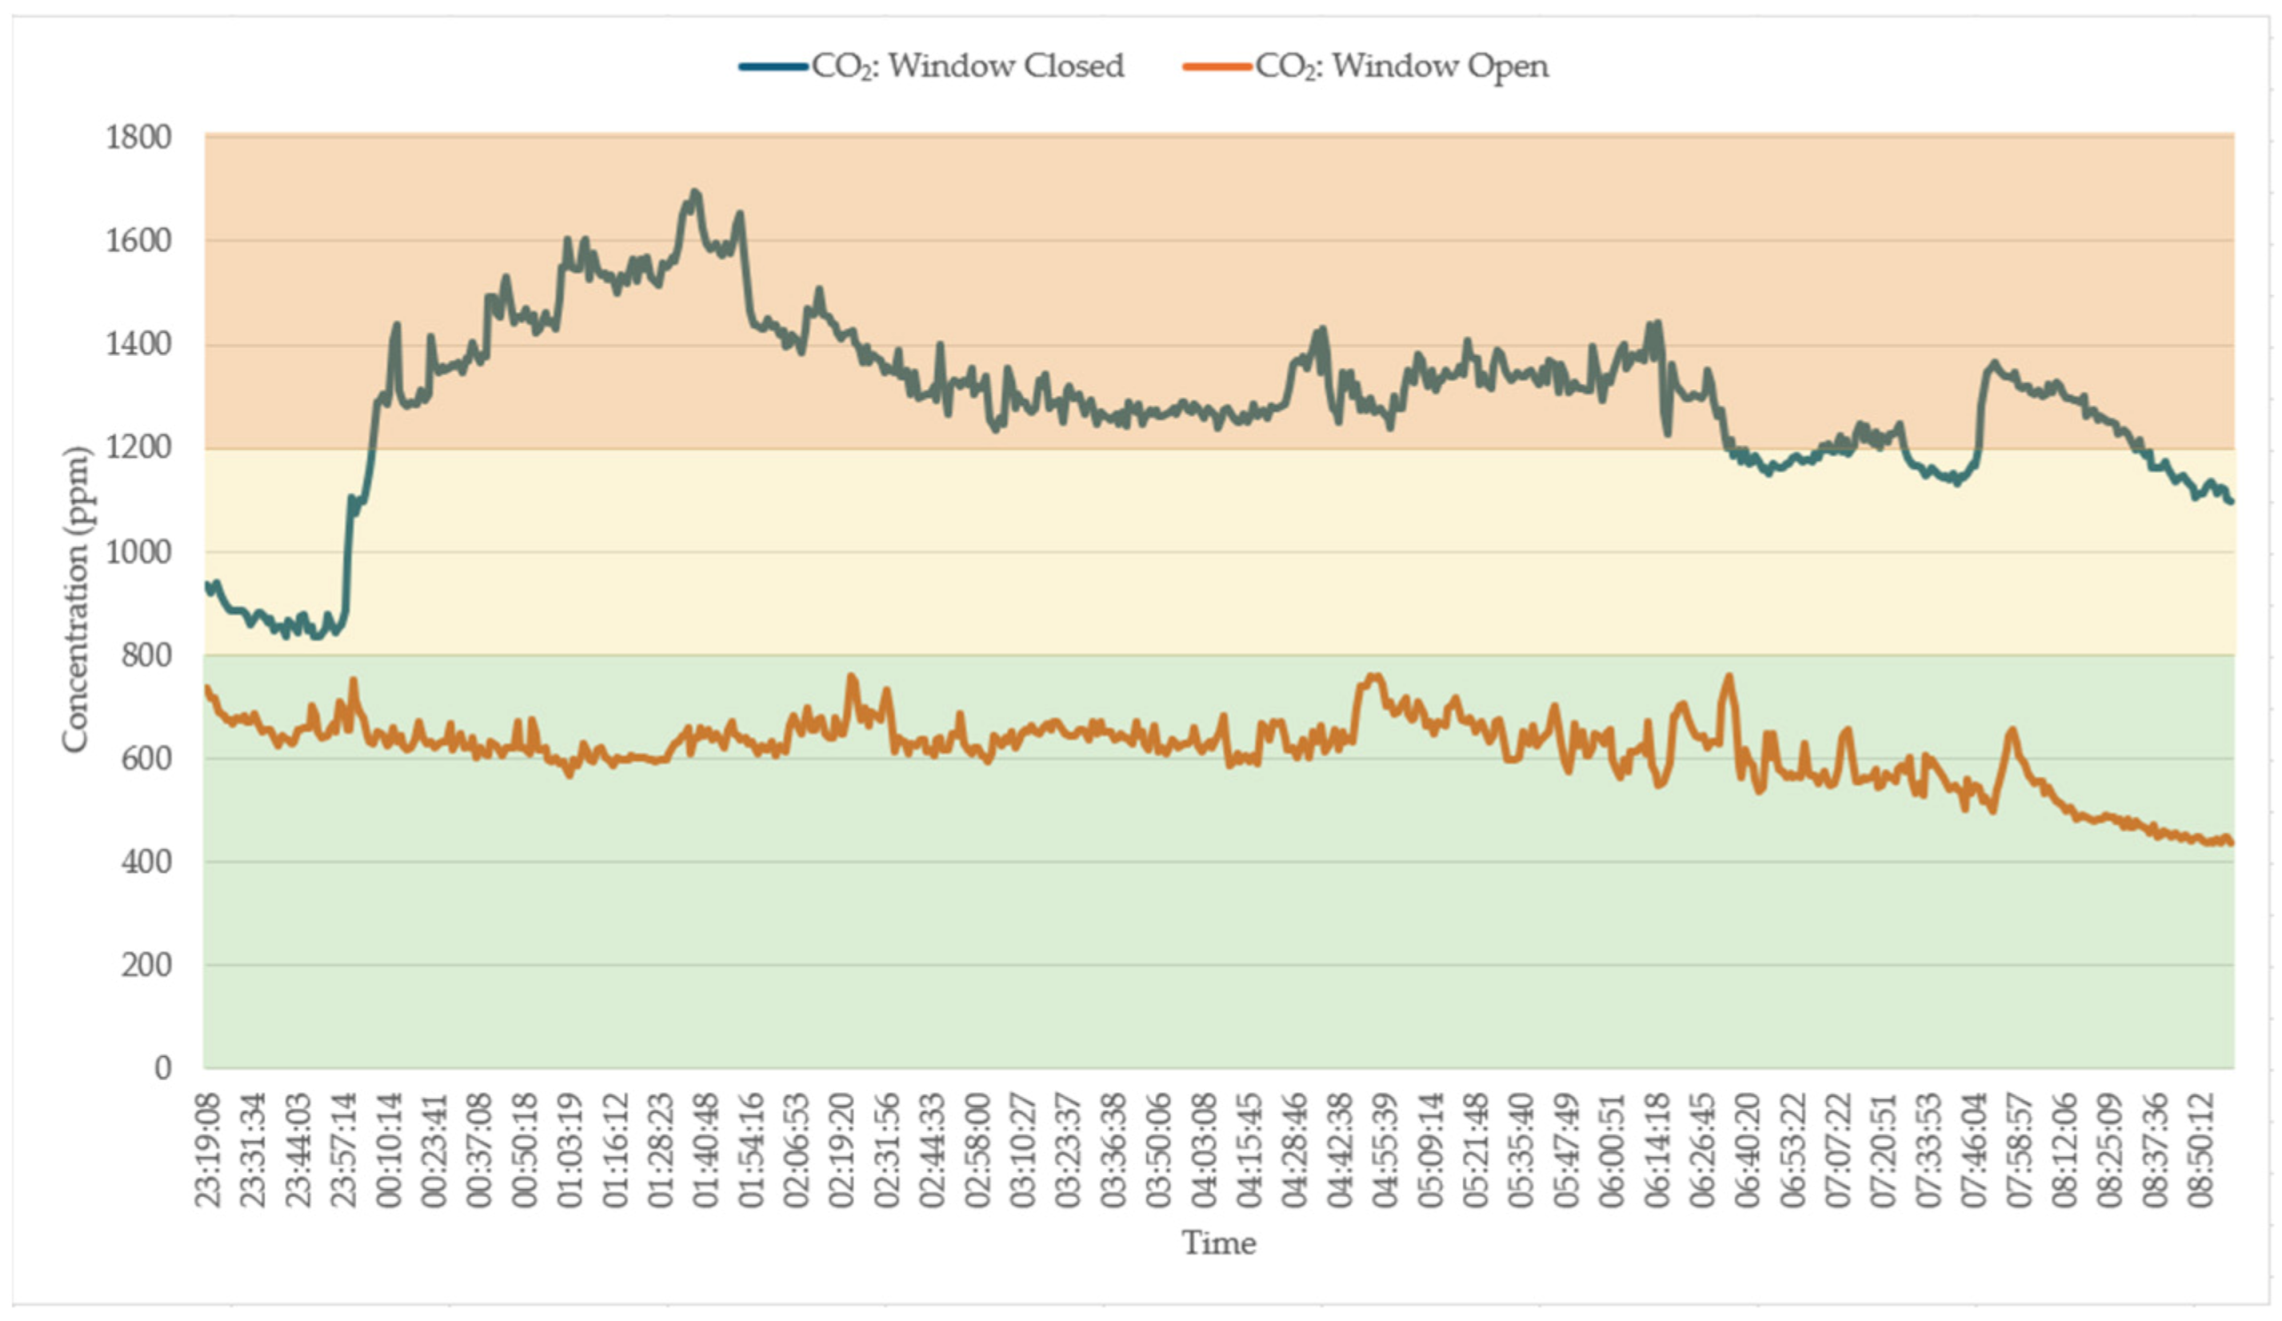
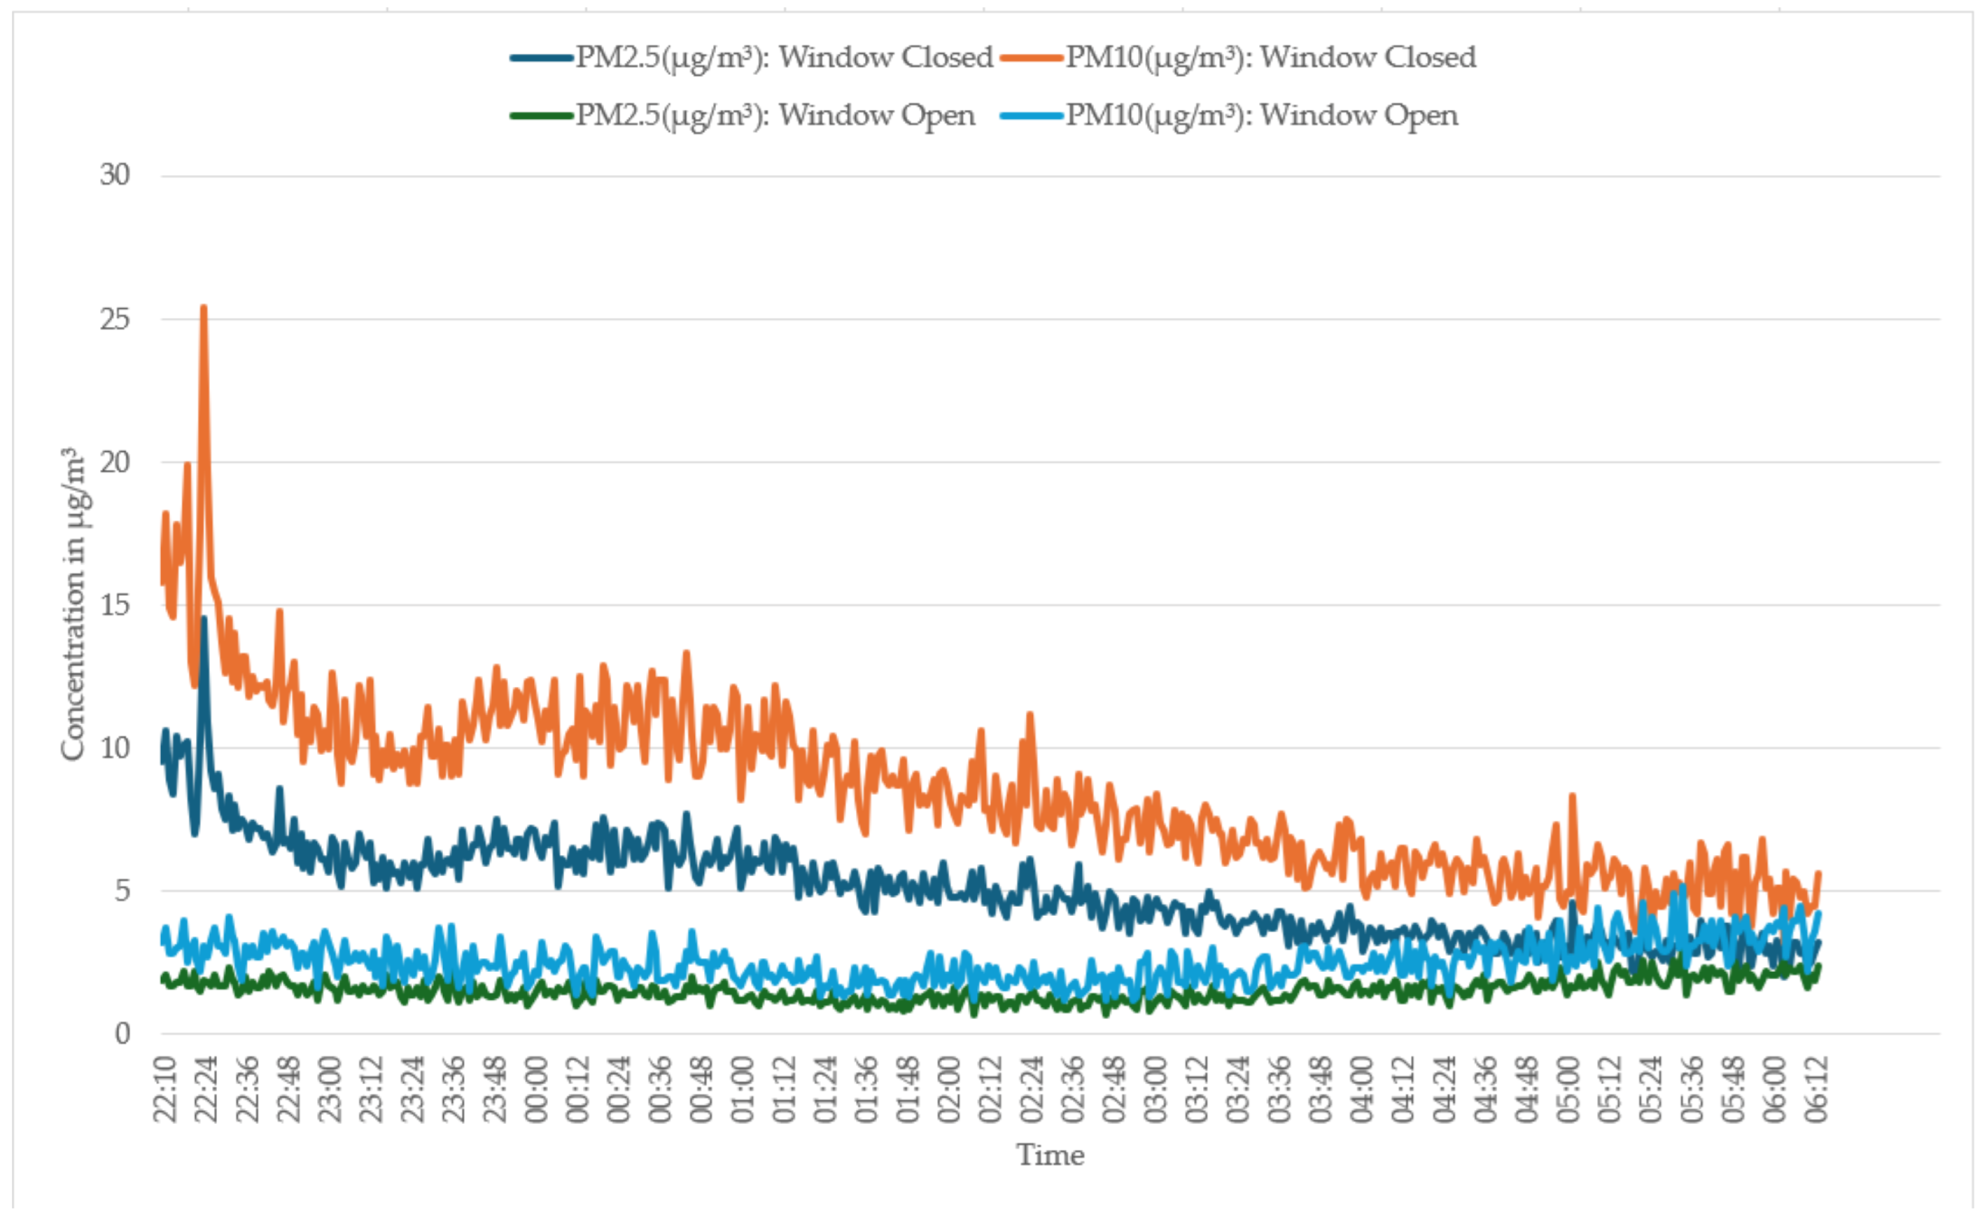
5.2. Comparison Analysis of Indoor Air Quality with and Without Ventilation in a Residential Setting
5.3. Sensor Calibration
6. Future Research Directions in AQM
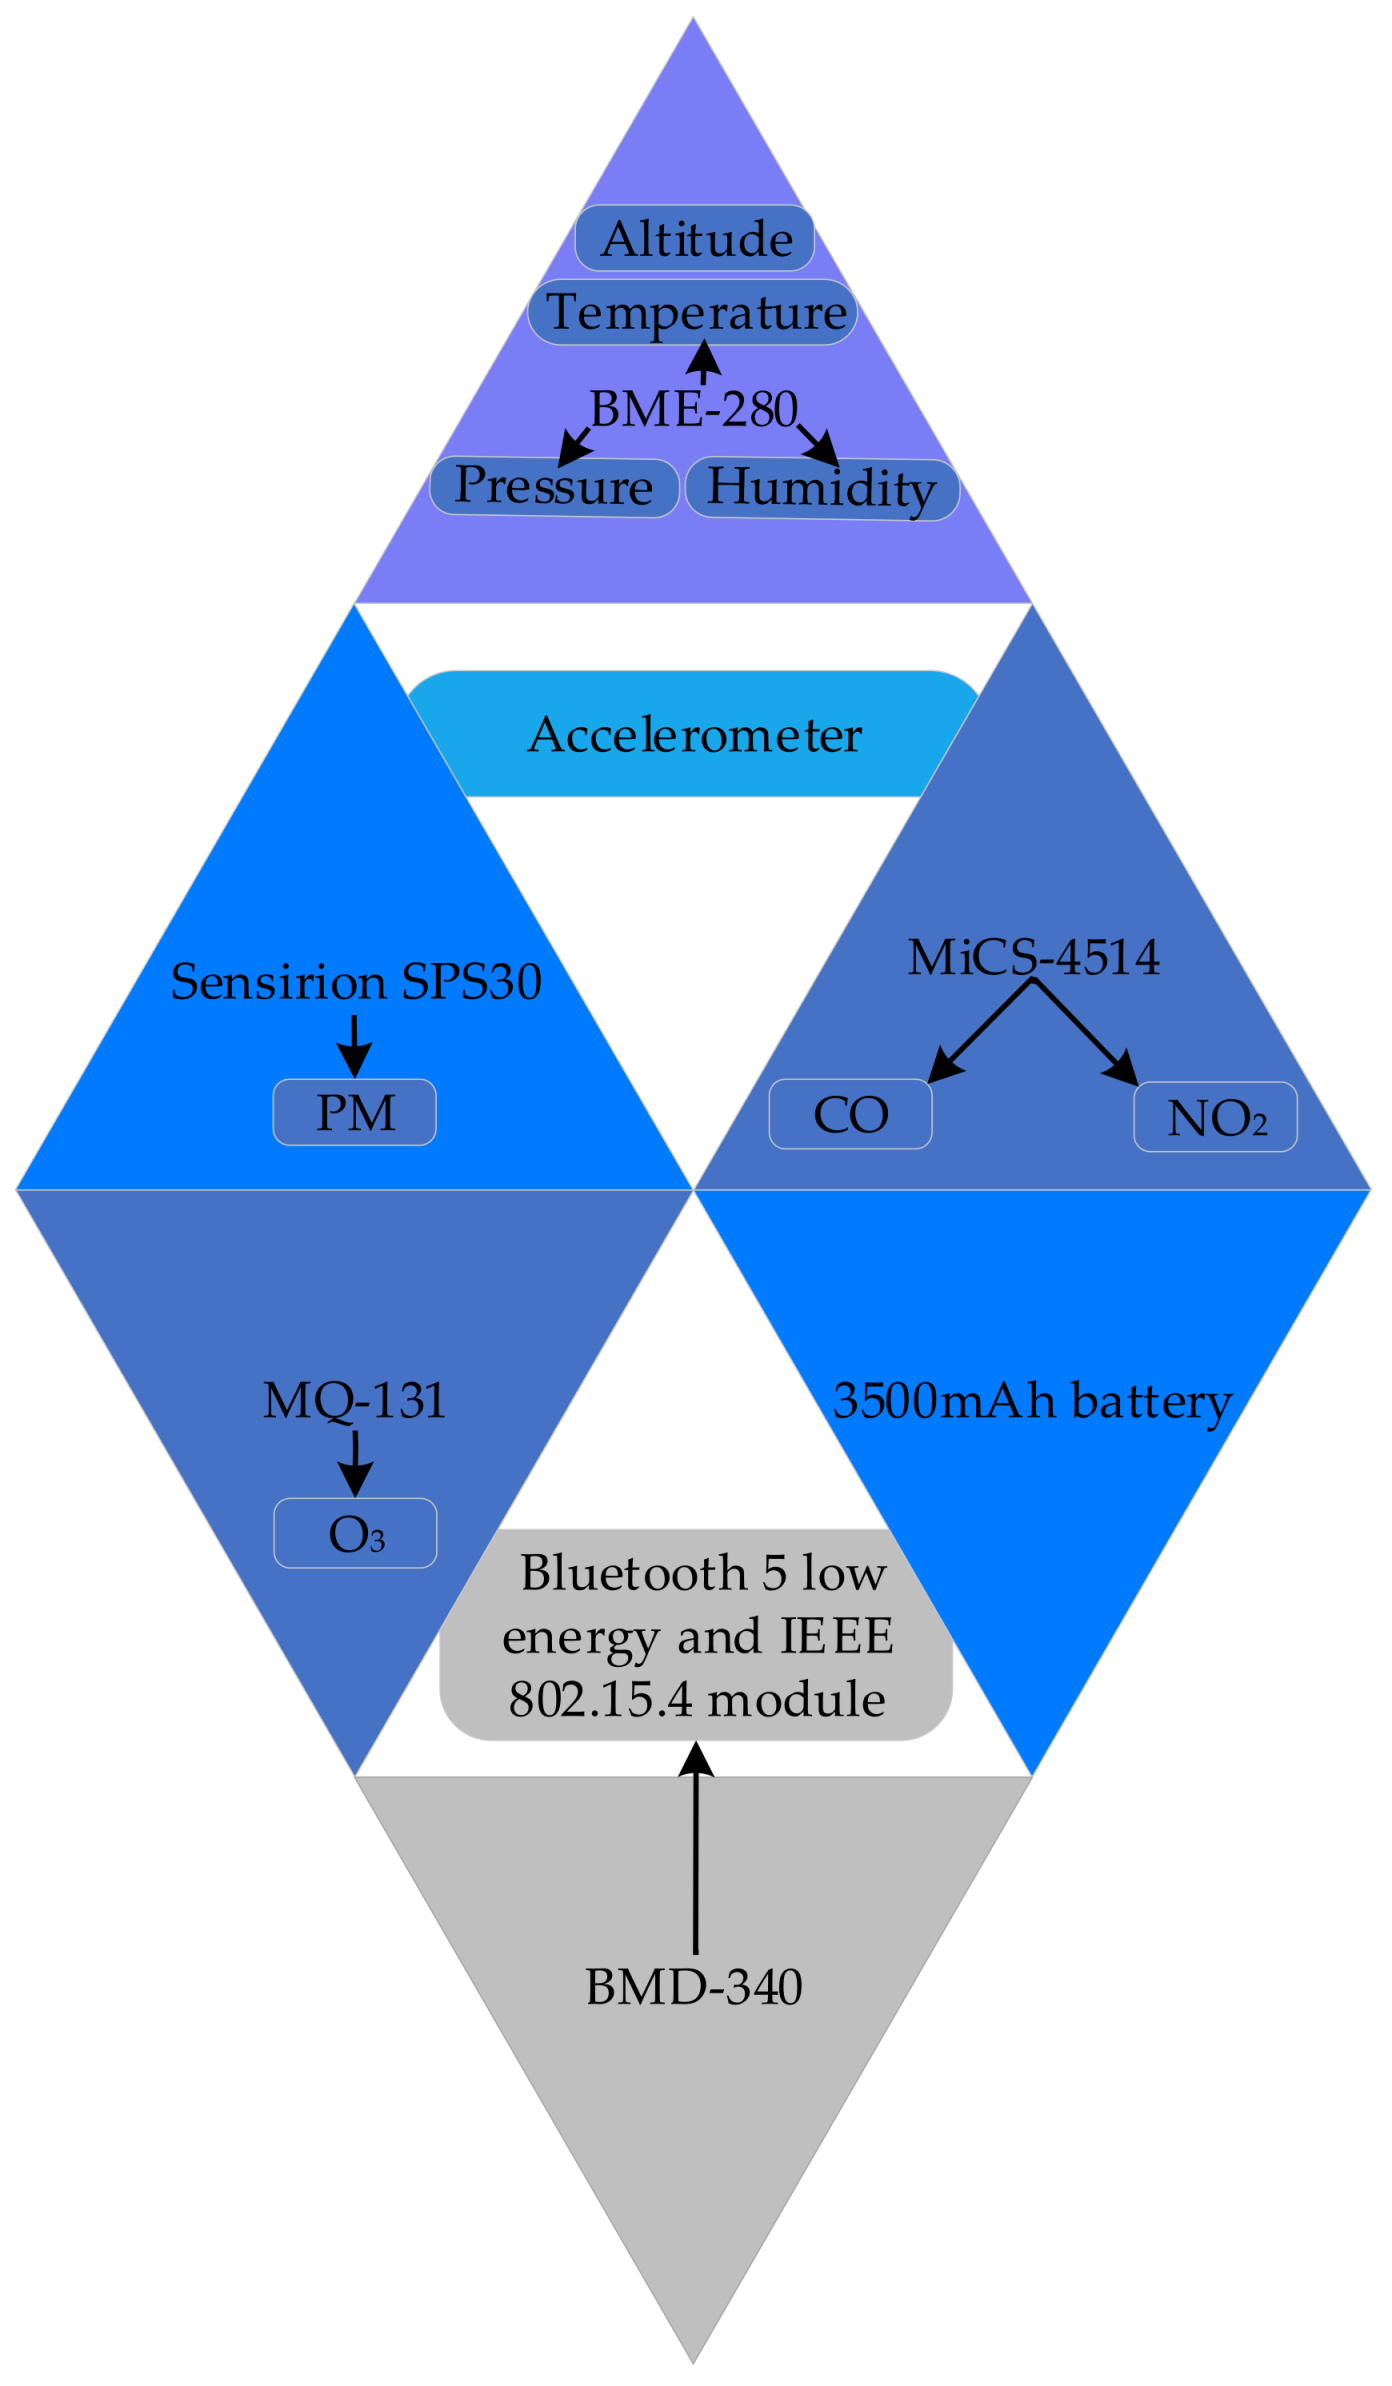
6.1. STM32 Based AQM Systems
6.2. Mobile and Distributed AQM
6.3. Optimising Sensor Calibration for AQM
6.4. Advances in Sensing Materials
7. Conclusions
Author Contributions
Funding
Data Availability Statement
Acknowledgments
Conflicts of Interest
References
- Mor, S.; Parihar, P.; Ravindra, K. Community perception about air pollution, willingness to pay and awareness about health risks in Chandigarh, India. Environ. Chall. 2022, 9, 100656. [Google Scholar] [CrossRef]
- Who.int. Ambient (Outdoor) Air Quality and Health. 2022. Available online: https://www.who.int/news-room/fact-sheets/detail/ambient-(outdoor)-air-quality-and-health (accessed on 1 June 2024).
- World Health Organization. Household Air Pollution and Health. who.int. 2023. Available online: https://www.who.int/news-room/fact-sheets/detail/household-air-pollution-and-health (accessed on 1 June 2024).
- UCL. UK Air Pollution Regulations Will Reduce Deaths, but Do Little to Protect Ecosystems. UCL News. 2023. Available online: https://www.ucl.ac.uk/news/2023/oct/uk-air-pollution-regulations-will-reduce-deaths-do-little-protect-ecosystems#:~:text=Air%20pollution%20is%20harmful%20to (accessed on 1 June 2024).
- Allioui, H.; Mourdi, Y. Exploring the full potentials of IoT for better financial growth and stability: A comprehensive survey. Sensors 2023, 23, 8015. [Google Scholar] [CrossRef] [PubMed]
- Barot, V.; Kapadia, V. AQM systems using IoT: A Review. In Proceedings of the 2020 International Conference on Computational Performance Evaluation (Compe), Shillong, India, 2–4 July 2020; IEEE: Piscataway, NJ, USA, 2020; pp. 226–231. [Google Scholar]
- Jabbar, W.A.; Subramaniam, T.; Ong, A.E.; Shu’Ib, M.I.; Wu, W.; De Oliveira, M.A. LoRaWAN-based IoT system implementation for long-range outdoor AQM. Internet Things 2022, 19, 100540. [Google Scholar] [CrossRef]
- Hofman, J.; Nikolaou, M.E.; Do, T.H.; Qin, X.; Rodrigo, E.; Philips, W.; Deligiannis, N.; La Manna, V.P. Mapping air quality in IoT cities: Cloud calibration and air quality inference of sensor data. In Proceedings of the 2020 IEEE Sensors, Rotterdam, The Netherlands, 25–28 October 2020; IEEE: Piscataway, NJ, USA; pp. 1–4. [Google Scholar]
- Permana, A.F.; Kuncoro, C.B.D. Autonomous temperature and humidity wireless sensor node for indoor AQM application. In Proceedings of the 2021 5th International Conference on Informatics and Computational Sciences (ICICoS), Semarang, Indonesia, 24–25 November 2021; IEEE: Piscataway, NJ, USA; pp. 272–276. [Google Scholar]
- Mohamed, E.F.; Awad, G. Development of nano-sensor and biosensor as an air pollution detection technique for the foreseeable future. In Comprehensive Analytical Chemistry; Elsevier: Amsterdam, The Netherlands, 2022; Volume 99, pp. 163–188. [Google Scholar]
- Narayana, M.V.; Jalihal, D.; Nagendra, S.S. Establishing a sustainable low-cost AQM setup: A survey of the state-of-the-art. Sensors 2022, 22, 394. [Google Scholar] [CrossRef]
- Yaqoob, U.; Younis, M.I. Chemical gas sensors: Recent developments, challenges, and the potential of machine learning—A review. Sensors 2021, 21, 2877. [Google Scholar] [CrossRef]
- Tao, N. Challenges and promises of metal oxide nanosensors. ACS Sens. 2019, 4, 780. [Google Scholar] [CrossRef]
- Rathore, P.; Rao, A.S.; Rajasegarar, S.; Vanz, E.; Gubbi, J.; Palaniswami, M. Real-time urban microclimate analysis using internet of things. IEEE Internet Things J. 2017, 5, 500–511. [Google Scholar] [CrossRef]
- Yi, W.Y.; Lo, K.M.; Mak, T.; Leung, K.S.; Leung, Y.; Meng, M.L. A survey of wireless sensor network based air pollution monitoring systems. Sensors 2015, 15, 31392–31427. [Google Scholar] [CrossRef]
- Li, P.; Zhang, T.; Jin, Y. A spatio-temporal graph convolutional network for air quality prediction. Sustainability 2023, 15, 7624. [Google Scholar] [CrossRef]
- Grigoriev, G.Y.; Lagutin, A.S.; Nabiev, S.S.; Vasiliev, A.A.; Orlov, O.I.; Mukhamedieva, L.N.; Pakhomova, A.A.; Rodin, A.V.; Semenov, V.M.; Stavrovskii, D.B.; et al. Atmosphere composition control during long-duration space missions. Acta Astronaut. 2019, 163, 112–119. [Google Scholar] [CrossRef]
- DeSouza, P.N. Key Concerns and Drivers of Low-Cost Air Quality Sensor Use. Sustainability 2022, 14, 584. [Google Scholar] [CrossRef]
- Alvear-Puertas, V.E.; Burbano-Prado, Y.A.; Rosero-Montalvo, P.D.; Tözün, P.; Marcillo, F.; Hernandez, W. Smart and Portable Air-Quality Monitoring IoT Low-Cost Devices in Ibarra City, Ecuador. Sensors 2022, 22, 7015. [Google Scholar] [CrossRef]
- Collado, E.; Harish, G.; Sáez, Y. Design of a solar-powered air pollution monitoring system under tropical climate environments. In Proceedings of the 2022 IEEE 40th Central America and Panama Convention (CONCAPAN), Panama, Panama, 9–12 November 2022; IEEE: Piscataway, NJ, USA, 2022; pp. 1–6. [Google Scholar]
- Pinder, R.W.; Klopp, J.M.; Kleiman, G.; Hagler, G.S.; Awe, Y.; Terry, S. Opportunities and challenges for filling the air quality data gap in low-and middle-income countries. Atmos. Environ. 2019, 215, 116794. [Google Scholar]
- NASA Global Climate Change. 10 Interesting Things About Air. Climate Change: Vital Signs of the Planet. 2016. Available online: https://climate.nasa.gov/news/2491/10-interesting-things-about-air/#:~:text=The%20air%20in%20Earth (accessed on 2 July 2024).
- Padappayil, R.P.; Borger, J. Ammonia Toxicity. In StatPearls; StatPearls Publishing: Treasure Island, FL, USA, 2025; Available online: https://www.ncbi.nlm.nih.gov/books/NBK546677/ (accessed on 11 March 2023).
- Who Global Air Quality Guidelines. Particulate Matter (PM2.5 and PM10), Ozone, Nitrogen Dioxide, Sulfur Dioxide and Carbon Monoxide; World Health Organization: Geneva, Switzerland. 2021. Available online: https://www.who.int/publications/i/item/9789240034228 (accessed on 3 July 2024).
- Sharma, S.; Mishra, R.R.; Joshi, V.; Kour, K. Analysis and interpretation of global air quality. In Proceedings of the 2020 11th International Conference on Computing, Communication and Networking Technologies (ICCCNT), Kharagpur, India, 1–3 July 2020; IEEE: Piscataway, NJ, USA, 2020; pp. 1–5. [Google Scholar]
- Lee, K.K.; Spath, N.; Miller, M.R.; Mills, N.L.; Shah, A.S. Short-term exposure to carbon monoxide and myocardial infarction: A systematic review and meta-analysis. Environ. Int. 2020, 143, 105901. [Google Scholar] [PubMed]
- Orellano, P.; Reynoso, J.; Quaranta, N. Short-term exposure to sulphur dioxide (SO2) and all-cause and respiratory mortality: A systematic review and meta-analysis. Environ. Int. 2021, 150, 106434. [Google Scholar]
- Zheng, X.Y.; Orellano, P.; Lin, H.L.; Jiang, M.; Guan, W.J. Short-term exposure to ozone, nitrogen dioxide, and sulphur dioxide and emergency department visits and hospital admissions due to asthma: A systematic review and meta-analysis. Environ. Int. 2021, 150, 106435. [Google Scholar]
- WHO Guideline for the Clinical Management of Exposure to Lead. World Health Organization: Geneva, Switzerland. 2021. Available online: https://iris.who.int/bitstream/handle/10665/347360/9789240037045-eng.pdf (accessed on 10 July 2024).
- Human Health Effects of Polycyclic Aromatic Hydrocarbons as Ambient Air Pollutants: Report of the Working Group on Polycyclic Aromatic Hydrocarbons of the Joint Task Force on the Health Aspects of Air Pollution; WHO Regional Office for Europe: Copenhagen, Denmark. 2021. Available online: https://iris.who.int/bitstream/handle/10665/350636/9789289056533-eng.pdf?sequence=1 (accessed on 10 July 2024).
- US EPA. Volatile Organic Compounds’ Impact on Indoor Air Quality|US EPA. US EPA. 2018. Available online: https://www.epa.gov/indoor-air-quality-iaq/volatile-organic-compounds-impact-indoor-air-quality (accessed on 15 July 2024).
- WHO Guidelines for Indoor Air Quality; World Health Organization: Geneva, Switzerland. 2010. Available online: https://iris.who.int/bitstream/handle/10665/260127/9789289002134-eng.pdf (accessed on 11 July 2024).
- Chaudary, A.; Mubasher, M.M.; Qounain, S.W.U. Modeling the strategies to control the impact of photochemical smog on human health. In Proceedings of the 2021 International Conference on Innovative Computing (ICIC), Lahore, Pakistan, 9–10 November 2021; IEEE: Piscataway, NJ, USA, 2021; pp. 1–9. [Google Scholar]
- Zhang, J.; Wei, Y.; Fang, Z. Ozone pollution: A major health hazard worldwide. Front. Immunol. 2019, 10, 2518. [Google Scholar]
- Mpinga, V.; Da Cruz, A.R.; Lopes, S.I. Forecasting Short-Term Indoor Radon: A Machine Learning Approach Using LSTM Networks. In Proceedings of the 2023 18th Iberian Conference on Information Systems and Technologies (CISTI), Aveiro, Portugal, 20–23 June 2023; IEEE: Piscataway, NJ, USA, 2023; pp. 1–6. [Google Scholar]
- Sawaya, A.; Regina, A.C.; Menezes, R.G. Hydrogen Sulfide Toxicity. In StatPearls; StatPearls Publishing: Treasure Island, FL, USA, 2025; Available online: https://www.ncbi.nlm.nih.gov/books/NBK559264/ (accessed on 2 May 2024).
- WHO. Types of Pollutants. www.who.int. 2021. Available online: https://www.who.int/teams/environment-climate-change-and-health/air-quality-and-health/health-impacts/types-of-pollutants (accessed on 19 July 2024).
- Li, H.; Ariya, P.A. Black Carbon Particles Physicochemical Real-Time Data Set in a Cold City: Trends of Fall-Winter BC Accumulation and COVID-19. J. Geophys. Res. Atmos. 2021, 126, e2021JD035265. [Google Scholar]
- Poulsen, A.H.; Sørensen, M.; Hvidtfeldt, U.A.; Christensen, J.H.; Brandt, J.; Frohn, L.M.; Ketzel, M.; Andersen, C.; Raaschou-Nielsen, O. Source-specific air pollution including ultrafine particles and risk of myocardial infarction: A nationwide cohort study from Denmark. Environ. Health Perspect. 2023, 131, 057010. [Google Scholar]
- BBC. Mould at Home: How Dangerous Is It and What Can Be Done? BBC News. 16 November 2022. Available online: https://www.bbc.co.uk/news/uk-63642856 (accessed on 19 July 2024).
- Holden, K.A.; Lee, A.R.; Hawcutt, D.B.; Sinha, I.P. The impact of poor housing and indoor air quality on respiratory health in children. Breathe 2023, 19, 230058. [Google Scholar]
- Donarelli, M.; Ottaviano, L. 2D materials for gas sensing applications: A review on graphene oxide, MoS2, WS2 and phosphorene. Sensors 2018, 18, 3638. [Google Scholar] [CrossRef] [PubMed]
- Chai, H.; Zheng, Z.; Liu, K.; Xu, J.; Wu, K.; Luo, Y.; Liao, H.; Debliquy, M.; Zhang, C. Stability of metal oxide semiconductor gas sensors: A review. IEEE Sens. J. 2022, 22, 5470–5481. [Google Scholar] [CrossRef]
- Verma, A.; Sahu, P.K.; Chaudhary, V.; Singh, A.K.; Mishra, V.N.; Prakash, R. Fabrication and Characterization of P3HT/MoS2 Thin-Film Based Ammonia Sensor Operated at Room Temperature. IEEE Sens. J. 2022, 22, 10361–10369. [Google Scholar] [CrossRef]
- Verma, A.; Mishra, V.N.; Prakash, R. A self-aligned, solution-processed low-voltage operated organic thin-film transistor for ammonia gas sensing at room temperature. IEEE Sens. J. 2023, 23, 5561–5568. [Google Scholar] [CrossRef]
- Verma, A.; Mishra, V.N.; Prakash, R. Self-assembled Au/P3HT, high-k bilayer dielectric-based solution processed low voltage OTFT for multiparametric ammonia sensor at room temperature. IEEE Trans. Electron Devices 2022, 70, 281–287. [Google Scholar] [CrossRef]
- Verma, A.; Gupta, S.; Mishra, V.N.; Prakash, R. A Low Voltage, Self-Oriented Organic Polymer Nanocomposite-Based Flexible TFT for Ammonia Gas Sensing at Room Temperature. IEEE Trans. Electron Devices 2023, 70, 2453–2459. [Google Scholar] [CrossRef]
- Verma, A.; Kumar, P.; Singh, V.K.; Mishra, V.N.; Prakash, R. Introduction of graphene oxide nanosheets in self-oriented air-stable poly (3-hexylthiophene-2, 5-diyl) to enhance the ammonia gas sensing of a p-channel thin film transistor. Sens. Actuators B Chem. 2023, 385, 133661. [Google Scholar] [CrossRef]
- Verma, A.; Mishra, V.N.; Prakash, R. Air-stable highly sensitive self-assembled P3HT/GQD nanocomposite-based organic thin-film transistor for multiparametric HS real-time detection at room temperature. IEEE Sens. J. 2022, 23, 127–134. [Google Scholar] [CrossRef]
- Pathak, A.K.; Viphavakit, C. A review on all-optical fiber-based VOC sensors: Heading towards the development of promising technology. Sens. Actuators A Phys. 2022, 338, 113455. [Google Scholar] [CrossRef]
- Kumar, S.; Meng, G.; Mishra, P.; Tripathi, N.; Bannov, A.G. A systematic review on 2D MoS2 for nitrogen dioxide (NO2) sensing at room temperature. Mater. Today Commun. 2023, 34, 105045. [Google Scholar] [CrossRef]
- Khan, M.A.H.; Rao, M.V.; Li, Q. Recent advances in electrochemical sensors for detecting toxic gases: NO2, SO2 and H2S. Sensors 2019, 19, 905. [Google Scholar] [CrossRef]
- Joe, H.E.; Yun, H.; Jo, S.H.; Jun, M.B.; Min, B.K. A review on optical fiber sensors for environmental monitoring. Int. J. Precis. Eng. Manuf.-Green Technol. 2018, 5, 173–191. [Google Scholar]
- Li, W.; Zhang, Y.; Long, X.; Cao, J.; Xin, X.; Guan, X.; Peng, J.; Zheng, X. Gas sensors based on mechanically exfoliated MoS2 nanosheets for room-temperature NO2 detection. Sensors 2019, 19, 2123. [Google Scholar] [CrossRef]
- Geng, X.; Zhang, C.; Debliquy, M. Cadmium sulfide activated zinc oxide coatings deposited by liquid plasma spray for room temperature nitrogen dioxide detection under visible light illumination. Ceram. Int. 2016, 42, 4845–4852. [Google Scholar]
- Zito, C.A.; Perfecto, T.M.; Dippel, A.C.; Volanti, D.P.; Koziej, D. Low-temperature carbon dioxide gas sensor based on yolk–shell ceria nanospheres. ACS Appl. Mater. Interfaces 2020, 12, 17745–17751. [Google Scholar]
- Zito, C.A.; Perfecto, T.M.; Dippel, A.-C.; Volanti, D.P.; Koziej, D. Supporting Information—Low Temperature Carbon Dioxide Gas Sensor Based on Yolk-Shell Ceria Nanospheres. 2020. Laboratory of Materials for Sustainability (LabMatSus), São Paulo State University (UNESP). Available online: https://pubs.acs.org/doi/suppl/10.1021/acsami.0c01641/suppl_file/am0c01641_si_001.pdf (accessed on 4 June 2024).
- Shor, R.; Nemirovsky, Y. Study of CMOS Sensing System for Radon and Alpha Radiation. Radiation 2021, 1, 250–260. [Google Scholar] [CrossRef]
- Zhang, H.; Pan, Q.; Zhang, Y.; Zhang, Y.; Zhang, D. High-performance sulfur dioxide gas sensor based on graphite-phase carbon-nitride-functionalized tin diselenide nanorods composite. Chemosensors 2022, 10, 401. [Google Scholar] [CrossRef]
- Doblinger, S.; Lee, J.; Gurnah, Z.; Silvester, D.S. Detection of sulfur dioxide at low parts-per-million concentrations using low-cost planar electrodes with ionic liquid electrolytes. Anal. Chim. Acta 2020, 1124, 156–165. [Google Scholar]
- Bolli, E.; Fornari, A.; Bellucci, A.; Mastellone, M.; Valentini, V.; Mezzi, A.; Polini, R.; Santagata, A.; Trucchi, D.M. Room-Temperature O3 detection: Zero-bias sensors based on ZnO thin films. Crystals 2024, 14, 90. [Google Scholar] [CrossRef]
- Argyrou, A.; Giappa, R.M.; Gagaoudakis, E.; Binas, V.; Remediakis, I.; Brintakis, K.; Kostopoulou, A.; Stratakis, E. Toward the Optimization of a Perovskite-Based Room Temperature Ozone Sensor: A Multifaceted Approach in Pursuit of Sensitivity, Stability, and Understanding of Mechanism. Small 2025, 21, 2404430. [Google Scholar]
- Back, D.; Theisen, D.; Seo, W.; Tsai, C.S.J.; Janes, D.B. Development of interdigitated capacitive sensor for real-time monitoring of sub-micron and nanoscale particulate matters in personal sampling device for mining environment. IEEE Sens. J. 2020, 20, 11588–11597. [Google Scholar] [CrossRef]
- Helmbrecht, L.; van Dongen, S.W.; van der Weijden, A.; van Campenhout, C.T.; Noorduin, W.L. Direct environmental lead detection by photoluminescent perovskite formation with nanogram sensitivity. Environ. Sci. Technol. 2023, 57, 20494–20500. [Google Scholar] [CrossRef]
- Seker, S.; Surucu, O.; Economou, A.; Wang, J. “On-plant” wearable electrochemical sensor for atmospheric lead monitoring. Talanta 2025, 287, 127654. [Google Scholar] [CrossRef]
- Ni, X.; Wang, Y.; Zhang, M.; Cui, G.; Meng, X.; Chen, W.; Jin, M.; Shao, H.; Zhang, F.; Wang, C. Rapid and On-Site Approaches for Determination of Polycyclic Aromatic Hydrocarbons in Water and Air by Surface-Enhanced Raman Spectroscopy. ACS Omega 2025, 10, 6258–6266. [Google Scholar] [CrossRef]
- Fekih, M.A.; Bechkit, W.; Rivano, H.; Dahan, M.; Renard, F.; Alonso, L.; Pineau, F. Participatory air quality and urban heat islands monitoring system. IEEE Trans. Instrum. Meas. 2020, 70, 1–14. [Google Scholar] [CrossRef]
- Pereira, F.; Lopes, S.I.; Carvalho, N.B.; Curado, A. RnProbe: A LoRa-enabled IoT edge device for integrated radon risk management. IEEE Access 2020, 8, 203488–203502. [Google Scholar] [CrossRef]
- Alfano, B.; Barretta, L.; Del Giudice, A.; De Vito, S.; Di Francia, G.; Esposito, E.; Formisano, F.; Massera, E.; Miglietta, M.L.; Polichetti, T. A review of low-cost particulate matter sensors from the developers’ perspectives. Sensors 2020, 20, 6819. [Google Scholar] [CrossRef]
- Bagal, S.A.; Choudhari, N.K.; Chaudhari, A.R. Development of Internet of Things (IoT) Based Monitoring of Hazardous Exhaust Compounds in Air-A Review. In ITM Web of Conferences; EDP Sciences: Les Ulis, France, 2022; Volume 50, p. 01002. [Google Scholar]
- Li, Z.; Wen, Q.; Zhang, R. Sources, health effects and control strategies of indoor fine particulate matter (PM2.5): A review. Sci. Total Environ. 2017, 586, 610–622. [Google Scholar] [CrossRef]
- Dacunto, P.J.; Cheng, K.-C.; Acevedo-Bolton, V.; Jiang, R.-T.; Klepeis, N.E.; Repace, J.L.; Ott, W.R.; Hildemann, L.M. Real-time particle monitor calibration factors and PM2.5 emission factors for multiple indoor sources. Environ. Sci. Proc. Impacts 2013, 15, 1511–1519. [Google Scholar] [CrossRef]
- Park, J.; Ham, S.; Jang, M.; Lee, J.; Kim, S.; Kim, S.; Lee, K.; Park, D.; Kwon, J.; Kim, H.; et al. Spatial–temporal dispersion of aerosolized nanoparticles during the use of consumer spray products and estimates of inhalation exposure. Environ. Sci. Technol. 2017, 51, 7624–7638. [Google Scholar] [CrossRef]
- De Fazio, R.; Al-Hinnawi, A.R.; De Vittorio, M.; Visconti, P. An energy-autonomous smart shirt employing wearable sensors for users’ safety and protection in hazardous workplaces. Appl. Sci. 2022, 12, 2926. [Google Scholar] [CrossRef]
- Huang, J.; Duan, N.; Ji, P.; Ma, C.; Ding, Y.; Yu, Y.; Zhou, Q.; Sun, W. A crowdsource-based sensing system for monitoring fine-grained air quality in urban environments. IEEE Internet Things J. 2018, 6, 3240–3247. [Google Scholar]
- Purbakawaca, R.; Yuwono, A.S.; Subrata, I.D.M.; Alatas, H. Ambient Air Monitoring System With Adaptive Performance Stability. IEEE Access 2022, 10, 120086–120105. [Google Scholar] [CrossRef]
- Zhuang, Y.; Wang, X.; Lai, P.; Li, J.; Chen, L.; Lin, Y.; Wang, F. Wireless flexible system for highly sensitive ammonia detection based on polyaniline/carbon nanotubes. Biosensors 2024, 14, 191. [Google Scholar] [CrossRef]
- Liu, Z.; Wang, G.; Zhao, L.; Yang, G. Multi-points indoor AQM based on internet of things. IEEE Access 2021, 9, 70479–70492. [Google Scholar]
- Brambilla, A.; Candido, C.; Gocer, O. Indoor air quality and early detection of mould growth in residential buildings: A case study. UCL Open Environ. 2022, 4, e049. [Google Scholar]
- Kortoci, P.; Motlagh, N.H.; Zaidan, M.A.; Fung, P.L.; Varjonen, S.; Rebeiro-Hargrave, A.; Niemi, J.V.; Nurmi, P.; Hussein, T.; Petaja, T.; et al. Air pollution exposure monitoring using portable low-cost air quality sensors. Smart Health 2021, 23, 100241. [Google Scholar] [CrossRef]
- Mitchell, D.C.; Armitage, T.L.; Schenker, M.B.; Bennett, D.H.; Tancredi, D.J.; Langer, C.E.; Reynolds, S.J.; Dooley, G.; Mehaffy, J.; Mitloehner, F.M. Particulate matter, endotoxin, and worker respiratory health on large Californian dairies. J. Occup. Environ. Med. 2015, 57, 79–87. [Google Scholar]
- WHO. Health Effects of Particulate Matter: Policy Implications for Countries in Eastern Europe, Caucasus and Central Asia; World Health Organization: Geneva, Switzerland, 2013. [Google Scholar]
- Nyhan, M.; McNabola, A.; Misstear, B. Comparison of particulate matter dose and acute heart rate variability response in cyclists, pedestrians, bus and train passengers. Sci. Total Environ. 2014, 468, 821–831. [Google Scholar]
- UbiBot Online Store. (n.d.). UbiBot AQS1 Smart Air Quality Sensor WiFi & 4G Version. Available online: https://store.ubibot.com/products/ubibot-aqs1-smart-air-quality-sensor-wifi-4g-version?_pos=2&_sid=24aaa384c&_ss=r (accessed on 21 June 2024).
- Temto (n.d.). Temtop LKC-1000S+ 2nd Air Quality Monitor for PM2.5 PM10 HCHO AQI Particles VOCs Humidity Temperature, Date Dxport. Available online: https://www.temtop.co.uk/products/lkc-1000s-2nd (accessed on 22 March 2025).
- Amazon.co.uk. Amazon Smart Air Quality Monitor. 2024. Available online: https://www.amazon.co.uk/amazon-smart-air-quality-monitor-know-your-air/dp/B08X2V5K28 (accessed on 21 June 2024).
- UbiBot Wifi Temperature Sensor|Wireless Temperature Monitoring System. UbiBot Air Quality Monitor AQS1: A Comprehensive Solution to Monitor and Improve Indoor Air Quality. 2023. Available online: https://www.ubibot.com/news/6326/air-quality-monitor-aqs1/ (accessed on 21 June 2024).
- Google Docs. (n.d.). Temtop LKC-1000 Series Air Quality Monitor User Manual.pdf. Available online: https://drive.google.com/file/d/1hs1gu_F8ckXmPuShuXikfEyfmRINNuHR/view (accessed on 21 June 2024).
- Zamora, M.L.; Buehler, C.; Datta, A.; Gentner, D.R.; Koehler, K. Identifying optimal co-location calibration periods for low-cost sensors. Atmos. Meas. Tech. 2023, 16, 169. [Google Scholar]
- Cui, H.; Zhang, L.; Li, W.; Yuan, Z.; Wu, M.; Wang, C.; Ma, J.; Li, Y. A new calibration system for low-cost sensor network in air pollution monitoring. Atmos. Pollut. Res. 2021, 12, 101049. [Google Scholar]
- Marques, G.; Saini, J.; Dutta, M.; Singh, P.K.; Hong, W.C. Indoor AQM systems for enhanced living environments: A review toward sustainable smart cities. Sustainability 2020, 12, 4024. [Google Scholar]
- IIES–Indian Institute of Embedded Systems. Indian Institute of Embedded Systems–IIES. 2023. Available online: https://iies.in/blog/the-future-of-embedded-development/ (accessed on 23 August 2024).
- Shi, T.; Li, P.; Yang, W.; Qi, A.; Qiao, J. Research on AQM System Based on STM32 Single Chip Microcomputer. In Proceedings of the 2022 International Symposium on Intelligent Signal Processing and Communication Systems (ISPACS), Penang, Malaysia, 22–25 November 2022; IEEE: Piscataway, NJ, USA, 2022; pp. 1–4. [Google Scholar]
- Corno, F.; Mannella, L. Security evaluation of arduino projects developed by hobbyist IoT programmers. Sensors 2023, 23, 2740. [Google Scholar] [CrossRef] [PubMed]
- Liu, Y.; Nie, J.; Li, X.; Ahmed, S.H.; Lim, W.Y.B.; Miao, C. Federated learning in the sky: Aerial-ground air quality sensing framework with UAV swarms. IEEE Internet Things J. 2020, 8, 9827–9837. [Google Scholar]
- Pan, F.; Covington, J.A. A Portable Personalized Environmental Quality Monitoring System (PONG) Version 3. IEEE Sens. J. 2024, 14, 22926–22933. [Google Scholar]
- Motlagh, N.H.; Kortoçi, P.; Su, X.; Lovén, L.; Hoel, H.K.; Haugsvær, S.B.; Srivastava, V.; Gulbrandsen, C.F.; Nurmi, P.; Tarkoma, S. Unmanned aerial vehicles for air pollution monitoring: A survey. IEEE Internet Things J. 2023, 10, 21687–21704. [Google Scholar]
- Do, T.H.; Tsiligianni, E.; Qin, X.; Hofman, J.; La Manna, V.P.; Philips, W.; Deligiannis, N. Graph-deep-learning-based inference of fine-grained air quality from mobile IoT sensors. IEEE Internet Things J. 2020, 7, 8943–8955. [Google Scholar]
- D’Elia, G.; Ferro, M.; Sommella, P.; De Vito, S.; Ferlito, S.; D’Auria, P.; Di Francia, G. Influence of concept drift on metrological performance of low-cost NO2 sensors. IEEE Trans. Instrum. Meas. 2022, 71, 1–11. [Google Scholar]
- Tancev, G. Relevance of drift components and unit-to-unit variability in the predictive maintenance of low-cost electrochemical sensor systems in AQM. Sensors 2021, 21, 3298. [Google Scholar]
- Zaidan, M.A.; Motlagh, N.H.; Fung, P.L.; Khalaf, A.S.; Matsumi, Y.; Ding, A.; Tarkoma, S.; Petäjä, T.; Kulmala, M.; Hussein, T. Intelligent air pollution sensors calibration for extreme events and drifts monitoring. IEEE Trans. Ind. Inform. 2022, 19, 1366–1379. [Google Scholar]
- Milone, A.; Monteduro, A.G.; Rizzato, S.; Leo, A.; Di Natale, C.; Kim, S.S.; Maruccio, G. Advances in materials and technologies for gas sensing from environmental and food monitoring to breath analysis. Adv. Sustain. Syst. 2023, 7, 2200083. [Google Scholar] [CrossRef]
- Wang, G.; Yu, J.; Zheng, K.; Huang, Y.; Li, X.; Chen, X.; Tao, L.Q. A monolayer composite of h-BN doped by a nano graphene domain: As sensitive material for SO2 gas detection. IEEE Electron Device Lett. 2020, 41, 1404–1407. [Google Scholar] [CrossRef]
- Singh, S.; Varma, P.; Sreelekha, G.; Adak, C.; Shukla, R.P.; Kamble, V.B. Metal oxide-based gas sensor array for VOCs determination in complex mixtures using machine learning. Microchim. Acta 2024, 191, 196. [Google Scholar] [CrossRef] [PubMed]


| Study | Gas | Active Material | Active Channel Material Type | Fabrication Technique | Threshold Voltage VTH | Mobility (cm2/V⋅s) Range | Sensing Response | Testing Environment | Gate Type | Response Time | Recovery Time | Limit of Detection |
|---|---|---|---|---|---|---|---|---|---|---|---|---|
| [44] | NH3 | P3HT/ MoS2 | Nanocomposite of polymer (P3HT) and 2D material (MoS2). | FTM | −3.78 V (0 ppm) to −10.71 V (100 ppm) | 0.1408 (0 ppm) to 0.1446 (100 ppm) | 63.45% at 100 ppm | Closed chamber with an ambient environment. | highly p-doped silicon wafer. | - | - | ~1 ppm |
| [45] | NH3 | P3HT | P3HT polymer | Spin coating and FTM | −0.279 V (0 ppm) to −0.42886 V (5 ppm) | 0.0995 (0 ppm) and 0.0572 (5 ppm) | 47% at 5 ppm | Custom sensing setup with a temperature controller, humidity sensor, in-out valves, and a mixing fan. | p++ silicon substrate. | 9 s | 50 s | 11.6 ppb |
| [46] | NH3 | Au doped P3HT | Au nano particle doped P3HT nano composite | Fully Solution-Processed, Spin Coating and FTM | −0.1539 V (0 ppm) to −0.4980 V (5 ppm) | 0.1069 (0 ppm) and 0.0627 (5 ppm) | 55% at 5 ppm | 10 L chamber with mass flow controller, B1500A semiconductor parameter analyser, temperature and humidity sensor (at 46% relative humidity). | Heavily boron-doped silicon substrate (p++ Si). | 5 s | 17 s | 15.15 ppb |
| [47] | NH3 | P3HT/ graphitic carbon nitride | Polymer/2D nanocomposite | Fully Solution-Processed, Spin Coating and FTM | −0.1052 V (0 ppm) to −0.3520 V (20 ppm) | 0.1073 (0 ppm) and 0.041 (20 ppm) | 69% at 20 ppm | Mass flow controller with sample gas cylinder, humidity sensor, mixing fan, probe setup, B1500A semiconductor parameter analyser, room temperature, 55% relative humidity, ambient air. | Indium tin oxide coated polyethylene terephthalate substrate (15 × 20 mm) | 4 ± 0.5 s | 36 ± 4 s | 500 ppb |
| [48] | NH3 | P3HT/ Graphene Oxide | Polymer/2D nanocomposite | FTM | −4.75833 V (0 ppm) to −6.15757 V (80 ppm) | 0.0551 (0 ppm) to 0.02181 (80 ppm) | 63% at 80 ppm | A 10 L chamber at 55% relative humidity with an inlet for precise gas insertion via an air-tight syringe and an outlet for exhaust flushing, connected to B1500 semiconductor parameter analyser. | highly boron-doped silicon substrate | 44 s | 82 s | 278 ppb |
| [49] | H2S | P3HT/Graphene Quantum Dot | Polymer/2D nanocomposite | FTM | −13.71 V (0 ppm) to −16.21 V (25 ppm) | 0.0711 (0 ppm) to 0.0060 (25 ppm) | 91% at 25 ppm | A 10 L chamber at 55% relative humidity with an inlet for precise gas insertion via an air-tight syringe and an outlet for exhaust flushing, connected to B1500 semiconductor parameter analyser. | p++ Si substrate | 10 s | 225 s | 606 ppb |
| [56] | CO2 | CeO2 | Yolk-shell nanospheres | Microwave-assisted solvothermal | - | - | 1.8–2.9 times higher than commercial CeO2 nanoparticles. | Sensors installed in a continuous-flow Teflon chamber with DC power for temperature control, a gas mixing system regulated CO2 and relative humidity, a programmable electrometer measured resistance changes. | N/A | 2.58 min at 2400 ppm | 4.08 min at 2400 ppm | 150–2400 ppm |
| [58] | Rn | SiO2 | Semiconductor | Extended Tower Jazz High Voltage standard 0.18 μm CMOS | Threshold voltage variations estimate radon levels, with output voltage adjustable via trans-impedance amplifier biasing. | - | - | Exposure to an alpha radiation source and Radon gas in a controlled environment. | Polysilicon | - | - | Tested with concentrations of 200–800 Bq/m3. |
| Sensor | Manufacturer | Parameter | Interface | Power Consumption | |
|---|---|---|---|---|---|
| PMS5003 | Pantower China | PM2.5 based on Laser Scattering. | UART | Active Mode | Sleep Mode |
| 100 mA | 200 µA | ||||
| SHT30 | Sensirion Switzerland | Temperature and Humidity | I2C | 4.8 µW | |
| S80053 | SenseAir Sweden | CO2 at response time of 20 s. | UART | 18 mA average | |
| Study | Year | Issue Addressed | Contributions | Techniques Used | Limitations |
|---|---|---|---|---|---|
| [67] | 2021 | Effective AQM and urban heat islands to improve public knowledge by bridging the gap between individual exposure and regional measurements. | Development of a participatory type monitoring system using low-cost sensors and IoT architectures with a web interface to visualise sensor data. | Use of small, mobile and modular sensor nodes to monitor NO2, PM1, PM2.5, and PM10. | Temperature and humidity measurements affected by sun exposure and wind direction, significant convergence time of sensors, high battery consumption limiting monitoring duration, calibration and accuracy issues. |
| [69] | 2021 | Evaluating the accuracy, reliability, and real-time monitoring of low-cost PM sensors. | Comprehensive review of the performance, improvement techniques, benefits, and limitations of PM sensors. | Comparison of 50 PM sensors. | High dependency on calibration, variability in performance under different conditions, high humidity sensitivity, limited calibration generalisability and need for ongoing recalibrations. |
| [75] | 2019 | Fine-grained AQM in urban areas | Vehicle-based system for high-resolution urban AQM, algorithms development and large-scale testing to demonstrate effectiveness. | 500 mobile nodes for crowdsourcing and post-processing data via exponential smoothing and intelligent algorithms. | Potential inaccuracies in AQM estimates when assuming open windows reflect outside conditions, limited testing only in highly polluted cities. |
| [76] | 2022 | Stable ambient air monitoring in varying network conditions. | Introduction of a low-cost AQM system with adaptive performance stability for data transmission. | A system with metal-oxide sensors, a GPRS module, a microcontroller, and an algorithm for reducing packet loss is used to effectively monitor SO2, CO, NO2, PM, and weather conditions. | Simple adaptive algorithms may increase latency, reliant on GSM/GPRS, high power consumption, and limited field validation in varied environments. |
| [78] | 2021 | Need for real-time, multi-point indoor AQM monitoring in residential buildings. | Implementation of a multi-point IoT-based indoor AQM system and analysis of the impact of human behaviour and environmental changes on indoor air quality. | STM32 and Zigbee used for data collection and transmission, real-time data access and analysis, PM2.5 and CO2 monitoring. | Significant signal loss (>8%) with Zigbee over concrete walls, monitoring period was limited to one month in winter, study was confined to a single residential building. |
| [79] | 2022 | Indoor AQM and early detection of mould growth in residential buildings. | Case study on indoor AQM and mould in an Australian suburban home. Found links between poor AQ, high fungal spores, and health risks. Emphasises early detection and better building regulations. | Site inspection, air testing, surface sampling for mould, 2-month indoor AQM monitoring campaign, analysis of fungal spore concentrations, and environmental parameter measurements. | Limited to one case study, short monitoring period, reliance on basic sampling instruments, and conclusions based on observational data without extensive controls. |
| [80] | 2021 | Monitoring individual air pollution exposure using portable low-cost sensors. | Developed a citizen-based air pollution monitoring system, classified data into indoor/outdoor, validated sensor data accuracy, and provided fine-grained air pollution insights. | Data classification, consistency and accuracy validation, pollution measurement campaign over wide geographic areas, 40 portable low-cost sensors to monitor CO, NO2, O3, and PM over 6 km2. | Low-cost sensor data accuracy, limited geographical focus, data variability due to user handling, and simple indoor/outdoor classification limit broader applicability and precision. |
| Features | Amazon AQ Monitor | Ubibots AQS1 Smart AQ Monitor | Temptop 1000S+ AQ Monitor |
|---|---|---|---|
| Temperature | ✓ | ✓ | ✓ |
| Humidity | ✓ | ✓ | ✓ |
| Atmospheric Pressure | ✗ | ✓ | ✗ |
| PM1.0 | ✗ | ✓ | ✗ |
| PM2.5 | ✓ | ✓ | ✓ |
| PM10 | ✗ | ✓ | ✓ |
| VOC | ✓ | ✓ | ✓ |
| Formaldehyde | ✗ | ✓ | ✓ |
| CO2 | ✗ | ✓ | ✗ |
| Equivalent CO2 | ✗ | ✓ | ✗ |
| CO | ✓ | ✗ | ✗ |
| Wi-Fi | ✓ | ✓ | ✗ |
| Calibration Methodologies | Co-Location | Laboratory | In-Field |
|---|---|---|---|
| Advantages | Provides accurate calibration under real-world conditions. | Provides highly precise calibration in a controlled environment. | Ensures high accuracy in the actual operating environment. |
| Accounts for the impact of temperature, humidity, and pollutants that may not be captured in controlled environments. | Useful for identifying sensor response to specific pollutants and eliminating cross-sensitivities. | Accounts for site-specific conditions not captured in laboratory or co-location calibration. | |
| Limitations | Accuracy can degrade when the sensor is moved to a different environment. | Calibration may not fully represent real-world conditions where external factors (e.g., temperature fluctuations, pollutant mixtures) influence sensor accuracy. | Calibration may need to be repeated periodically to address environmental changes. |
| Requires prolonged exposure to ensure calibration robustness. | |||
| Dependent on the availability of high-precision reference stations. | Limited adaptability to dynamic field environments. | Requires access to reference instruments at the deployment site. |
Disclaimer/Publisher’s Note: The statements, opinions and data contained in all publications are solely those of the individual author(s) and contributor(s) and not of MDPI and/or the editor(s). MDPI and/or the editor(s) disclaim responsibility for any injury to people or property resulting from any ideas, methods, instructions or products referred to in the content. |
© 2025 by the authors. Licensee MDPI, Basel, Switzerland. This article is an open access article distributed under the terms and conditions of the Creative Commons Attribution (CC BY) license (https://creativecommons.org/licenses/by/4.0/).
Share and Cite
Shahid, S.; Brown, D.J.; Wright, P.; Khasawneh, A.M.; Taylor, B.; Kaiwartya, O. Innovations in Air Quality Monitoring: Sensors, IoT and Future Research. Sensors 2025, 25, 2070. https://doi.org/10.3390/s25072070
Shahid S, Brown DJ, Wright P, Khasawneh AM, Taylor B, Kaiwartya O. Innovations in Air Quality Monitoring: Sensors, IoT and Future Research. Sensors. 2025; 25(7):2070. https://doi.org/10.3390/s25072070
Chicago/Turabian StyleShahid, Saim, David J. Brown, Philip Wright, Ahmad M. Khasawneh, Bryn Taylor, and Omprakash Kaiwartya. 2025. "Innovations in Air Quality Monitoring: Sensors, IoT and Future Research" Sensors 25, no. 7: 2070. https://doi.org/10.3390/s25072070
APA StyleShahid, S., Brown, D. J., Wright, P., Khasawneh, A. M., Taylor, B., & Kaiwartya, O. (2025). Innovations in Air Quality Monitoring: Sensors, IoT and Future Research. Sensors, 25(7), 2070. https://doi.org/10.3390/s25072070