Article

Measuring CO2 Concentration and Thermal Comfort in Italian University Classrooms: A Seasonal Analysis

1
Department of Economics, Engineering, Society and Business Organization, University of Tuscia, 01100 Viterbo, Italy
2
Department of Agriculture and Forest Sciences, University of Tuscia, 01100 Viterbo, Italy
*
Author to whom correspondence should be addressed.
Sensors 2025, 25(7), 1970; https://doi.org/10.3390/s25071970
Submission received: 11 February 2025 / Revised: 6 March 2025 / Accepted: 20 March 2025 / Published: 21 March 2025

Abstract

:
This study investigates indoor air quality (IAQ) and thermal comfort in Italian university classrooms, considering seasonal variations. Poor IAQ can impair students’ cognitive performance and well-being, making ventilation strategies crucial. The aim is to assess CO2 levels, temperature, and humidity, analyzing their interactions across seasons. A monitoring protocol was applied in three classrooms using NDIR sensors and a microclimate assessment system. Sensors were placed strategically to capture representative data in 20 days in spring and autumn. Results indicate that CO2 levels peaked at 2324.2 ppm in autumn, significantly exceeding the 1000 ppm threshold, whereas spring levels remained below 953.4 ppm. Relative humidity ranged from 32.7% to 55.6%, with higher values in autumn. Temperatures varied from 19.1 °C to 27.5 °C, with warmer conditions in spring. Strong positive correlations (always greater than 0.70) between CO2 and humidity suggest inadequate air exchange reduces IAQ, potentially affecting cognitive performance. This research provides valuable insights for improving student well-being through better air quality management. This research provides valuable insights for optimizing classroom environments, supporting cognitive performance, and improving student well-being through better air quality management.

1. Introduction

Indoor air quality (IAQ), mainly CO2 concentration, and thermal comfort are increasingly recognized as critical elements influencing health and well-being [1,2]. IAQ and thermal comfort are also demonstrated to be essential components to guarantee a healthy learning environment, reducing absence rate and improving test scores, as well as cognitive performance, in educational settings [3,4]. Classrooms are often subject to fluctuating and elevated levels of carbon dioxide (CO2) due to high occupancy, limited space, and varying ventilation quality, which can lead to suboptimal conditions for learning [5,6]. Research underscores the significance of maintaining CO2 concentrations below 1000 parts per million (ppm), as higher levels have been shown to impair cognitive abilities essential for academic tasks [7]. For instance, students exposed to environments with high CO2 concentrations display reduced problem-solving skills, memory retention, and information processing, which collectively diminish academic performance [8].
Studies on indoor air quality in educational environments indicate that CO2 concentration serves as a reliable marker for assessing ventilation adequacy and occupancy levels. For example, Hui et al. found that indoor CO2 levels could serve as a proxy for ventilation efficiency, as higher concentrations indicate insufficient fresh air exchange [9]. As a direct product of human respiration, CO2 accumulates rapidly in enclosed spaces with inadequate air exchange, creating environments with lower oxygen availability and higher levels of contaminants. Several investigations into the CO2 concentration of schools and universities show that the concentration of CO2 tends to rise considerably during class hours, peaking at levels that can exceed recommended standards, particularly in colder seasons when natural ventilation (e.g., open windows) is minimized to maintain thermal comfort [10]. Previous studies have consistently highlighted the seasonal impact on CO2 concentration in classrooms, with higher levels typically recorded during the winter months due to reduced ventilation practices. Investigations conducted in various educational settings, including naturally ventilated classrooms in different climates, have shown that CO2 accumulation is significantly influenced by outdoor temperatures, as lower temperatures discourage window opening and natural ventilation [11,12]. In particular, a comparison study between Polish and Spanish classrooms reported consistently higher CO2 levels in the coolest region, i.e., Poland, with a pronounced effect in the early morning hours, suggesting a strong correlation between seasonal ventilation habits and indoor air quality [12]. A similar trend has been observed in Italian primary schools, where research has demonstrated that manual airing techniques alone are not sufficient to maintain acceptable indoor air quality during the heating season [13]. Furthermore, the study emphasized that while spring conditions may allow for more effective natural ventilation, wintertime air exchange remains inadequate, requiring alternative solutions to maintain CO2 concentrations within recommended thresholds. In addition to CO2 accumulation, research also suggests that high levels of indoor pollutants, such as particulate matter (PM), can coincide with increased CO2 concentrations, particularly in schools where manual airing strategies are employed inconsistently [14].
In addition to IAQ, there has been a growing interest in research analyzing the role of thermal comfort parameters—namely temperature and relative humidity—on both physiological and cognitive functions within classroom environments [15,16]. Temperature fluctuations, even within mild ranges, can influence students’ heart rates and thermal perceptions, potentially inducing discomfort that affects their focus and task performance [17]. Studies by Brink et al. indicate that both high and low extremes of thermal conditions disrupt cognitive tasks such as memory recall and vigilance [18], even if it is worth underlining that, regarding the thermal perception, female students tend to feel colder than their male counterparts. Similarly, Barbic et al. observed a decrease of up to 24% in cognitive performance among students experiencing thermal discomfort due to high temperature [19]. However, not all thermal discomfort sensations lead to a deterioration in cognitive performance, and the impact is most likely activity-dependent; in fact, a cooler environment has been demonstrated to positively influence cognitive performance in comparison to the colder and warmer ones. Moreover, the thermal sensation ’warm’ influences cognitive performance in tasks related to vigilance, memory and learning more than the thermal sensation ‘cold’. Evidence suggests a consistent relationship between CO2 levels and other microclimate variables. Specifically, research by Lazović et al. highlighted that the correlation between CO2 concentration and relative humidity can serve as a key indicator of air quality and ventilation efficiency, especially in naturally ventilated spaces [20]. For example, high occupancy without adequate air exchange often results in both increased CO2 levels and higher relative humidity due to human exhalation and respiration processes [21]. These interconnected variables suggest that managing one factor can often influence the others, underscoring the importance of a comprehensive IAQ-monitoring approach that encompasses CO2, temperature, and humidity [22].
From this perspective, it is clear how a sensor-based measurement of not only CO2 levels but also temperature and humidity is mandatory in classrooms to sustain a productive learning atmosphere and to properly design and manage classroom ventilation strategies, moreso than in other types of buildings, such as the ones dedicated for office work [17,23]. Even if a plethora of studies have been already proposed in the literature, to the best of the authors’ knowledge, analyses are limited to specific seasons and specific geographical areas. In addition, university classrooms, characterized by high occupancy levels and variable ventilation conditions, are particularly susceptible to fluctuations in CO2 concentration, temperature, and humidity. While extensive research has been conducted on indoor air quality in primary and secondary schools, fewer studies have focused on higher education environments, where students typically spend extended periods in enclosed spaces with limited ventilation control. In light of these findings, the present study investigates the seasonal variations in CO2 concentration and thermal comfort in university classrooms, aiming to assess how different ventilation practices impact air quality throughout the academic year, especially in the seasons with higher occupancy due to lectures rather than exams, which are spring and autumn. Our central hypothesis is that CO2 levels significantly increase during autumn due to reduced natural ventilation, leading to higher relative humidity and potential discomfort for students, whereas spring conditions allow for improved air exchange, maintaining better indoor air quality. To test this hypothesis, we conducted continuous environmental monitoring across different classroom settings, analyzing the relationship between CO2 concentration, humidity, and thermal comfort. By focusing on university classrooms, this study addresses a critical gap in the literature and provides practical insights for optimizing ventilation strategies in higher education settings. These findings contribute to a growing body of research on indoor air quality management and offer evidence-based recommendations for improving student well-being and learning conditions in academic institutions.

2. Materials and Methods

2.1. Experimental Setup

For the objective of measuring carbon dioxide concentration, temperature and humidity, a commercially available Non-Dispersive Infrared (NDIR) sensor produced by Fybra (model: Fybra School, Milan, Italy) has been used (Figure 1).
The working principle of the sensor for the measurement of the carbon dioxide concentration is based on spectroscopy, specifically on the energy absorption characteristics of CO2 in the infrared zone. The NDIR sensor has an infrared light source that emits through a measuring chamber. The gas to be measured flows within this chamber. The infrared light traverses the gas sample, and the gas molecules absorb energy at specific infrared wavelengths. Each gas possesses its own unique infrared absorption spectrum. For instance, in the case of CO2, absorptions of radiation with wavelengths at 2.7 µm, 4.7 µm and 15 µm are detected in the infrared region. Following the passage of infrared light through the gas sample, it reaches a detector responsible for measuring the intensity of the light striking it. The difference between the intensity of the emitted infrared light and the intensity of the detected light offers insights into the gas absorption within the sample. The same sensor is also able to gather measurements on temperature (T) and relative humidity (RH). Metrological characteristics of Fybra sensors are reported in Table 1.
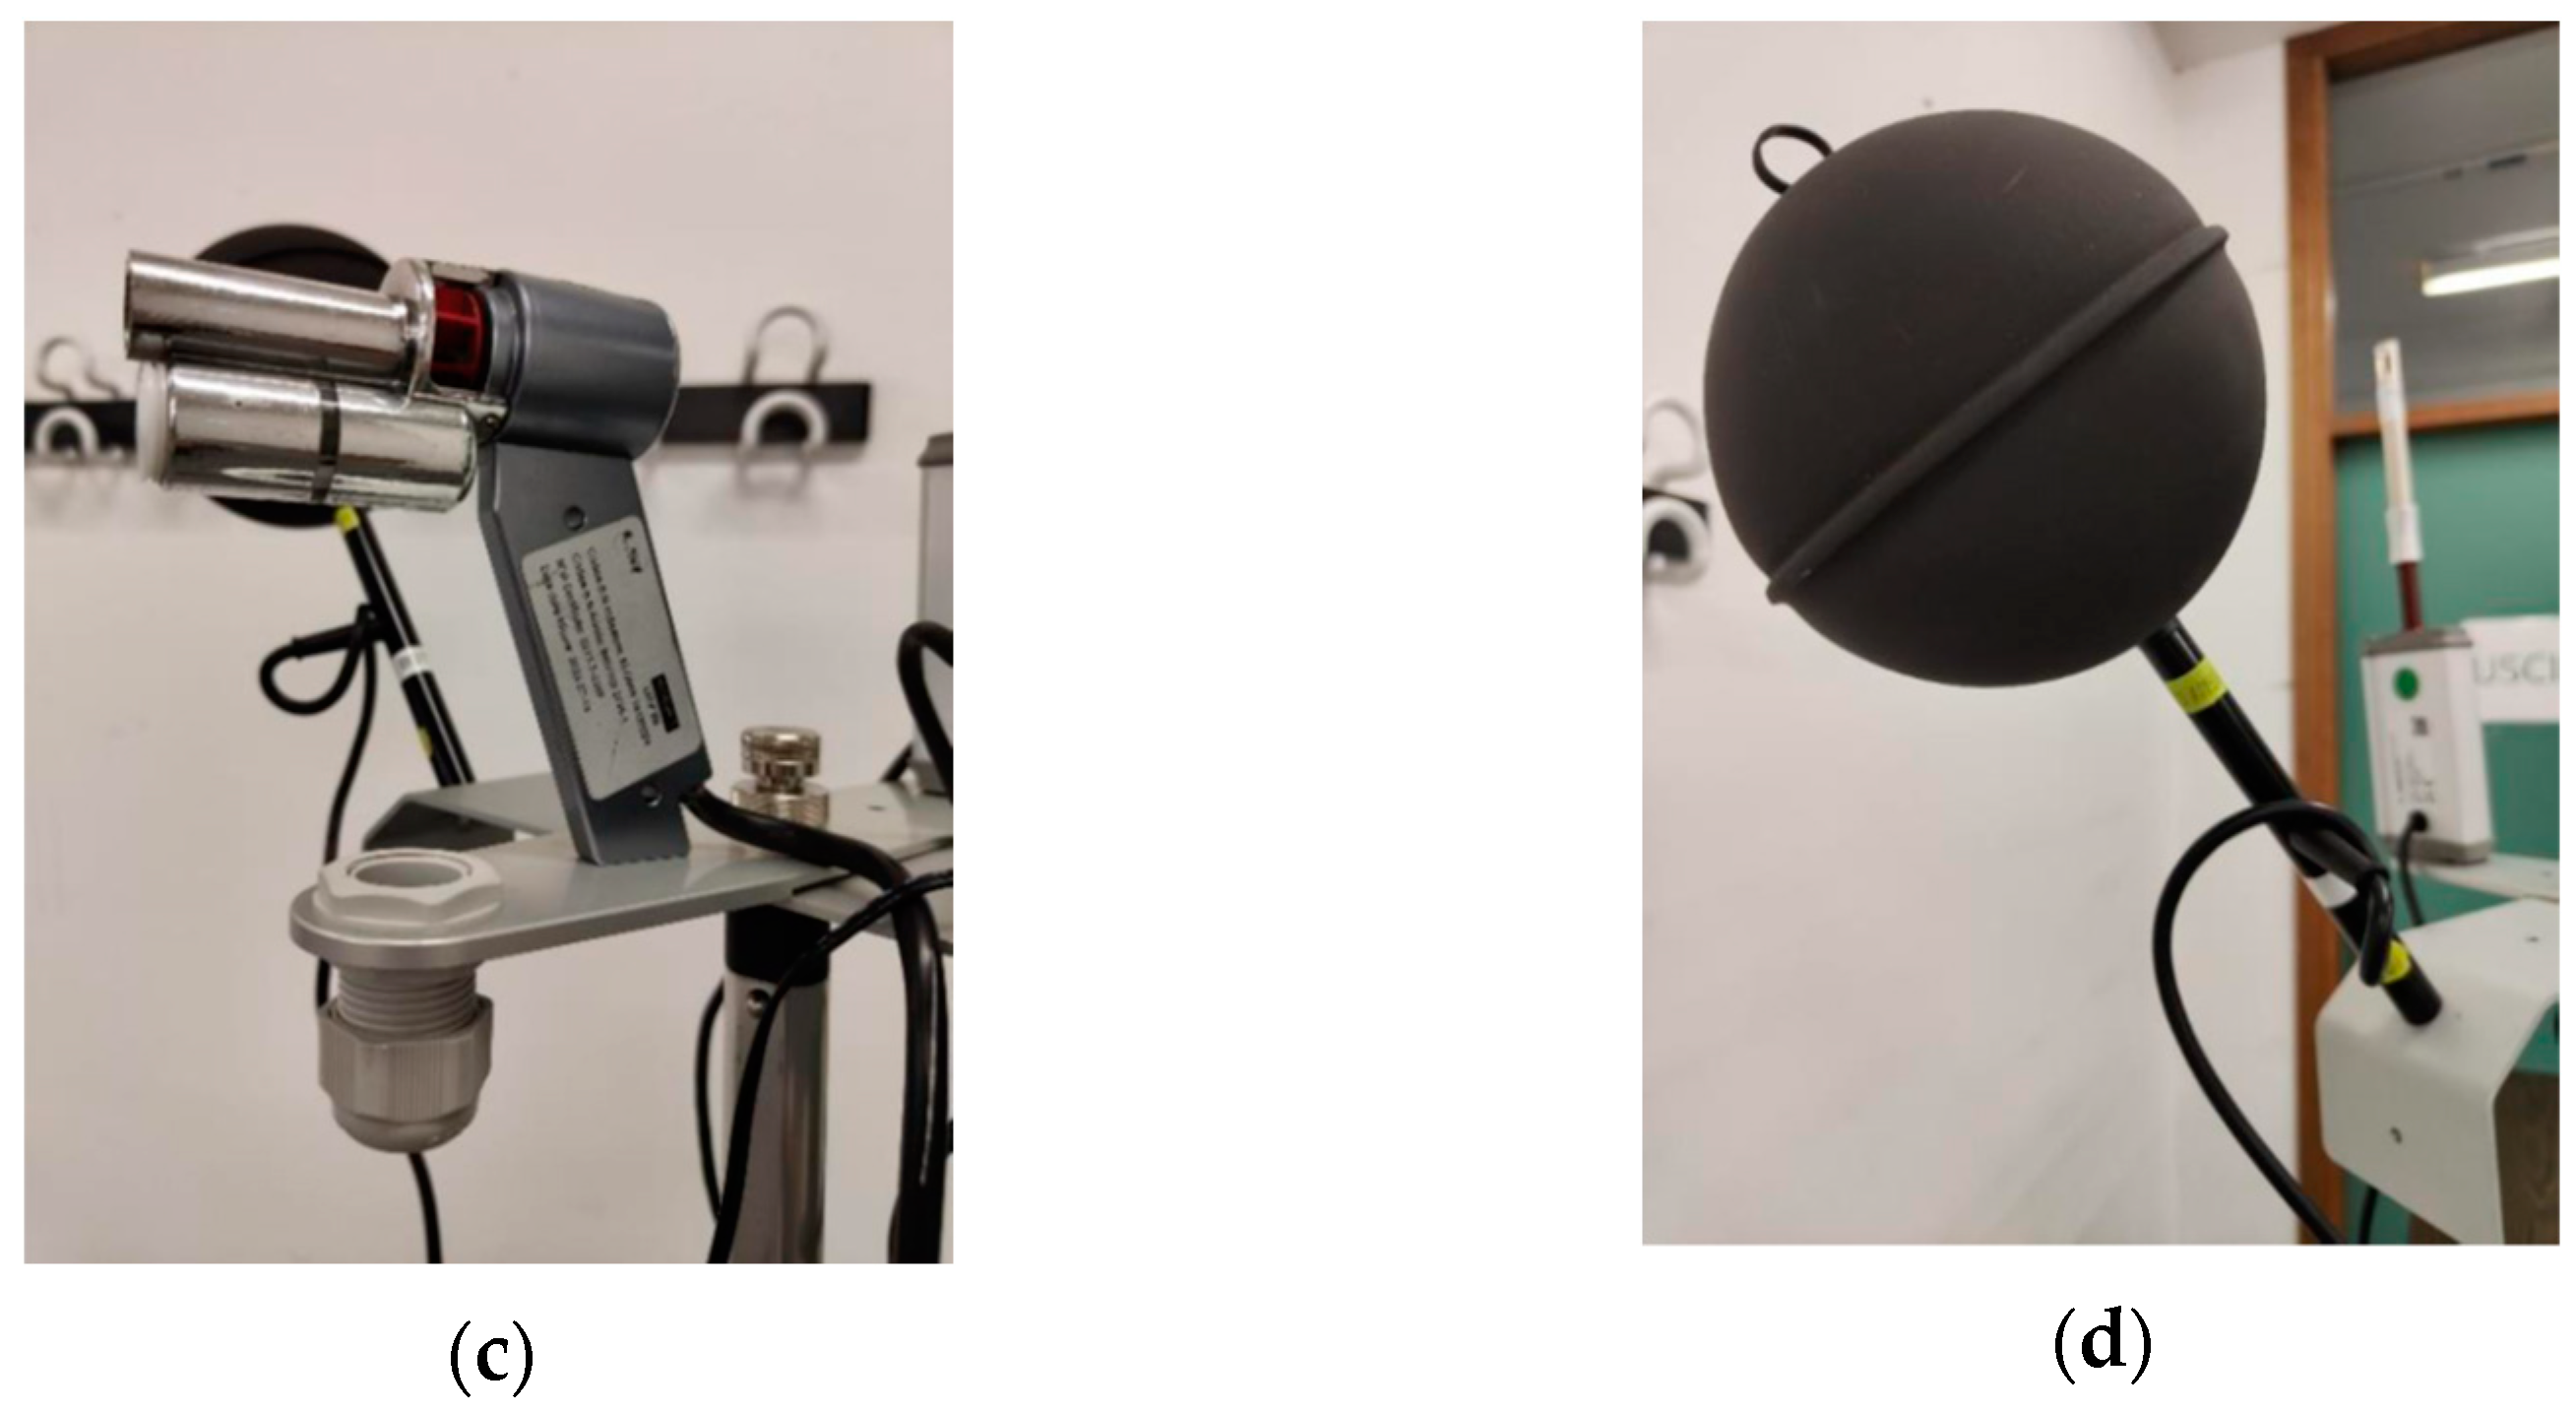
For the microclimate assessment, the BABUC (LSI Lastem srl, Milan, Italy) system has been adopted. The system consists of an instrument assembly (data logger and sensors) mounted on a tripod, as depicted in Figure 2. Depending on the specific environment and the related microclimatic survey (moderate, hot and cold environments and localized discomforts), it is possible to choose different types of sensors. For our application, a moderate indoor environment was analyzed, and therefore the utilized probes consisted of a hot-wire anemometer (model ESV126, LSI Lastem srl, Milan, Italy), a psychrometer (model MINI-DIN ESU102A, LSI Lastem srl, Milan, Italy) and a globe thermometer (model DMA131A, LSI Lastem srl, Milan, Italy).
Through the sensor system, we gathered the following measures: (i) flow velocity; (ii) dry air temperature; (iii) wet air temperature; (iv) relative humidity; and (v) mean radiant temperature. The BABUC system has been already used in the literature for microclimatic analysis in indoor environments [24,25]. Metrological characteristics of the BABUC system are reported in Table 2.

2.2. Experimental Protocol

The monitoring and evaluation of CO2 concentration and thermal comfort was conducted in three classrooms of varying size at the University of Tuscia, located in the School of Engineering. The selected classrooms included the following: (i) F8-97 m2, volume 291 m3, maximum capacity of 70 students; (ii) F9-78.23 m2, volume 234.69 m3, maximum capacity of 54 students; and (iii) B1-112.40 m2, volume 337.20 m3, maximum capacity of 40 students.
Each classroom is characterized by the following:
  • Ventilation system—Natural ventilation through windows;
  • Windows—B1 and F8 are equipped with 4 single-glazed aluminum inward-opening windows; whereas F9 with 2 single-glazed aluminum inward-opening windows.
  • Equipment—Desks, chairs, projector, whiteboard;
  • Heating system—Central heating with radiators along walls;
  • Location and orientation: low-traffic area surrounded by open fields and east-to-northeast orientation; the direct sunlight exposure is primarily limited to the morning hours.
Given the sizes of the classrooms, sensor placement was optimized to capture representative data for each environment. Classrooms F8 and F9 were equipped with one sensor each, positioned at the front of the room near the desk and front rows. In Classroom B1, due to its larger size, two sensors were installed: one near the desk and front rows, and another at the rear of the room. The placement of sensors within the classrooms adhered strictly to the following criteria, as recommended by ISO 16000:26 and GdS Indoor Pollution guidelines:
  • Height: Sensors were installed at approximately 1.5 m above the floor, which corresponds to the breathing zone of seated occupants. This placement minimized measurement bias from non-representative air strata.
  • Distance from Occupants: Sensors were placed 1.5–2 m away from occupants to reduce direct interference from exhaled air.
  • Distance from Obstacles: A minimum distance of 1 m was maintained from walls, bookshelves, and other potential obstructions to ensure an unobstructed measurement of the indoor air.
  • Ventilation Interference: Sensors were positioned away from direct airflow caused by windows, doors, or air conditioning units to avoid artificial fluctuations in readings.
  • Heat Sources: Care was taken to avoid proximity to radiators, spotlights, or other heat sources that could influence temperature and relative humidity measurements.
In addition to continuous monitoring, the sensors were equipped with a visual alert system to provide real-time feedback to occupants: (i) blue, indicating good air quality; (ii) red, indicating poor air quality, prompting immediate ventilation; (iii) and violet, denoting improving air quality. Specifically, the red light starts when CO2 overcomes the limit of 1000 ppm, whereas the violet starts at 900 ppm. Values lower than 900 are associated with blue light.
Data acquisition through NDIR sensors was performed in two distinct periods, spring and autumn, to capture seasonal variations in indoor air quality and thermal comfort conditions. The data collection schedule comprised 50 days between May 2022 and December 2022, twenty-five per each season, for the three above-mentioned classrooms. Details of students’ occupancy are reported in Table 3.
In all classes of the case study, the lecture starts at 9:00 a.m. Depending on the type of activities, they last 60 or 120 min, and after that a 15 min break takes place. A long break is scheduled from 1 to 2 pm. During both autumn and spring, windows were kept closed before the school start time, whereas the classroom’s door was kept open till the lesson start. During the lecture time, a different behavior was recognized in autumn and spring: (i) in the autumn, windows and doors were kept ordinarily closed (aside from the previously mentioned break time, during which both windows and doors were opened to let fresh air enter the classroom); (ii) in spring, windows are mainly kept open, whereas the door was kept closed (expect during the break time). The specifications of this case study are in line with other previously available case studies in the literature [11,12,13,26].
These timeframes were chosen to reflect different external environmental conditions, influencing natural ventilation behavior, and occupancy patterns. Outputs of the BABUC system were collected for a complete microclimate assessment only in classroom F8 due to its higher student occupancy, making it a critical space for IAQ evaluation.
On each survey day, sensors were calibrated and the actual data acquisition started after 30 min to guarantee the stabilization of the signals. Measurements were recorded every 120 s to ensure consistent temporal resolution across all monitored variables. This interval was selected to align with the response times of the sensors. The measurement duration for each classroom spanned the full teaching schedule, capturing occupancy dynamics and ventilation practices throughout the day.
For the microclimate analysis, subjective thermal comfort was assessed through questionnaires distributed to students present during the survey to assess the Predicted Mean Vote (PMV). Participants rated their thermal sensation on a 7-point scale ranging from −3 (very cold) to +3 (very warm), as in the following Table 4, as requested in the norm ISO 7730:2006:

2.3. Data Analysis

The collected data were exported in CSV format, with separate files created for each variable and classroom. The data analysis was conducted using MATLAB software (version R2023a) to process, evaluate, and interpret the datasets collected from the NDIR sensors and the BABUC microclimate station.
Concerning NDIR sensors, data were firstly structured into matrices, categorized by four daily intervals, which were as follows: (i) 9–11 a.m.; (ii) 11 a.m.–1 p.m.; (iii) 2–4 p.m.; and (iv) 4–6 p.m.. It is worth noticing that the interval 1–2 p.m. has been excluded by the successive analysis for the absence of occupants in the classroom due to the lunch break. Successively, descriptive statistics, including maximum, minimum, mean, and standard deviation, were computed for CO2 concentration, temperature and relative humidity per each daily interval. It is worth highlighting that the results for the classroom B1, in which two NDIR sensors were placed, were obtained by firstly averaging the measurements of the two sensors. Apposite graphs were realized to monitor when CO2 concentration overcame the norm threshold of 1000 ppm.
Moving to the microclimate analysis through the BABUC system, performed only in classroom F8, we applied the approach based on ISO 7730:2006, which defines thermal comfort using the Predicted Mean Vote (PMV) and Predicted Percentage of Dissatisfied (PPD) indices. Using the replies to the questionnaire, the PPD index was calculated by using the following formula:
P P D   =   100     95 e 0.03353 P M V 4 0.2179 P M V 2
The previous equation can be applied only if the following values are met: (i) indoor air temperature in the range 10–30 °C; (ii) average radiant temperature in the range 10–40 °C; and (iii) air velocity in the range 0–1 m/s. The coherence with the requirement has been verified by using data gathered from the BABUC system.

2.4. Statistical Analysis

Correlation between CO2 concentration and relative humidity was assessed. Scatter plots were created with relative humidity values on the x-axis and CO2 concentrations on the y-axis, and a trend line was fitted to visualize the relationship. Pearson’s correlation coefficient (r) was calculated to quantify the strength of the relationship. Correlation coefficients approaching +1 indicated a strong positive correlation, values near −1 indicated a strong negative correlation, and values close to 0 suggested no significant relationship. Furthermore, to determine whether significant differences in mean CO2 concentrations existed across different time intervals, a one-way ANOVA test was conducted. Bonferroni’s multiple comparison test was performed in case of significant ANOVA results. Seasonal differences in CO2 concentrations and PMV between spring and autumn were further examined using a two-sample t-test, independently per each variable.

3. Results and Discussions

3.1. Temperature, Relative Humidity and CO2 Concentration: Seasoning Variations and Correlation

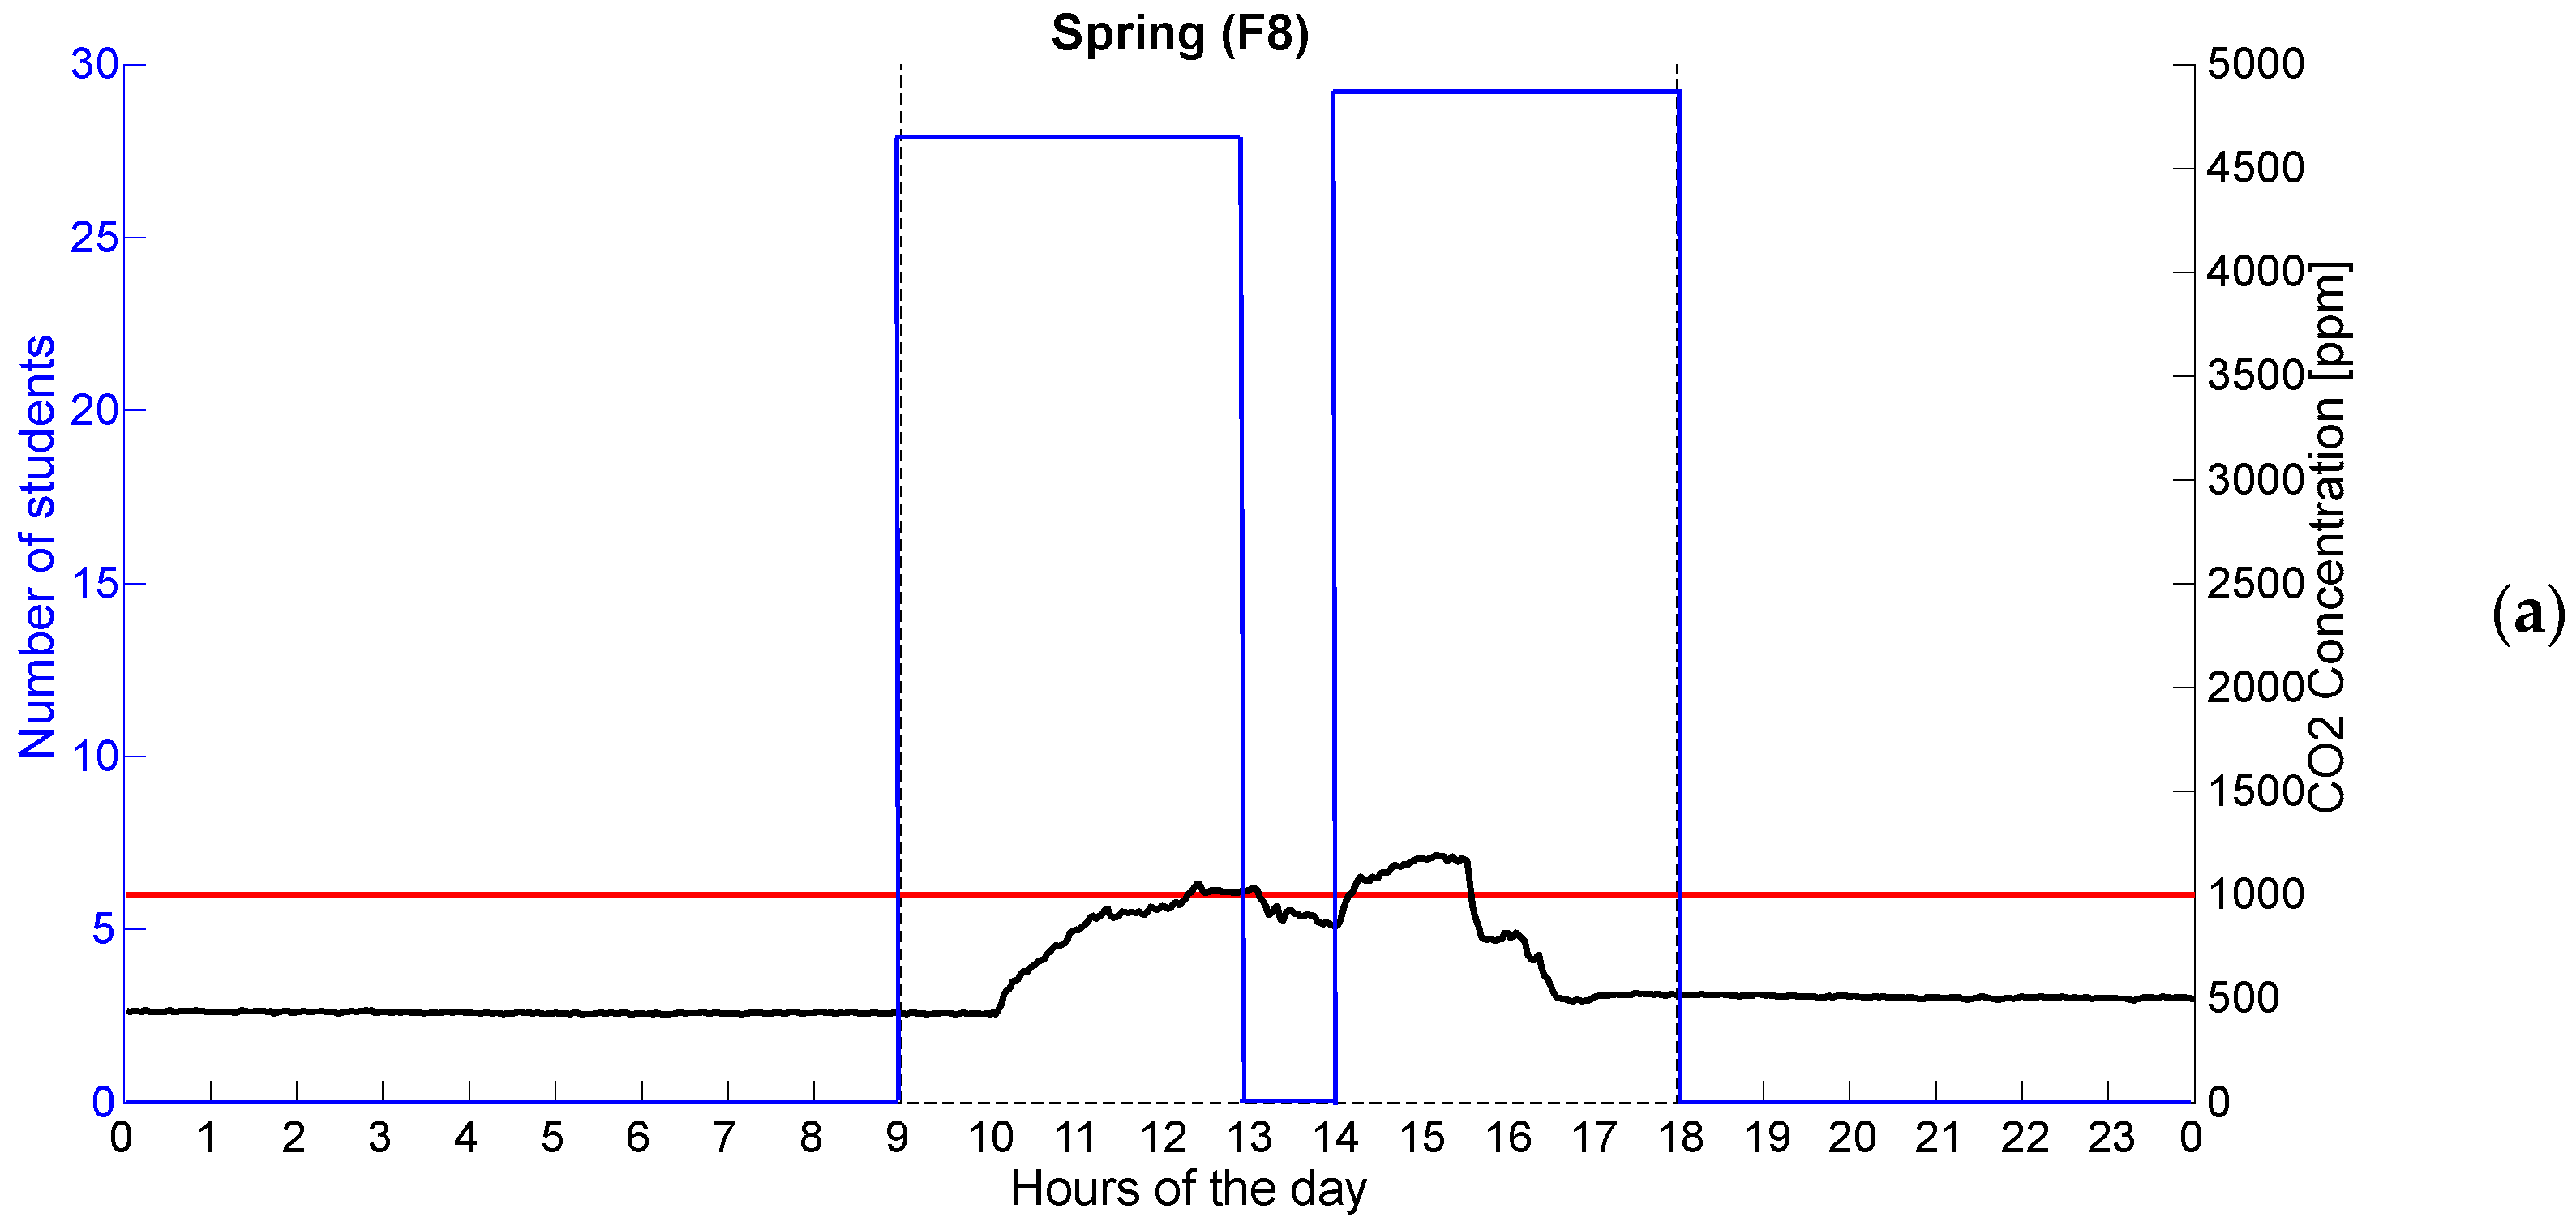
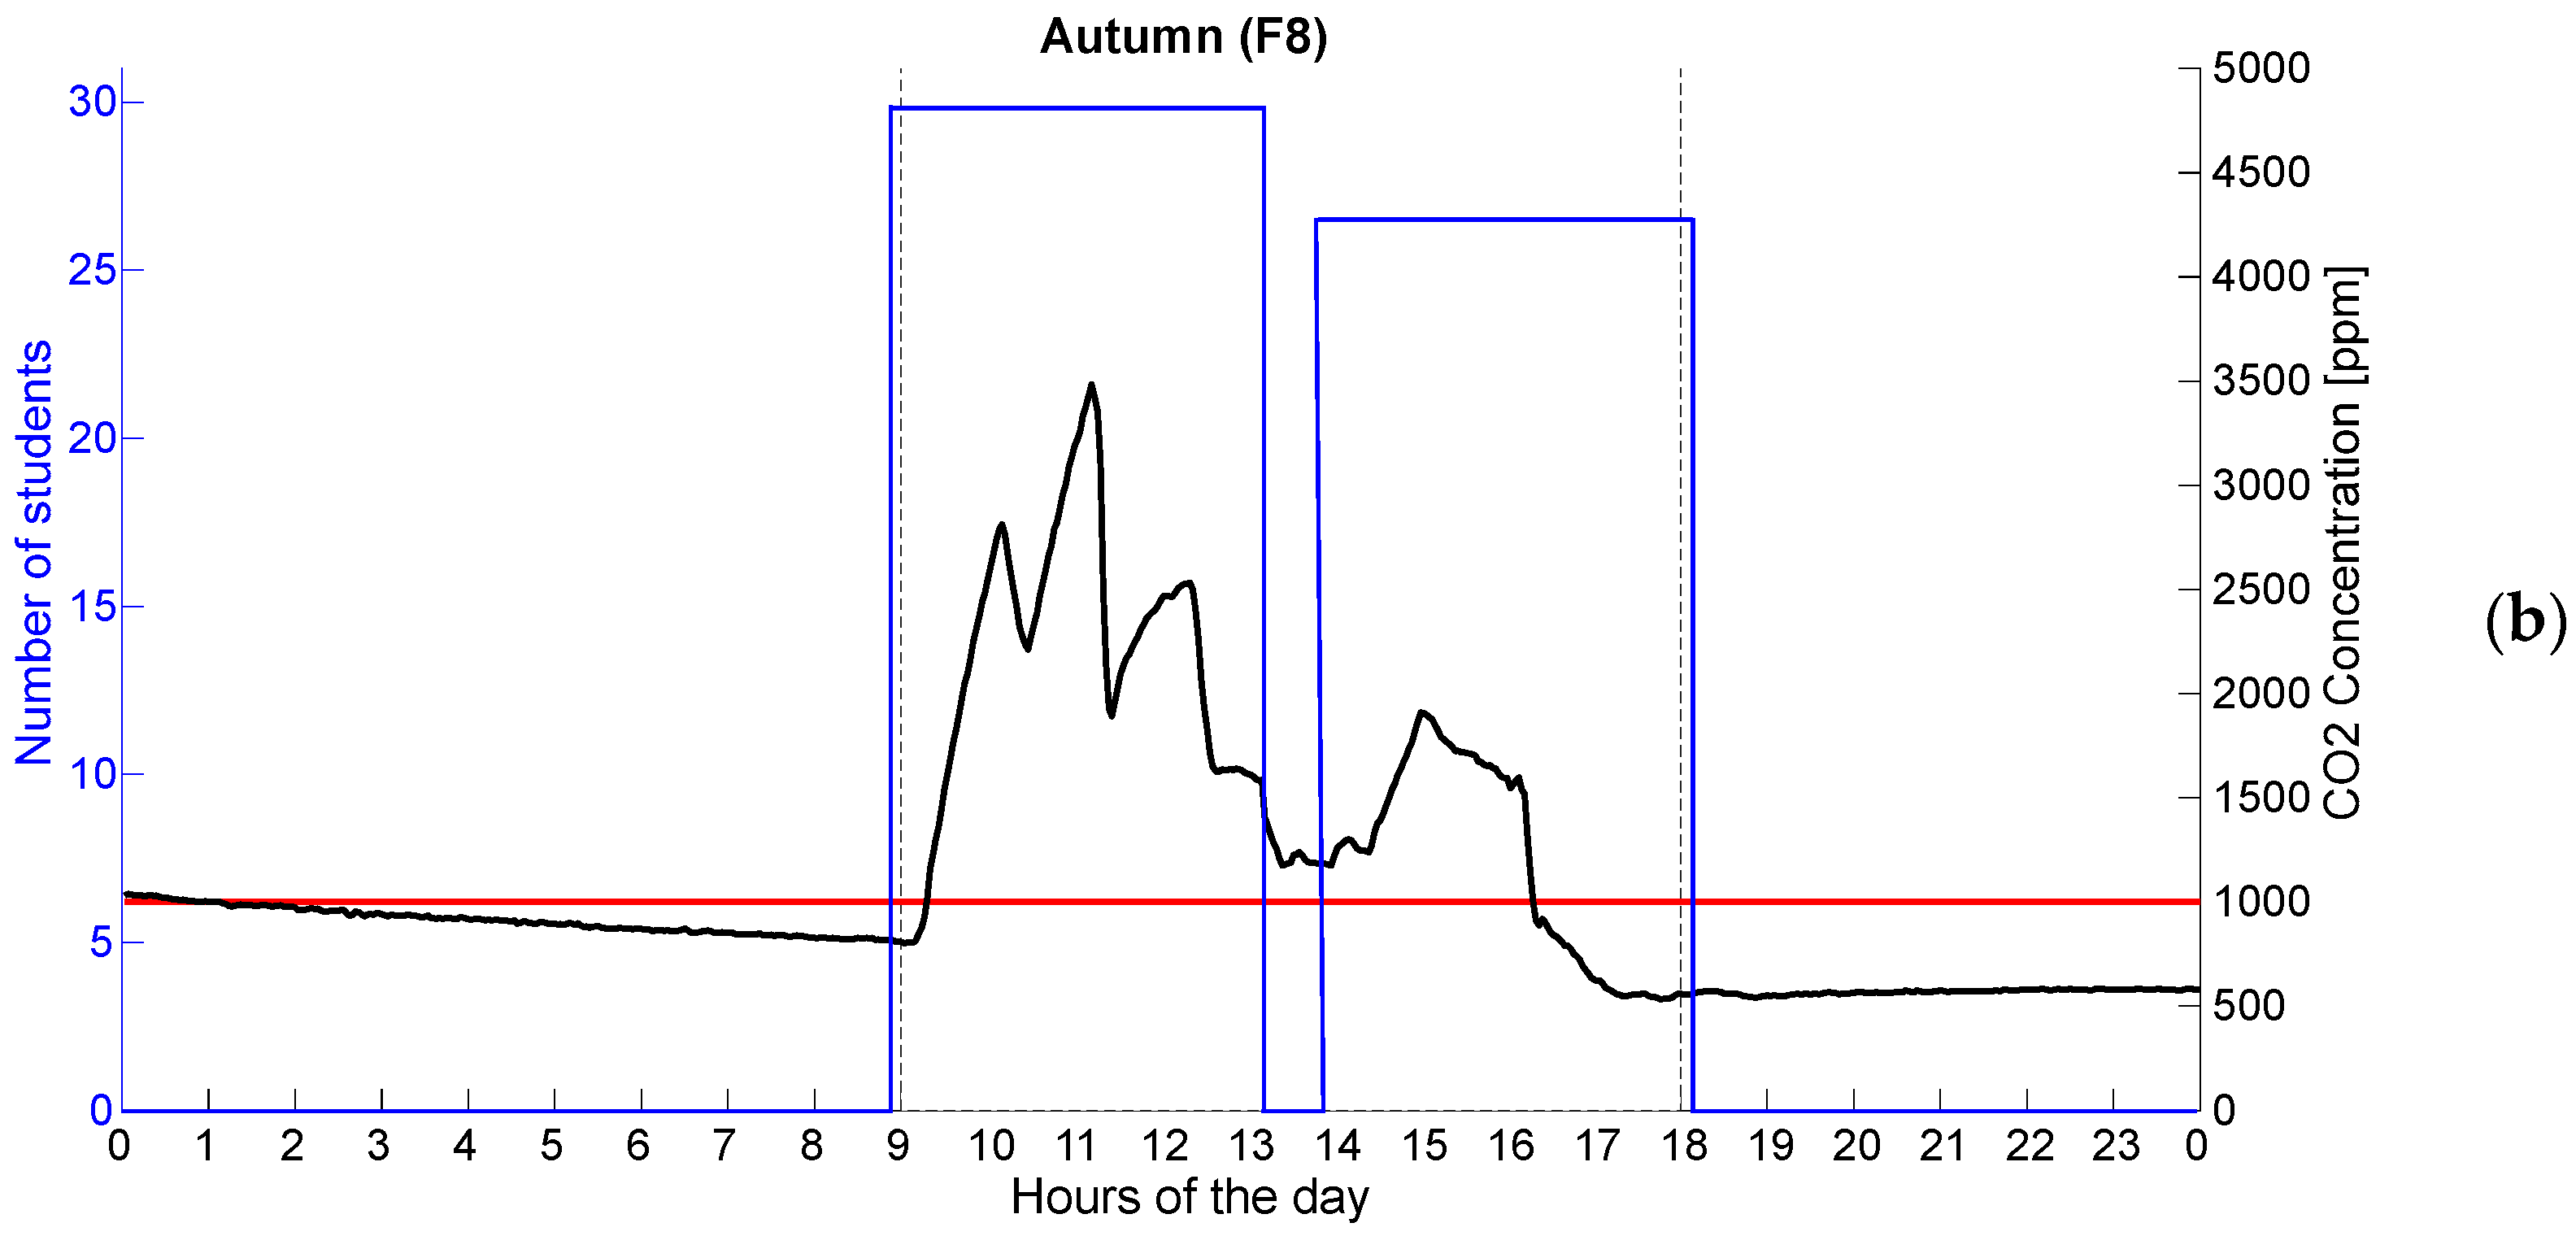
Figure 3a,b reports an example of the behavior of the CO2 concentration in one classroom in relation to the time intervals and the number of occupants. Qualitatively, the graphs compare CO2 concentration and student presence in a classroom during spring and autumn. In both cases, CO2 levels increase when students are present and decrease after they leave, highlighting the direct relationship between occupancy and indoor air quality. Anyway, even if it is true that when windows and doors were opened the CO2 concentration fell (in the break 1–2 pm), the concentration suddenly started increasing again when the openings were fully closed. Thus, the short-term manual airing periods were insufficient to maintain average CO2 concentrations below 1000 ppm, especially in autumn. This qualitative example is in line with the results reported in [13], also considering similar climate regions.
The red line represents a threshold beyond which CO2 levels may become critical, and in autumn, the concentration exceeds this limit more significantly than in spring.
Table 5 summarizes the mean, maximum, and minimum values (with standard deviations) for T, RH, and CO2 concentration in three rooms (F8, F9, and B1) across two seasons (spring and autumn), considering whole-day measurements.
During spring, the mean temperature ranged from 23.5 °C in F8 to 24.5 °C in B1, with maximum values reaching 27.5 °C in F9 and minimum values as low as 22.4 °C in F9. RH was generally lower in spring, with mean values between 32.7% (F9) and 36.5% (F8). Maximum RH peaked at 39.4% in F8, while minimum RH values went as low as 27.4% in F9. CO2 levels showed substantial variation, with mean concentrations highest in B1 (547.4 ppm) and lowest in F8 (492.0 ppm). Maximum CO2 levels peaked at 953.4 ppm in F9, whereas minimum values were consistent across rooms, with F9 recording the lowest minimum at 419.2 ppm. In autumn, temperatures were slightly lower, with mean values ranging from 21.0 °C in F8 to 22.9 °C in B1. Maximum temperatures reached 24.5 °C in B1, while minimum temperatures dropped to 19.1 °C in F8. Relative humidity was notably higher in autumn compared to spring, with mean values ranging between 49.4% (B1) and 51.6% (F8). Maximum RH reached 55.6% in F8, while minimum values were lowest at 46.0% in B1. CO2 concentrations exhibited a pronounced seasonal increase in autumn, particularly in F8, where the mean reached 1034.0 ppm with a maximum of 2324.2 ppm. In contrast, minimum CO2 levels across rooms remained comparable, with values between 457.0 ppm (B1) and 475.8 ppm (F9). Statistical differences between the two seasons were found for each mean parameter and for all the rooms, with p-values ranging from <0.01 and 0.04. Moving to the time interval analysis, no statistical differences were found, with all the ANOVA tests associated with p-values ranging from 0.10 to 0.85.
Overall, the results highlight seasonal variations, with higher CO2 concentrations and relative humidity observed in autumn and higher temperatures recorded during spring. The observed increase in RH and CO2 concentrations during the autumn season, compared to spring, can be attributed to several environmental and seasonal factors, as the effects induced by occupancy can be considered negligible since, during the survey period, the occupancy of each room remained similar, ranging consistently between 25 to 30 students. This stable occupancy ensures that variations in CO2 and RH levels are not influenced by differences in the number of occupants but rather by other external or environmental factors. Similar results have been reported in [11], where an increment of both CO2 concentration and RH has been found in the winter semester in comparison to the summer one when seeking to evaluate the indoor environment quality in Slovakian classrooms. The results are also consistent in terms of students’ occupancy that is comparable, as well as the use of only natural ventilation. Likewise, when compared different climates (Poland vs. Spain), the coolest region was found to be related to higher concentrations of carbon dioxide, revealing the influence of external temperature [12]. However, it is worth noting that in the reported study, the differences are significant, especially during the first hours of the day, whereas in our study no differences among hours were found. The increment in CO2 concentration is also in line with the results proposed in [13], where the analysis of indoor air quality has been conducted in primary school classrooms with natural ventilation and manual airing, as in this study. Data clearly highlight that students were exposed to high CO2 concentrations in the cooler season also in [13,14,26].
Focusing on the reasons, the rise in CO2 levels during autumn may be explained primarily by changes in ventilation practices, confirming the results presented in [5,10]. Cooler outdoor temperatures in autumn often result in reduced natural ventilation as windows and doors are kept closed to maintain indoor thermal comfort. Limited ventilation diminishes the air exchange rate, causing CO2 exhaled by occupants to accumulate indoors. Studies have shown that ventilation rates significantly influence indoor CO2 concentrations, with insufficient ventilation resulting in higher indoor CO2 levels, especially in occupied spaces. RH is also elevated during autumn due to a combination of seasonal and indoor factors. Cooler temperatures reduce the air’s capacity to hold moisture, causing a higher relative humidity for the same amount of water vapor present [27]. Additionally, reduced ventilation practices may trap moisture indoors, further contributing to elevated RH levels. Indoor sources of humidity, such as human respiration, can exacerbate the rise in RH in enclosed spaces. This phenomenon is supported by research highlighting the importance of ventilation in controlling indoor humidity, particularly during cooler seasons when natural ventilation is restricted [28]. Seasonal climatic differences further compound these indoor changes. In many climates, autumn is characterized by increased precipitation and cooler weather, which contribute to higher outdoor humidity levels [29]. This outdoor air, when introduced indoors via mechanical ventilation or infiltration, can raise indoor RH levels. Furthermore, it is worth highlighting that, as previously reported, the buildings have an east-to-northeast orientation, meaning that direct sunlight exposure is primarily limited to the morning hours. This orientation influences indoor thermal conditions, as classrooms receive solar radiation in the early hours but remain largely shaded in the afternoon. Consequently, natural heating effects from solar exposure are reduced later in the day, potentially affecting indoor temperature and humidity dynamics, particularly during colder months when ventilation practices are more restricted.
In summary, it is evident that relying solely on manual airing based on subjective physical perception or during the break is not sufficient to ensure minimum indoor air quality in university environments, especially during autumn when severe meteoclimatic conditions can worsen indoor air stagnation. However, this method might still be effective in milder conditions. Based on the findings, even in cases where mechanical ventilation systems cannot be implemented due to cost and structural constraints, it is crucial to adopt alternative solutions that facilitate effective ventilation during critical indoor air quality situations. The simplest and most cost-effective approach could involve establishing detailed window-opening protocols.
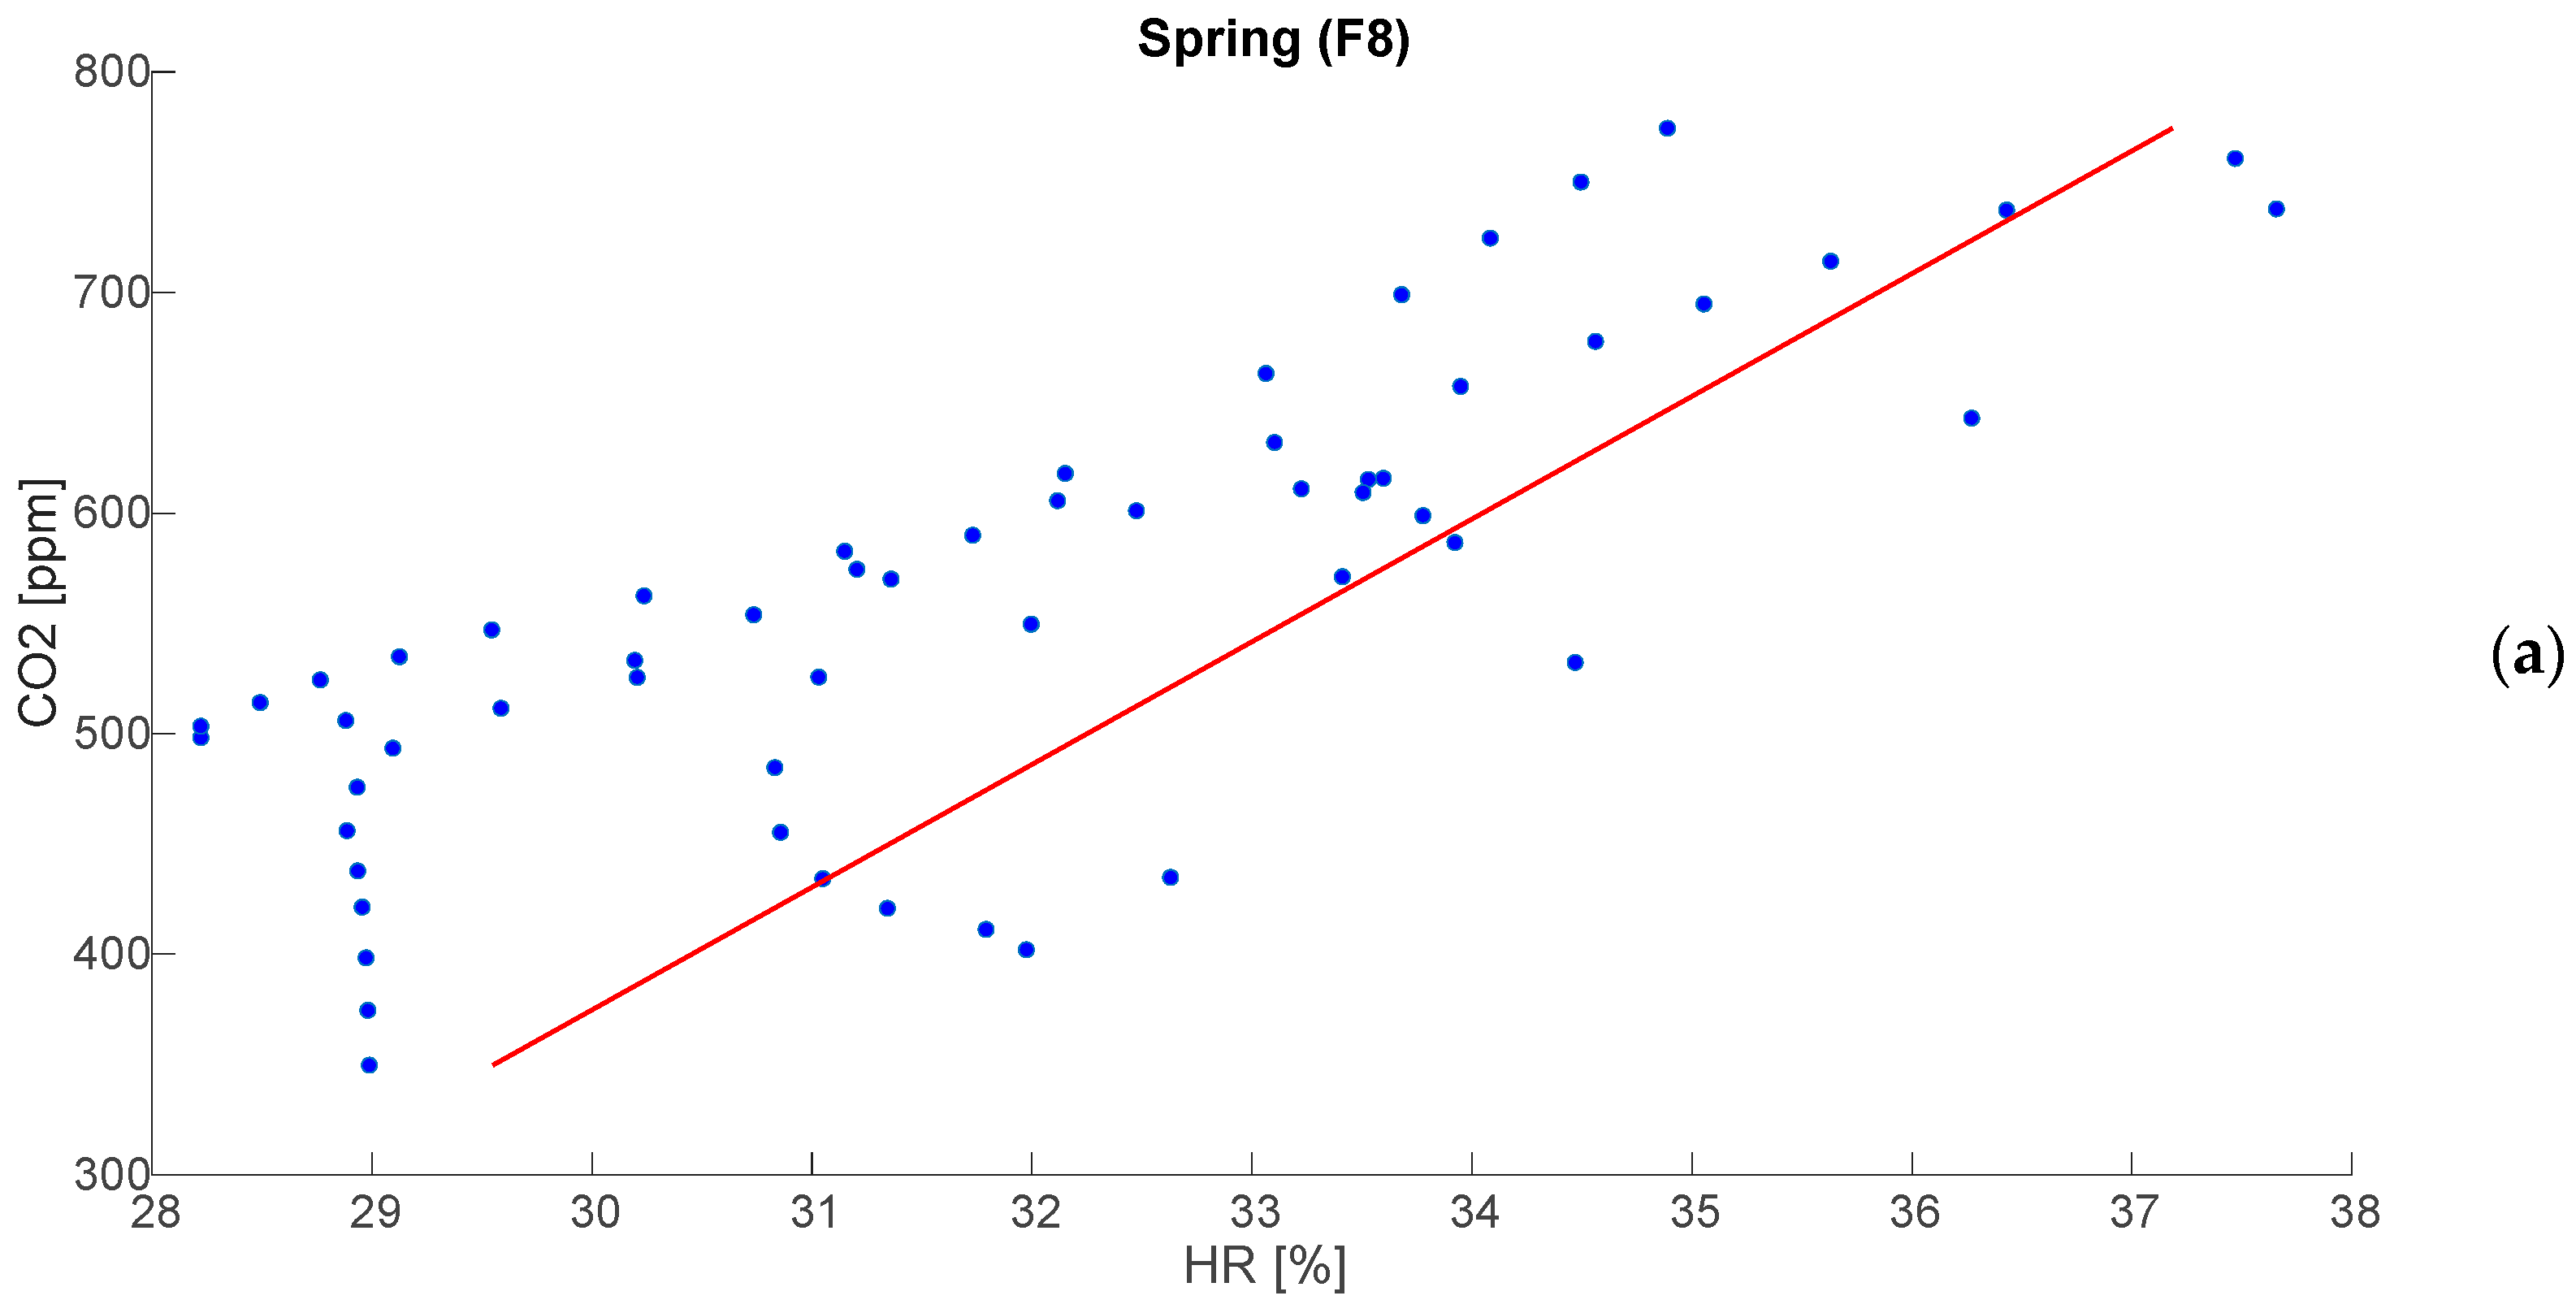
Figure 4a,b report an example of correlation betwenn CO2 and RH for classroom F8 in both tested seasons. Table 6 reports all the r values across seasons and classrooms.
The results indicate a consistently strong positive correlation in both seasons, with higher values in autumn (average around 0.90) compared to spring (average r around 0.84). These correlations are also always statistically significant, with a p-value consistently below 0.02. The relatively low standard deviation values (ranging from 0.02 to 0.05) suggest that the correlation remains stable across different measurements, reinforcing the reliability of this trend. The maximum values of r reaching up to 0.95 in autumn and 0.89 in spring indicate periods where the relationship between CO2 and RH is extremely strong, whereas the minimum values (down to 0.76 in spring) suggest occasional deviations, likely influenced by specific ventilation patterns or external environmental factors, mainly due to the opening of the windows.
By analyzing the overall results, there is a positive correlation between CO2 and RH, as also demonostred for poorly ventilated indoor environments in [20,21]. Specifically, Lazovic et al. [20] found a very strong correlation (greater than 0.80) in aschool with the lowest ventilation rate, due to only manual ventilation. Additionally, the found correlation is greater than the 0.60 found in the study proposed in [30], where a similar case study has been conducted focusing on only natural ventilation. This relationship arises because both parameters share common influencing factors. Human respiration is a significant source of both CO2 and water vapor, contributing simultaneously to increased concentrations of both variables in enclosed spaces. When ventilation is insufficient, these emissions accumulate, leading to a concurrent rise in CO2 and RH levels. Research has shown that in such conditions, elevated CO2 levels are often associated with higher RH due to the shared impact of limited air exchange [31]. This correlation underscores the importance of ventilation as a key factor in maintaining indoor air quality.
From a health and comfort perspective, the seasonal increase in both CO2 and RH levels has important implications. Elevated CO2 concentrations can lead to reduced cognitive performance, fatigue, and discomfort, particularly when exceeding 1000 ppm [7,8,32]. Similarly, higher RH levels can create favorable conditions for mold growth and dust mites, which can negatively impact indoor air quality and exacerbate respiratory conditions [33].
Therefore, the findings underscore the critical need for effective ventilation strategies and humidity control during autumn to maintain healthy and comfortable indoor environments. In fact, as also suggested by Norbäck et al. [21], the potential decline in learning capacity due to health issues triggered by poor indoor air quality in classrooms requires greater attention.

3.2. Thermal Comfort Analysis

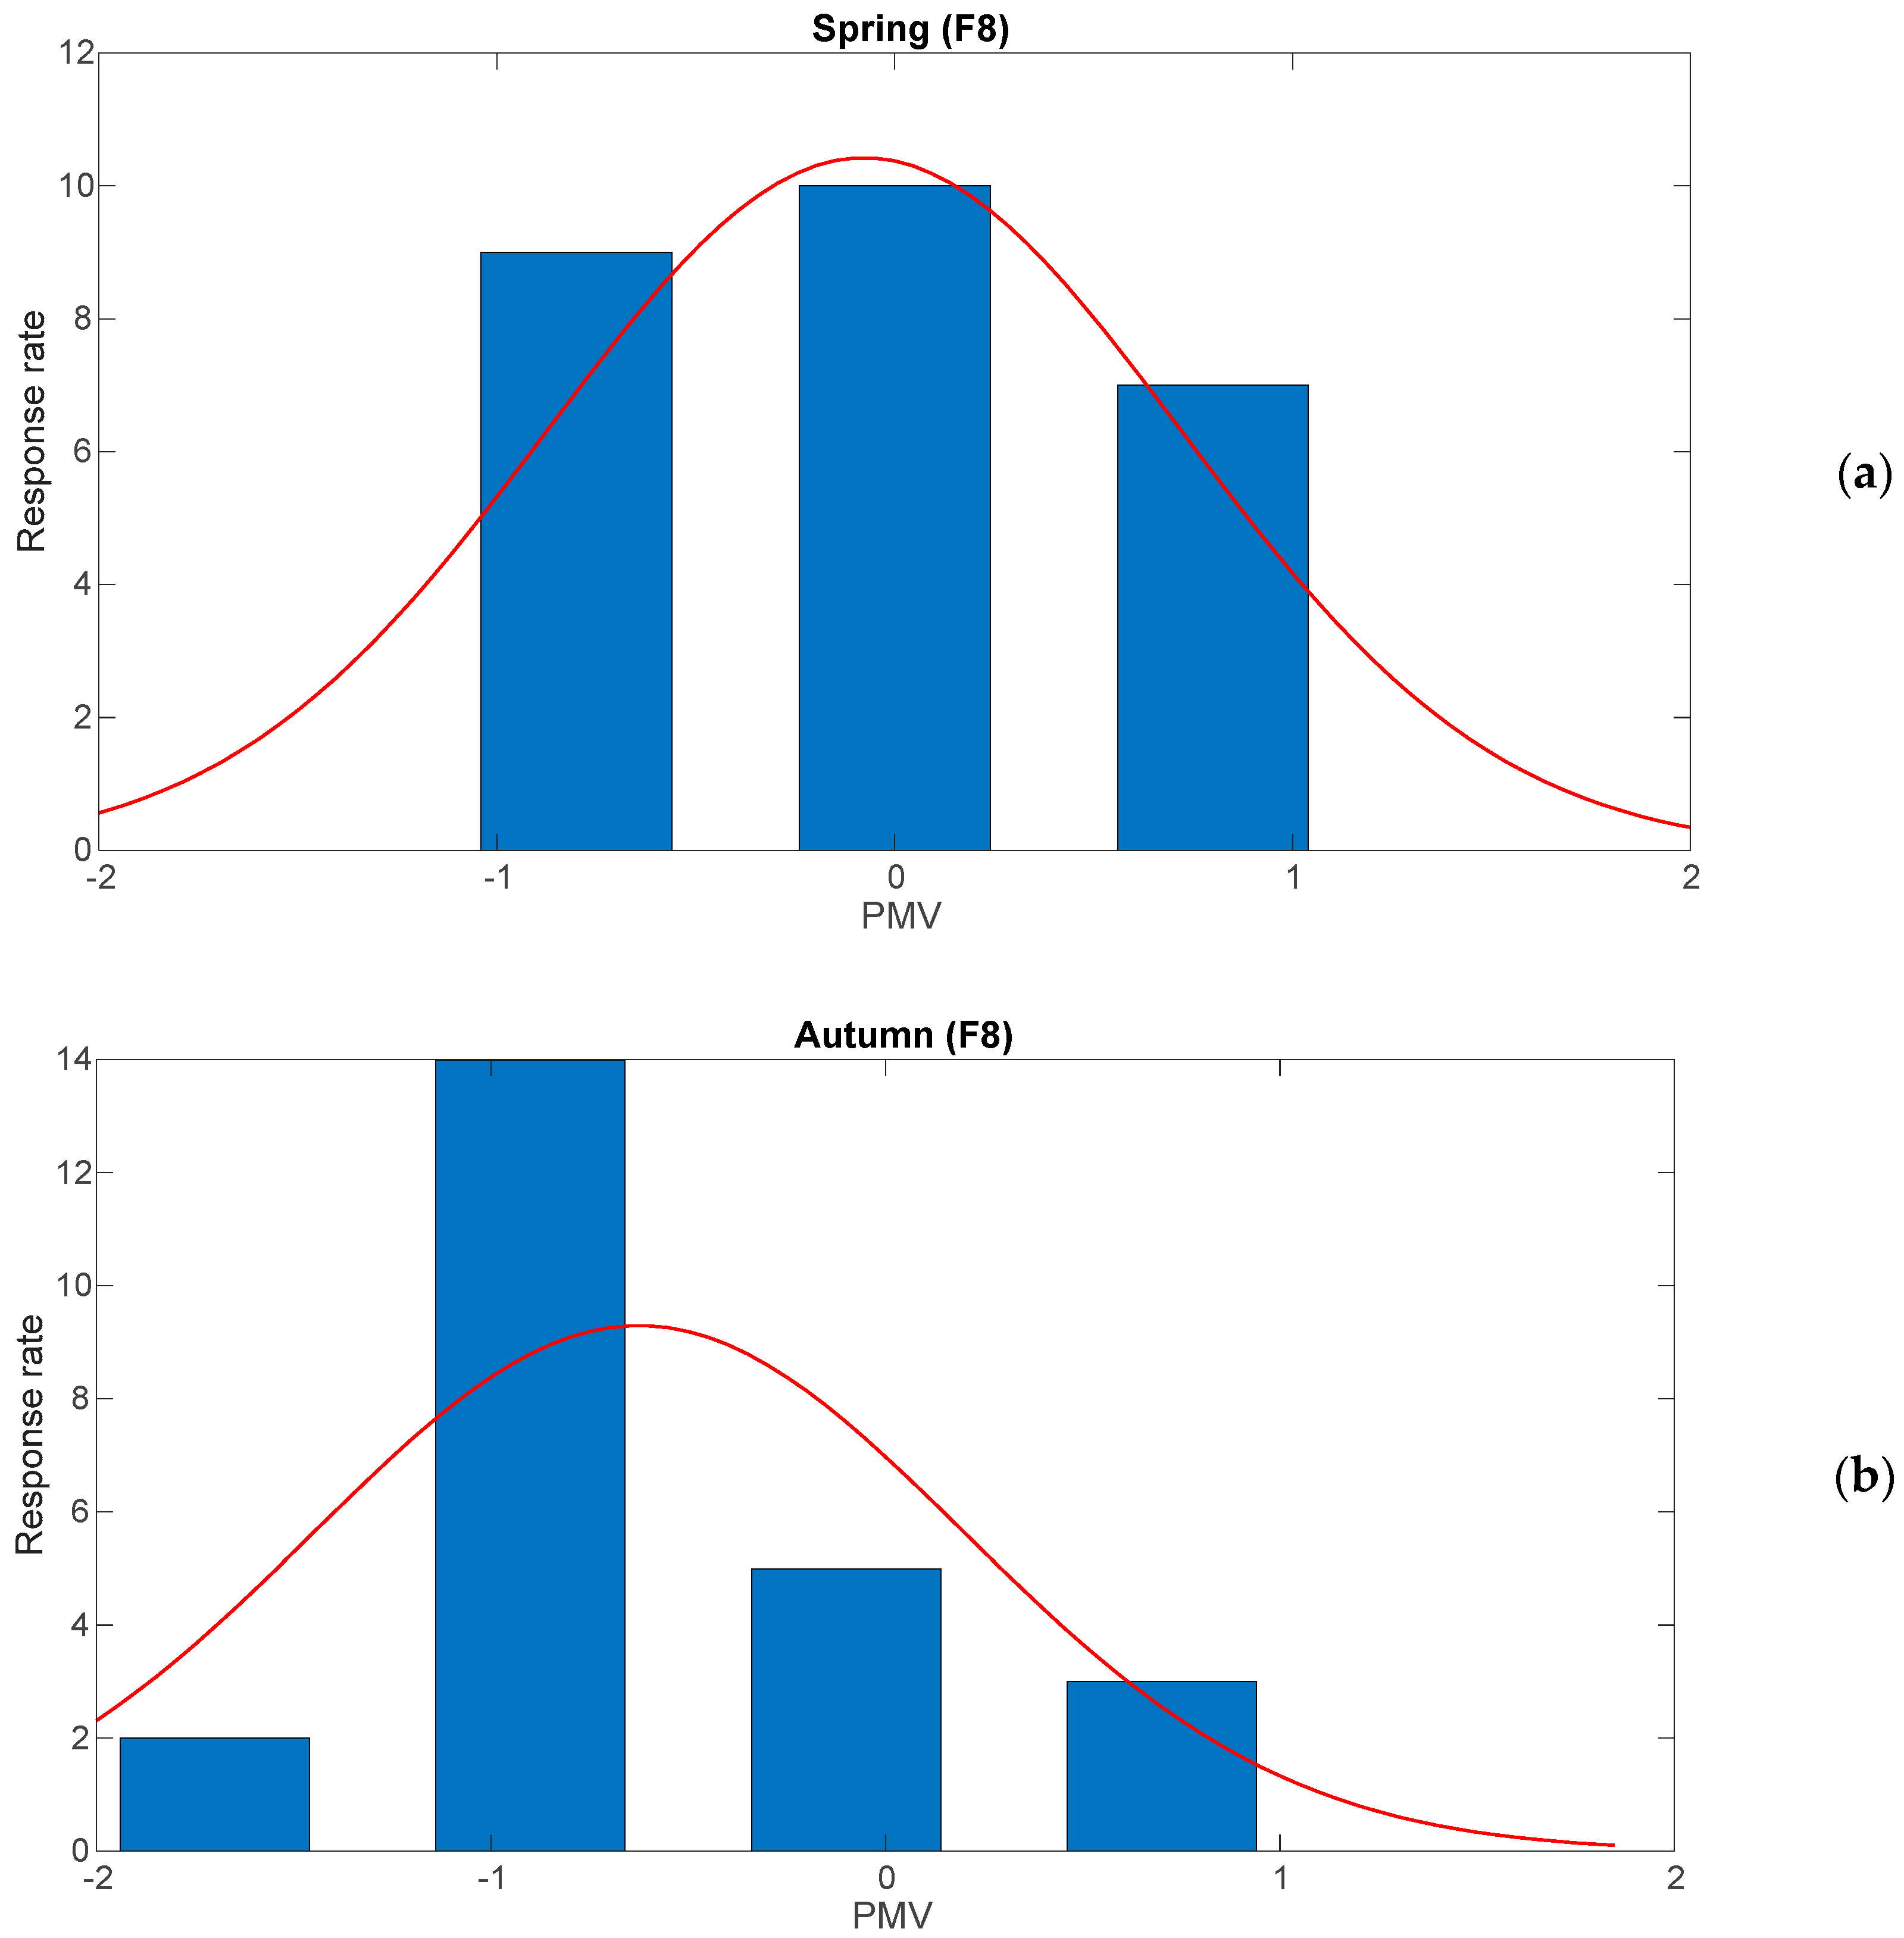
Considering the data acquired by the BABUC, it was possible to conduct the thermal comfort analysis through the computation of PMV and PPD. Figure 5a,b show an example of the PMV curves obtained in spring and autumn in F8. Generally, in spring, the PMV values exhibit a relatively balanced distribution around neutrality, with the majority of responses concentrated between −1 and +1. The highest frequency is observed at PMV = 0, indicating that most students experienced neutral thermal conditions. This suggests that indoor environmental parameters, such as temperature, humidity, and ventilation, were relatively well regulated, maintaining comfort within acceptable limits. The overall distribution in spring appears symmetric, with no extreme deviations toward discomfort levels. In contrast, in autumn, the PMV distribution shifts, with a notable increase in responses at PMV = −1 and a reduction at PMV = 0 and +1. This shift implies that a larger proportion of occupants perceived the classroom as slightly cool, potentially indicating lower indoor temperatures or differences in thermal insulation due to seasonal variations. The asymmetry in the autumn distribution suggests that a subset of students may have experienced mild thermal discomfort, likely due to inadequate heating or ventilation adjustments to compensate for external temperature changes.
Such results align with previous research indicating that classroom environments often face challenges in maintaining optimal thermal comfort due to varying metabolic rates, clothing insulation, and localized air distribution [34,35]. Overall, these results imply that students perceive a slight thermal discomfort in the classroom, though it is not significant enough to adversely affect the learning environment. However, the persistence of dissatisfaction under certain conditions emphasizes the need for further optimization of HVAC systems, such as improved ventilation, individualized control systems, or adaptive comfort measures, to enhance thermal comfort and support cognitive performance [36].
By considering both CO2 concentration analysis and thermal comfort results, the comparative analysis between the two seasons highlights the importance of adaptive thermal management strategies in educational environments. While conditions in spring seem to align more closely with optimal CO2 concentration and thermal comfort, autumn exhibits a trend toward cooler perceptions. Thus, the need is evident for targeted interventions, such as enhanced ventilation and humidity control, to mitigate indoor air quality challenges in cooler seasons.

3.3. Policy Implications and Recommendations

The findings of this study underscore the need for universities to adopt targeted strategies for maintaining optimal indoor environmental quality, particularly in response to seasonal variations in CO2 concentration and thermal comfort. In fact, given the observed increase in CO2 levels and relative humidity during autumn, institutions should prioritize enhanced ventilation strategies, such as a combination of natural and mechanical ventilation systems, to maintain air exchange rates within recommended thresholds. Implementing automated ventilation controls that adjust airflow based on real-time CO2 levels could help mitigate periods of poor air quality, especially in high-occupancy classrooms.
Additionally, real-time air quality monitoring systems should be integrated into classroom management practices. Displaying CO2 concentration levels in lecture halls through visual indicators can promote timely interventions, such as opening windows or adjusting mechanical ventilation settings. Universities should also establish policies that encourage regular ventilation breaks during lessons, particularly in colder months when natural ventilation is often reduced. From a long-term perspective, educational institutions should consider investing in advanced HVAC systems with demand-controlled ventilation (DCV) technology, which automatically adjusts airflow based on occupancy and air quality conditions. Future campus renovations and new building designs should incorporate these principles to ensure a healthier and more conducive learning environment. By implementing these recommendations, universities can significantly enhance indoor environmental quality, contributing to improved student concentration, well-being, and overall academic performance.

3.4. Limitations

While this study provides valuable insights into CO2 concentration and thermal comfort in university classrooms, some limitations should be acknowledged. First, the analysis focused exclusively on CO2 as an indicator of ventilation efficiency, without considering other air quality parameters such as particulate matter (PM), volatile organic compounds (VOCs), or other indoor pollutants that could further influence the learning environment. Additionally, this study was conducted within a single university in Italy, meaning the findings may not be fully generalizable to institutions in different climatic regions, building designs, or ventilation configurations. Future studies should explore similar analyses in a wider range of educational settings to enhance the applicability of the results.
Another limitation is the lack of direct cognitive performance assessments. While high CO2 levels have been linked to impaired cognitive abilities in previous literature, this study did not include objective measurements such as student test performance, concentration levels, or physiological indicators like heart rate variability. Incorporating such data in future research could provide stronger evidence of the impact of CO2 and thermal comfort on student well-being and academic performance. Lastly, the thermal comfort assessment was based on subjective self-reported data, which, despite being a widely used method, is inherently influenced by individual perception differences. A more comprehensive evaluation that integrates objective thermal indicators, such as skin temperature or metabolic rate, could offer a more accurate representation of students’ thermal comfort. Despite these limitations, this study provides a strong foundation for understanding seasonal variations in CO2 concentration and thermal comfort, highlighting the need for improved ventilation strategies in university classrooms.

4. Conclusions

This study provides valuable insights into the seasonal variations of CO2 concentration and thermal comfort in university classrooms, emphasizing the importance setoff setting appropriate ventilation strategies for indoor environmental quality. The results indicate that during autumn, reduced ventilation leads to a significant increase in CO2 levels, with peak values exceeding recommended thresholds. This, combined with higher relative humidity, suggests inadequate air exchange. In contrast, spring conditions allow for maintaining CO2 concentrations within safer limits and contributing to a more comfortable learning environment. A strong positive correlation between CO2 concentration and relative humidity was observed, reinforcing the role of ventilation in regulating indoor conditions. The findings demonstrate that ineffective ventilation not only leads to air stagnation but also increases humidity levels, which can further impact occupant comfort. The analysis of thermal comfort through the Predicted Mean Vote (PMV) index highlighted seasonal differences in perceived comfort, with students reporting slightly cooler sensations in autumn, likely due to temperature variations and heating system efficiency.
These findings underscore the need for targeted ventilation strategies that adapt to seasonal changes. Educational institutions should implement optimized ventilation protocols, combining natural and mechanical ventilation to maintain CO2 levels within recommended thresholds. Real-time air quality monitoring systems could provide valuable data to support dynamic ventilation adjustments, improving indoor conditions and enhancing student performance. Future research should further investigate the impact of CO2 exposure on cognitive function through direct performance assessments and physiological measurements. Additionally, expanding this study to different climatic regions and educational settings would provide a more comprehensive understanding of ventilation efficiency and its influence on indoor environmental quality. Exploring the integration of automated air exchange systems and advanced climate control technologies could lead to significant improvements in university classroom environments, fostering better health and learning outcomes for students.

Author Contributions

Conceptualization, G.C., M.S., S.R. and J.T.; methodology, A.C., M.S., S.R. and J.T.; software, A.F. and J.T.; formal analysis, A.F., M.S. and J.T.; investigation, A.F., A.C., M.S. and J.T.; resources, A.C. and G.C.; data curation, A.F., S.R. and J.T.; writing—original draft preparation, A.F. and J.T.; writing—review and editing, A.C., G.C., M.S., S.R. and J.T.; supervision, A.C., G.C., M.S., S.R. and J.T.; project administration, J.T.; funding acquisition, J.T. All authors have read and agreed to the published version of the manuscript.

Funding

This research was co-funded by European Union Committee within the Erasmus+ Programme 2023 Key Action 2: Cooperation Partnership in Higher Education (Agreement n. 2023-1-IT02-KA220-HED-000162181. P.I.: Dott. Juri Taborri). This publication reflects the views only of the authors, and the Commission cannot be held responsible for any use which may be made of the information contained therein.

Institutional Review Board Statement

Not applicable.

Informed Consent Statement

Not applicable.

Data Availability Statement

The dataset presented in this article are not readily available because the data are part of an ongoing European project. Requests to access the datasets should be directed to juri.taborri@unitus.it.

Conflicts of Interest

The authors declare no conflicts of interest.

References

  1. Ma, N.; Aviv, D.; Guo, H.; Braham, W.W. Measuring the Right Factors: A Review of Variables and Models for Thermal Comfort and Indoor Air Quality. Renew. Sustain. Energy Rev. 2021, 135, 110436. [Google Scholar] [CrossRef]
  2. Triantafyllou, A.G.; Zoras, S.; Evagelopoulos, V.; Garas, S. PM10, O3, CO Concentrations and Elemental Analysis of Airborne Particles in a School Building. Water Air Soil Pollut. Focus 2008, 8, 77–87. [Google Scholar] [CrossRef]
  3. Sadrizadeh, S.; Yao, R.; Yuan, F.; Awbi, H.; Bahnfleth, W.; Bi, Y.; Cao, G.; Croitoru, C.; de Dear, R.; Haghighat, F.; et al. Indoor Air Quality and Health in Schools: A Critical Review for Developing the Roadmap for the Future School Environment. J. Build. Eng. 2022, 57, 104908. [Google Scholar] [CrossRef]
  4. Brink, H.W.; Lechner, S.C.M.; Loomans, M.G.L.C.; Mobach, M.P.; Kort, H.S.M. Understanding How Indoor Environmental Classroom Conditions Influence Academic Performance in Higher Education. Facilities 2024, 42, 185–200. [Google Scholar] [CrossRef]
  5. Deng, S.; Lau, J. Seasonal Variations of Indoor Air Quality and Thermal Conditions and Their Correlations in 220 Classrooms in the Midwestern United States. Build. Environ. 2019, 157, 79–88. [Google Scholar] [CrossRef]
  6. Zhang, S.; Chen, Y.; Li, Y.; Yi, X.; Wu, J. Study on Air Quality and Its Annual Fluctuation in China Based on Cluster Analysis. Int. J. Environ. Res. Public Health 2022, 19, 4524. [Google Scholar] [CrossRef] [PubMed]
  7. Guo, M.; Yu, W.; Sun, Y.; Wang, L.; Zhou, H.; Zhang, Y. Effects of Increasing Indoor Negative Air Ions on Cognitive Performance and Health of High Pure CO2 Level-Exposed College Students. Indoor Air 2023, 2023, 8298339. [Google Scholar] [CrossRef]
  8. Cao, X.; Li, P.; Zhang, J.; Pang, L. Associations of Human Cognitive Abilities with Elevated Carbon Dioxide Concentrations in an Enclosed Chamber. Atmosphere 2022, 13, 891. [Google Scholar] [CrossRef]
  9. Hui, P.S.; Wong, L.T.; Mui, K.W. Using Carbon Dioxide Concentration to Assess Indoor Air Quality in Offices. Indoor Built Environ. 2008, 17, 213–219. [Google Scholar] [CrossRef]
  10. Korsavi, S.S.; Montazami, A.; Mumovic, D. Indoor Air Quality (IAQ) in Naturally-Ventilated Primary Schools in the UK: Occupant-Related Factors. Build. Environ. 2020, 180, 106992. [Google Scholar] [CrossRef]
  11. Vilčeková, S.; Kapalo, P.; Mečiarová, Ľ.; Burdová, E.K.; Imreczeová, V. Investigation of Indoor Environment Quality in Classroom—Case Study. Procedia Eng. 2017, 190, 496–503. [Google Scholar] [CrossRef]
  12. Krawczyk, D.A.; Rodero, A.; Gładyszewska-Fiedoruk, K.; Gajewski, A. CO2 Concentration in Naturally Ventilated Classrooms Located in Different Climates—Measurements and Simulations. Energy Build. 2016, 129, 491–498. [Google Scholar] [CrossRef]
  13. Stabile, L.; Dell’Isola, M.; Frattolillo, A.; Massimo, A.; Russi, A. Effect of Natural Ventilation and Manual Airing on Indoor Air Quality in Naturally Ventilated Italian Classrooms. Build. Environ. 2016, 98, 180–189. [Google Scholar] [CrossRef]
  14. Heudorf, U.; Neitzert, V.; Spark, J. Particulate Matter and Carbon Dioxide in Classrooms—The Impact of Cleaning and Ventilation. Int. J. Hyg. Environ. Health 2009, 212, 45–55. [Google Scholar] [CrossRef] [PubMed]
  15. Liu, C.; Zhang, Y.; Sun, L.; Gao, W.; Jing, X.; Ye, W. Influence of Indoor Air Temperature and Relative Humidity on Learning Performance of Undergraduates. Case Stud. Therm. Eng. 2021, 28, 101458. [Google Scholar] [CrossRef]
  16. Wargocki, P.; Porras-Salazar, J.A.; Contreras-Espinoza, S. The Relationship between Classroom Temperature and Children’s Performance in School. Build. Environ. 2019, 157, 197–204. [Google Scholar] [CrossRef]
  17. Carvalho, J.P.; Barroso, B.I.L.; Da Silva, L.B.; Neves, A.I.A.; Torres, M.G.L.; Falcão, C.A.; Siqueira, J.C.F.; Souza, A.G.L.; Souza, E.L.; Da Silva, J.F. Students’ Blood Pressure and Heart Rate in Learning Environments with Thermal Changes. Int. J. Occup. Environ. Saf. 2018, 2, 29–37. [Google Scholar] [CrossRef]
  18. Brink, H.W.; Loomans, M.G.L.C.; Mobach, M.P.; Kort, H.S.M. Classrooms’ Indoor Environmental Conditions Affecting the Academic Achievement of Students and Teachers in Higher Education: A Systematic Literature Review. Indoor Air 2021, 31, 405–425. [Google Scholar] [CrossRef]
  19. Barbic, F.; Minonzio, M.; Cairo, B.; Shiffer, D.; Dipasquale, A.; Cerina, L.; Vatteroni, A.; Urechie, V.; Verzeletti, P.; Badilini, F.; et al. Effects of Different Classroom Temperatures on Cardiac Autonomic Control and Cognitive Performances in Undergraduate Students. Physiol. Meas. 2019, 40, 054005. [Google Scholar] [CrossRef]
  20. Lazovic, I.; Stevanovic, Z.; Jovasevic-Stojanovic, M.; Zivkovic, M.; Banjac, M. Impact of CO2 Concentration on Indoor Air Quality and Correlation with Relative Humidity and Indoor Air Temperature in School Buildings in Serbia. Therm. Sci. 2016, 20, 297–307. [Google Scholar] [CrossRef]
  21. Norbäck, D.; Nordström, K. Sick Building Syndrome in Relation to Air Exchange Rate, CO2, Room Temperature and Relative Air Humidity in University Computer Classrooms: An Experimental Study. Int. Arch. Occup. Environ. Health 2008, 82, 21–30. [Google Scholar] [CrossRef] [PubMed]
  22. Szczurek, A.; Maciejewska, M.; Pietrucha, T. Occupancy Determination Based on Time Series of CO2 Concentration, Temperature and Relative Humidity. Energy Build. 2017, 147, 142–154. [Google Scholar] [CrossRef]
  23. Wargocki, P.; Wyon, D.P. The Effects of Outdoor Air Supply Rate and Supply Air Filter Condition in Classrooms on the Performance of Schoolwork by Children (RP-1257). HVAC&R Res. 2007, 13, 165–191. [Google Scholar] [CrossRef]
  24. Zelinka, J. Microclimatic Research in the Slovakian Show Caves. Acta Carsolog. 2016, 31, 163. [Google Scholar] [CrossRef]
  25. Buratti, C.; Ricciardi, P. Adaptive Analysis of Thermal Comfort in University Classrooms: Correlation between Experimental Data and Mathematical Models. Build. Environ. 2009, 44, 674–687. [Google Scholar] [CrossRef]
  26. Stabile, L.; Frattolillo, A.; Dell’Isola, M.; Massimo, A.; Russi, A. Air Permeability of Naturally Ventilated Italian Classrooms. Energy Procedia 2015, 78, 3150–3155. [Google Scholar] [CrossRef]
  27. Paull, R.E. Effect of Temperature and Relative Humidity on Fresh Commodity Quality. Postharvest Biol. Technol. 1999, 15, 263–277. [Google Scholar] [CrossRef]
  28. Kuang, W. Seasonal Variation in Air Temperature and Relative Humidity on Building Areas and in Green Spaces in Beijing, China. Chin. Geogr. Sci. 2020, 30, 75–88. [Google Scholar] [CrossRef]
  29. Lu, E.; Zeng, X. Understanding Different Precipitation Seasonality Regimes from Water Vapor and Temperature Fields: Case Studies. Geophys. Res. Lett. 2005, 32, L22707. [Google Scholar] [CrossRef]
  30. Gładyszewska-Fiedoruk, K. Correlations of Air Humidity and Carbon Dioxide Concentration in the Kindergarten. Energy Build. 2013, 62, 45–50. [Google Scholar] [CrossRef]
  31. Hou, J.; Sun, Y.; Dai, X.; Liu, J.; Shen, X.; Tan, H.; Yin, H.; Huang, K.; Gao, Y.; Lai, D.; et al. Associations of Indoor Carbon Dioxide Concentrations, Air Temperature, and Humidity with Perceived Air Quality and Sick Building Syndrome Symptoms in Chinese Homes. Indoor Air 2021, 31, 1018–1028. [Google Scholar] [CrossRef] [PubMed]
  32. Wolkoff, P.; Azuma, K.; Carrer, P. Health, Work Performance, and Risk of Infection in Office-like Environments: The Role of Indoor Temperature, Air Humidity, and Ventilation. Int. J. Hyg. Environ. Health 2021, 233, 113709. [Google Scholar] [CrossRef] [PubMed]
  33. Hurraß, J.; Nowak, D.; Heinzow, B.; Joest, M.; Stemler, J.; Wiesmüller, G.A. Indoor Mold. Dtsch. Arztebl. Int. 2024, 121, 265–271. [Google Scholar] [CrossRef] [PubMed]
  34. Luo, M.; Wang, Z.; Ke, K.; Cao, B.; Zhai, Y.; Zhou, X. Human Metabolic Rate and Thermal Comfort in Buildings: The Problem and Challenge. Build. Environ. 2018, 131, 44–52. [Google Scholar] [CrossRef]
  35. Corgnati, S.P.; Filippi, M.; Viazzo, S. Perception of the Thermal Environment in High School and University Classrooms: Subjective Preferences and Thermal Comfort. Build. Environ. 2007, 42, 951–959. [Google Scholar] [CrossRef]
  36. Guevara, G.; Soriano, G.; Mino-Rodriguez, I. Thermal Comfort in University Classrooms: An Experimental Study in the Tropics. Build. Environ. 2021, 187, 107430. [Google Scholar] [CrossRef]
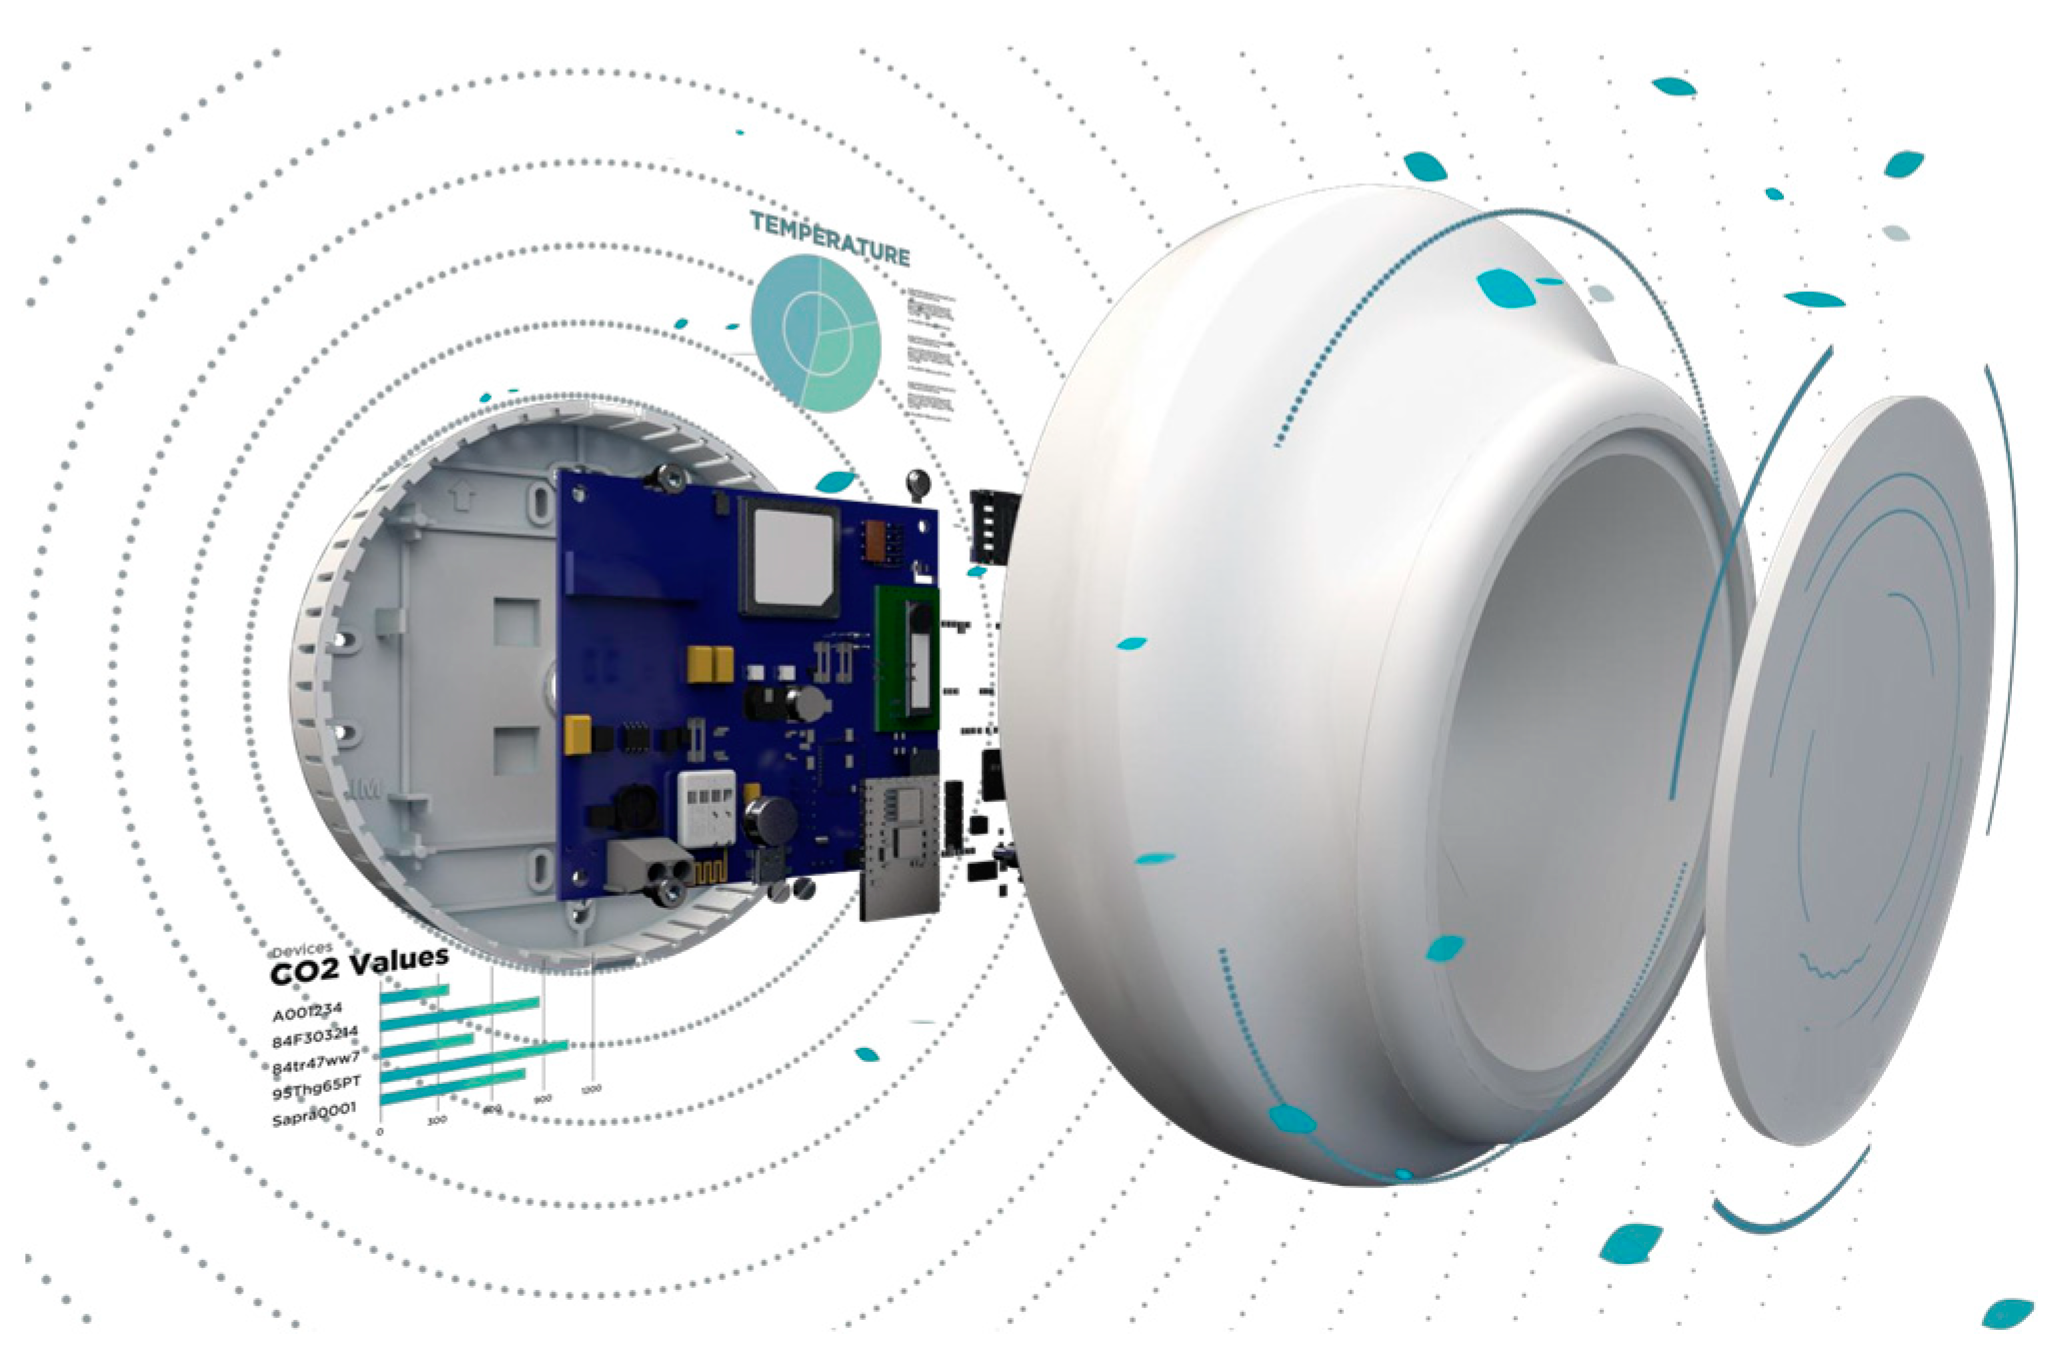
Figure 1. Structure of the NDIR sensor.
Sensors 25 01970 g001
Figure 2. (a) overall BABUC system for microclimate assessment; (b) hot-wire anemometer; (c) psychrometer; and (d) globe thermometer.
Sensors 25 01970 g002aSensors 25 01970 g002b
Figure 3. Example of the trend of CO2 concentration in F8 during spring (a) and autumn (b). Solid red, black and blue lines represent the CO2 threshold, the trend of CO2 and the number of occupants, respectively. Dotted black line indicates the tested time intervals.
Sensors 25 01970 g003aSensors 25 01970 g003b
Figure 4. Example of correlation between CO2 concentration and RH in F8 during spring (a) and autumn (b). Blue points represent the data, whereas the solid red line is the regression line.
Sensors 25 01970 g004aSensors 25 01970 g004b
Figure 5. Example of PMV in F8 during spring (a) and autumn (b).
Sensors 25 01970 g005
Table 1. Metrological characteristics of Fybra sensors.
VariableMeasurement RangeAccuracyRepeatabilityResponse Time
CO20–40,000 ppm±(40 ppm + 5% reading error)±10 ppm60 s
RH0–100%RH±9%RH±0.4%RH90 s
T−10–60 °C±1.5 °C±0.4 °C120 s
Table 2. Metrological characteristics of the BABUC system.
SensorOperative RangeAccuracy
Hot-wire anemometer0–50 m/s±0.05 m/s
Globe thermometer−50–100 °C±0.17 °C
Psychrometer−50–150 °C±0.13 °C
40–100%RH±2%RH
Table 3. Students’ occupancy during case study and demographic information.
SeasonAvg.
Occupancy
Max
Occupancy
Gender (%Male/%Female)Avg. Height
(m)
Avg. Body Mass
(kg)
Avg
Age
(y.o.)
F8Spring273070/30174 ± 771 ± 1222 ± 3
Autumn263070/30174 ± 771 ± 1222 ± 2
F9Spring232775/25173 ± 772 ± 1022 ± 2
Autumn232877/23172 ± 673 ± 1022 ± 2
B1Spring293065/35175 ± 768 ± 1125 ± 1
Autumn283064/36176 ± 871 ± 1125 ± 2
Table 4. Seven-point thermal sensation scale.
PMVThermal Sensation
+3Very warm
+2Warm
+1Slightly warm
0Neutral
−1Slightly cold
−2Cold
−3Very cold
Table 5. Mean (SD) of the mean, maximum and minimum value of temperature (T), relative humidity (RH) and CO2 concentration for each room, considering the whole day, divided for the two seasons. * indicates statistical differences between seasons.
F8F9B1
MeanMaxMinMeanMaxMinMeanMaxMin
SPRINGT
(°C)
23.5 *
(0.8)
24.6
(1.3)
22.6
(1.1)
23.9 *
(0.9)
27.5
(4.0)
22.4
(1.1)
24.5 *
(0.7)
25.6
(0.9)
23.4
(0.6)
RH
(%)
36.5 *
(2.1)
39.4
(2.7)
32.7
(3.7)
32.7 *
(1.8)
37.2
(2.6)
27.4
(3.7)
34.1 *
(3.0)
38.1
(3.8)
30.3
(4.3)
CO2 (ppm)492.0 * (62.4)729.8
(280.1)
422.71 (33.8)503.0 *
(36.3)
953.4
(286.7)
419.2
(12.6)
547.4 *
(84.6)
934.6
(200.1)
425.5
(32.0)
AUTUMNT
(°C)
21.0 *
(1.1)
24.0
(1.0)
19.1
(1.5)
21.5 *
(0.9)
23.5
(0.5)
20.4
(1.0)
22.9 *
(1.3)
24.5
(2.1)
20.9
(2.5)
RH
(%)
51.6 *
(5.3)
55.6
(6.5)
47.1
(6.6)
50.0 *
(4.0)
51.8
(4.8)
47.0
(4.4)
49.4 *
(3.9)
54.2
(4.2)
46.0
(4.7)
CO2 (ppm)1034.0 * (153.9)2324.2
(524.0)
457.2
(51.7)
664.4 *
(92.1)
1419.6
(224.5)
475.8
(84.5)
702.8 *
(92.5)
1399.4
(91.9)
457.0
(22.1)
Table 6. Correlation values between RH and CO2 concentration.
r-Value
SeasonMeanSTDMinMax
F8Spring0.840.030.780.89
Autumn0.900.040.850.95
F9Spring0.850.020.800.88
Autumn0.910.030.870.94
B1Spring0.830.040.760.88
Autumn0.890.050.830.93
Disclaimer/Publisher’s Note: The statements, opinions and data contained in all publications are solely those of the individual author(s) and contributor(s) and not of MDPI and/or the editor(s). MDPI and/or the editor(s) disclaim responsibility for any injury to people or property resulting from any ideas, methods, instructions or products referred to in the content.