
A Non-Contact Method for Detecting and Evaluating the Non-Motor Use of Sidewalks Based on Three-Dimensional Pavement Morphology Analysis


Abstract
1. Introduction
1.1. Background
1.2. Related Work
2. Methodology
2.1. Data Acquisition
2.2. Construction of Surface Morphology Metrics
2.3. Correlation Analysis
2.4. Hierarchical Regression Model Construction
3. Results and Discussion
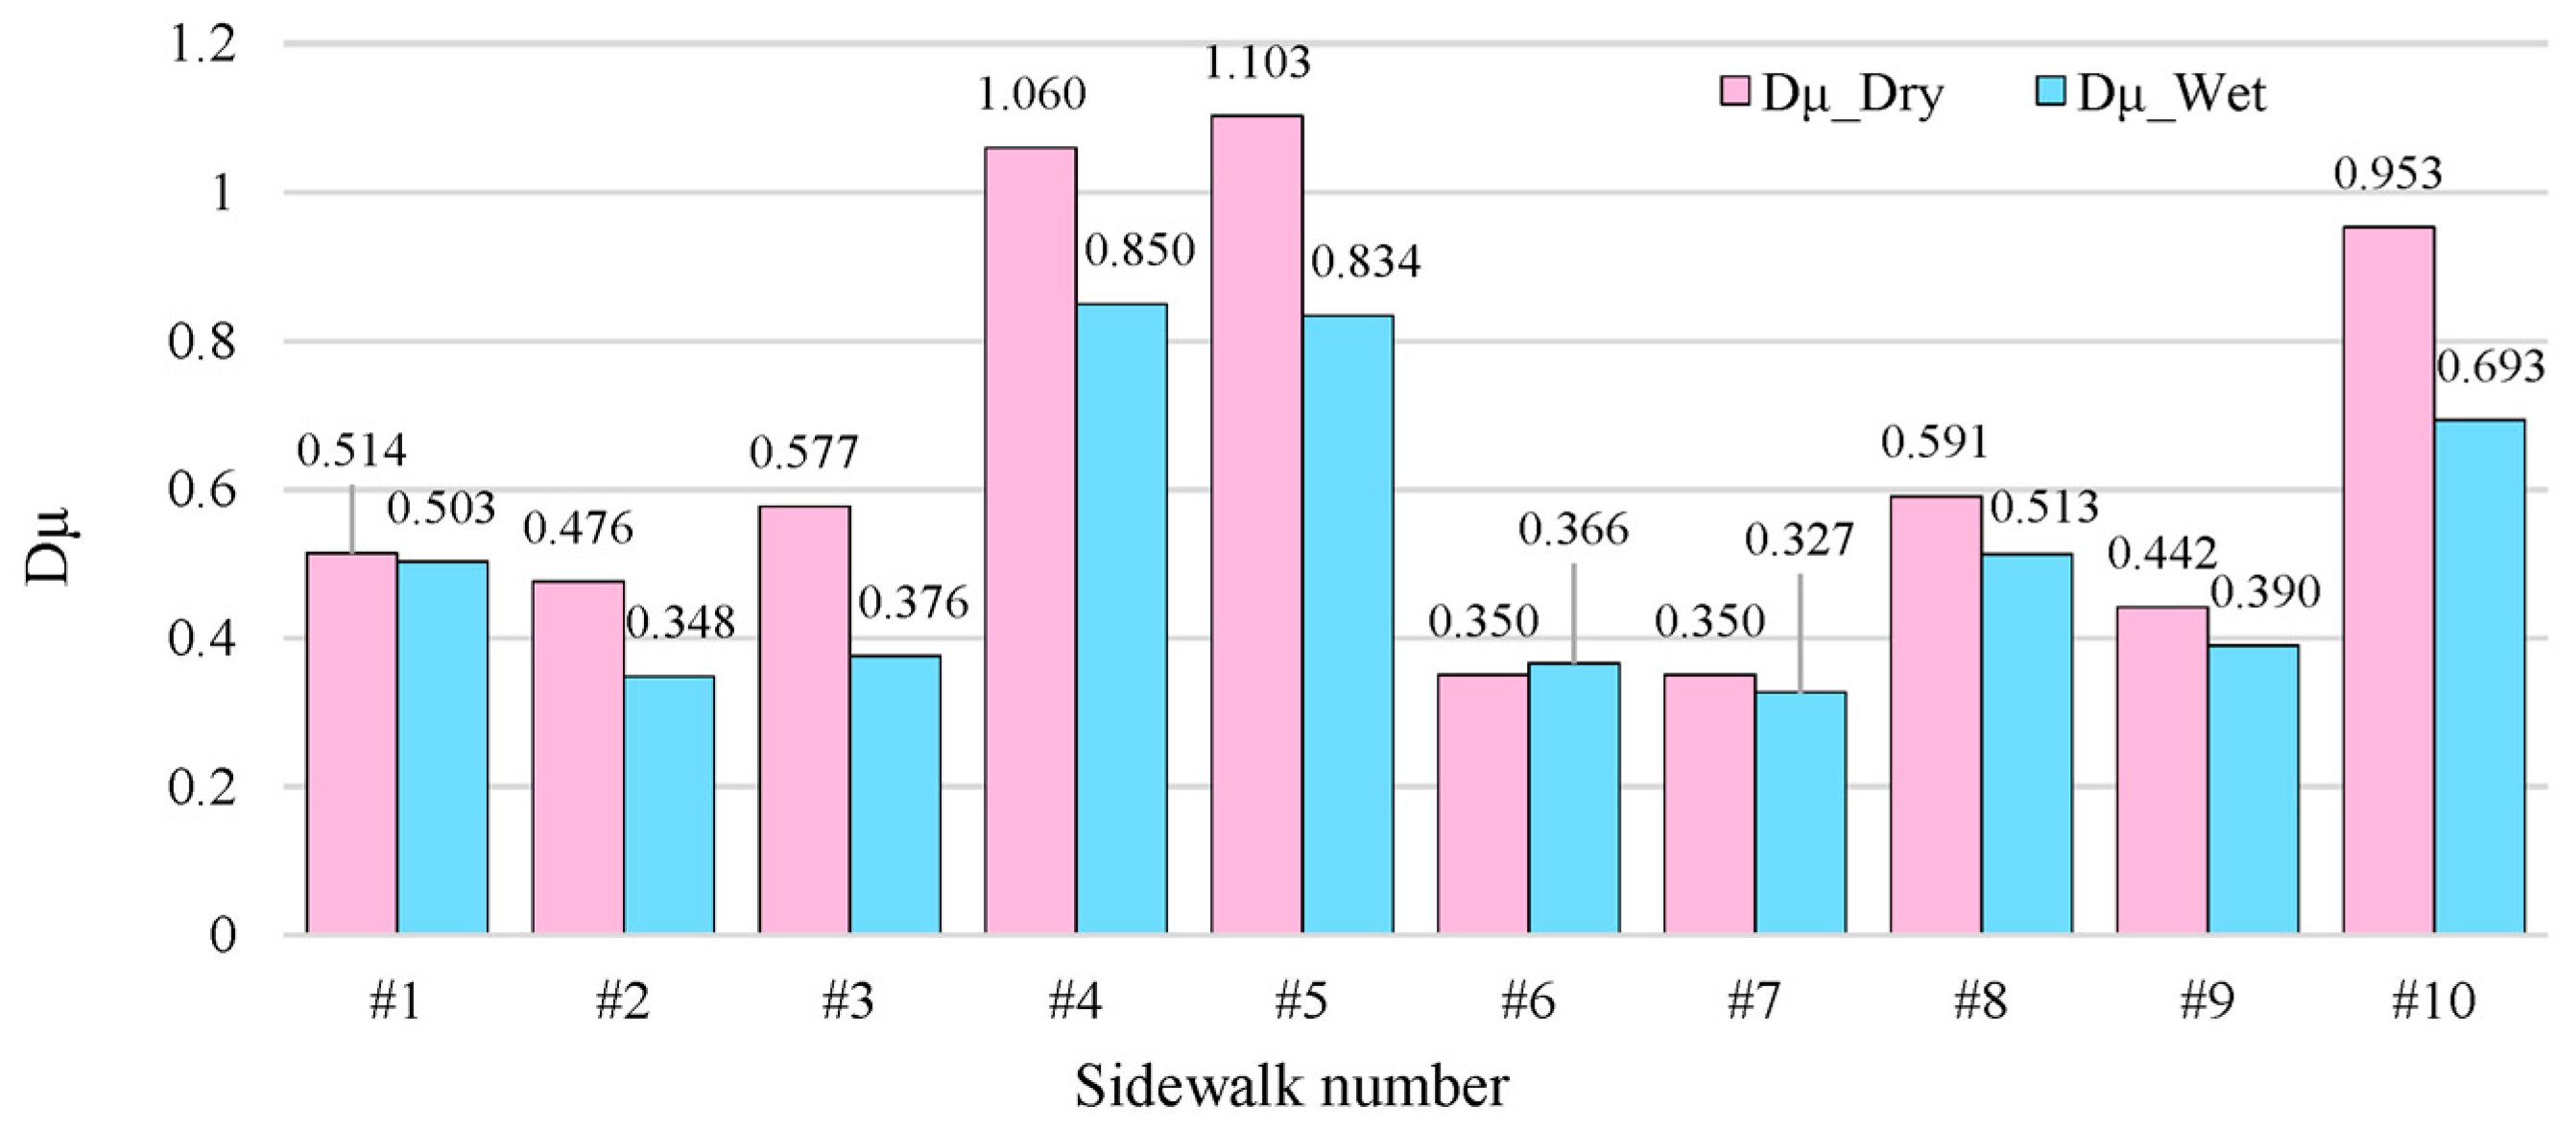
3.1. Friction Coefficient Results
3.2. Surface Morphology Index Results
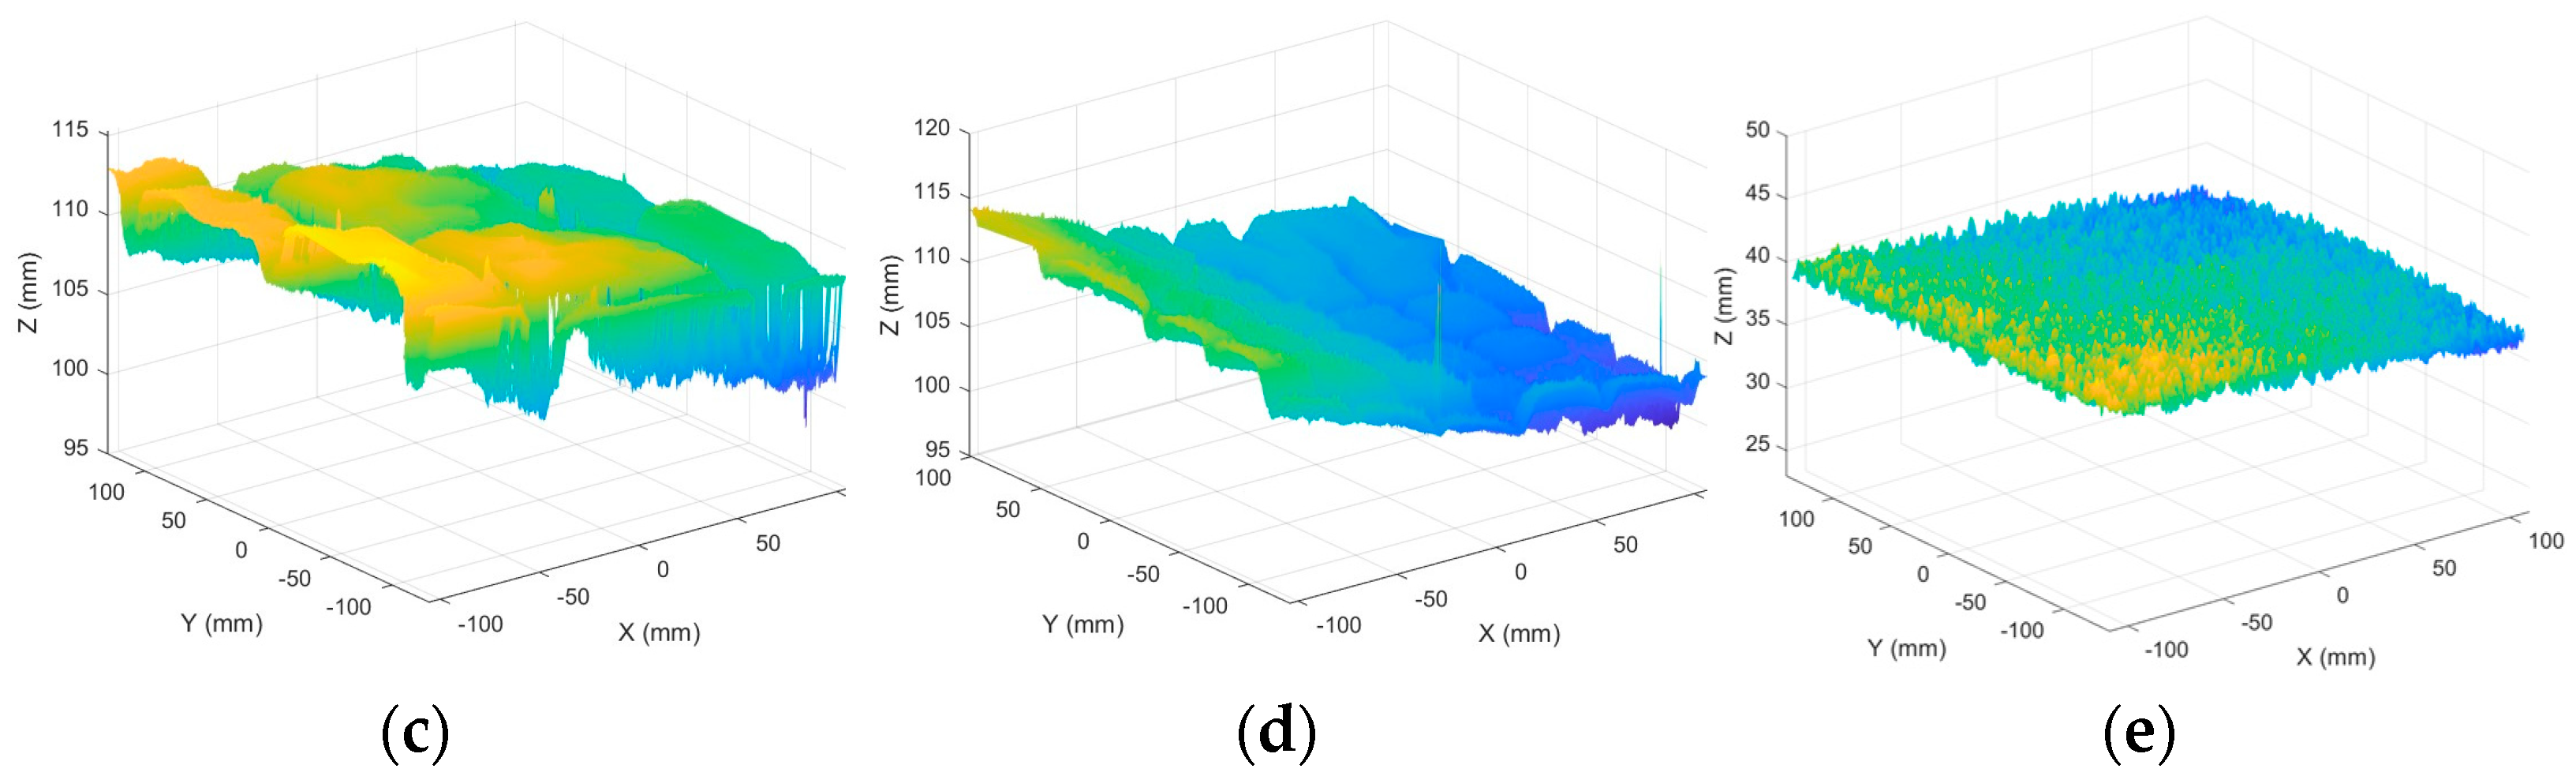
3.2.1. Surface Texture Results
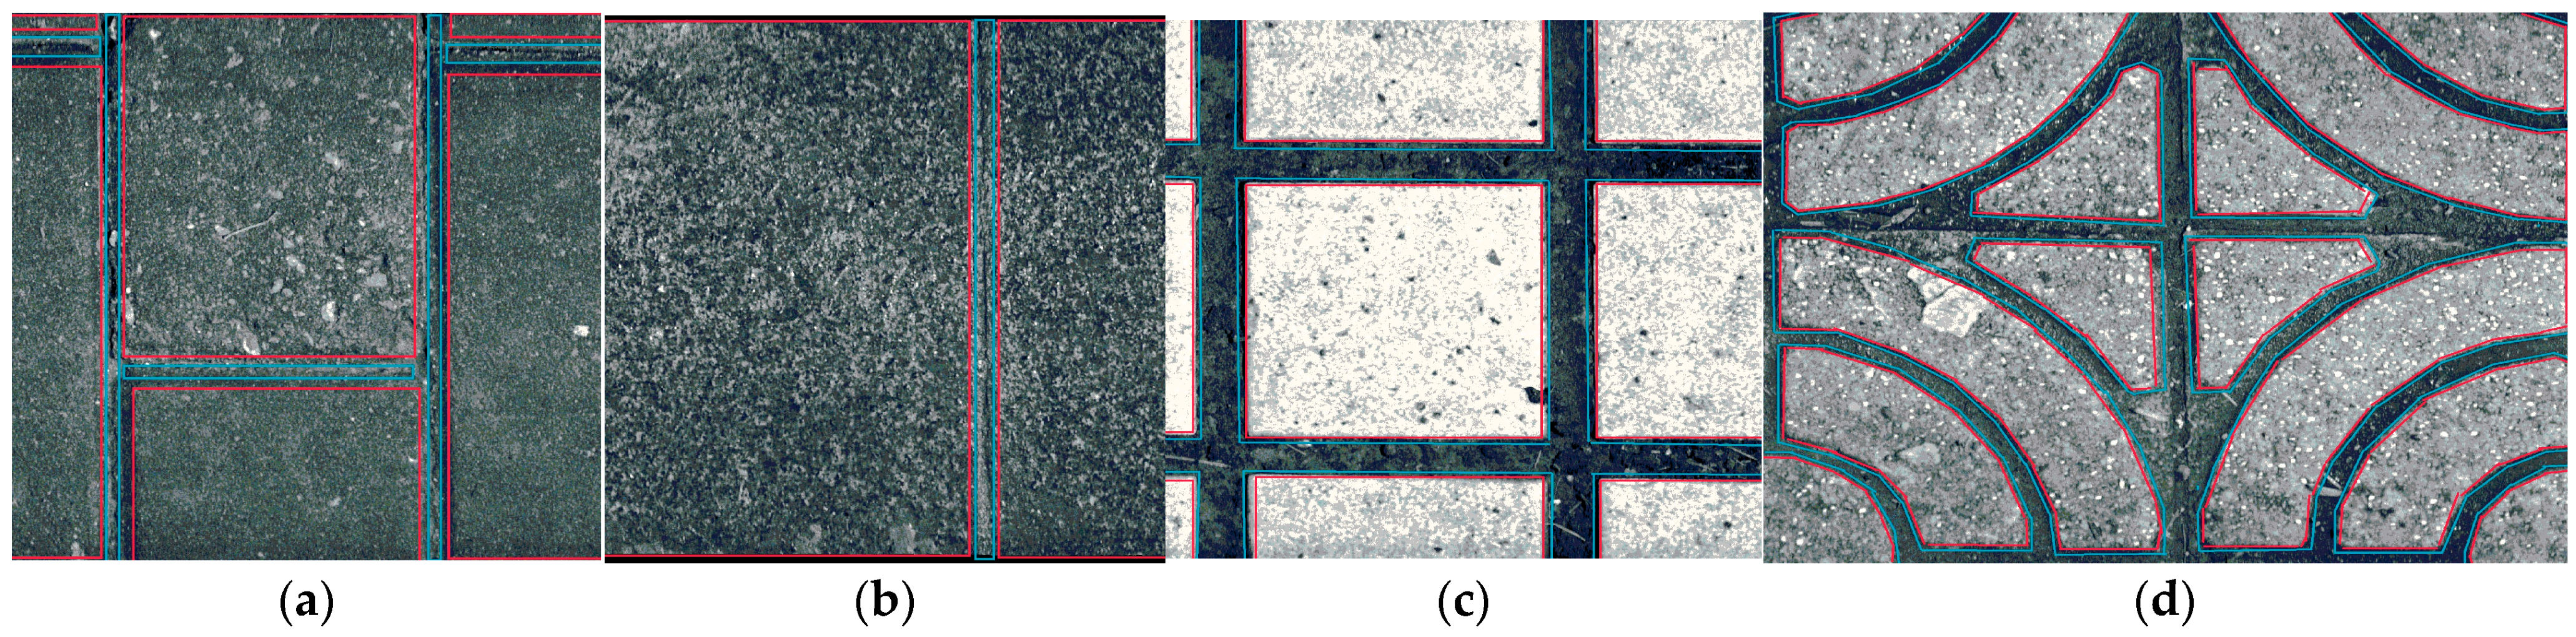
3.2.2. Seam Condition Results
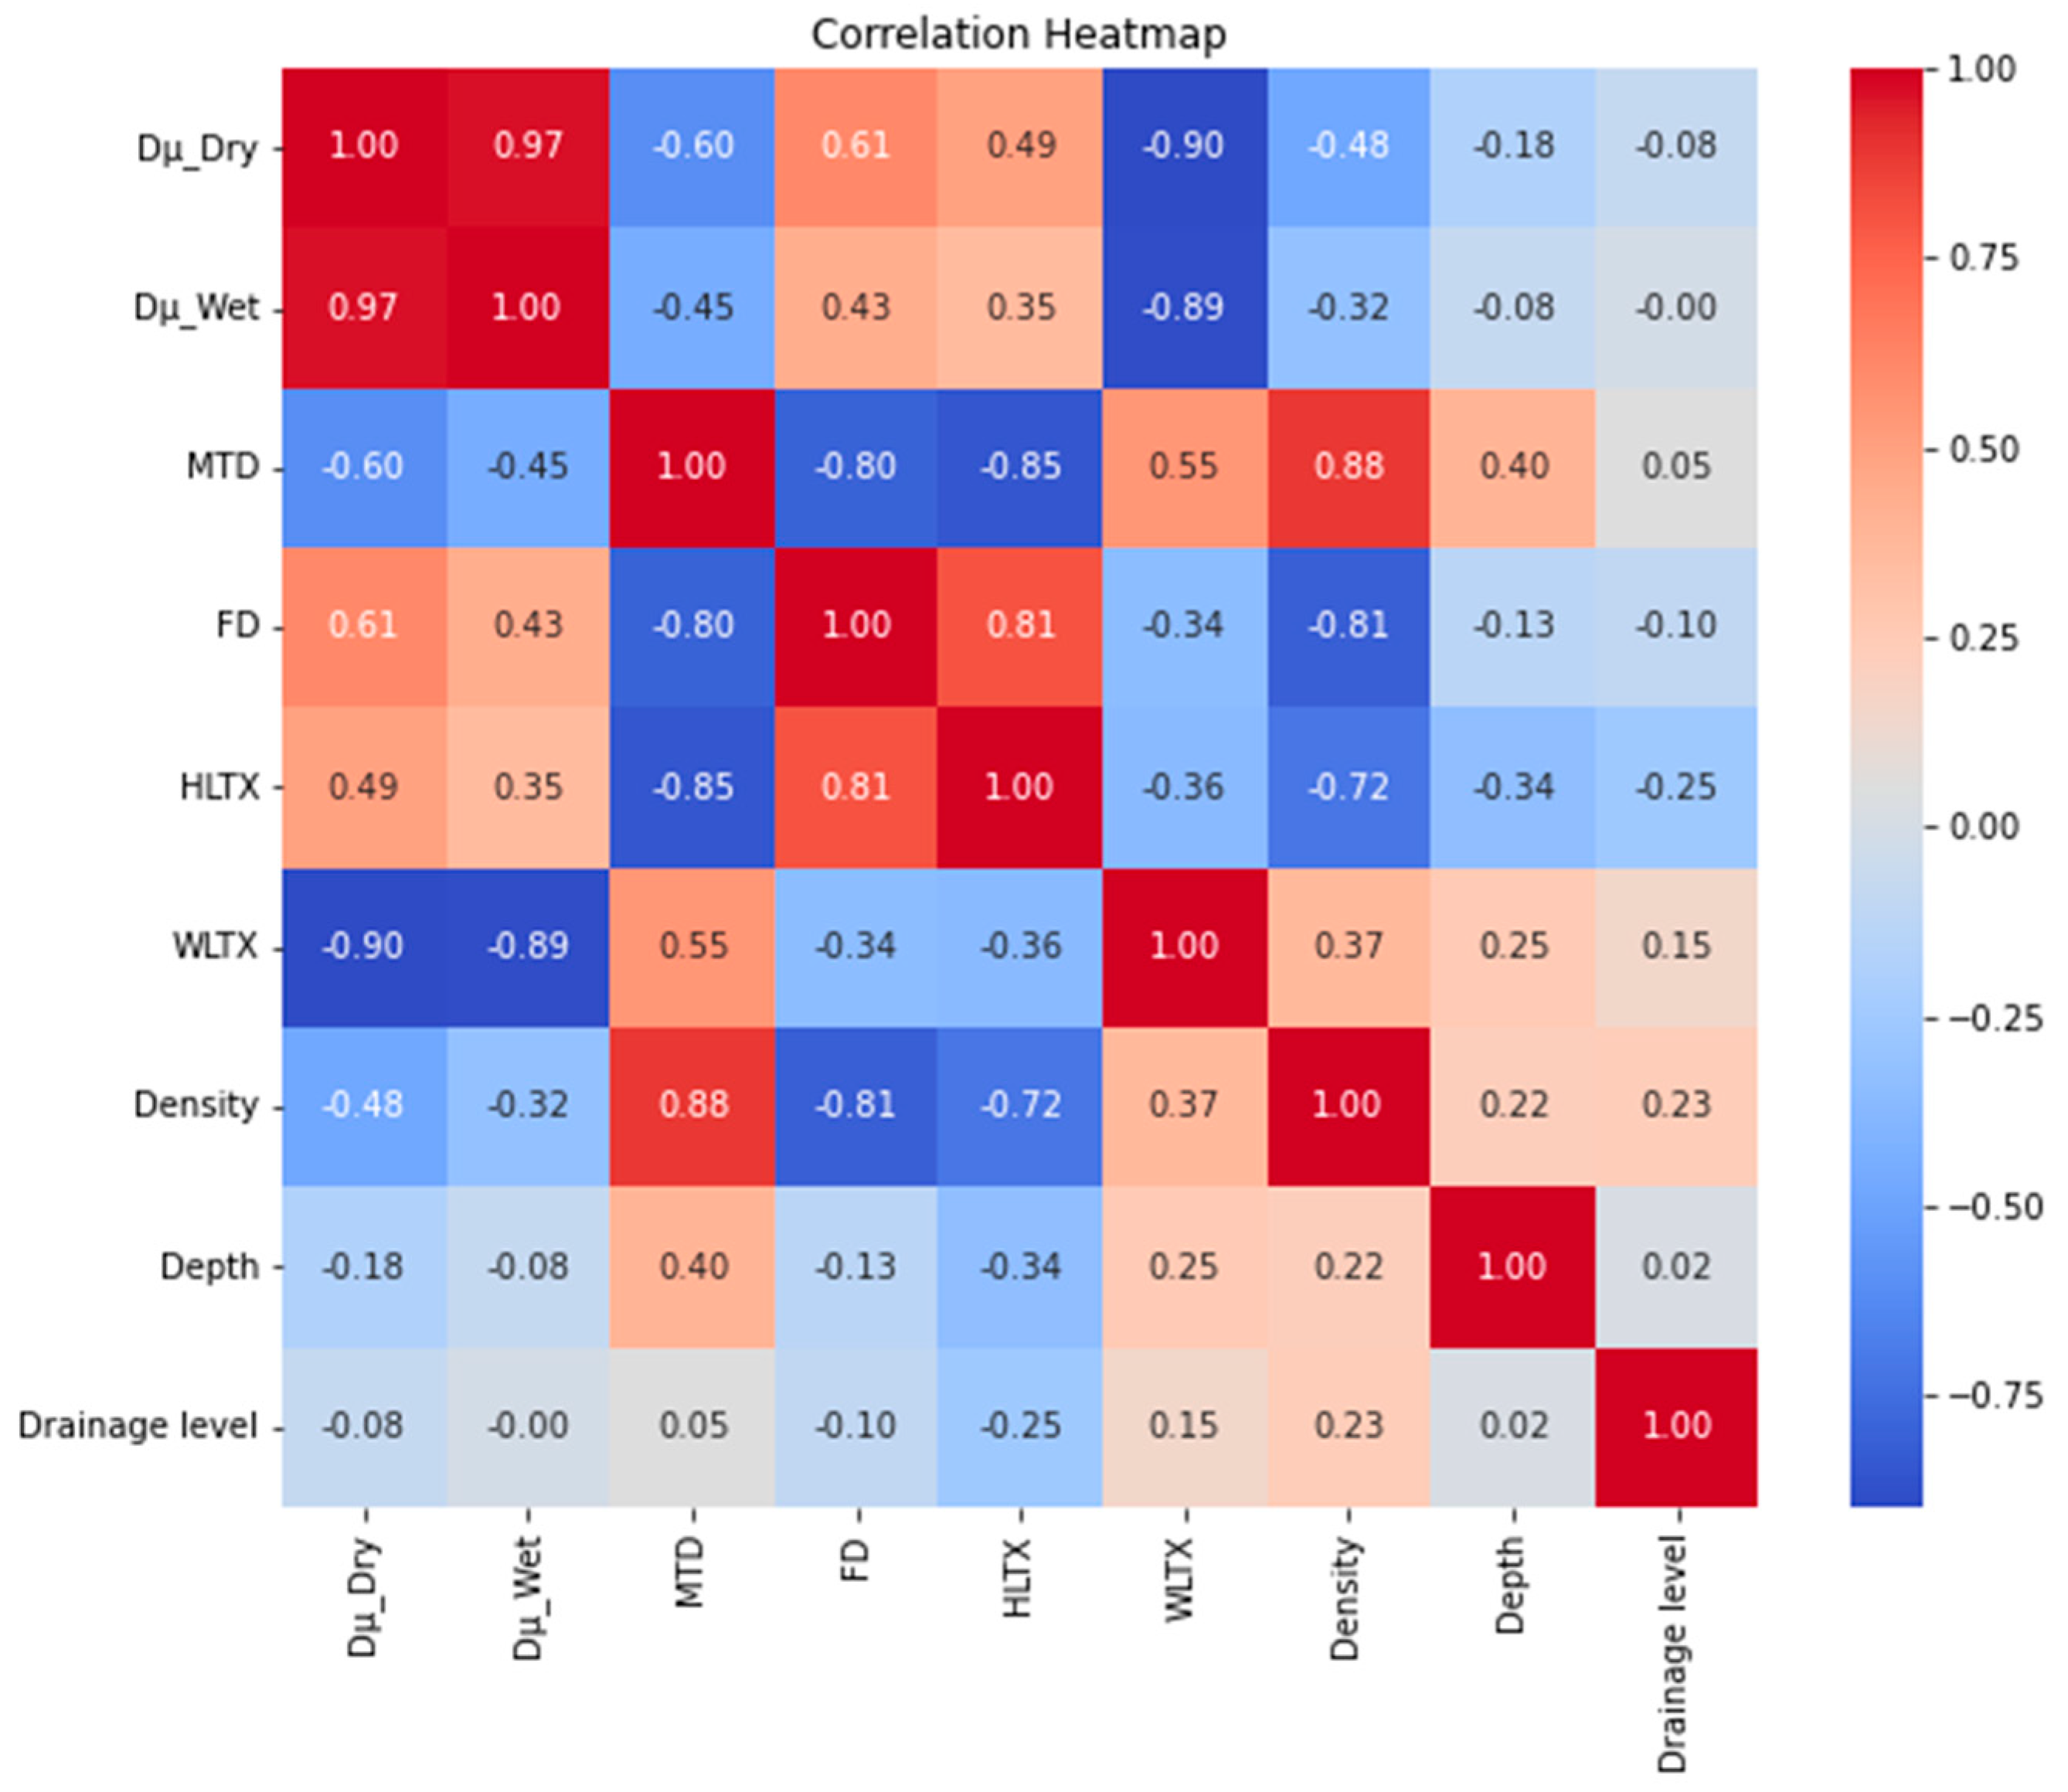
3.3. Correlation Analysis Results
3.4. Hierarchical Regression
4. Conclusions
- (1)
- Laser scanning enables detailed surface texture characterization, which is essential for understanding skid resistance mechanisms. The synergistic analysis of the T2GO friction test system with laser data provides the technical basis for predicting skid resistance in dynamic environments.
- (2)
- Through hierarchical regression analysis, this study reveals that fractal dimension (FD) and mean texture depth (MTD) dominate skid resistance in dry environments, whereas microscopic texture strength (WLTX) and joint depth are the core influencing factors in wet environments, which provide quantitative guidance for safe pavement design and maintenance.
- (3)
- Surface texture complexity (FD) and MTD are identified as dominant factors influencing dry-condition skid resistance, while drainage efficiency and seam design are critical in wet environments. Materials with FD > 2.5 and MTD <0.5 mm exhibit optimal dry skid resistance.
- (4)
- Joints/seams need to be designed in conjunction with the microscopic densification properties of the material. A balanced design of density, depth, and WLTX offers optimal wet skid resistance.
- (5)
- The preliminary design recommendations are as follows: High FD (>2.5), medium MTD (0.3–0.5 mm) materials should be selected for dry environments (e.g., stone #4, #5); in wet environments, WLTX <3500, Depth ≥0.25 mm (e.g., #5) should be prioritized, with high WLTX tiles (#6, #7) being avoided. Furthermore, it is recommended that seam density to be controlled less than 5%.
Author Contributions
Funding
Institutional Review Board Statement
Informed Consent Statement
Data Availability Statement
Conflicts of Interest
References
- Frackelton, A.; Guensler, R. Pedestrian Project Prioritization: Incorporating App-Collected Sidewalk Data; National Academy of Sciences: Columbia, DC, USA, 2015. [Google Scholar]
- Aghaabbasi, M.; Moeinaddini, M.; Zaly Shah, M.; Asadi-Shekari, Z.; Arjomand Kermani, M. Evaluating the Capability of Walkability Audit Tools for Assessing Sidewalks. Sustain. Cities Soc. 2018, 37, 475–484. [Google Scholar] [CrossRef]
- Honiball, J.E.; Das, D.K. Appraisal of Pedestrian Sidewalks as a Network to Public Parks in Urban Residential Areas in South Africa. In Proceedings of the International Conference on Traffic and Transport Engineering (ICTTE 2018), Belgrade, Serbia, 27–28 September 2018; Cokorilo, O., Ed.; City Net Scientific Research Center Ltd-Belgrade: Belgrade, Serbia, 2018; pp. 877–883. [Google Scholar]
- Schepers, P.; den Brinker, B.; Methorst, R.; Helbich, M. Pedestrian Falls: A Review of the Literature and Future Research Directions. J. Saf. Res. 2017, 62, 227–234. [Google Scholar] [CrossRef] [PubMed]
- Correia de Lima, M.d.C.; da Silva, A.F.; dos Santos, R.B.; d’Orsi, E.; Trindade Bestetti, M.L.; Perracini, M.R. How Do Older Adults Living in the Community in Brazil Perceive Walkability in the Context of Sidewalks? J. Aging Environ. 2024, 38, 37–55. [Google Scholar] [CrossRef]
- Hertach, P.; Uhr, A.; Niemann, S.; Cavegn, M. Characteristics of single-vehicle crashes with e-bikes in Switzerland. Accid. Anal. Prev. 2018, 117, 232–238. [Google Scholar] [CrossRef]
- Aultman-Hall, L.; Adams, M.F. Sidewalk Bicycling Safety Issues. In Bicycle and Pedestrian Research 1998; Transportation Research Record-Series; National Academy of Sciences: Washington, DC, USA, 1998; pp. 71–76. ISBN 978-0-309-06508-5. [Google Scholar]
- Airaksinen, N. Polkupyöräilijöiden, Mopoilijoiden ja Moottoripyöräilijöiden Tapaturmat: Vammojen Vakavuus ja Tapaturmien Tilastointi; Itä-Suomen Yliopisto: Kuopio, Finland, 2018; ISBN 978-952-61-2865-8. [Google Scholar]
- Sucha, M.; Sragova, E.; Suriakova, B.; Risser, R.; Mazalova, R.; Oviedo-Trespalacios, O.; Włodarczyk, A.; Aquino, S.D.; Rusli, R.; Useche, S.A.; et al. Self-Reported Pedestrian Falls in 15 Countries Worldwide. Transp. Res. Part F Traffic Psychol. Behav. 2024, 105, 267–283. [Google Scholar] [CrossRef]
- Majumdar, B.B.; Sahu, P.K.; Patil, M.; Vendotti, N. Pedestrian Satisfaction-Based Methodology for Prioritization of Critical Sidewalk and Crosswalk Attributes Influencing Walkability. J. Urban Plan. Dev. 2021, 147, 04021032. [Google Scholar] [CrossRef]
- James, O.; Swiderski, J.I.; Hicks, J.; Teoman, D.; Buehler, R. Pedestrians and E-Scooters: An Initial Look at E-Scooter Parking and Perceptions by Riders and Non-Riders. Sustainability 2019, 11, 5591. [Google Scholar] [CrossRef]
- Ma, J.; Zheng, S.; Zhang, Z.; Han, B.; Geng, D.; Hong, X.; Yu, G.; Li, Y.; Li, L.; Cheng, C. Evaluation of Skid Resistance and Comfort of Pedestrian Pavement with Asphalt-Based Wood Chip. Buildings 2024, 14, 1512. [Google Scholar] [CrossRef]
- Qin, Z.; Yao, Y.; Zhao, J.; Fu, H.; Zhang, S.; Qiu, L. Investigation of Migration Rule of Rainwater for Sponge City Roads under Different Rainfall Intensities. Environ. Geochem. Health 2022, 44, 3395–3407. [Google Scholar] [CrossRef]
- Marpet, M.I. Problems and Progress in the Development of Standards for Quantifying Friction at the Walkway Interface. Tribol. Int. 2001, 34, 635–645. [Google Scholar] [CrossRef]
- Lewis, E.; Fowler, H.; Alexander, L.; Dunn, R.; McClean, F.; Barbero, R.; Guerreiro, S.; Li, X.-F.; Blenkinsop, S. GSDR: A Global Sub-Daily Rainfall Dataset. J. Clim. 2019, 32, 4715–4729. [Google Scholar] [CrossRef]
- Demarch, A.; Angioletto, E.; Vieira, A.W.; Molin, A.D.; Montedo, O.R.K.; Angioletto, E. Coefficients of Static and Dynamic Friction of Ceramic Floor Tiles: Proposal of New Method of Surface Roughness Determination. Int. J. Metrol. Qual. Eng. 2019, 10, 4. [Google Scholar] [CrossRef]
- Campos Ferreira, M.; Dias Costa, P.; Abrantes, D.; Hora, J.; Felício, S.; Coimbra, M.; Galvão Dias, T. Identifying the Determinants and Understanding Their Effect on the Perception of Safety, Security, and Comfort by Pedestrians and Cyclists: A Systematic Review. Transp. Res. Part F Traffic Psychol. Behav. 2022, 91, 136–163. [Google Scholar] [CrossRef]
- Su, J.; Cao, Y.; Tang, A.; Wang, S.; Dong, J. Design of Litter Collection Robot for Urban Environment. In Proceedings of the ASME 2021 International Mechanical Engineering Congress and Exposition (IMECE2021), Virtual, 1–5 November 2021; American Society of Mechanical Engineers: New York, NY, USA, 2021; Volume 7A, p. V07AT07A018. [Google Scholar]
- Gebremariam, D.; Kuhilen, T.; Seboka, H.; Grum, B. Effect of Sidewalk Design and Obstructions on Pedestrian Mobility: A Case Study of the Main Streets of Mekelle City, Northern Ethiopia. Adv. Civ. Eng. 2024, 2024, 5672280. [Google Scholar] [CrossRef]
- Khabiri, M.M.; Meybodi, P.A.; Afshari, A. Investigation and Optimisation of a Sidewalk Restoration Program in Human Transportation in an Ancient Sustainable City. Sci. J. Sil. Univ. Technol. Ser. Transp. 2020, 109, 61–72. [Google Scholar] [CrossRef]
- Reynolds, J.; Bhuiyan, R.; Currie, G.; Johnson, M. Cyclist safety around trams: A market survey. Accid. Anal. Prev. 2024, 205, 107635. [Google Scholar] [CrossRef]
- Utriainen, R.; O’Hern, S.; Pöllänen, M. Review on single-bicycle crashes in the recent scientific literature. Transp. Rev. 2023, 43, 159–177. [Google Scholar] [CrossRef]
- Wang, H.; Qian, J.; Zhang, H.; Nan, X.; Chen, G.; Li, X. Exploring Skid Resistance over Time: Steel Slag as a Pavement Aggregate—Comparative Study and Morphological Analysis. J. Clean. Prod. 2024, 464, 142779. [Google Scholar] [CrossRef]
- Fan, J.; Jiang, Y.; Yi, Y.; Tian, T.; Yuan, K.; Xue, J. Effects of Load and Environment on the Durability and Anti-Skid Performance of Road Heat-Reflective Coating. Constr. Build. Mater. 2022, 346, 128520. [Google Scholar] [CrossRef]
- Athiappan, K.; Kandasamy, A.; Mohamed, M.J.S.; Parthiban, P.; Balasubramanian, S. Prediction Modeling of Skid Resistance and Texture Depth on Flexible Pavement for Urban Roads. Mater. Today Proc. 2022, 52, 923–929. [Google Scholar] [CrossRef]
- Fwa, T.F. Skid Resistance Determination for Pavement Management and Wet-Weather Road Safety. Int. J. Transp. Sci. Technol. 2017, 6, 217–227. [Google Scholar] [CrossRef]
- Zhang, X.; Wang, H.; Chi, M.; Xu, Z.; Xu, G. Experimental Investigation on Wear Behavior of Asphalt Pavement Based on Three-Dimensional Surface Texture Scan Technology. Constr. Build. Mater. 2024, 412, 134851. [Google Scholar] [CrossRef]
- Kim, I.-J. A Study on Wear Development of Floor Surfaces: Impact on Pedestrian Walkway Slip-Resistance Performance. Tribol. Int. 2016, 95, 316–323. [Google Scholar] [CrossRef]
- JGJ/T 331-2014 J1843-2014; Beijing Urban Construction Science and Technology Promotion Association. Anti-Slip Technical Specification for Building Ground Engineering. China Construction Industry Press: Beijing, China, 2014. (In Chinese)
- Bowman, R.; Daniel, M.; Strautins, C. A Comparison of Psychophysical Assessments and Physical Skid resistance Measurements. In Proceedings of the 19th Triennial Congress of the IEA, Melbourne, Melbourne, Australia, 9–14 August 2015. [Google Scholar]
- ASTM E3304-22; Standard Test Method for Measuring the Skid Resistance of Pavements and Other Trafficked Surfaces Using a Walking Speed Continuous Friction-Measuring Equipment (CFME) Fixed-Slip Technique. ASTM International: Conshohocken, PA, USA, 2022. [CrossRef]
- DIN EN 16165:2021-12; Bestimmung Der Rutschhemmung von Fußböden-Ermittlungsverfahren. German Institute for Standardisation: Berlin, Germany, Deutsche Fassung.
- Grieser, B.C.; Frantz, J. Skid resistance Assessment of Common Shoe Sole Materials on Selected Floor Surfaces. Proc. Hum. Factors Ergon. Soc. Annu. Meet. 2018, 62, 435–439. [Google Scholar] [CrossRef]
- Jakobsen, L.; Auganaes, S.B.; Buene, A.F.; Sivebaek, I.M.; Klein-Paste, A. Dynamic and Static Friction Measurements of Elastomer Footwear Blocks on Ice Surface. Tribol. Int. 2023, 178, 108064. [Google Scholar] [CrossRef]
- Ma, Y.; Wang, R.; Li, X.; Qing, R.; Cao, X.; Jing, X. Research on sidewalk pavement selection for urban roads in Nansha New District. Guangzhou City. Guangdong Civ. Eng. Constr. 2019, 26, 59–62. (In Chinese) [Google Scholar] [CrossRef]
- Kamal Hossain, S.M.; Liping Fu, D.; Law, B. Winter Contaminants of Parking Lots and Sidewalks: Friction Characteristics and Slipping Risks. J. Cold Reg. Eng. 2015, 29, 04014018. [Google Scholar] [CrossRef]
- Siegmund, G.P.; Blanchette, M.G.; Brault, J.R.; Chimich, D.D.; Elkin, B.S. Quantifying the Uncertainty in Tribometer Measurements on Walkway Surfaces. Ergonomics 2021, 64, 396–409. [Google Scholar] [CrossRef]
- Nemire, K.; Johnson, D.A.; Vidal, K. The Science behind Codes and Standards for Safe Walkways: Changes in Level, Stairways, Stair Handrails and Skid resistance. Appl. Ergon. 2016, 52, 309–316. [Google Scholar] [CrossRef]
- Liu, C.; Zhan, Y.; Deng, Q.; Qiu, Y.; Zhang, A. An Improved Differential Box Counting Method to Measure Fractal Dimensions for Pavement Surface Skid Resistance Evaluation. Measurement 2021, 178, 109376. [Google Scholar] [CrossRef]
- Han, S.; Liu, M.; Fwa, T.F. Testing for Low-Speed Skid Resistance of Road Pavements. Road Mater. Pavement Des. 2020, 21, 1312–1325. [Google Scholar] [CrossRef]
- Chen, S.; Liu, X.; Luo, H.; Yu, J.; Chen, F.; Zhang, Y.; Ma, T.; Huang, X. A State-of-the-Art Review of Asphalt Pavement Surface Texture and Its Measurement Techniques. J. Road Eng. 2022, 2, 156–180. [Google Scholar] [CrossRef]
- Wang, H.; Fan, W.; Chi, M.; Li, Y.; Zhang, X.; Xu, Z.; Jiang, S. Wear Resistance and Skid Resistance of 100% Reclaimed Asphalt Pavement. Constr. Build. Mater. 2025, 468, 140373. [Google Scholar] [CrossRef]
- Yun, D.; Hu, L.; Tang, C. Tire-Road Contact Area on Asphalt Concrete Pavement and Its Relationship with the Skid Resistance. Materials 2020, 13, 615. [Google Scholar] [CrossRef] [PubMed]
- Wang, H.; Zhang, X.; Jiang, S. A Laboratory and Field Universal Estimation Method for Tire–Pavement Interaction Noise (TPIN) Based on 3D Image Technology. Sustainability 2022, 14, 12066. [Google Scholar] [CrossRef]
- Li, Y.; Qin, Y.; Wang, H.; Xu, S.; Li, S. Study of Texture Indicators Applied to Pavement Wear Analysis Based on 3D Image Technology. Sensors 2022, 22, 4955. [Google Scholar] [CrossRef]
- Hou, Y.; Quintana, M.; Khomiakov, M.; Yap, W.; Ouyang, J.; Ito, K.; Wang, Z.; Zhao, T.; Biljecki, F. Global Streetscapes—A comprehensive dataset of 10 million street-level images across 688 cities for urban science and analytics. ISPRS J. Photogramm. Remote Sens. 2024, 215, 216–238. [Google Scholar] [CrossRef]
- Wei, Y.; Zhang, K.; Ji, S. Simultaneous Road Surface and Centerline Extraction from Large-Scale Remote Sensing Images Using CNN-Based Segmentation and Tracing. IEEE Trans. Geosci. Remote Sens. 2020, 58, 8919–8931. [Google Scholar] [CrossRef]


| No. | Sites | Pavement Type | Drainage Level | Photograph |
|---|---|---|---|---|
| #1 | Yumai Road | Permeable brick 1 | 6 |  |
| #2 | Tongji Campus | Permeable brick 2 | 4 | 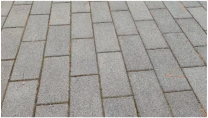 |
| #3 | Wuning Road | Stone 1 | 2 | 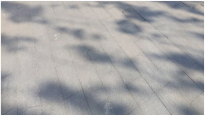 |
| #4 | Tongdaoyou | Stone 2 | 3 | 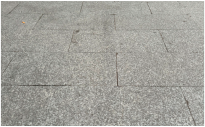 |
| #5 | Xiaoban | Stone 3 | 3 | 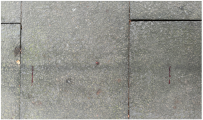 |
| #6 | Tongji Campus | Tile 1 | 1 |  |
| #7 | Changshou Road | Tile 2 | 2 | 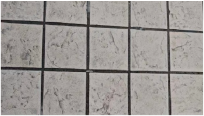 |
| #8 | Tongdaozuo | Tile 3 | 4 | 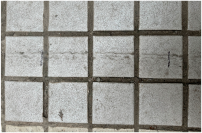 |
| #9 | Jiasongbei Road | Decorative brick | 5 |  |
| #10 | Tushuqian | Color fine mixture | 2 | 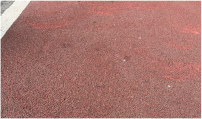 |
| Predicted Variable | Stage | R2 | ∆R2 | Significant Variables (β) | p |
|---|---|---|---|---|---|
| Dμ_Dry | 1 (Texture) | 0.72 | - | FD (β = 0.61), MTD (β = −0.53) | <0.01 |
| 2 (Seam) | 0.75 | 0.03 | FD (β = 0.58), Depth (β = 0.21) | Depth: 0.04 | |
| Dμ_Wet | 1 (Texture) | 0.85 | - | WLTX (β = −0.76), FD (β = 0.18) | <0.01 |
| 2 (Seam) | 0.89 | 0.04 | WLTX (β = −0.72), Depth (β = 0.31) | Depth: 0.008 |
Disclaimer/Publisher’s Note: The statements, opinions and data contained in all publications are solely those of the individual author(s) and contributor(s) and not of MDPI and/or the editor(s). MDPI and/or the editor(s) disclaim responsibility for any injury to people or property resulting from any ideas, methods, instructions or products referred to in the content. |
© 2025 by the authors. Licensee MDPI, Basel, Switzerland. This article is an open access article distributed under the terms and conditions of the Creative Commons Attribution (CC BY) license (https://creativecommons.org/licenses/by/4.0/).
Share and Cite
Jiang, S.; Wang, H.; Fan, W.; Chi, M.; Zhang, X.; Ma, J. A Non-Contact Method for Detecting and Evaluating the Non-Motor Use of Sidewalks Based on Three-Dimensional Pavement Morphology Analysis. Sensors 2025, 25, 1721. https://doi.org/10.3390/s25061721
Jiang S, Wang H, Fan W, Chi M, Zhang X, Ma J. A Non-Contact Method for Detecting and Evaluating the Non-Motor Use of Sidewalks Based on Three-Dimensional Pavement Morphology Analysis. Sensors. 2025; 25(6):1721. https://doi.org/10.3390/s25061721
Chicago/Turabian StyleJiang, Shengchuan, Hui Wang, Wenruo Fan, Min Chi, Xun Zhang, and Jinlong Ma. 2025. "A Non-Contact Method for Detecting and Evaluating the Non-Motor Use of Sidewalks Based on Three-Dimensional Pavement Morphology Analysis" Sensors 25, no. 6: 1721. https://doi.org/10.3390/s25061721
APA StyleJiang, S., Wang, H., Fan, W., Chi, M., Zhang, X., & Ma, J. (2025). A Non-Contact Method for Detecting and Evaluating the Non-Motor Use of Sidewalks Based on Three-Dimensional Pavement Morphology Analysis. Sensors, 25(6), 1721. https://doi.org/10.3390/s25061721