Abstract
Electrostatic actuation is widely employed in microelectromechanical systems (MEMS) due to its distinct advantages. However, it requires high voltage, typically provided by a power supply and a high voltage amplifier, which is limited in gain, especially at high frequencies. Various methods have been proposed to amplify the voltage signal fed into the system by coupling it in series to an LC tank circuit. In this work, we analyze and compare three methods, resonance matching, multi-frequency excitation, and amplitude modulation. We also compare their performance to that of a voltage amplifier. We demonstrate that resonant circuits significantly enhance performance, offering a more effective solution for high-frequency MEMS actuation.
1. Introduction
Microelectromechanical systems (MEMS) have transformed modern sensing and actuation technologies due to their compact size, lightweight design, high accuracy, and cost efficiency. Over the past two decades, MEMS devices have consistently excelled, delivering real-time operation and improved portability [,,]. Their versatility has led to a wide range of applications, including micromirrors [], sensors [,,,,], RF switches [], and energy harvesters [], solidifying their role in advanced technological systems.
Among the various actuation mechanisms employed in MEMS, electrostatic transduction stands out for its simplicity, ease of fabrication and integration with electrical circuits, rapid response, and low power consumption [,,]. With the growing demand for high-sensitivity sensors, researchers have increasingly focused on higher-frequency MEMS, exploring their higher vibration modes [] and studying nonlinear phenomena [,]. However, despite its many advantages, electrostatic actuation often requires high operating voltages, posing a significant challenge, particularly at higher frequencies where conventional voltage amplifiers exhibit limited gain.
To overcome the high voltage requirement and amplifier limitations at high frequencies, researchers have proposed various methods to amplify the voltage signal fed into the system by coupling it in series with an tank circuit formed by introducing an external inductor L. These methods are based on utilizing the electrical quality factor of an circuit driven at its natural frequency to amplify the actuation voltage. Common approaches include using resonant circuits [,,], frequency-modulated (FM) [] and amplitude-modulated (AM) signals [,], matching electrical and mechanical resonances [,], and excitation using multi-frequency signals [,,,].
The concept of using resonant circuits dates back to Cady’s pioneering work on piezoelectric resonators [], where he demonstrated that connecting a quartz crystal resonator to an LC tank can maximize its response. Recent studies have extended this approach to electrostatic MEMS. For instance, Truitt et al. [] explored resonance matching as a method to improve the readout sensitivity in nanomechanical resonators. Chung et al. [] employed amplitude modulation to configure MEMS devices as demodulators of AM/FM signals. Jaber et al. [] and Ouakad et al. [] investigated the use of LC tank circuits to amplify MEMS responses without external amplifiers. While these studies have demonstrated the effectiveness of each technique, no one has yet carried out a comprehensive comparative analysis among them to elucidate their relative merits.
In this work, we carry out a systematic comparison among those amplification techniques, namely resonance matching, multi-frequency excitation, and amplitude modulation, relative to each other and to a voltage amplifier, which serves as a baseline for evaluation. This study aims to identify the most effective among these methods for MEMS actuation, particularly in high-frequency applications (above 1 MHz), and their limitations. We identify and highlight the advantages of different resonant drive techniques in terms of voltage amplification and tuning flexibility.
2. Electrostatic MEMS Actuator
2.1. Actuator Design
The electrostatic MEMS actuator under study is an in-plane actuator composed of a stationary silicon electrode with a metal pad on top made of aluminum and a movable silicon microbeam, shown in Figure 1. The actuator was fabricated using the PiezoMUMPs [] process. The substrate underneath the beam was fully etched during the fabrication. The as-designed dimensions of the actuator are listed in Table 1.
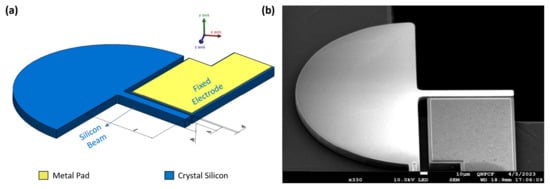
Figure 1.
(a) Schematic diagram of the actuator. (b) Scanning Electron Microscope (SEM) image of the actuator.

Table 1.
Actuator dimensions.
2.2. Lumped-Element Model
The proposed model studies the response of the first out-of-plane bending mode of the microbeam, which is actuated via the (weak) fringing electrostatic field. The model incorporates both electrical and mechanical subsystems represented as lumped parameters. The mechanical subsystem is an electrostatic MEMS actuator modeled as a simple parallel plate capacitor electrically excited by a force consisting of a static voltage and a time-varying voltage , while the electrical subsystem is an tank constituted by introducing an external inductor L connected in series with the MEMS actuator.
The equivalent circuit of the electromechanical system is presented in Figure 2, with the 50 resistor representing the internal resistance of the voltage source. The electrical characteristics of the system are represented by a series RLC circuit, where R represents the circuit’s parasitic resistance, L is the external inductor, and C represents the total capacitance of the system, consisting of the MEMS variable capacitance parallel to the parasitic capacitance in the system due to coupling with other structures on the chip and wire bonding. The transformer T represents the nonlinearities in the system and the energy flow between the electrical and mechanical domains. The mechanical parameters of the system are represented in an electrical analogy, where the capacitor represents the reciprocal of the mechanical stiffness, the inductor m refers to the system’s effective mass, and the resistor c represents the mechanical damping. The beam dynamics is governed by the following linear equation
where w is the out-of-plane displacement in the y-direction, is the undamped angular natural frequency of the uncoupled mechanical subsystem and is its quality factor, , is the permittivity of free space, is the permittivity of the medium (air), is the voltage across the MEMS, and is the signum function. We assume that the top surface of the beam is initially parallel to the top surface of the metal pad on top of the stationary electrode and µm is the metallization thickness as measured using a white light profilometer.
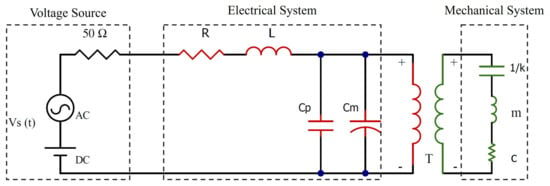
Figure 2.
Equivalent circuit of the electromechanical system.
To account for the fringing field, we modify the capacitance expression on the right-hand side by multiplying it with a constant term denoted as []
and is a factor that accounts for the geometry of the resonator’s fringing field during the out-of-plane motions; see Figure 3.

Figure 3.
Electrostatic field of the actuator at (a) equilibrium (b) out-of-plane motion.
The governing equation of the electrical subsystem can be written as
where q is the total charge stored on the parallel-plate actuator and is the source voltage of the circuit.
Nondimensionalization
We introduced the following nondimensional parameters to nondimensionalize the equations of motion
where is a time-scale, is the resonator’s characteristic length and is the nominal capacitance at zero displacement and 1 V. Using Equation (4) in Equation (1) and multiplying by , we obtain
where the nondimensional natural frequency of the mechanical subsystem is set to unity, . Dispensing with the over-hat for the sake of simplicity, we can rewrite the equation of motion as
where a transduction parameter has been introduced to serve as the electromechanical coupling coefficient.
Substituting with Equation (4) into Equation (3), we obtain
where the capacitance parameter can be written as
Multiplying by , and dropping the over-hat for the sake of simplicity, we can rearrange the nondimensional equation as
where the electrical subsystem quality factor is defined as
and a nondimensional parameter defined as
has been introduced to describe the electrical natural frequency.
3. Results
3.1. Characterization
We characterized two electrostatically actuated MEMS resonators, dubbed actuator I and actuator II, as well as the circuits used to drive them under identical ambient air conditions. Then, we investigated their frequency response in primary resonance of the first out-of-plane bending mode under various actuation techniques. The actuators share the same design, as shown in Figure 1, and dimensions, as shown in Table 1.
Modal analysis was carried out to determine the lowest resonant frequencies of the actuators. The chip containing the actuator was placed into a DIP-40 chip carrier, and the actuators being tested were wire-bonded to it to avoid the parasitic incurred through probing.
The experimental setup shown in Figure 4 was utilized to characterize the actuators. The chip carrier is placed on a breadboard under the Polytec UHF-120 Laser Doppler Vibrometer (LDV) [] to measure the beam tip displacement optically. The Liquid Instruments’ Moku:Pro [] served as a function generator to feed the excitation signal to a high voltage amplifier, Tabor Electronics-9400 []. The actuation signal was supplied to the fixed electrode while the microbeam was grounded.
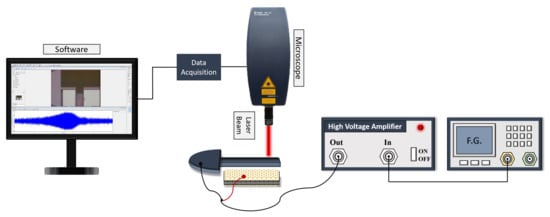
Figure 4.
The experimental setup for actuator characterization.
3.2. Modal Analysis
For the initial characterization, the damped natural frequencies of the actuators were obtained by applying a pulse train with a 0.01% duty cycle and a 312.5 Hz frequency to the fixed electrode. The Fast Fourier Transform (FFT) of the measured tip displacement to a single pulse was obtained using the LDV software, PSV [], and averaged over 30 samples.
For actuator I, the first out-of-plane bending mode was found at MHz, while the first in-plane bending mode was found at MHz; see Figure 5a. They were distinguished by the larger peak response of the in-plane mode, strongly actuated via the parallel part of the electrostatic field, compared to the smaller peak of the out-of-plane mode, weakly actuated via the fringing part of the electrostatic field. The quality factors of the modes were calculated using the half-power bandwidth method from the measured FFT as , corresponding to a settling time of ms, and , corresponding to a settling time of ms.
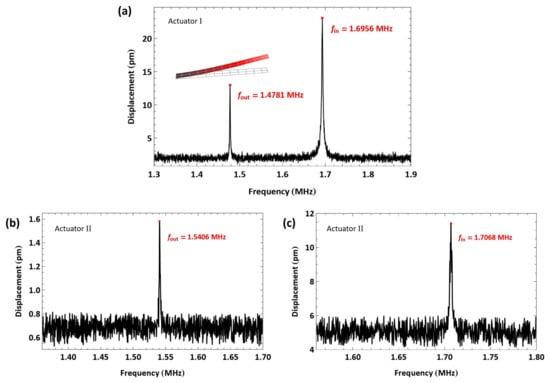
Figure 5.
FFT of the measured tip displacements under pulse excitation, showing (a) the first out-of-plane and in-plane bending modes of actuator I, (b) the first out-of-plane, and (c) the first in-plane bending modes of actuator II.
For actuator II, the first out-of-plane bending mode was observed at MHz under a voltage amplitude of 100 V; see Figure 5b. The first in-plane bending mode was measured at MHz under an amplitude of 150 V; see Figure 5c. The quality factors of the modes were calculated using the half-power bandwidth method from the measured FFT as , corresponding to a settling time of ms, and , corresponding to a settling time of ms.
Although both actuators share the same design, they exhibit different resonance frequencies and quality factors due to chip-to-chip variability in the fabrication process.
3.3. Conventional Excitation
We obtained the frequency response of the actuators under various excitation levels through a conventional excitation scheme following the experimental setup shown in Figure 4. These curves serve as the ‘ground truth’ for comparison with the results obtained from the resonant drive techniques.
The response of the first out-of-plane bending mode was measured under an unbiased voltage waveform. Due to the quadratic nature of the electrostatic force, applying a signal with a frequency f to the actuator results in an electrostatic excitation at
For example, to excite actuator I, the signal frequency was swept up in the frequency range kHz, resulting in an excitation frequency range of MHz, which covers the half-power bandwidth of its first out-of-plane mode. The beam’s tip displacement was recorded over a time window of 100 ms, with a sampling frequency of 100 MHz. The sweep time was set to more than 10 times longer than the settling time to minimize transients in the response. The frequency–response curves, shown in Figure 6, were obtained for four signal amplitudes by post-processing the measured displacement to evaluate its RMS over a moving time window extending over 180 excitation periods []. The reported voltage amplitudes are those obtained from the voltage amplifier.
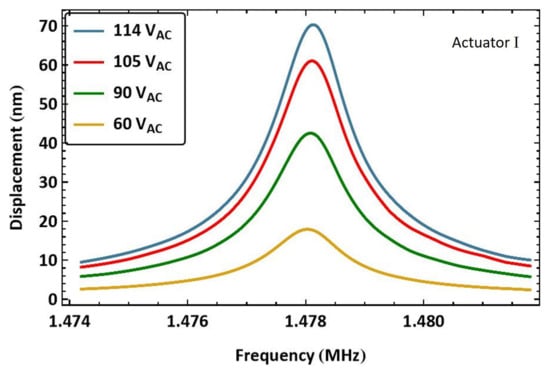
Figure 6.
The frequency–response curves of actuator I beam tip displacement under four levels of the amplified voltage amplitude .
The largest RMS displacement for this excitation scheme was nm obtained for the highest voltage amplitude V at resonance. It corresponds to only 3.5% of the air gap. It is worth mentioning that the voltage amplifier utilized to obtain those curves was operating beyond its specifications. Although its declared gain is 50×, the input voltage to the MEMS measured by an oscilloscope was found to have a gain of 60× in this frequency range. This is characteristic behavior of a low-pass filter, such as a voltage amplifier, where the gain may temporarily increase when operating near its resonance (cutoff) frequency [].
During the experimental campaign, it was observed that the resonant frequency of actuator I dropped by 500 Hz, indicating a degradation in its stiffness. Results obtained after degradation are dubbed as those of actuator . Figure 7 shows the frequency response of actuator to eleven unbiased and amplified voltage amplitudes . For comparison, under a voltage amplitude of V, the peak response of actuator I, shown in Figure 6, is nm, whereas that of actuator is nm, shown in Figure 7c, indicating a drop in beam stiffness.
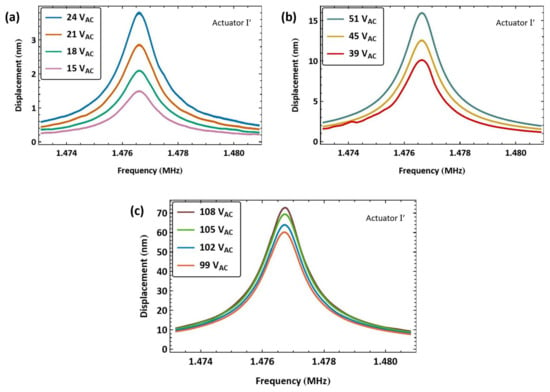
Figure 7.
The frequency-response curves of the beam tip displacement of actuator under eleven levels of the amplified voltage amplitude (a–c).
The frequency response of actuator II was obtained using the same experimental procedure. The frequency–response curves for eight levels of the amplified voltage amplitude are shown in Figure 8a. The excitation frequency was swept up in the vicinity of the first out-of-plane bending mode over a frequency range of MHz. The maximum measured displacement was nm, observed at resonance under a voltage amplitude of V.

Figure 8.
The frequency–response curves of actuator II beam tip displacement for (a) eight levels of the amplified voltage amplitude and (b) two levels of the voltage amplitude .
For comparison, we show in Figure 8b the frequency response of actuator II driven directly by the function generator alone for two signal amplitudes. We note that the maximum RMS displacement achieved was pm, which is only 0.01285% of the air gap.
3.4. Resonant Drive
We describe the experimental procedure used to characterize the circuits of the resonant drive techniques, the characterization of those circuits, and the measured response of the actuators under these excitation regimes.
3.4.1. Electrical Characterization
The experimental setup shown in Figure 9a was used to measure the natural frequency of series RLC circuits consisting of an external inductor L, the circuit parasitic resistance R, the capacitance of the actuator , and the circuit parasitic capacitance . A lumped-element representation of the circuit is shown in Figure 9b. The measurements were carried out using a Vector Network Analyzer (VNA) (Keysight P5020A). To simplify the measurement process, only one-port S-parameter measurements were undertaken. This represents the ratio of the reflected wave to the incident wave as a function of frequency at the input port of the circuit. A calibration process was performed prior to measurements to account for the parastics presented by cables and connectors. Calibration was carried out using the short-open-load calibration approach with the Keysight 85521A Mechanical Calibration Kit.
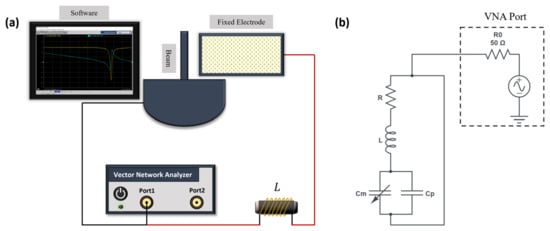
Figure 9.
(a) The experimental setup for resonant drive circuit characterization. (b) The equivalent circuit.
Different inductors were used with the resonant circuit to achieve various resonance frequencies required for the resonant drive techniques discussed in the following sections. Below, the characterization of each inductor is detailed.
For the characterization with a mH inductor, composed of two series-connected inductors (2.4 mH and 3.2 mH), the power level of the VNA was set to 0 dBm (1 mW). The input signal frequency was swept over the range MHz with a step frequency of 5 kHz. The intermediate frequency bandwidth (IF-BW) was set to 1 kHz. The amplitude of the response of the RLC circuit, shown in Figure 10a in logarithmic (dB) scale, indicates that electrical resonance occurred at MHz, corresponding to the minimum value of dB. The electrical quality factor of the RLC circuit was calculated using the half-power bandwidth method from the measured magnitude, where the bandwidth was determined from a linear scale (rather than dB), yielding . It was also found that the natural frequencies of the circuits were insensitive to the MEMS actuator in them but varied with the inductor and parasitics in the circuit.
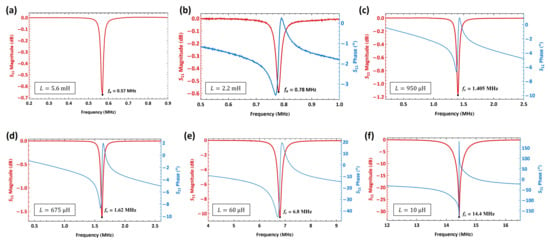
Figure 10.
The measured parameter of an RLC circuit composed of a MEMS actuator and an external inductor where (a) mH; (b) mH; (c) µH; (d) µH; (e) µH; and (f) µH.
The characterization procedure was repeated for an RLC circuit with a mH connected in series with the actuator, Figure 10b. The signal frequency was swept over MHz, with a step frequency of 1 kHz. The IF-BW was set to 1 kHz, and the data were averaged over five samples. The amplitude of is represented in a dB scale, while the phase is shown in degrees. The electrical resonance was found at the minimum value of the dB as kHz. The corresponding phase angle swung from a minimum of to a maximum of . The quality factor of the circuit was calculated as .
The 950 µH and 675 µH inductors were characterized using the same settings as the 5.6 mH inductor, including the signal frequency sweep range, step size, and IF-BW. Figure 10c shows the amplitude and phase response when a 950 µH inductor was connected to the actuator. The electrical resonance was observed at MHz at dB. At resonance, the phase angle varied from to . The quality factor was determined to be .
For the 675 µH inductor, the amplitude and phase response are shown in Figure 10d. The electrical resonance occurred at a minimum value of dB corresponding to a frequency of MHz. The phase angle at resonance ranged from to , and the quality factor was calculated as .
Next, we characterized the resonant circuit with 60 µH and 10 µH inductors. The signal frequency was swept in the range MHz and the IF-BW was set to 2 kHz. The amplitude and phase of the frequency response of the RLC circuit are shown in Figure 10e when a 60 µH was connected to the actuator. The electrical resonance was found at the minimum value of dB to be MHz, and the corresponding phase angle swung from a minimum of to a maximum of . The calculated quality factor in this case was found to be .
Figure 10f shows the magnitude and phase of the frequency response of the resonant circuit when a 10 µH inductor is connected with the actuator. The electrical resonance was found at the minimum value of dB to be MHz and the corresponding phase angle swung from a minimum of to a maximum of . The calculated quality factor in this case was found to be .
3.4.2. Experimental Setup
The experimental setup for the resonant drive experiments is shown in Figure 11. The fixed electrode of the actuator is connected in series to an external inductor to tune the electrical natural frequency of the circuit. The LDV [] is used to measure the tip displacement. The ground of the function generator (Liquid Instruments’ Moku:Pro []) is connected to the beam while it supplies the drive signal of the circuit. Voltage amplification is achieved by the dynamic amplification of the RLC circuit.
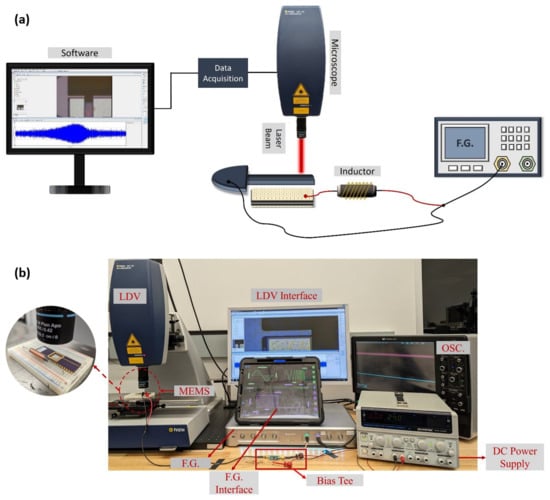
Figure 11.
(a) A schematic and (b) a picture of the experimental setups of unbiased and biased resonant drive experiments, respectively.
3.4.3. Resonance Matching
The first technique employed was resonance matching. It calls for the use of a single tone signal designed to match the electrical resonance of the RLC circuit and to result in an electrostatic excitation force with a dominant peak that matches the mechanical resonance of the actuator. For unbiased signals, the external inductor L is sized such that as per Equation (9). For biased signals, the electrostatic force is described by
and the dominant peak is at . Therefore, the external inductor L is sized such that .
To excite actuator I with an unbiased signal, an mH inductor was connected in series with the actuator, resulting in a VNA-measured electrical resonance of kHz, Figure 10b. It was found that the electrical natural frequency drops in the drive setup, shown in Figure 11a, due to uncharacterized reactive loading introduced by the function generator into the circuit. Hence, we intentionally set the electrical natural frequency to a value larger than the desired signal frequency . The signal frequency was swept within the range kHz in a time window of 100 ms while the voltage amplitude was held constant.
The frequency response of actuator I is presented in Figure 12a for four values of the voltage amplitude . For a voltage amplitude of V, this excitation scheme achieves a maximum displacement of nm at resonance, which is more than twice the maximum displacement attained using a conventional voltage amplifier, Figure 6. The peak of the frequency–response curves was observed to shift to the right. Therefore, the experiment was repeated using a longer time window to investigate whether this shift was due to the hardening of the resonator or an artifact of the sweep transients. The tip velocity of actuator I was measured using the OFV-5000 LDV [], and the data were collected by a digital oscilloscope in 4 s long time windows. The actuator velocity, Figure 12b, demonstrates a similar hardening behavior as the voltage amplitude is increased from V to 10 V, reaching a peak of m/s, which confirms the presence of a hardening nonlinearity. Given the relatively small displacements involved, the source of this nonlinearity is probably the electrostatic field rather than the mechanical potential.
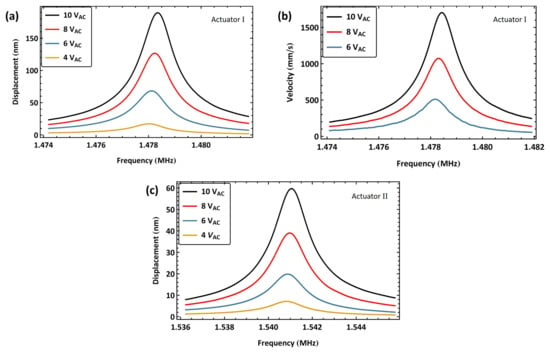
Figure 12.
The frequency–response curves of the beam tip for two actuators under resonance matching excitation with a 2.2 mH inductor. (a) Displacement of actuator I at four unbiased voltage amplitudes, . (b) Velocity of actuator I at three unbiased voltage amplitudes . (c) Displacement of actuator II at four unbiased voltage amplitudes .
The VNA-measured electrical resonance was unchanged at kHz once the chip carrying actuator II was introduced into the circuit. To excite primary resonance, the signal frequency was swept within the range kHz in a time window of 100 ms. Figure 12c shows the frequency response of actuator II tip displacement for four values of the voltage amplitude . The largest realized displacement for V was nm, corresponding to 2.99% of the air gap. The lower peak amplitude in this case is due to a lower quality factor and higher stiffness than those of actuator I. Similar to actuator I, the peak of the frequency response curves was observed to shift to the right, confirming the presence of a hardening nonlinearity.
We deliberately oversized the external inductor to mH to investigate the impact of mistuning the electrical and mechanical resonances away from on our actuation technique. The VNA-measured electrical resonance was found to be kHz, well below half of the mechanical resonance of actuator I at kHz. Figure 13a shows the frequency–response curve of actuator I tip displacement under this excitation regime and a voltage amplitude of V as the signal frequency was swept from kHz to 741 kHz over a time window of 100 ms. The actuator displacement dropped, as shown in Figure 13a, by one order of magnitude to nm, which is much lower than the displacement obtained in the tuned case.

Figure 13.
The frequency–response curves of actuator I under mistuned resonance matching excitation. (a) Tip displacement with an oversized inductor ( mH). (b) Velocity with an undersized inductor ( µH).
Likewise, we undersized the external inductor to µH, resulting in a VNA-measured electrical resonance of MHz, as shown in Figure 10c, well above half of the mechanical resonance of actuator I. Figure 13b shows the frequency–response curve of actuator I tip velocity under a voltage amplitude of V as the signal frequency swept in the range of kHz over a time window of 30 ms. The tip velocity dropped by two orders of magnitude to mm/s.
The experimental setup shown in Figure 11b was adopted to implement biased resonance matching excitation. In this setup, a DC power supply and a bias Tee are introduced to add a bias to the harmonic signal generated by the function generator. For actuator I, two external inductors, µH and µH, were connected in series to match the electric and mechanical natural frequencies . The signal frequency was swept over the range MHz. Figure 14a shows the frequency response of the actuator under three levels of bias voltage and a voltage amplitude of V. The maximum measured displacement nm was realized at resonance for a bias voltage of V.

Figure 14.
The frequency–response curves of the beam tip displacement for (a) actuator I under resonance matching excitation at three bias levels and a voltage amplitude of V. The actuator is connected in series with two inductors: µH and µH. (b) actuator II under resonance matching excitation at three bias levels for two voltage amplitudes, V and V. The actuator is connected in series with an inductor µH inductor.
We note that the introduction of bias into the signal degrades the efficiency of the resonance-matching technique. This can be seen in the fact that adding a bias voltage of V to the same harmonic signal ( V) ends up reducing the realized displacement, in addition to incurring the cost and complexity of biasing the signal and operating in a higher frequency range.
Similarly, we explored the response of actuator II under biased resonance matching. The signal frequency was swept across the range MHz while connecting an external inductor µH, resulting in a VNA-measured electrical resonance of MHz, as shown in Figure 10d. Figure 14b shows the frequency response curves of actuator II under three bias voltage levels and two voltage amplitudes . The discrepancy in the external inductors required for resonance matching between actuators I and II appears to be a result of unaccounted-for parasitic inductance in the case of actuator I.
The largest achieved displacement for actuator II was nm for a bias voltage of V and a voltage amplitude of V, which is marginally larger than that obtained with the same unbiased signal ( V). This result confirms our conclusion about the effectiveness of the unbiased compared to the biased technique.
We investigated the impact of mistuning on resonance matching with biased signals. Due to the limited drive voltage used in this experiment, a bias Tee was not required, and the experimental setup of Figure 11a was adopted. First, a significantly oversized external inductor with µH was introduced to the drive circuit. The VNA-measured electrical resonance was MHz, as shown in Figure 10c, mistuning the electrical resonance to the lower side of the mechanical resonance . Figure 15a shows the measured frequency–response curve of actuator tip displacement under resonance matching excitation with the voltage waveform V as the signal was swept in the frequency range MHz over a time window of 200 ms. The electrical and mechanical resonances are mismatched, with the former appearing at MHz and the latter appearing at MHz.

Figure 15.
The frequency–response curve of actuator tip displacement under a mistuned resonance matching excitation with (a) an oversized inductor ( µH) and (b) an undersized inductor ( µH).
Since the resonance frequency of actuator I’ is lower than that of actuator II, we used the inductor of the latter µH as an undersized inductor for the former. Figure 15b shows the measured frequency–response curve of actuator tip displacement under the same voltage waveform ( V) as the signal was swept in the frequency range MHz over a time window of 100 ms. Distinct peaks corresponding to the mismatched electrical and mechanical resonances appear in the frequency response with the electrical resonance at MHz and the mechanical resonance at MHz. Note that the VNA-measured electrical resonance was MHz, as shown in Figure 10d.
The previous cases demonstrate that optical measurement of the MEMS response can serve as an indicator of the precise location of electrical resonance in the actuation circuit. To accurately match the two resonances , the electrical resonance should be observed optically under a biased signal and adjusted iteratively until it merges with the mechanical resonance into a single peak. Note that when this technique is used to tune the two resonances for an unbiased signal, the two peaks observed in the same vicinity are the electrical resonance and the superharmonic , rather than primary mechanical resonance.
3.4.4. Multi-Frequency Excitation
The multi-frequency excitation technique utilizes the summation of two voltage signals, resulting in an electrostatic force of the form
The frequency of one signal is set to be equal to the electric resonance of the RLC circuit while the sum or difference of the frequencies of the two signals is set equal to the mechanical resonance to drive the actuator with one of the last terms on the right-hand side of Equation (11). Figure 16 shows the signal for the case of .

Figure 16.
Representations of the multi-frequency signal in (a) the time and (b) frequency domains.
As noted in Section 3.4.3, it was found that the reactive loading of the function generator in the drive setup, shown in Figure 11a, causes a drop in the electrical resonance away from that measured using the VNA. To address this, a two-step process was developed to determine the electrical resonance . First, an estimate of the electrical resonance was obtained using the VNA and the setup of Figure 9a to measure the electrical resonance. Then, the drive setup, shown in Figure 11a, was used to vary the first signal frequency in the vicinity of while measuring the response of the actuator. The electrical resonance was determined as the first signal frequency at the peak response.
First, we tested the use of a higher electric resonance in multi-frequency excitation, which corresponds to driving the actuator via the electrostatic force of the frequency difference . Actuator was connected in series to an external inductor µH resulting in an estimated electrical resonance of MHz; see Figure 10e. Based on that, the electrical resonance was found to be MHz using the search routine described above. The frequency of the first signal was set to match the electrical resonance frequency . The frequency of the second signal was swept down in the range MHz over 100 ms, so that the difference between the two frequencies was swept up in the vicinity of the mechanical natural frequency MHz.
Figure 17a shows the frequency–response curves of actuator tip displacement under five levels of the second signal voltage amplitude while the amplitude of the amplifier (first) signal is held constant at V. The maximum displacement realized was nm, observed at resonance under a voltage amplitude of V, which is 0.75% of the air gap. The response under this excitation scheme is well regulated as the second signal amplitude is varied.

Figure 17.
The frequency response of actuator tip displacement under multi-frequency excitation. (a) MHz. (b) MHz.
To test the flexibility of this technique, we tuned the the electrical resonance to a higher value by using a smaller external inductor µH. As a result, the estimated electrical resonance increased to MHz; see Figure 10f. The electrical resonance was found to be MHz using the drive setup. The first signal frequency was set equal to it , while the second signal frequency was swept down in the range MHz over 100 ms. Figure 17b shows the frequency response of actuator under a fixed amplifier voltage amplitude V and seven levels of the second signal voltage amplitude . The maximum measured displacement with this inductor was nm for a voltage amplitude of V, corresponding to 0.45% of the air gap.
The drop in displacement with the increase in the amplifier signal voltage from V to 7.5 V and the actuation signal voltage from V to 7.5 V is an interesting finding. It is even more so given that the smaller inductor in the second case imposes lower losses on the RLC circuit due to a smaller equivalent series resistance (ESR) than the inductor of the first case. We postulate that the ESRs of both inductors are negligible, as they are in the µH range, compared to the overall resistance of the actuation circuit. On the other hand, the larger inductor results in a better electrical quality factor than the smaller inductor given that
thereby making for a better amplifier circuit.
We applied the same excitation technique to actuator II to verify the scheme repeatability. An external inductor µH was connected in series with the actuator, resulting in an electrical resonance of MHz. The frequency of the amplifier signal was set to match the electrical resonance . The frequency of the second signal was swept down in the range MHz over 100 ms so that the difference between the two frequencies was swept up in the vicinity of the mechanical natural frequency MHz.
Figure 18a shows the frequency response of actuator II under a fixed amplifier voltage amplitude V and five levels of second signal voltage amplitude . The largest realized displacement with this inductor was nm for a voltage amplitude of V, corresponding to 0.435% of the air gap. For comparison, the figure also incorporates a frequency–response curve with a lower amplifier voltage amplitude of V and an actuation voltage amplitude of V. It can be seen that the response in the latter case is comparable to that of the higher amplifier voltage under a much smaller actuation voltage of V, thereby demonstrating the efficacy of the amplifier circuit.

Figure 18.
The frequency response of actuator II tip displacement under multi-frequency excitation. (a) MHz. (b) MHz.
A smaller external inductor µH was also used in conjunction with actuator II, resulting in an electrical resonance frequency of MHz. The first signal frequency was set equal to it, , while the second signal frequency was swept down in the range over 100 ms. Figure 18b shows the frequency response of actuator II tip displacement under seven levels of the second signal voltage amplitude while the amplitude of the first amplifier signal was held constant V. The maximum measured tip displacement was nm for a voltage amplitude of V, corresponding to 0.255% of the air gap.
Similar to the case of actuator , the realized tip displacement using the larger inductor was greater than that observed with the smaller inductor, thus confirming our earlier hypothesis. Figure 18b also incorporates a frequency–response curve with a lower amplifier voltage amplitude of V and an actuation voltage amplitude of V. It can be seen that the response in this case is comparable to that of the higher amplifier voltage under a smaller actuation voltage of V, which confirms the efficacy of the amplifier circuit.
Next, we tested the use of a lower electric resonance to drive the actuator via the electrostatic force of the frequency sum . Actuator was connected in series to a large inductor, made of two inductors mH and mH connected in series, resulting in an estimated electrical resonance of kHz, Figure 10a. The electrical resonance was found to be kHz using the drive setup. The first signal frequency was set equal to the electrical resonance while the second signal frequency was swept up in the range kHz over 100 ms, so that the frequency sum was swept past the mechanical resonance in the range MHz.
The frequency–response curves of actuator tip displacement are shown in Figure 19 for four values of the second signal voltage amplitude while the amplifier voltage amplitude was held constant at V. The largest displacement in this case was nm, realized at resonance for a voltage amplitude of V, corresponding to 0.235% of the air gap.
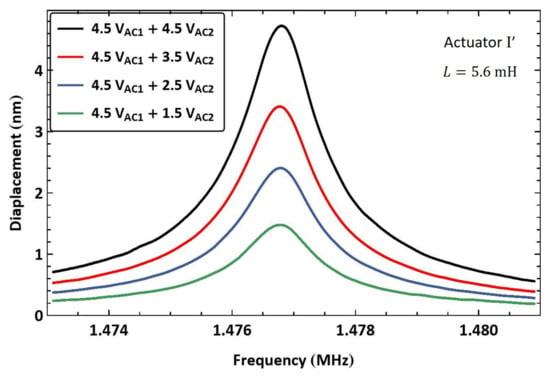
Figure 19.
The frequency response of actuator tip displacement under multi-frequency excitation ( kHz).
3.4.5. Amplitude Modulation
In this excitation scheme, we utilize an amplitude-modulated signal, resulting in an electrostatic force of the form
The drive signal, shown in Figure 20, is the product of an RF carrier signal with a frequency and a baseband signal with a frequency . Given that is, by definition, much larger than , the actuator acts as a low-pass filter, thereby attenuating the higher frequency forces at , , and . To guarantee this, the RF carrier frequency is typically set in the range of 3–100[]. On the other hand, the actuator follows the electrostatic force generated by the envelope of the signal. Provided that we set , the force at , which is proportional to as per Equation (12), can be used as the dominant excitation force. The ratio between the two amplitudes
is the signal modulation index.

Figure 20.
Representations of the amplitude-modulated signal in (a) the time and (b) frequency domains. is the carrier frequency and is the baseband frequency.
The RLC circuit was tuned to set the electrical resonance frequency higher than that of the actuator using a small external inductor µH connected in series with actuator . The resulting electrical resonance was measured as MHz using the technique described in Section 3.4.4. The carrier signal frequency was set to match the electrical resonance , while the frequency of the baseband signal was swept up past the mechanical resonance in the range MHz over 100 ms.
Figure 21a shows the frequency response of actuator tip displacement under six levels of the second voltage amplitude , while the amplitude of the first (amplifier) signal is held constant at V. The maximum displacement realized was nm observed at resonance MHz under a second voltage amplitude of V (a modulation index of ), which is 0.99% of the air gap.
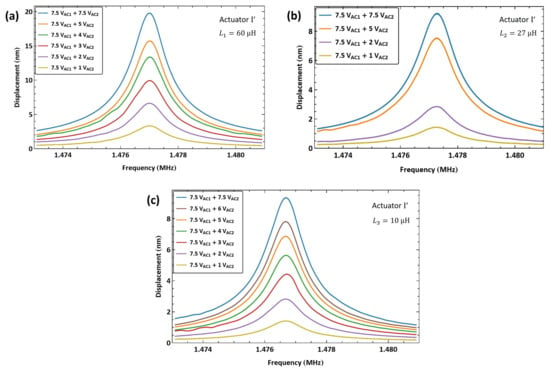
Figure 21.
The frequency response of actuator tip displacement under excitation with an amplitude-modulated signal where the carrier frequency is set to (a) MHz, (b) MHz, and (c) MHz.
To test the flexibility of this technique, we tuned the electrical resonance to a higher value by using a smaller external inductor µH. As a result, the electrical resonance increased to MHz. Figure 21b shows the frequency response of actuator under four levels of the second voltage amplitude while the amplifier signal amplitude is held constant at V. The maximum measured displacement was nm for a voltage amplitude of V, corresponding to 0.46% of the air gap.
A third inductor µH was also used with actuator to set the electrical resonance to MHz. Figure 21c shows the frequency response of actuator I under seven levels of the second signal voltage amplitude while the amplifier signal amplitude is held constant at V. The maximum measured displacement was nm for a voltage amplitude of V, corresponding to 0.47% of the air gap. The smaller displacements realized in the last two cases compared to the case of the first case, with the larger inductor, confirms our hypothesis above that the ESR of inductors at an µH level is negligible compared to the other circuit losses, which allows the larger inductance of to improve the overall circuit quality factor .
We applied the same excitation technique to actuator II to verify the scheme repeatability. An external inductor µH was connected in series with the actuator, resulting in an electrical resonance at MHz. The difference between the electrical resonance in this case and that in actuator case is due to inter-inductor variability and variations in the circuit wiring. The baseband signal frequency was swept up in the range MHz. Figure 22a shows the frequency–response curves under eight levels of the second voltage amplitude . The maximum tip displacement achieved was nm at resonance MHz for a second voltage amplitude of V, which is 0.395% of the air gap.

Figure 22.
The frequency response of actuator II tip displacement under excitation with an amplitude-modulated signal where the carrier frequency is set to (a) MHz and (b) MHz.
For comparison, the figure also incorporates a frequency–response curve with a lower amplifier voltage amplitude of V and a second voltage amplitude of V. It can be seen that the response in the latter case is comparable to that of the higher amplifier voltage under a much smaller second voltage of V, thereby demonstrating the efficacy of the amplifier circuit.
The smaller µH inductor was connected in series with actuator II, resulting in an electrical resonance of MHz. Figure 22b shows the frequency–response curves of the tip displacement for seven levels of the second voltage amplitude . The largest measured RMS displacement was nm at resonance for the second voltage amplitude of V, corresponding to 0.23% of the air gap. The results also confirm that larger inductors result in higher amplification (larger ) for µH-sized inductors.
Figure 22b also incorporates a frequency–response curve with a lower amplifier voltage amplitude of V and a second voltage amplitude of V. It can be seen that the response in this case falls between those for the smaller voltage amplitudes V and 2 V and the higher amplifier voltage V, further confirming the efficacy of the amplifier circuit.
3.4.6. Comparison Among the Actuation Techniques
To evaluate the performance of the three actuation techniques and compare them, we define a magnification factor
that describes the efficiency of electromechanical coupling between the system input, namely the voltage signal applied to the MEMS circuit, and its output, the measured displacement . To avoid the ambiguity posed by the presence of multiple local maxima in cases where either signal contains more than one frequency, those signals are quantified in terms of their RMS. The magnification factor serves as a figure of merit, allowing us to quantify the relative merits of various actuation schemes in various applications.
The magnification factors realized for actuators I, , and II are listed in Table S1, Table S2, and Table S3, respectively, in the Supplementary Materials. Comparison across the various actuation schemes, as shown in Figure 23, shows that unbiased resonance matching is most effective in achieving the highest magnification factors, nm/V and nm/V compared to magnification factors of nm/V and nm/V for the biased cases in actuators I and II, respectively. This is expected since unbiased resonance matching amplifies input voltage by compared an amplification by only in the biased case.
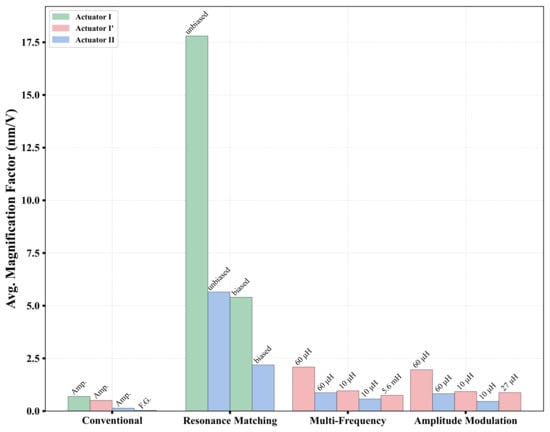
Figure 23.
Comparison of the average magnification factors for different actuation techniques.
The performance of multi-frequency and amplitude modulated actuations is inferior to biased resonance matching, but they are similar to each other with a slight advantage to the former. The advantage of biased resonance matching is due to its actuation voltage benefiting from amplification via the of the RLC circuit and the bias voltage , while the latter two realize their amplification only through the of the RLC circuit. In both multi-frequency and amplitude modulated actuations, lower electrical resonance frequencies (larger inductors) were found to realize better magnification factors. Actuator achieved nm/V at lower frequency, MHz, compared to nm/V at higher frequency, MHz. Similarly, actuator II exhibited an improvement from nm/V at higher frequency , MHz, to nm/V at lower frequency, MHz. For amplitude modulation, a similar trend was observed, with actuator achieving nm/V at lower versus nm/V at a higher . Actuator II followed the same pattern, with improving from nm/V at higher to nm/V at lower .
Finally, we observe that the magnification factor of actuator I under voltage amplifier actuation was nm/V compared to nm/V for actuator II under the same actuation scheme. The discrepancy in the magnification factor between the two actuators is probably due to the higher stiffness of actuator II.
4. Conclusions
The relative merits of three resonant drive methods have been investigated and compared with a view to reducing the high voltage requirements of electrostatic MEMS actuators. As a ground truth measure, the three methods were compared to conventional actuation using a function generator and voltage amplifier. Furthermore, a coupled electromechanical model was introduced to interpret the response of the actuator in conjunction with the resonant drive circuit.
We found that resonant circuits are more effective at amplifying the MEMS response than voltage amplifiers in the high frequency range (>1 MHz). At lower frequencies, voltage amplifiers are more flexible and stable, whereas resonant circuits suffered larger losses due to the associated parasitic capacitance. Moreover, we found that multi-frequency and amplitude modulation techniques are more flexible and easier to adjust compared to resonance matching. However, resonance matching is more effective for unbiased (AC) excitation as it results in higher voltage amplification (proportional to ) than the other two techniques or resonance matching with a biased signal, where voltage amplification was only proportional to . We also conclude that using biased signals with any of the resonant drive techniques is ineffective for the purposes of amplification. While it can be used to tune the MEMS nonlinearity, it should be noted that it may also result in dielectric charging.
The inefficiency of resonant circuits at low frequencies meant that actuation using the additive version of the multi-frequency excitation technique proved ineffective in the case of the actuator under study. However, this version of the multi-frequency excitation technique should be practical for higher-frequency actuators. For example, we employed it to locate the second out-of-plane bending mode of actuator shown in Figure 24. We found indications of an interaction between the second in-plane and out-of-plane bending modes under the additive version of multi-frequency excitation with an external inductor µH, where the first signal frequency was set to MHz and the second signal frequency was swept in the range MHz. We observed two peaks in the frequency response of actuator within this frequency range, suggesting the presence of two distinct vibration modes.
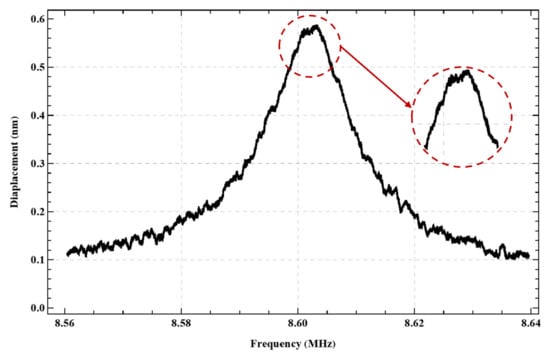
Figure 24.
Frequency response of the second out-of-plane bending mode of actuator .
Nevertheless, multi-frequency excitation presents additional challenges compared to the other two techniques, particularly in signal generation and system implementation. Unlike amplitude modulation, where the carrier frequency provides a fixed reference for the baseband signal , multi-frequency signal generation requires each frequency component to be independently generated and precisely tuned.
Although both amplitude-modulated and multi-frequency signals have multiple frequency components, their implementation differs significantly. The former is often simpler, as it can be achieved using a single DDS with internal programmable amplitude control (e.g., AD9854). In contrast, generating a stable multi-frequency signal typically requires either two separate DDS chips or a multi-channel DDS (e.g., AD9959), along with a summation circuit to combine the signals, increasing the system complexity.
While we assumed in our comparison that the amplification of the RLC circuit is constant and equal to the electrical quality factor across the entire frequency range of interest, this assumption holds only when the mechanical quality factor is much larger than the electrical quality factor []. This was true in the actuators used in this study but is not in general true. Where the two quality factors are of the same order, they would continue to be decoupled under multi-frequency and amplitude modulation techniques, but the amplification factor will vary over the relevant frequency range (half-power bandwidth) of the MEMS under the resonance matching technique.
Other limitations of resonant circuits include the presence of parasitic capacitance and inductance, which can significantly mistune the circuit and require online tuning. Parasitic capacitance can also introduce signal leakage and crosstalk and degrade the electrical quality factor. Additionally, as frequency increases, the signal may approach the system’s cutoff frequency, beyond which the signal will attenuate.
Furthermore, the skin effect becomes more pronounced at high frequencies, causing AC currents to concentrate near the conductor’s surface. This increases resistance, resulting in additional losses that degrade the performance []. Similarly, on-chip inductors typically exhibit lower quality factors () compared to off-chip inductors.
Supplementary Materials
The following supporting information can be downloaded at https://www.mdpi.com/article/10.3390/s25061719/s1.
Author Contributions
Conceptualization, R.A., A.E. and E.M.A.-R.; methodology, R.A. and A.E.; software, A.E.; formal analysis, R.A.; investigation, R.A., A.E., Y.S.S., M.A. and A.J.; writing—original draft preparation, R.A.; writing—review and editing, R.A. and E.M.A.-R.; visualization, R.A. and D.O.; supervision, E.M.A.-R. and M.Y. All authors have read and agreed to the published version of the manuscript.
Funding
We would like to acknowledge CMC Microsystems for the provision of products and services that facilitated this research, including CAD tools and fabrication services.
Institutional Review Board Statement
Not applicable.
Informed Consent Statement
Not applicable.
Data Availability Statement
The raw data supporting the conclusions of this article will be made available by the authors on request.
Conflicts of Interest
The authors declare no conflicts of interest. The funders had no role in the design of the study; in the collection, analyses, or interpretation of data; in the writing of the manuscript; or in the decision to publish the results.
References
- Kaajakari, V. Practical MEMS; Small Gear: Las Vegas, NV, USA, 2009. [Google Scholar]
- Younis, M.I. MEMS Linear and Nonlinear Statics and Dynamics; Springer Science & Business Media: New York, NY, USA, 2011. [Google Scholar]
- Shama, Y.S.; Rahmanian, S.; Mouharrar, H.; Abdelrahman, R.; Elhady, A.; Abdel-Rahman, E.M. Unraveling the Nature of Sensing in Electrostatic MEMS Gas Sensors. Microsyst. Nanoeng. 2024, 10, 56. [Google Scholar] [CrossRef] [PubMed]
- Pengwang, E.; Rabenorosoa, K.; Rakotondrabe, M.; Andreff, N. Scanning Micromirror Platform Based on MEMS Technology for Medical Application. Micromachines 2016, 7, 24. [Google Scholar] [CrossRef] [PubMed]
- Huang, X.M.H.; Manolidis, M.; Jun, S.C.; Hone, J. Nanomechanical Hydrogen Sensing. Appl. Phys. Lett. 2005, 86, 143104. [Google Scholar] [CrossRef]
- Li, E.; Jian, J.; Yang, F.; Ma, Z.; Hao, Y.; Chang, H. Characterization of Sensitivity of Time Domain MEMS Accelerometer. Micromachines 2024, 15, 227. [Google Scholar] [CrossRef]
- Chen, L.-T.; Lee, C.-Y.; Cheng, W.-H. MEMS-Based Humidity Sensor with Integrated Temperature Compensation Mechanism. Sens. Actuators A Phys. 2008, 147, 522–528. [Google Scholar] [CrossRef]
- Asri, M.I.A.; Hasan, M.N.; Fuaad, M.R.A.; Yunos, Y.M.; Ali, M.S.M. MEMS Gas Sensors: A Review. IEEE Sens. J. 2021, 21, 18381–18397. [Google Scholar] [CrossRef]
- Mi, J.; Wang, Q.; Han, X. Low-Cost MEMS Gyroscope Performance Improvement under Unknown Disturbances through Deep Learning-Based Array. Sens. Actuators A Phys. 2024, 368, 115086. [Google Scholar] [CrossRef]
- Sattler, R.; Plötz, F.; Fattinger, G.; Wachutka, G. Modeling of an electrostatic torsional actuator: Demonstrated with an RF MEMS switch. Sens. Actuators A Phys. 2002, 97, 337–346. [Google Scholar] [CrossRef]
- Hossain, M.I.; Zahid, M.S.; Chowdhury, M.A.; Hossain, M.M.M.; Hossain, N. MEMS-Based Energy Harvesting Devices for Low-Power Applications—A Review. Results Eng. 2023, 19, 101264. [Google Scholar] [CrossRef]
- Chuang, W.-C.; Lee, H.-L.; Chang, P.-Z.; Hu, Y.-C. Review on the Modeling of Electrostatic MEMS. Sensors 2010, 10, 6149–6171. [Google Scholar] [CrossRef]
- Zhang, W.-M.; Yan, H.; Peng, Z.-K.; Meng, G. Electrostatic Pull-In Instability in MEMS/NEMS: A Review. Sens. Actuators A Phys. 2014, 214, 187–218. [Google Scholar] [CrossRef]
- Algamili, A.S.; Khir, M.H.M.; Dennis, J.Q.; Ahmed, A.Y.; Alabsi, S.S.; Ba Hashwan, S.S.; Junaid, M.M. A Review of Actuation and Sensing Mechanisms in MEMS-Based Sensor Devices. Nanoscale Res. Lett. 2021, 16, 16. [Google Scholar] [CrossRef] [PubMed]
- Jaber, N.; Ramini, A.; Carreno, A.A.A.; Younis, M.I. Higher order modes excitation of electrostatically actuated clamped–clamped microbeam experimental and analytical investigation. J. Micromech. Microeng. 2016, 26, 025008. [Google Scholar] [CrossRef]
- Nayfeh, A.H.; Younis, M.I. Dynamics of MEMS resonators under superharmonic and subharmonic excitations. J. Micromech. Microeng. 2005, 15, 1840. [Google Scholar] [CrossRef]
- Shama, Y.S.; Abdelrahman, R.; Arabi, M.; Saritas, R.; Rahmanian, S.; Gulsaran, A.; Kocer, S.; Elhady, A.; Mouharrar, H.; Abdel- Rahman, E.M. A Comparative Study of Two Types of Bifurcation-Based MEMS Sensors. In Advances in Nonlinear Dynamics, Volume III, Proceedings of the ICNDA 2023, NODYCON Conference; Rome, Italy, 18–22 June 2023, Lacarbonara, W., Ed.; Springer Nature: Cham, Switzerland, 2024; pp. 15–24. [Google Scholar] [CrossRef]
- Park, S.; Bai, Y.; Yeow, J.T.W. Design and Analysis of Resonant Drive Circuit for Electrostatic Actuators. In Proceedings of the 2010 International Symposium on Optomechatronic Technologies, Toronto, ON, Canada, 25–27 October 2010; pp. 1–6. [Google Scholar] [CrossRef]
- Park, S.; Abdel-Rahman, E. Low Voltage Electrostatic Actuation and Displacement Measurement Through Resonant Drive Circuit. In Proceedings of the ASME 2012 International Design Engineering Technical Conferences & Computers and Information in Engineering Conference, Chicago, IL, Canada, 12–15 October 2012; pp. 119–126. [Google Scholar] [CrossRef]
- Park, S.; Pallapa, M.; Yeow, J.T.W.; Abdel-Rahman, E. Low Voltage Electrostatic Actuation and Angular Displacement Measurement of Micromirror Coupled with Resonant Drive Circuit. In Proceedings of the IECON 2012—38th Annual Conference on IEEE Industrial Electronics Society, Montreal, QC, Canada, 25–28 October 2012; pp. 3976–3981. [Google Scholar] [CrossRef]
- Park, S.; Khater, M.; Abdel-Rahman, E. Low Voltage Electrostatic Actuation for MEMS Actuator Using Frequency Modulation. In Proceedings of the ASME 2013 International Design Engineering Technical Conferences and Computers and Information in Engineering Conference, Portland, Oregon, USA, 4–7 August 2013. [Google Scholar] [CrossRef]
- Chung, S.-R.; Abdel-Rahman, E.M.; Yeow, J. A MEMS Analog Demodulator. In Proceedings of the IECON 2012—38th Annual Conference on IEEE Industrial Electronics Society, Montreal, QC, Canada, 25–28 October 2012; pp. 3946–3951. [Google Scholar] [CrossRef]
- Chung, S.R.; Park, S.; Abdel-Rahman, E.M.; Yeow, J.T.; Khater, M. Architecture for MEMS-based analogue demodulation. J. Micromech. Microeng. 2013, 23, 045013. [Google Scholar] [CrossRef]
- Cady, W.G. The Piezo-Electric Resonator. Proc. Inst. Radio Eng. 1922, 10, 83–114. [Google Scholar] [CrossRef]
- Truitt, P.A.; Hertzberg, J.B.; Huang, C.C.; Ekinci, K.L.; Schwab, K.C. Efficient and Sensitive Capacitive Readout of Nanomechanical Resonator Arrays. Nano Lett. 2007, 7, 120–126. [Google Scholar] [CrossRef]
- Alsaleem, F.M.; Hasan, M.H. A Novel Low Voltage Electrostatic MEMS Resonator Sensor Based on Double Resonance Dynamic Amplification. In Proceedings of the ASME 2017 Dynamic Systems and Control Conference, Tysons, VA, USA, 11–13 October 2017; Volume 2. [Google Scholar] [CrossRef]
- Hasan, M.H.; Alsaleem, F.M.; Jaber, N.; Hafiz, M.A.A.; Younis, M.I. Simultaneous Electrical and Mechanical Resonance Drive for Large Signal Amplification of Micro Resonators. Aip Adv. 2018, 8, 015312. [Google Scholar] [CrossRef]
- Jaber, N.; Hafiz, M.A.A.; Kazmi, S.N.R.; Younis, M.I. Efficient Excitation of Micro/Nano Resonators and Their Higher Order Modes. Sci. Rep. 2019, 9, 319. [Google Scholar] [CrossRef]
- Ouakad, H.M.; Hasan, M.H.; Jaber, N.R.; Hafiz, M.A.A.; Alsaleem, F.; Younis, M. On the Double Resonance Activation of Electrostatically Actuated Microbeam-Based Resonators. Int. J. Non-Linear Mech. 2020, 121, 103437. [Google Scholar] [CrossRef]
- Cowen, A.; Hames, G.; Glukh, K.; Hardy, B. PiezoMUMPs™ Design Handbook; MEMSCAP Inc.: Crolles, France, 2014. [Google Scholar]
- Kambali, P.N.; Pandey, A.K. Capacitance and Force Computation Due to Direct and Fringing Effects in MEMS/NEMS Arrays. IEEE Sensors J. 2016, 16, 375–382. [Google Scholar] [CrossRef]
- Polytec Inc. UHF-120 Ultra High Frequency Vibrometer Datasheet. Available online: www.polytec.com (accessed on 9 July 2023).
- Liquid Instruments. Moku:Pro Datasheet. Available online: www.liquidinstruments.com (accessed on 9 July 2023).
- Tabor Electronics Ltd. 400Vp-p Four Channel Signal Amplifier Model 9400 Datasheet. Available online: www.taborelec.com/9400 (accessed on 10 July 2023).
- Polytec Inc. Polytec Scanning Vibrometer Software Manual. Windows. Available online: https://pearl-hifi.com/06_Lit_Archive/05_LDV/Polytec_Software_Manuals/PSV_Software_Ver.8.5.pdf (accessed on 5 March 2025).
- Elhady, A.; Alghamdi, M.S.; Abdel-Rahman, E. Experimental construction of force- and frequency-response curves of nonlinear resonators. Chaos 2023, 33, 063102. [Google Scholar] [CrossRef] [PubMed]
- Ertasgin, G.; Whaley, D.M. Analysis and Optimization of Output Low-Pass Filter for Current-Source Single-Phase Grid-Connected PV Inverters. Appl. Sci. 2024, 14, 10131. [Google Scholar] [CrossRef]
- Polytec Inc. OFV-5000 Vibrometer Controller User Manual. Available online: www.polytec.com (accessed on 31 July 2023).
- Giacoletto, L.J. Frequency-and Time-Domain Analysis of Skin Effects. IEEE Trans. Magn. 1996, 32, 220–229. [Google Scholar] [CrossRef]
Disclaimer/Publisher’s Note: The statements, opinions and data contained in all publications are solely those of the individual author(s) and contributor(s) and not of MDPI and/or the editor(s). MDPI and/or the editor(s) disclaim responsibility for any injury to people or property resulting from any ideas, methods, instructions or products referred to in the content. |
© 2025 by the authors. Licensee MDPI, Basel, Switzerland. This article is an open access article distributed under the terms and conditions of the Creative Commons Attribution (CC BY) license (https://creativecommons.org/licenses/by/4.0/).