

High-Knee-Flexion Posture Recognition Using Multi-Dimensional Dynamic Time Warping on Inertial Sensor Data

 , ,
, ,  ,
,  and
and
Abstract
1. Introduction
2. Materials and Methods
2.1. Participants and Experimental Protocol
2.2. Sensor Signal Processing and Data Labelling
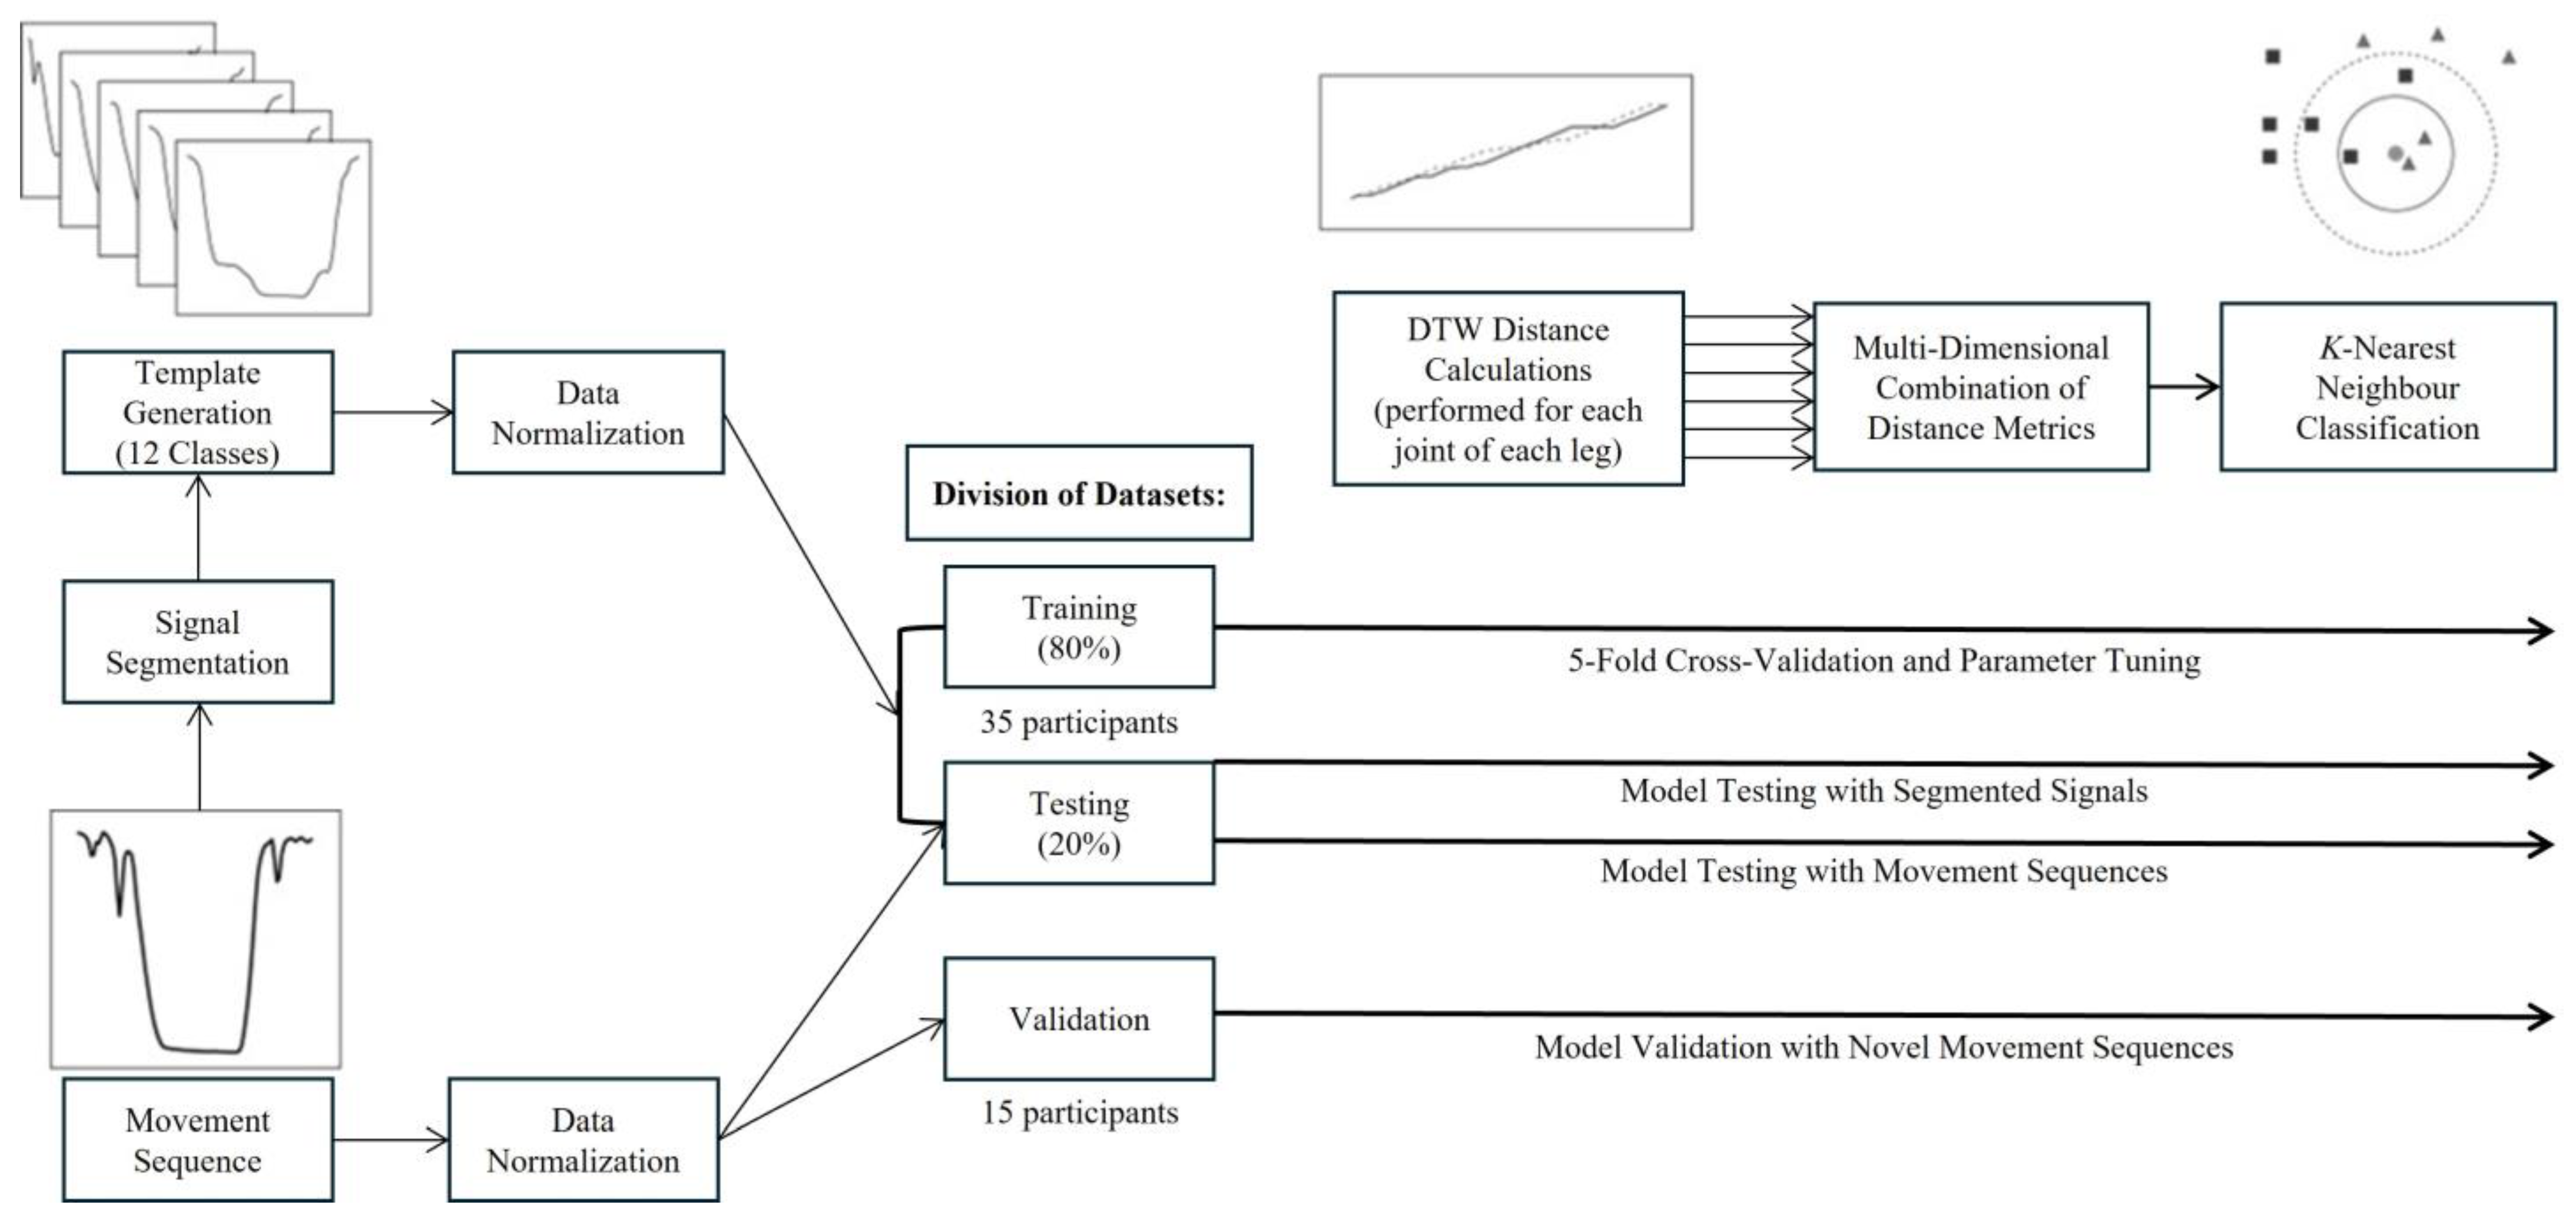
2.3. mDTW Distance Metric Development for kNN Classification
2.4. kNN Classification Algorithm Training and Testing
3. Results
3.1. mDTW kNN Classification Algorithm 5-Fold Cross-Validated Training
3.2. Parameter Tuning and Algorithm Testing
3.3. Algorithm Validation with Novel Participant Data
4. Discussion
4.1. Model Accuracies
4.2. Model Sensitivities
4.3. Model Specificities
4.4. Misclassifications
4.5. Limitations
5. Conclusions
Author Contributions
Funding
Institutional Review Board Statement
Informed Consent Statement
Data Availability Statement
Acknowledgments
Conflicts of Interest
References
- Anderson, J.J.; Felson, D.T. Factors associated with osteoarthritis of the knee in the first national health and nutrition examination survey (Hanes 1). Am. J. Epidemiol. 1988, 128, 179–189. [Google Scholar] [CrossRef] [PubMed]
- Felson, D. Osteoarthritis as a disease of mechanics. Osteoarthr. Cartil. 2013, 21, 10–15. [Google Scholar] [CrossRef] [PubMed]
- Yucesoy, B.; Charles, L.E.; Baker, B.; Burchfiel, C.M. Occupational and genetic risk factors for osteoarthritis: A review. Work 2015, 50, 261–273. [Google Scholar] [CrossRef] [PubMed]
- Andriacchi, T.P.; Mündermann, A.; Smith, R.L.; Alexander, E.J.; Dyrby, C.O.; Koo, S. A framework for the in vivo pathomechanics of osteoarthritis at the knee. Ann. Biomed. Eng. 2004, 32, 447–457. [Google Scholar] [CrossRef] [PubMed]
- Coggon, D.; Croft, P.; Kellingray, S.; Barrett, D.; McLaren, M.; Cooper, C. Occupational physical activities and osteoarthritis of the knee. Arthritis Rheum. 2000, 43, 1443–1449. [Google Scholar] [CrossRef] [PubMed]
- Cooper, C.; McAlindon, T.; Coggon, D.; Egger, P.; Dieppe, P. Occupational activity and osteoarthritis of the knee. Ann. Rheum. Dis. 1994, 53, 90–93. [Google Scholar] [CrossRef]
- Jensen, L.; Rytter, S.; Bonde, J. Exposure assessment of kneeling work activities among floor layers. Appl. Ergon. 2010, 41, 319–325. [Google Scholar] [CrossRef]
- Laudanski, A.F.; Buchman-Pearle, J.M.; Acker, S.M. Quantifying high flexion postures in occupational childcare as they relate to the potential for increased risk of knee osteoarthritis. Ergonomics 2021, 65, 253–264. [Google Scholar] [CrossRef]
- Zhang, Y.; Jordan, J.M. Epidemiology of osteoarthritis. Clin. Geriatr. Med. 2010, 26, 355–369. [Google Scholar] [CrossRef] [PubMed]
- Bauer, C.M.; Heimgartner, M.; Rast, F.M.; Ernst, M.J.; Oetiker, S.; Kool, J. Reliability of lumbar movement dysfunction tests for chronic low back pain patients. Man. Ther. 2016, 24, 81–84. [Google Scholar] [CrossRef]
- Crema, C.; Depari, A.; Flammini, A.; Sisinni, E.; Haslwanter, T.; Salzmann, S. IMU-based solution for automatic detection and classification of exercises in the fitness scenario. In Proceedings of the SAS 2017—2017 IEEE Sensors Applications Symposium (SAS), Glassboro, NJ, USA, 13–15 March 2017; pp. 1–6. [Google Scholar] [CrossRef]
- Kluge, F.; Gaßner, H.; Hannink, J.; Pasluosta, C.; Klucken, J.; Eskofier, B.M. Towards mobile gait analysis: Concurrent validity and test-retest reliability of an inertial measurement system for the assessment of spatio-temporal gait parameters. Sensors 2017, 17, 1522. [Google Scholar] [CrossRef]
- Schall, M.C.; Fethke, N.B.; Chen, H.; Gerr, F. A comparison of instrumentation methods to estimate thoracolumbar motion in field-based occupational studies. Appl. Ergon. 2015, 48, 224–231. [Google Scholar] [CrossRef] [PubMed]
- Ditchen, D.M.; Ellegast, R.P.; Gawliczek, T.; Hartmann, B.; Rieger, M.A. Occupational kneeling and squatting: Development and validation of an assessment method combining measurements and diaries. Int. Arch. Occup. Environ. Health 2014, 88, 153–165. [Google Scholar] [CrossRef] [PubMed]
- Holtermann, A.; Hendriksen, P.F.; Schmidt, K.G.; Svendsen, M.J.; Rasmussen, C.D.N. Physical work demands of childcare workers in Denmark: Device-based measurements and workplace observations among 199 childcare workers from 16 day nurseries. Ann. Work. Expo. Health 2020, 64, 586–595. [Google Scholar] [CrossRef] [PubMed]
- Song, J.; Lee, C.; Lee, W.; Bahn, S.; Jung, C.; Yun, M.H. Development of a job rotation scheduling algorithm for minimizing accumulated work load per body parts. Work 2016, 53, 511–521. [Google Scholar] [CrossRef] [PubMed]
- Yang, D.; Huang, J.; Tu, X.; Ding, G.; Shen, T.; Xiao, X. A wearable activity recognition device using air-pressure and IMU sensors. IEEE Access 2018, 7, 6611–6621. [Google Scholar] [CrossRef]
- Zubair, M.; Song, K.; Yoon, C. Human activity recognition using wearable accelerometer sensors. In Proceedings of the 2016 IEEE International Conference on Consumer Electronics-Asia (ICCE-Asia), Seoul, Republic of Korea, 26–28 October 2016; IEEE: New York, NY, USA; pp. 1–5. [Google Scholar] [CrossRef]
- Preece, S.J.; Goulermas, J.Y.; Kenney, L.P.J.; Howard, D. A comparison of feature extraction methods for the classification of dynamic activities from accelerometer data. IEEE Trans. Biomed. Eng. 2009, 56, 871–879. [Google Scholar] [CrossRef] [PubMed]
- Phinyomark, A.; Phukpattaranont, P.; Limsakul, C. Feature reduction and selection for EMG signal classification. Expert Syst. Appl. 2012, 39, 7420–7431. [Google Scholar] [CrossRef]
- Altun, K.; Barshan, B.; Tunçel, O. Comparative study on classifying human activities with miniature inertial and magnetic sensors. Pattern Recognit. 2010, 43, 3605–3620. [Google Scholar] [CrossRef]
- Bao, L.; Intille, S.S. Activity recognition from user-annotated acceleration data. In Pervasive Computing; Springer: Berlin/Heidelberg, Germany, 2004; pp. 1–17. [Google Scholar] [CrossRef]
- Lin, J.F.-S.; Bonnet, V.; Panchea, A.M.; Ramdani, N.; Venture, G.; Kulic, D. Human motion segmentation using cost weights recovered from inverse optimal control. In Proceedings of the 2016 IEEE-RAS 16th International Conference on Humanoid Robots (Humanoids), Cancun, Mexico, 15–17 November 2016; pp. 1107–1113. [Google Scholar] [CrossRef]
- Barth, J.; Oberndorfer, C.; Pasluosta, C.; Schülein, S.; Gassner, H.; Reinfelder, S.; Kugler, P.; Schuldhaus, D.; Winkler, J.; Klucken, J.; et al. Stride segmentation during free walk movements using multi-dimensional subsequence dynamic time warping on inertial sensor data. Sensors 2015, 15, 6419–6440. [Google Scholar] [CrossRef]
- Chang, H.-C.; Hsu, Y.-L.; Yang, S.-C.; Lin, J.-C.; Wu, Z.-H. A wearable inertial measurement system with complementary filter for gait analysis of patients with stroke or Parkinson’s disease. IEEE Access 2016, 4, 8442–8453. [Google Scholar] [CrossRef]
- Kim, M.; Cho, J.; Lee, S.; Jung, Y. IMU sensor-based hand gesture recognition for human-machine interfaces. Sensors 2019, 19, 3827. [Google Scholar] [CrossRef] [PubMed]
- Kaya, H.; Gündüz-Öğüdücü, Ş. A distance based time series classification framework. Inf. Syst. 2015, 51, 27–42. [Google Scholar] [CrossRef]
- Veltink, P.; Bussmann, H.; de Vries, W.; Martens, W.; Van Lummel, R. Detection of static and dynamic activities using uniaxial accelerometers. IEEE Trans. Rehabil. Eng. 1996, 4, 375–385. [Google Scholar] [CrossRef]
- Qiu, S.; Liu, L.; Zhao, H.; Wang, Z.; Jiang, Y. MEMS inertial sensors based gait analysis for rehabilitation assessment via multi-sensor fusion. Micromachines 2018, 9, 442. [Google Scholar] [CrossRef] [PubMed]
- Mekruksavanich, S.; Jitpattanakul, A.; Youplao, P.; Yupapin, P. enhanced hand-oriented activity recognition based on smartwatch sensor data using LSTMS. Symmetry 2020, 12, 1570. [Google Scholar] [CrossRef]
- Barth, J.; Oberndorfer, C.; Kugler, P.; Schuldhaus, D.; Winkler, J.; Klucken, J.; Eskofier, B. Subsequence dynamic time warping as a method for robust step segmentation using gyroscope signals of daily life activities. In Proceedings of the 35th Annual International Conference of the IEEE Engineering in Medicine and Biology Society, EMBC, Osaka, Japan, 3–7 July 2013; pp. 6744–6747. [Google Scholar]
- Paiyarom, S.; Tungamchit, P.; Keinprasit, R.; Kayasith, P. Activity monitoring system using dynamic time warping for the elderly and disabled people. In Proceedings of the 2009 2nd International Conference on Computer, Control and Communication (IC$), Karachi, Pakistan, 17–18 February 2009; IEEE: New York, NY, USA; pp. 1–4. [Google Scholar]
- Muscillo, R.; Conforto, S.; Schmid, M.; Caselli, P.; D’Alessio, T. Classification of motor activities through derivative dynamic time warping applied on accelerometer data. In Proceedings of the 29th Annual International Conference of the IEEE Engineering in Medicine and Biology Society, Lyon, France, 22–26 August 2007; pp. 4930–4933. [Google Scholar]
- Laudanski, A.F. Development of a Wearable Sensor-Based Framework for the Classification and Quantification of High Knee Flexion Exposures in Childcare. Ph.D. Thesis, University of Waterloo, Waterloo, ON, Canada, December 2022. [Google Scholar]
- Madhu-Das, C.; Srichand, P. Maternal mortality and morbidity due to induced abortion in Hyderabad. J. Liaquat Univ. Med. Health Sci. 2006, 5, 62–65. [Google Scholar] [CrossRef]
- Laudanski, A.F.; Küderle, A.; Kluge, F.; Eskofier, B.; Acker, S.M. Enhancing Automatic Inertial Sensor Calibration Algorithm for Accurate Joint Angle Estimation in High Flexion Postures. IEEE Sens. J. 2024, 24, 26542–26551. [Google Scholar] [CrossRef]
- Seel, T.; Raisch, J.; Schauer, T. IMU-based joint angle measurement for gait analysis. Sensors 2014, 14, 6891–6909. [Google Scholar] [CrossRef] [PubMed]
- Küderle, A.; Becker, S.; Disselhorst-Klug, C. Increasing the robustness of the automatic IMU calibration for lower extremity motion analysis. Curr. Dir. Biomed. Eng. 2018, 4, 439–442. [Google Scholar] [CrossRef]
- Theodoridis, S.; Koutroumbas, K. Pattern Recognition, 2nd ed.; Elsevier: Amsterdam, The Netherlands, 2003. [Google Scholar]
- Sakoe, H.; Chiba, S. Dynamic programming algorithm optimization for spoken word recognition. IEEE Trans. Acoust. 1978, 26, 43–49. [Google Scholar] [CrossRef]
- Paliwal, K.; Agarwal, A.; Sinha, S.S. A modification over Sakoe and Chiba’s dynamic time warping algorithm for isolated word recognition. Signal Process. 1982, 4, 329–333. [Google Scholar] [CrossRef]
- Webb, A.R.; Copsey, K.D. Statistical Pattern Recognition, 3rd ed.; Wiley: Hoboken, NJ, USA, 2011. [Google Scholar]
- Lin, J.F.-S.; Joukov, V.; Kulić, D. Classification-based Segmentation for Rehabilitation Exercise Monitoring. J. Rehabil. Assist. Technol. Eng. 2018, 5, 2055668318761523. [Google Scholar] [CrossRef] [PubMed]
- Roscher, R.; Bohn, B.; Duarte, M.F.; Garcke, J. Explainable machine learning for scientific insights and discoveries. IEEE Access 2020, 8, 42200–42216. [Google Scholar] [CrossRef]
- Cho, Y.J.; Kim, J.Y. The effects of load, flexion, twisting and window size on the stationarity of trunk muscle EMG signals. Int. J. Ind. Ergon. 2012, 42, 287–292. [Google Scholar] [CrossRef]
- Choi, A.; Jung, H.; Mun, J.H. Single inertial sensor-based neural networks to estimate COM-COP inclination angle during walking. Sensors 2019, 19, 2974. [Google Scholar] [CrossRef] [PubMed]
- Hsu, C.-W.; Lin, C.-J. A comparison of model selection methods for multi-class support vector machines. IEEE Trans. Neural Netw. 2002, 13, 415–425. [Google Scholar] [CrossRef]
- Wang, F.-C.; Chen, S.-F.; Lin, C.-H.; Shih, C.-J.; Lin, A.-C.; Yuan, W.; Li, Y.-C.; Kuo, T.-Y. Detection and classification of stroke gaits by deep neural networks employing inertial measurement units. Sensors 2021, 21, 1864. [Google Scholar] [CrossRef]
- Zimmermann, T.; Taetz, B.; Bleser, G. IMU-to-segment assignment and orientation alignment for the lower body using deep learning. Sensors 2018, 18, 302. [Google Scholar] [CrossRef]
- Doshi-Velez, F.; Kim, B. Towards a rigorous science of interpretable machine learning. arXiv 2017, arXiv:1702.08608v2. [Google Scholar]
- Vilone, G.; Longo, L. Classification of explainable artificial intelligence methods through their output formats. Mach. Learn. Knowl. Extr. 2021, 3, 615–661. [Google Scholar] [CrossRef]
- Switonski, A.; Josinski, H.; Wojciechowski, K. Dynamic time warping in classification and selection of motion capture data. Multidimens. Syst. Signal Process. 2018, 30, 1437–1468. [Google Scholar] [CrossRef]


| Motions | Description |
|---|---|
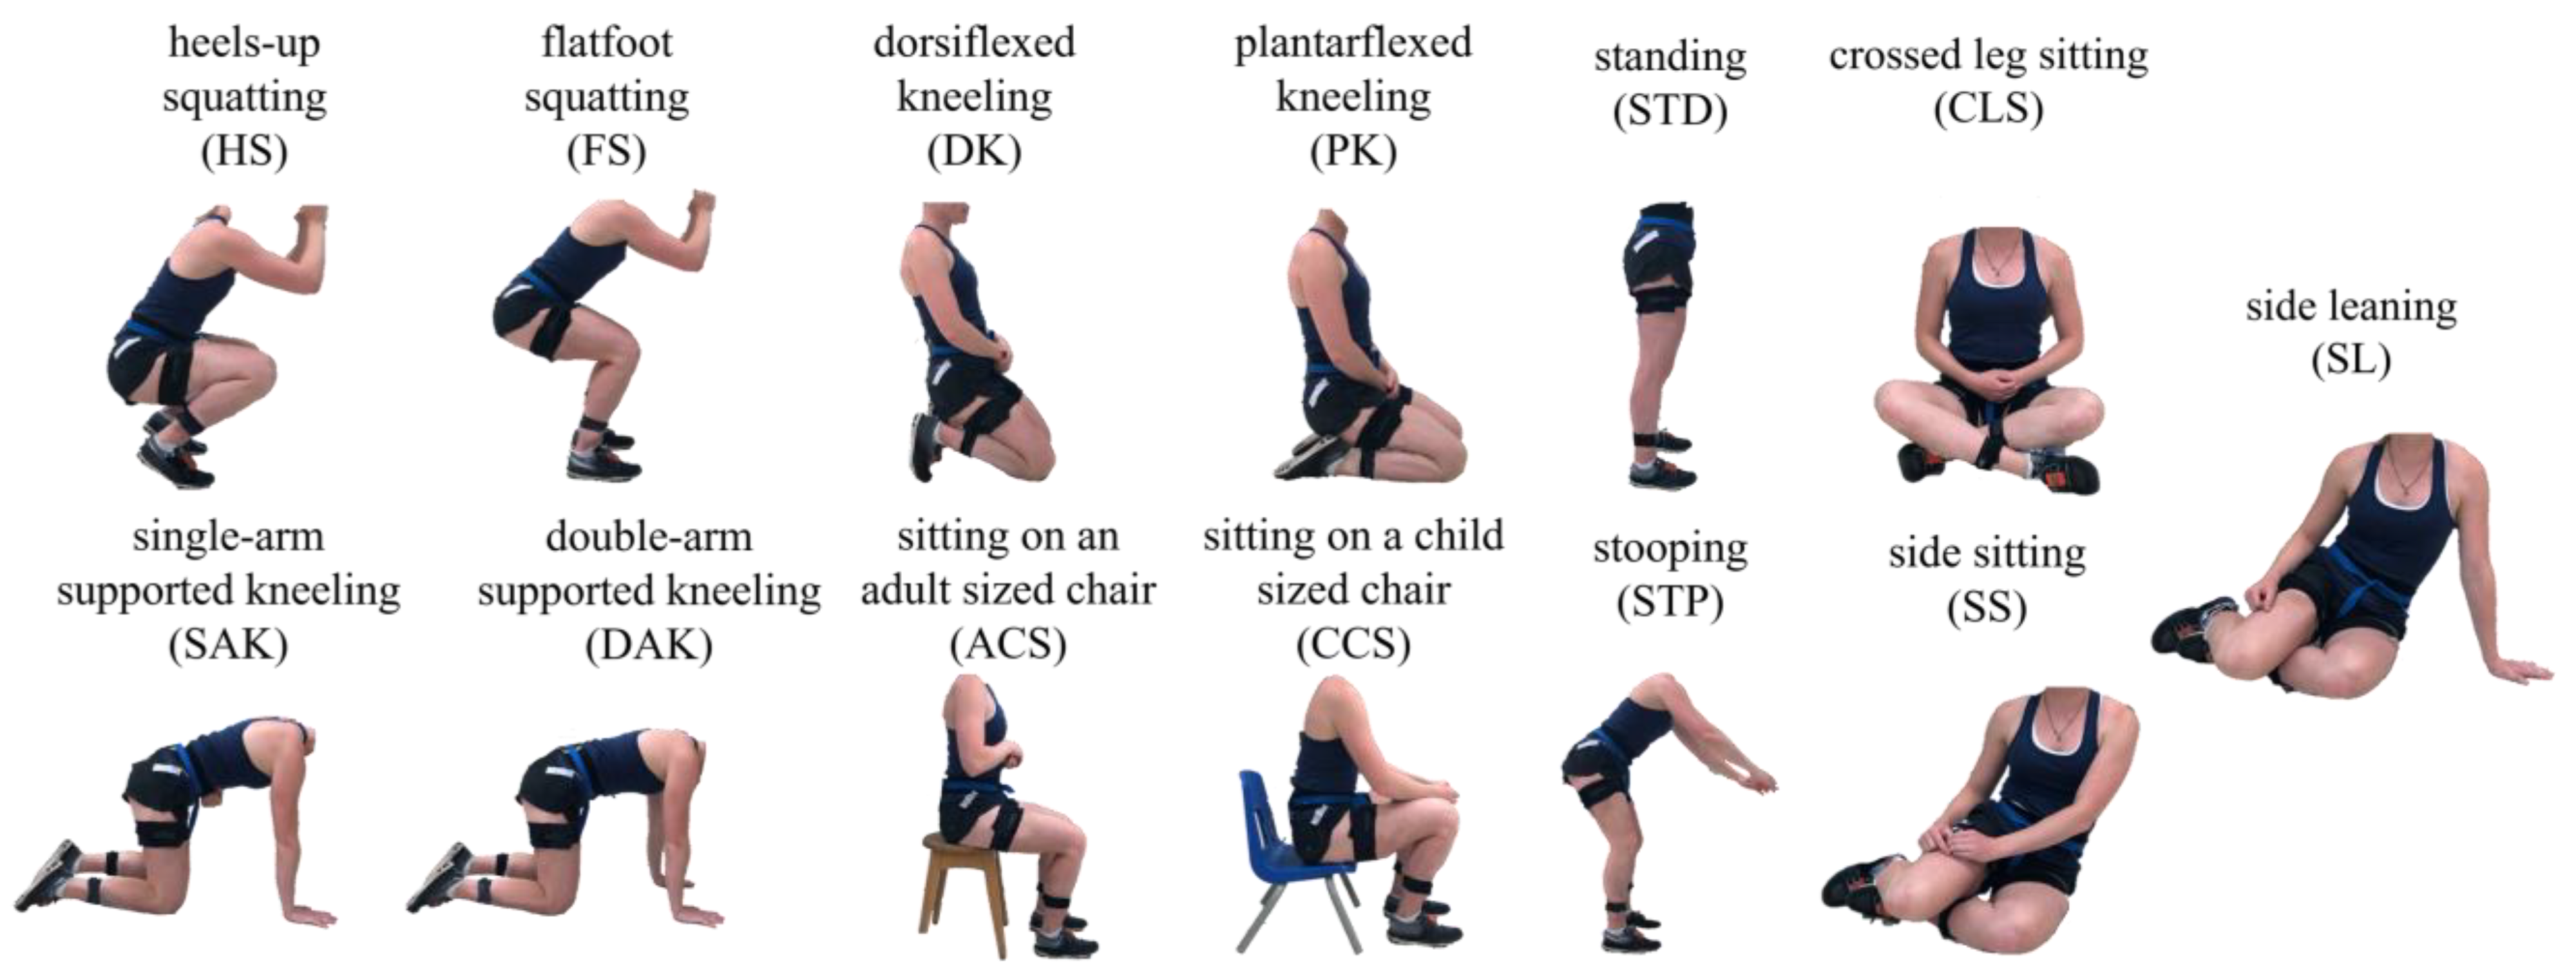
| Heels-Up Squatting (HS) | Forefeet are in contact with the ground, at hip width or greater distance apart, while the heels are raised. The knees are anterior to the feet while the buttocks rest as close to the heels as possible, with the chest raised such that the shoulders are roughly superior to the feet. |
| Flatfoot Squatting (FS) | Feet are flat on the ground, at hip width or greater distance apart. The knees are driving toward the shoulders, located superiorly yet in line with the feet, while the tailbone is typically pointed to the ground. |
| Dorsiflexed Kneeling (DK) | Symmetrical kneeling, with flexed forefeet, so that the inferior aspect of the head of the metatarsals and the plantar aspect of the toes are in contact with the ground. The buttocks rest as close to the heels as possible and the torso is perpendicular with the ground. |
| Plantarflexed Kneeling (PK) | Symmetrical kneeling, where the superior aspect of the foot is in contact with the ground, the buttocks rest as close to the heels as possible, and the torso is perpendicular with the ground. |
| Single Arm Supported Kneeling (SAK) | Both knees and the dominant hand are in contact with the ground, roughly inferior to the hips and shoulder, respectively. Body weight is evenly distributed between all three contact points. Foot position was not controlled in this posture. |
| Double Arm Supported Kneeling (DAK) | Similar to SAK with both hands in contact with the ground, so that the body weight is evenly distributed between the four contact points. Again, foot position was not controlled in this posture. |
| Sitting on an Adult-Sized Chair (ACS) | Buttocks are seated on an adult-sized stool wherein the seat pan height is roughly at knee level. Both feet are planted on the ground inferior to the knees. |
| Sitting on a Child-Sized Chair (CCS) | Buttocks are seated on a child-sized chair wherein the seat pan height is below knee level. Both feet are planted on the ground inferior to the knees. |
| Crossed Leg Sitting (CLS) | Buttocks are seated on the ground. Legs are bent so that the feet are crossed in front of the body. Participants were permitted to use their hands when descending into and rising from the posture as needed. |
| Side Sitting (SS) | Similar to a kneeling posture, however, the buttocks have moved laterally from the heels so that one hip rests on the ground while hands rest on the superior thigh. This posture was performed to both the left and right sides. |
| Side Leaning (SL) | Similar to the side sitting posture, with a single hand in contact with the ground, roughly inferior to the shoulder, for additional support. |
| Stooping (STP) | Movement primarily involving a hinge about the hips. The knee flexion angle typically does not exceed 90°. Participants were instructed to perform this task as if they were reaching to lift a child or object from an estimated height of 0.5 m above the floor. |
| Standing (STD) | Participants were asked to stand with arms crossed across the chest and lower limbs stacked such that the ankles and knees were roughly inferior to the hips. |
| A | |||||||||||||
| Five-Fold Cross-Validated kNN on Training Data | |||||||||||||
| Target Class * | DK | 71.8 | 10.3 | 5.1 | 5.1 | 2.6 | 0.0 | 5.1 | 0.0 | 0.0 | 0.0 | 0.0 | 0.0 |
| PK | 0.0 | 100 | 0.0 | 0.0 | 0.0 | 0.0 | 0.0 | 0.0 | 0.0 | 0.0 | 0.0 | 0.0 | |
| FS | 0.0 | 0.0 | 81.6 | 10.5 | 5.3 | 2.6 | 0.0 | 0.0 | 0.0 | 0.0 | 0.0 | 0.0 | |
| HS | 0.0 | 0.0 | 27.0 | 64.9 | 5.4 | 2.7 | 0.0 | 0.0 | 0.0 | 0.0 | 0.0 | 0.0 | |
| CCS | 2.6 | 0.0 | 0.0 | 0.0 | 68.4 | 26.3 | 0.0 | 0.0 | 0.0 | 0.0 | 2.6 | 0.0 | |
| ACS | 0.0 | 0.0 | 0.0 | 2.6 | 5.3 | 92.1 | 0.0 | 0.0 | 0.0 | 0.0 | 0.0 | 0.0 | |
| SK | 7.3 | 2.4 | 2.4 | 0.0 | 2.4 | 0.0 | 82.9 | 0.0 | 0.0 | 0.0 | 2.4 | 0.0 | |
| STP | 4.8 | 0.0 | 4.8 | 19.0 | 0.0 | 0.0 | 0.0 | 71.4 | 0.0 | 0.0 | 0.0 | 0.0 | |
| STD | 0.0 | 0.0 | 0.0 | 5.6 | 0.0 | 5.6 | 0.0 | 11.1 | 77.8 | 0.0 | 0.0 | 0.0 | |
| CLS | 3.4 | 3.4 | 0.0 | 3.4 | 0.0 | 0.0 | 3.4 | 0.0 | 0.0 | 72.4 | 13.8 | 0.0 | |
| SS | 1.7 | 0.8 | 0.0 | 0.0 | 1.7 | 0.8 | 1.7 | 0.0 | 0.0 | 5.0 | 88.2 | 0.0 | |
| WLK | 0.0 | 0.0 | 0.0 | 0.0 | 0.0 | 0.0 | 0.0 | 0.0 | 0.0 | 0.0 | 0.0 | 100 | |
| DK | PK | FS | HS | CCS | ACS | SK | STP | STD | CLS | SS | WLK | ||
| Output Class ** | |||||||||||||
| B | |||||||||||||
| Tuned Parameter kNN on Segmented Testing Data | |||||||||||||
| Target Class | DK | 76.9 | 5.1 | 5.1 | 2.6 | 5.1 | 0.0 | 5.1 | 0.0 | 0.0 | 0.0 | 0.0 | 0.0 |
| PK | 0.0 | 100 | 0.0 | 0.0 | 0.0 | 0.0 | 0.0 | 0.0 | 0.0 | 0.0 | 0.0 | 0.0 | |
| FS | 0.0 | 0.0 | 81.6 | 13.2 | 2.6 | 2.6 | 0.0 | 0.0 | 0.0 | 0.0 | 0.0 | 0.0 | |
| HS | 0.0 | 0.0 | 24.3 | 73.0 | 2.7 | 0.0 | 0.0 | 0.0 | 0.0 | 0.0 | 0.0 | 0.0 | |
| CCS | 2.6 | 0.0 | 0.0 | 0.0 | 68.4 | 26.3 | 0.0 | 0.0 | 0.0 | 0.0 | 2.6 | 0.0 | |
| ACS | 0.0 | 2.6 | 0.0 | 2.6 | 2.6 | 92.1 | 0.0 | 0.0 | 0.0 | 0.0 | 0.0 | 0.0 | |
| SK | 7.3 | 0.0 | 2.4 | 0.0 | 2.4 | 0.0 | 85.4 | 0.0 | 0.0 | 0.0 | 2.4 | 0.0 | |
| STP | 4.8 | 0.0 | 9.5 | 9.5 | 0.0 | 0.0 | 0.0 | 76.2 | 0.0 | 0.0 | 0.0 | 0.0 | |
| STD | 0.0 | 0.0 | 0.0 | 0.0 | 5.6 | 0.0 | 0.0 | 5.6 | 61.1 | 5.6 | 22.2 | 0.0 | |
| CLS | 0.0 | 3.4 | 0.0 | 3.4 | 0.0 | 0.0 | 3.4 | 0.0 | 0.0 | 75.9 | 13.8 | 0.0 | |
| SS | 1.7 | 0.8 | 0.0 | 0.0 | 0.0 | 0.0 | 0.0 | 0.0 | 0.0 | 5.9 | 91.6 | 0.0 | |
| WLK | 0.0 | 0.0 | 0.0 | 0.0 | 0.0 | 0.0 | 0.0 | 0.0 | 0.0 | 0.0 | 0.0 | 100 | |
| DK | PK | FS | HS | CCS | ACS | SK | STP | STD | CLS | SS | WLK | ||
| Output Class | |||||||||||||
| C | |||||||||||||
| Tuned Parameter kNN on Testing Movement Sequences | |||||||||||||
| Target Class | DK | 100 | 0.0 | 0.0 | 0.0 | 0.0 | 0.0 | 0.0 | 0.0 | 0.0 | 0.0 | 0.0 | 0.0 |
| PK | 0.0 | 87.2 | 0.0 | 2.6 | 2.6 | 0.0 | 0.0 | 2.6 | 2.6 | 0.0 | 2.6 | 0.0 | |
| FS | 2.6 | 0.0 | 57.9 | 7.9 | 0.0 | 0.0 | 2.6 | 28.9 | 0.0 | 0.0 | 0.0 | 0.0 | |
| HS | 2.6 | 0.0 | 18.4 | 52.6 | 0.0 | 0.0 | 0.0 | 26.3 | 0.0 | 0.0 | 0.0 | 0.0 | |
| CCS | 2.7 | 0.0 | 0.0 | 2.7 | 89.2 | 5.4 | 0.0 | 0.0 | 0.0 | 0.0 | 0.0 | 0.0 | |
| ACS | 0.0 | 0.0 | 0.0 | 2.6 | 10.5 | 84.2 | 0.0 | 2.6 | 0.0 | 0.0 | 0.0 | 0.0 | |
| SK | 2.4 | 2.4 | 0.0 | 0.0 | 0.0 | 0.0 | 95.1 | 0.0 | 0.0 | 0.0 | 0.0 | 0.0 | |
| STP | 4.8 | 0.0 | 0.0 | 4.8 | 0.0 | 0.0 | 0.0 | 90.5 | 0.0 | 0.0 | 0.0 | 0.0 | |
| STD | 0.0 | 0.0 | 0.0 | 0.0 | 0.0 | 0.0 | 0.0 | 0.0 | 89.5 | 0.0 | 10.5 | 0.0 | |
| CLS | 0.0 | 0.0 | 0.0 | 0.0 | 0.0 | 0.0 | 0.0 | 0.0 | 0.0 | 96.6 | 3.4 | 0.0 | |
| SS | 0.8 | 0.8 | 0.0 | 0.0 | 0.8 | 2.5 | 0.0 | 0.0 | 0.0 | 2.5 | 92.4 | 0.0 | |
| WLK | 14.3 | 0.0 | 0.0 | 0.0 | 0.0 | 4.8 | 4.8 | 47.6 | 14.3 | 0.0 | 14.3 | 0.0 | |
| DK | PK | FS | HS | CCS | ACS | SK | STP | STD | CLS | SS | WLK | ||
| Output Class | |||||||||||||
| D | |||||||||||||
| Tuned Parameter kNN on Novel Participant Validation Movement Sequences | |||||||||||||
| Target Class | DK | 63.2 | 6.9 | 0.0 | 1.1 | 9.2 | 9.2 | 4.6 | 0.0 | 0.0 | 0.0 | 5.7 | 0.0 |
| PK | 1.1 | 79.3 | 0.0 | 0.0 | 0.0 | 0.0 | 8.0 | 0.0 | 0.0 | 0.0 | 11.5 | 0.0 | |
| FS | 6.9 | 1.1 | 35.6 | 25.3 | 2.3 | 1.1 | 0.0 | 27.6 | 0.0 | 0.0 | 0.0 | 0.0 | |
| HS | 3.4 | 2.3 | 32.2 | 39.1 | 4.6 | 0.0 | 0.0 | 18.4 | 0.0 | 0.0 | 0.0 | 0.0 | |
| CCS | 0.0 | 0.0 | 1.2 | 6.0 | 67.9 | 22.6 | 1.2 | 1.2 | 0.0 | 0.0 | 0.0 | 0.0 | |
| ACS | 0.0 | 0.0 | 1.2 | 1.2 | 30.5 | 65.9 | 0.0 | 0.0 | 0.0 | 0.0 | 1.2 | 0.0 | |
| SK | 20.0 | 9.4 | 0.0 | 1.2 | 4.7 | 3.5 | 48.2 | 0.0 | 0.0 | 0.0 | 12.9 | 0.0 | |
| STP | 0.0 | 0.0 | 9.3 | 4.7 | 0.0 | 4.7 | 4.7 | 76.7 | 0.0 | 0.0 | 0.0 | 0.0 | |
| STD | 0.0 | 0.0 | 1.2 | 3.5 | 2.4 | 2.4 | 1.2 | 4.7 | 76.5 | 0.0 | 4.7 | 3.5 | |
| CLS | 1.3 | 4.3 | 3.9 | 0.0 | 3.9 | 1.3 | 0.0 | 0.0 | 0.0 | 61.8 | 26.3 | 0.0 | |
| SS | 5.6 | 7.3 | 3.1 | 3.5 | 5.9 | 4.2 | 3.8 | 0.3 | 0.0 | 12.6 | 53.5 | 0.0 | |
| WLK | 0.0 | 0.0 | 0.0 | 0.0 | 6.7 | 4.4 | 2.2 | 75.6 | 2.2 | 0.0 | 8.9 | 0.0 | |
| DK | PK | FS | HS | CCS | ACS | SK | STP | STD | CLS | SS | WLK | ||
| Output Class | |||||||||||||
| Motion | DK | PK | FS | HS | CCS | ACS | SK | STP | STD | CLS | SS | WLK |
|---|---|---|---|---|---|---|---|---|---|---|---|---|
| Classifier Type | ||||||||||||
| Cross-Validated kNN | 97.8 | 98.1 | 96.3 | 96.6 | 97.3 | 96.2 | 98.6 | 99.5 | 100 | 98.4 | 98 | 100 |
| Tuned Parameter kNN on Segmented Data | 98.1 | 98.6 | 96.4 | 97.4 | 98.2 | 97.1 | 99.2 | 99.7 | 100 | 97.9 | 97.0 | 99.7 |
| Tuned Parameter kNN on Movement Sequences | 97.6 | 99.5 | 98.2 | 98.2 | 98.4 | 98.4 | 99.5 | 92.2 | 98.9 | 99.2 | 97.1 | 100 |
| Novel Participant Movement Sequences | 93.0 | 93.6 | 92.8 | 93.1 | 89.5 | 92.1 | 95.7 | 88.3 | 99.8 | 94.3 | 89.8 | 99.5 |
| Motion | DK | PK | FS | HS | CCS | ACS | SK | STP | STD | CLS | SS | WLK |
|---|---|---|---|---|---|---|---|---|---|---|---|---|
| Classifier Type | ||||||||||||
| Cross-Validated kNN | 84.7 | 99.0 | 88.9 | 80.7 | 82.9 | 94.2 | 90.8 | 85.5 | 88.9 | 85.4 | 93.1 | 100 |
| Tuned Parameter kNN on Segmented Data | 87.5 | 99.3 | 89.0 | 85.2 | 83.3 | 94.6 | 92.3 | 88.0 | 80.6 | 86.9 | 94.3 | 99.9 |
| Tuned Parameter kNN on Movement Sequences | 98.8 | 93.3 | 78.1 | 75.4 | 93.8 | 91.3 | 97.3 | 91.3 | 94.2 | 97.9 | 94.8 | 50.0 |
| Novel Participant Movement Sequences | 78.1 | 86.5 | 64.2 | 66.1 | 78.7 | 79.0 | 92.0 | 82.5 | 88.1 | 78.1 | 71.7 | 49.8 |
| Motion | Kneeling | Squatting | Chair Sitting | Stooping | Standing | Floor Sitting | WLK |
|---|---|---|---|---|---|---|---|
| Performance Measure | |||||||
| Sensitivity | 80.3 | 66.1 | 93.4 | 76.7 | 76.5 | 70.7 | 0.0 |
| Specificity | 81.3 | 86.2 | 81.7 | 88.3 | 99.8 | 82.8 | 99.5 |
| Balanced Accuracy | 81.0 | 76.0 | 88.0 | 83.0 | 88.0 | 77.0 | 49.8 |
Disclaimer/Publisher’s Note: The statements, opinions and data contained in all publications are solely those of the individual author(s) and contributor(s) and not of MDPI and/or the editor(s). MDPI and/or the editor(s) disclaim responsibility for any injury to people or property resulting from any ideas, methods, instructions or products referred to in the content. |
© 2025 by the authors. Licensee MDPI, Basel, Switzerland. This article is an open access article distributed under the terms and conditions of the Creative Commons Attribution (CC BY) license (https://creativecommons.org/licenses/by/4.0/).
Share and Cite
Laudanski, A.F.; Küderle, A.; Kluge, F.; Eskofier, B.M.; Acker, S.M. High-Knee-Flexion Posture Recognition Using Multi-Dimensional Dynamic Time Warping on Inertial Sensor Data. Sensors 2025, 25, 1083. https://doi.org/10.3390/s25041083
Laudanski AF, Küderle A, Kluge F, Eskofier BM, Acker SM. High-Knee-Flexion Posture Recognition Using Multi-Dimensional Dynamic Time Warping on Inertial Sensor Data. Sensors. 2025; 25(4):1083. https://doi.org/10.3390/s25041083
Chicago/Turabian StyleLaudanski, Annemarie F., Arne Küderle, Felix Kluge, Bjoern M. Eskofier, and Stacey M. Acker. 2025. "High-Knee-Flexion Posture Recognition Using Multi-Dimensional Dynamic Time Warping on Inertial Sensor Data" Sensors 25, no. 4: 1083. https://doi.org/10.3390/s25041083
APA StyleLaudanski, A. F., Küderle, A., Kluge, F., Eskofier, B. M., & Acker, S. M. (2025). High-Knee-Flexion Posture Recognition Using Multi-Dimensional Dynamic Time Warping on Inertial Sensor Data. Sensors, 25(4), 1083. https://doi.org/10.3390/s25041083