Development of Hourly Resolution Air Temperature Across Titicaca Lake on Auxiliary ERA5 Variables and Machine Learning-Based Gap-Filling
Abstract
1. Introduction
2. Study Area and Automatic Monitoring
3. Data and Methods
3.1. Data
3.1.1.
3.1.2. ERAA5-Land Hourly Dataset
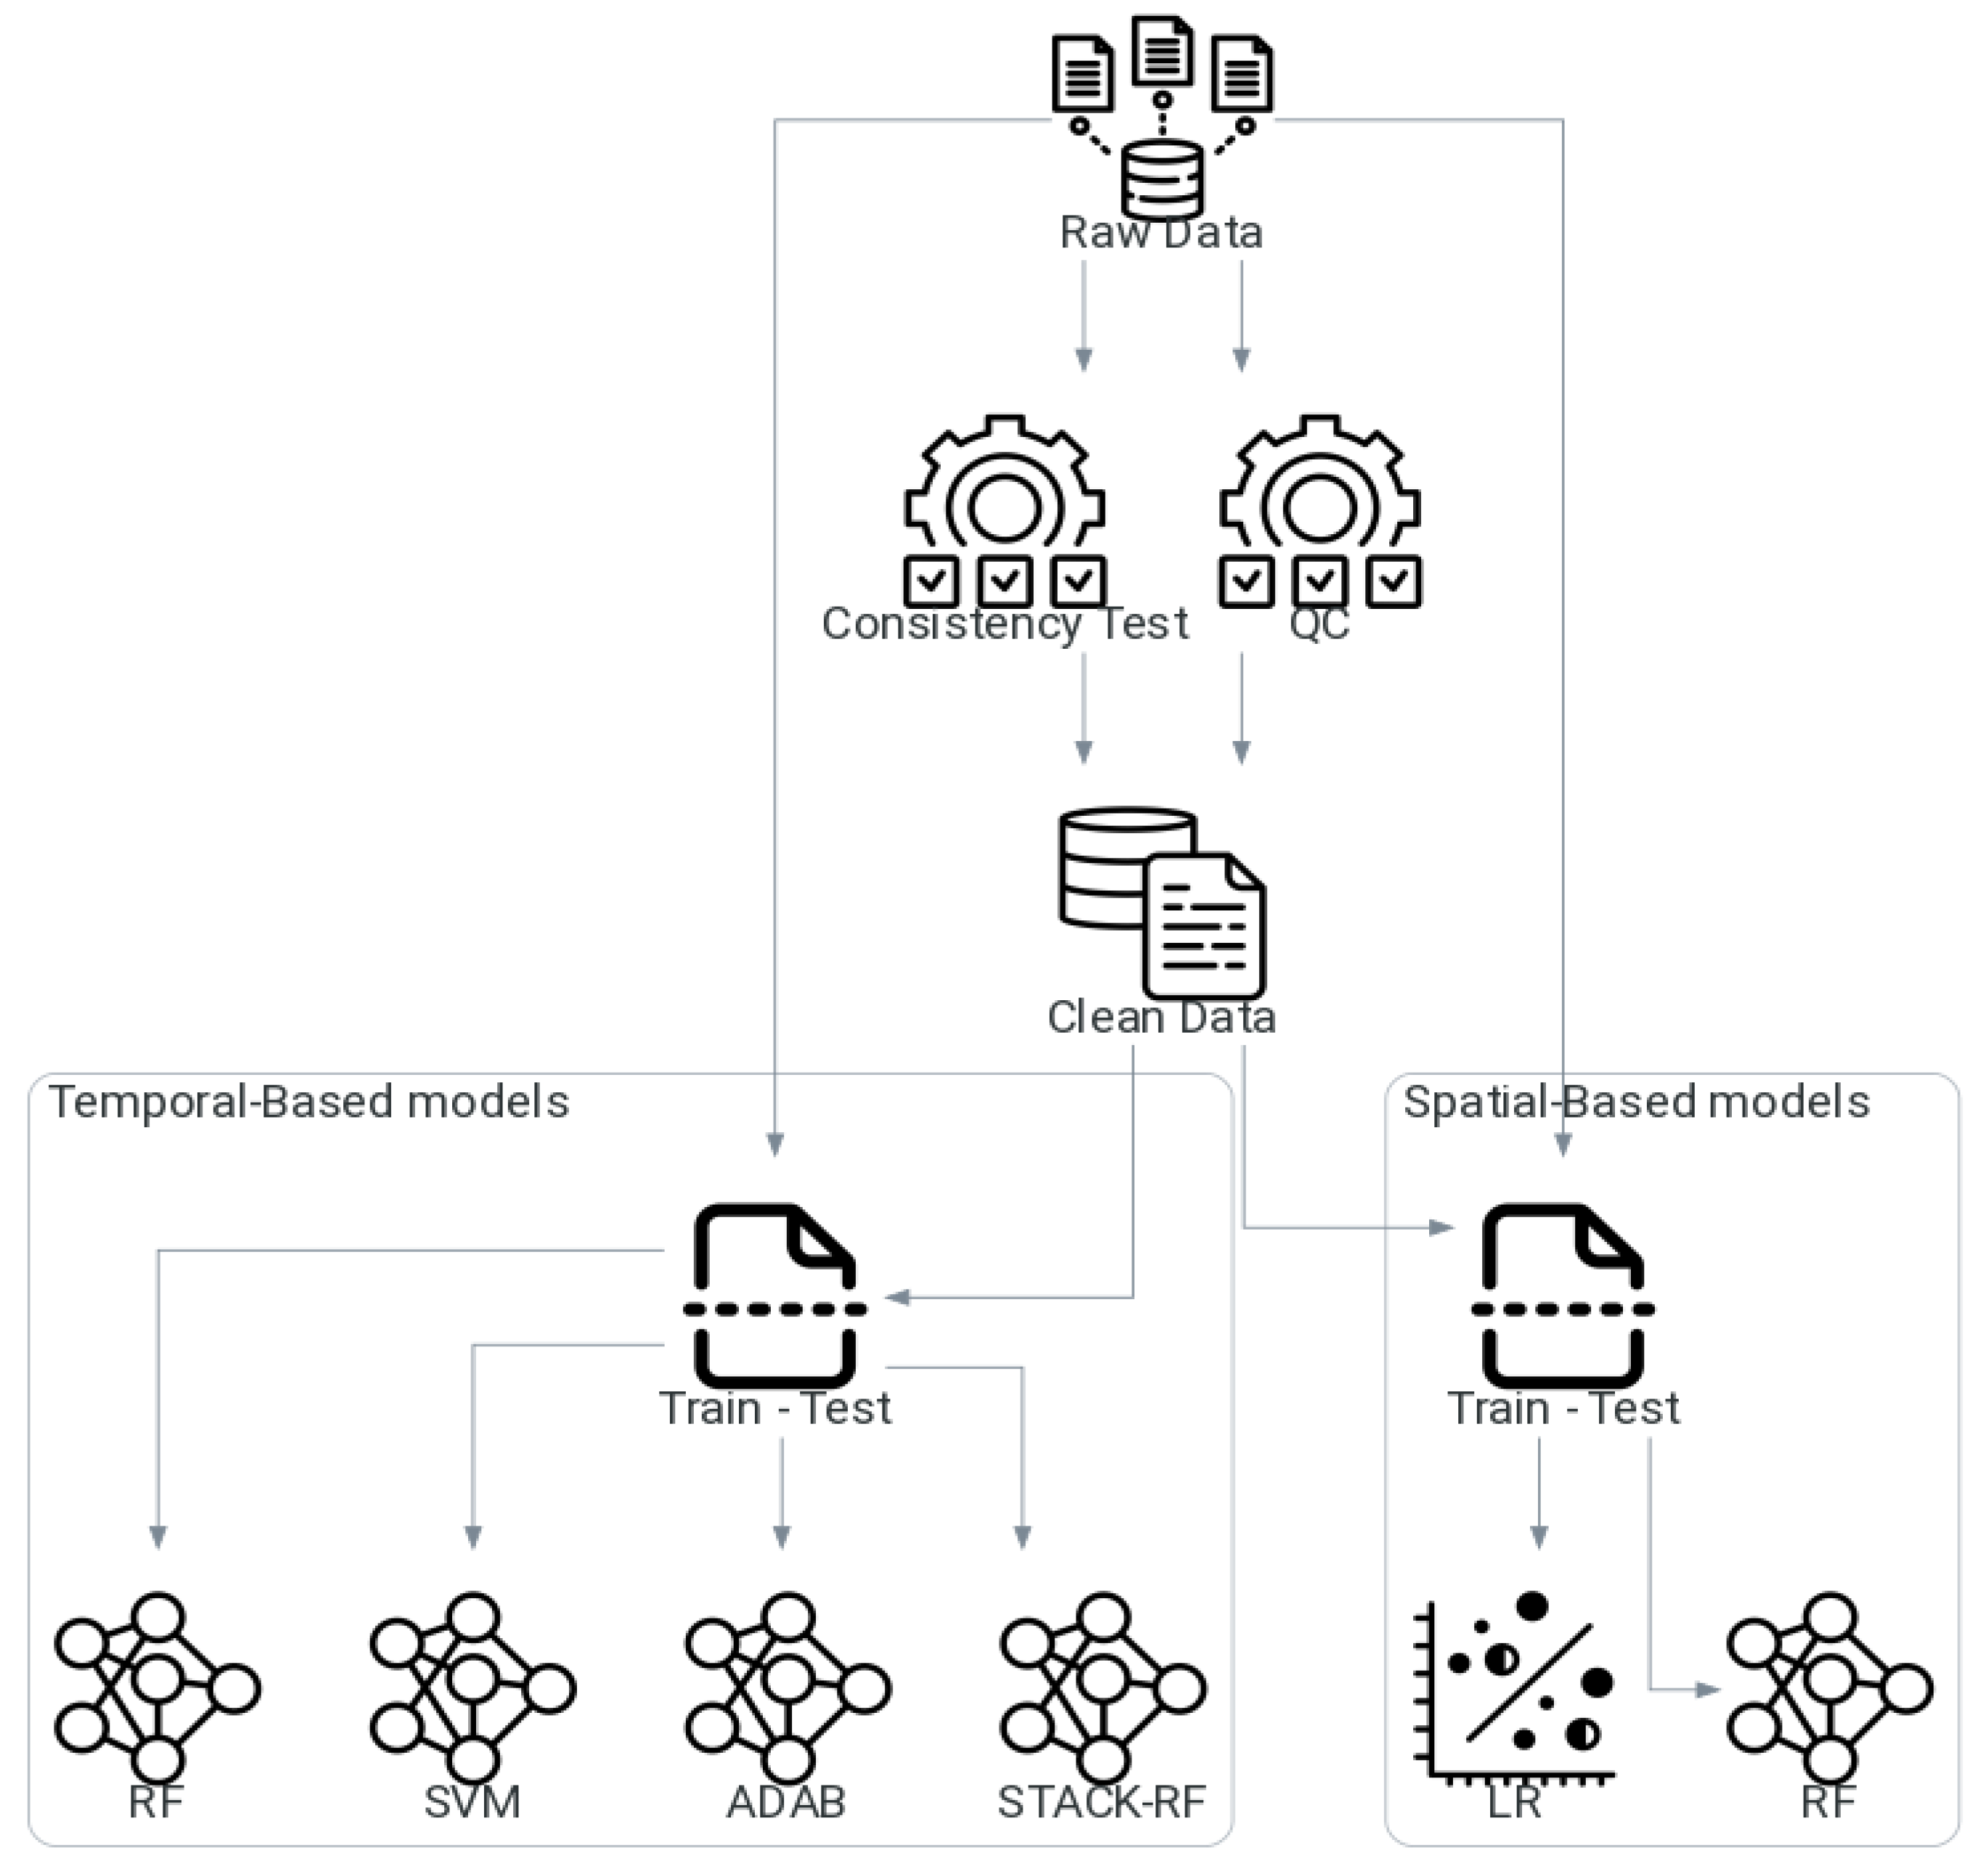
3.2. Methods
3.2.1. Quality Control of
Robust QC Analysis
Interquartile Range (IQR)
Biweight Approach
Local Outlier Factor (LOF)
Consistency Test of
- Range Test: It identifies and removes all values that fall outside the acceptable range based on long-term observational data. The thresholds for this test, defined as TLOW and THIGH, were derived from the DECADE database [55], which contains extensive historical records from a conventional weather network which has been monitoring the Lake Titicaca region since 1972.
- Step Test: It checks the excess movement between consecutive hourly values at 1-, 2-, 3-, 6-, and 12-h intervals against limits of 4, 7, 9, 15, and 25 °C, respectively, to identify unrealistic rates of change.
- Persistence Test (Flat Line Test): A series of identical values over a three-hour window—indicative of sensor malfunction—was flagged, a duration selected due to the high intra-diurnal variability at this latitude.
3.2.2. Gap-Filling of
Gap-Filling on Linear Correlation Regression
Gap-Filling on ML Models
- Support Vector Machine (SVM): Implemented with a polynomial kernel of degree 3, a penalty parameter C = 1, and a kernel coefficient of 1 [64].
- Random Forest (RF): This ensemble method aggregates predictions from multiple decision trees trained on random subsets of data and features, reducing variance and improving generalization. The model was configured with 90 and 100 trees, a maximum tree depth of 9, 6 samples to split an internal node, and a maximum of 3 features per split.
- Stacking (STACK): This advanced ensemble technique integrates the predictions of base models (SVM and RF in this study) using a meta-model to generate a final, refined prediction, leveraging the strengths of each constituent algorithm.
Model Training and Evaluation
4. Results
4.1. QC Analysis and Consistency Test
4.1.1. Interquartile Range, Biweight, and LOF
4.1.2. Consistency Test Values
4.1.3. Station-Specific Data Quality Observations
4.2. Gap-Filling Performance
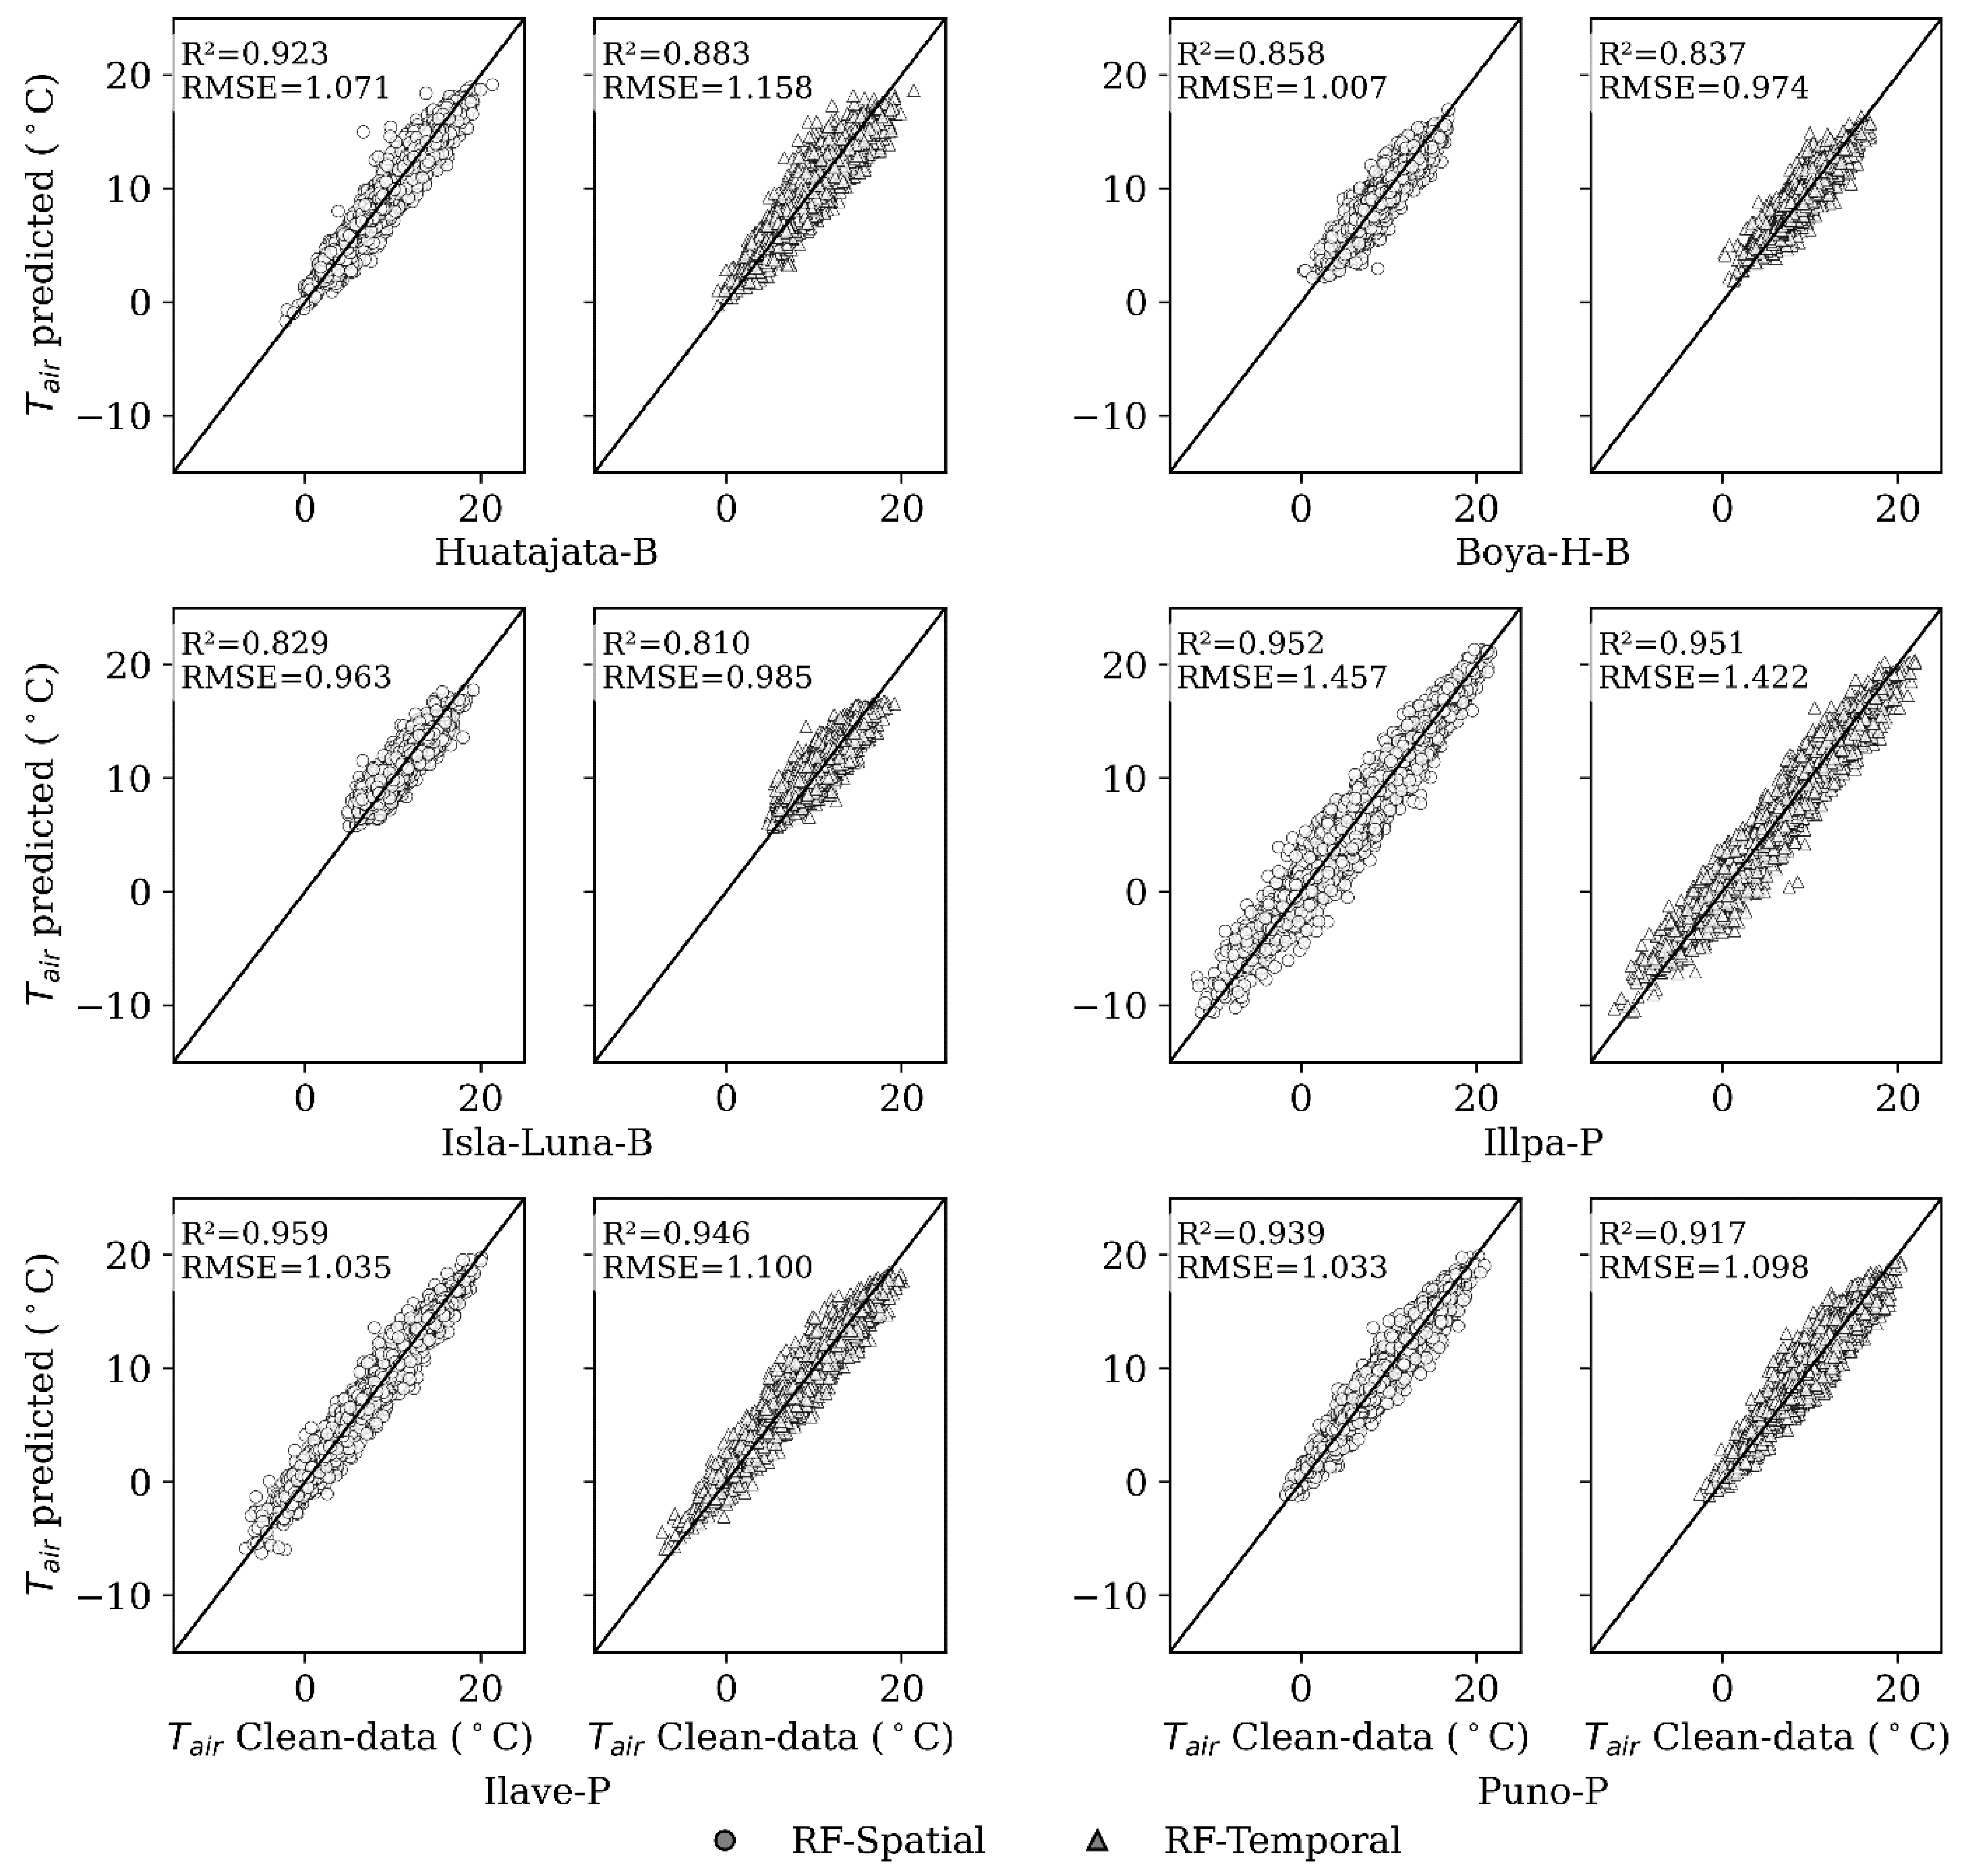
4.2.1. Spatial Gap-Filling Approach of
4.2.2. Temporal Gap-Filling Approaches on
5. Discussion
6. Conclusions
Author Contributions
Funding
Institutional Review Board Statement
Informed Consent Statement
Data Availability Statement
Conflicts of Interest
References
- Manton, M.J.; Della-Marta, P.M.; Haylock, M.R.; Hennessy, K.J.; Nicholls, N.; Chambers, L.E.; Collins, D.A.; Daw, G.; Finet, A.; Gunawan, D. Trends in Extreme Daily Rainfall and Temperature in Southeast Asia and the South Pacific: 1961–1998. Int. J. Climatol. 2001, 21, 269–284. [Google Scholar]
- Szturc, J.; Ośródka, K.; Jurczyk, A.; Otop, I.; Linkowska, J.; Bochenek, B.; Pasierb, M. Chapter 3—Quality Control and Verification of Precipitation Observations, Estimates, and Forecasts. In Precipitation Science; Michaelides, S., Ed.; Elsevier: Amsterdam, The Netherlands, 2022; pp. 91–133. ISBN 978-0-12-822973-6. [Google Scholar]
- Lucio-Eceiza, E.E.; González-Rouco, J.F.; Navarro, J.; Beltrami, H. Quality Control of Surface Wind Observations in Northeastern North America. Part I: Data Management Issues. J. Atmos. Ocean. Technol. 2018, 35, 163–182. [Google Scholar] [CrossRef]
- Silvestri, L.; Saraceni, M.; Bongioannini Cerlini, P. Quality Management System and Design of an Integrated Mesoscale Meteorological Network in Central Italy. Meteorol. Appl. 2022, 29, e2060. [Google Scholar] [CrossRef]
- Faybishenko, B.; Versteeg, R.; Pastorello, G.; Dwivedi, D.; Varadharajan, C.; Agarwal, D. Challenging Problems of Quality Assurance and Quality Control (QA/QC) of Meteorological Time Series Data. Stoch. Environ. Res. Risk Assess. 2022, 36, 1049–1062. [Google Scholar] [CrossRef]
- Nearing, G.; Cohen, D.; Dube, V.; Gauch, M.; Gilon, O.; Harrigan, S.; Hassidim, A.; Klotz, D.; Kratzert, F.; Metzger, A.; et al. AI Increases Global Access to Reliable Flood Forecasts. arXiv 2023, arXiv:2307.16104. [Google Scholar] [CrossRef]
- Saunders, K.R.; Forbes, O.; Hopf, J.K.; Patterson, C.R.; Vollert, S.A.; Brown, K.; Browning, R.; Canizares, M.; Cottrell, R.S.; Li, L.; et al. Data-Driven Recommendations for Enhancing Real-Time Natural Hazard Warnings, Communication, and Response. arXiv 2023, arXiv:2311.14678. [Google Scholar]
- Steinacker, R.; Mayer, D.; Steiner, A. Data Quality Control Based on Self-Consistency. Mon. Weather Rev. 2011, 139, 3974–3991. [Google Scholar] [CrossRef]
- Blenkinsop, S.; Lewis, E.; Chan, S.C.; Fowler, H.J. Quality-Control of an Hourly Rainfall Dataset and Climatology of Extremes for the UK. Int. J. Climatol. 2017, 37, 722–740. [Google Scholar] [CrossRef]
- Durre, I.; Menne, M.J.; Gleason, B.E.; Houston, T.G.; Vose, R.S. Comprehensive Automated Quality Assurance of Daily Surface Observations. J. Appl. Meteorol. Climatol. 2010, 49, 1615–1633. [Google Scholar] [CrossRef]
- Gandin, L.S. Complex Quality Control of Meteorological Observations. Mon. Weather Rev. 1988, 116, 1137–1156. [Google Scholar]
- Aguilar, E.; Llanso, P. Guidelines on Climate Metadata and Homogenization; WMO: Geneva, Switzerland, 2003. [Google Scholar]
- Solomon, S. Climate Change 2007-the Physical Science Basis: Working Group I Contribution to the Fourth Assessment Report of the IPCC; Cambridge University Press: Cambridge, UK, 2007; Volume 4. [Google Scholar]
- Crespi, A.; Matiu, M.; Bertoldi, G.; Petitta, M.; Zebisch, M. A High-Resolution Gridded Dataset of Daily Temperature and Precipitation Records (1980–2018) for Trentino–South Tyrol (North-Eastern Italian Alps). Earth Syst. Sci. Data Discuss 2021, 13, 2801–2818. [Google Scholar] [CrossRef]
- You, J.; Hubbard, K.G. Quality Control of Weather Data during Extreme Events. J. Atmos. Ocean. Technol. 2006, 23, 184–197. [Google Scholar] [CrossRef]
- Reek, T.; Doty, S.R.; Owen, T.W. A Deterministic Approach to the Validation of Historical Daily Temperature and Precipitation Data from the Cooperative Network. Bull. Am. Meteorol. Soc. 1992, 73, 753–765. [Google Scholar] [CrossRef]
- Feng, S.; Hu, Q.; Qian, W. Quality Control of Daily Meteorological Data in China, 1951–2000: A New Dataset. Int. J. Climatol. A J. R. Meteorol. Soc. 2004, 24, 853–870. [Google Scholar] [CrossRef]
- Estévez, J.; Gavilán, P.; Giráldez, J.V. Guidelines on Validation Procedures for Meteorological Data from Automatic Weather Stations. J. Hydrol. 2011, 402, 144–154. [Google Scholar] [CrossRef]
- WMO. Guide to Climatological Practices; World Meteorological Organization: Geneva, Switzerland, 2011. [Google Scholar]
- Vejen, F.; Jacobsson, C.; Fredriksson, U.; Moe, M.; Andresen, L.; Hellsten, E.; Rissanen, P.; Palsdottir, T.; Arason, T. Quality Control of Meteorological Observations. Nor. Meteorol. Inst. 2002. Available online: https://www.hergilsey.is/arason/rit/2002/vejen_et_al_2002.pdf (accessed on 15 October 2024).
- Yan, Y.; Kayem, K.; Hao, Y.; Shi, Z.; Zhang, C.; Peng, J.; Liu, W.; Zuo, Q.; Ji, W.; Li, B. Mapping the Levels of Soil Salination and Alkalization by Integrating Machining Learning Methods and Soil-Forming Factors. Remote Sens. 2022, 14, 3020. [Google Scholar] [CrossRef]
- Wang, J.; Peng, J.; Li, H.; Yin, C.; Liu, W.; Wang, T.; Zhang, H. Soil Salinity Mapping Using Machine Learning Algorithms with the Sentinel-2 MSI in Arid Areas, China. Remote Sens. 2021, 13, 305. [Google Scholar]
- Aksoy, S.; Yildirim, A.; Gorji, T.; Hamzehpour, N.; Tanik, A.; Sertel, E. Assessing the Performance of Machine Learning Algorithms for Soil Salinity Mapping in Google Earth Engine Platform Using Sentinel-2A and Landsat-8 OLI Data. Adv. Space Res. 2022, 69, 1072–1086. [Google Scholar] [CrossRef]
- Vuille, M.; Carey, M.; Huggel, C.; Buytaert, W.; Rabatel, A.; Jacobsen, D.; Soruco, A.; Villacis, M.; Yarleque, C.; Timm, O.E. Rapid Decline of Snow and Ice in the Tropical Andes–Impacts, Uncertainties and Challenges Ahead. Earth-Sci. Rev. 2018, 176, 195–213. [Google Scholar] [CrossRef]
- Pillco Zolá, R.; Bengtsson, L.; Berndtsson, R.; Martí-Cardona, B.; Satgé, F.; Timouk, F.; Bonnet, M.-P.; Mollericon, L.; Gamarra, C.; Pasapera, J. Modelling Lake Titicaca’s Daily and Monthly Evaporation. Hydrol. Earth Syst. Sci. 2019, 23, 657–668. [Google Scholar] [CrossRef]
- Satgé, F.; Ruelland, D.; Bonnet, M.-P.; Molina, J.; Pillco, R. Consistency of Satellite-Based Precipitation Products in Space and over Time Compared with Gauge Observations and Snow-Hydrological Modelling in the Lake Titicaca Region. Hydrol. Earth Syst. Sci. 2019, 23, 595–619. [Google Scholar] [CrossRef]
- Garreaud, R.; Vuille, M.; Clement, A.C. The Climate of the Altiplano: Observed Current Conditions and Mechanisms of Past Changes. Palaeogeogr. Palaeoclimatol. Palaeoecol. 2003, 194, 5–22. [Google Scholar] [CrossRef]
- Egger, J.; Blacutt, L.; Ghezzi, F.; Heinrich, R.; Kolb, P.; Lämmlein, S.; Leeb, M.; Mayer, S.; Palenque, E.; Reuder, J.; et al. Diurnal Circulation of the Bolivian Altiplano. Part I: Observations. Mon. Weather. Rev. 2005, 133, 911–924. [Google Scholar] [CrossRef]
- Rutllant, J.A.; Fuenzalida, H.; Aceituno, P. Climate Dynamics along the Arid Northern Coast of Chile: The 1997–1998 Dinámica Del Clima de La Región de Antofagasta (DICLIMA) Experiment. J. Geophys. Res. Atmos. 2003, 108, 4538. [Google Scholar] [CrossRef]
- Lima-Quispe, N.; Ruelland, D.; Rabatel, A.; Lavado-Casimiro, W.; Condom, T. Modeling Lake Titicaca’s Water Balance: The Dominant Roles of Precipitation and Evaporation. Hydrol. Earth Syst. Sci. 2025, 29, 655–682. [Google Scholar] [CrossRef]
- Campbell Scientific. TE525WS-L Rain Gage Instruction Manual; Campbell Scientific: Logan, UT, USA, 2018; Available online: https://s.campbellsci.com/documents/ca/manuals/te525_man.pdf (accessed on 18 October 2024).
- Campbell Scientific. CS215 Temperature and Relative Humidity Probe Manual; Campbell Scientific: Logan, UT, USA, 2019; Available online: https://s.campbellsci.com/documents/ca/manuals/cs215_man.pdf (accessed on 18 October 2024).
- R.M. Young Company. Model 05103 Wind Monitor Instruction Manual (A100R, W200P); R.M. Young Company: Traverse City, MI, USA, 2017; Available online: https://www.youngusa.com/wp-content/uploads/2021/02/05103-90N.pdf (accessed on 18 October 2024).
- Skye Instruments SP1100 Pyranometer Technical Specification 2016. Available online: https://www.campbellsci.eu/sp1110 (accessed on 18 October 2024).
- OTT Hydromet OTT Pluvio2 Weighi ng Rain Gauge Technical Manual 2017. Available online: https://www.ott.com/download/operating-instructions-precipitation-gauge-ott-pluvio2-l-2 (accessed on 18 October 2024).
- Vaisala. HMP155 Temperature and Humidity Probe User Guide; Vaisala: Vantaa, Finland, 2020; Available online: https://docs.vaisala.com/r/M210912EN-G.1/en-US (accessed on 18 October 2024).
- Vaisala. WXT520 Weather Transmitter User Guide; Vaisala: Vantaa, Finland, 2019; Available online: https://www.vaisala.com/sites/default/files/documents/M210906EN-C.pdf (accessed on 18 October 2024).
- LI-COR. LI-200R Pyranometer Sensor Instruction Manual; LI-COR Biosciences: Lincoln, NE, USA, 2016; Available online: https://www.licor.com/support/LI-200R/manuals.html (accessed on 18 October 2024).
- Muñoz Sabater, J. ERA5-Land Hourly Data from 1950 to Present, Copernicus Climate Change Service (C3S) Climate Data Store (CDS) [Data Set] 2019. Available online: https://cds.climate.copernicus.eu/datasets/reanalysis-era5-land?tab=overview (accessed on 10 October 2024).
- Hersbach, H.; Bell, B.; Berrisford, P.; Hirahara, S.; Horányi, A.; Muñoz-Sabater, J.; Nicolas, J.; Peubey, C.; Radu, R.; Schepers, D.; et al. The ERA5 Global Reanalysis. Quart. J. R. Meteoro Soc. 2020, 146, 1999–2049. [Google Scholar] [CrossRef]
- Aguilar, E.; van der Schrier, G.; Guijarro, J.A.; Stepanek, P.; Zahradnicek, P.; Sigró, J.; Coscarelli, R.; Engström, E.; Curley, M.; Caloiero, T. Quality Control and Homogenization Benchmarking-Based Progress from the INDECIS Project. In Proceedings of the EGU General Assembly Conference Abstracts, Vienna, Austria, 8–13 April 2018; p. 16392. [Google Scholar]
- Skrynyk, O.; Sidenko, V.; Aguilar, E.; Guijarro, J.; Skrynyk, O.; Palamarchuk, L.; Oshurok, D.; Osypov, V.; Osadchyi, V. Data Quality Control and Homogenization of Daily Precipitation and Air Temperature (Mean, Max and Min) Time Series of Ukraine. Int. J. Climatol. 2023, 43, 4166–4182. [Google Scholar] [CrossRef]
- Lartey, C.; Liu, J.; Asamoah, R.K.; Greet, C.; Zanin, M.; Skinner, W. Effective Outlier Detection for Ensuring Data Quality in Flotation Data Modelling Using Machine Learning (ML) Algorithms. Minerals 2024, 14, 925. [Google Scholar] [CrossRef]
- Alghushairy, O.; Alsini, R.; Soule, T.; Ma, X. A Review of Local Outlier Factor Algorithms for Outlier Detection in Big Data Streams. Big Data Cogn. Comput. 2021, 5, 1. [Google Scholar] [CrossRef]
- Smiti, A. A Critical Overview of Outlier Detection Methods. Comput. Sci. Rev. 2020, 38, 100306. [Google Scholar] [CrossRef]
- Hawkins, D.M. Identification of Outliers; Springer: Dordrecht, The Netherlands, 1980; ISBN 978-94-015-3996-8. [Google Scholar]
- Hunziker, S.; Brönnimann, S.; Calle, J.; Moreno, I.; Andrade, M.; Ticona, L.; Huerta, A.; Lavado-Casimiro, W. Effects of Undetected Data Quality Issues on Climatological Analyses. Clim. Past 2018, 14, 1–20. [Google Scholar] [CrossRef]
- Zaifoğlu, H.; Akıntuğ, B.; Yanmaz, A.M. Quality Control, Homogeneity Analysis, and Trends of Extreme Precipitation Indices in Northern Cyprus. J. Hydrol. Eng. 2017, 22, 05017024. [Google Scholar] [CrossRef]
- Schwertman, N.C.; Owens, M.A.; Adnan, R. A Simple More General Boxplot Method for Identifying Outliers. Comput. Stat. Data Anal. 2004, 47, 165–174. [Google Scholar] [CrossRef]
- Tukey, J.W. Exploratory Data Analysis; Springer: Berlin/Heidelberg, Germany, 1977; Volume 2. [Google Scholar]
- Lanzante, J.R. Resistant, Robust and Non-Parametric Techniques for the Analysis of Climate Data: Theory and Examples, Including Applications to Historical Radiosonde Station Data. Int. J. Climatol. 1996, 16, 1197–1226. [Google Scholar] [CrossRef]
- Zou, X.; Zeng, Z. A Quality Control Procedure for GPS Radio Occultation Data. J. Geophys. Res. 2006, 111, 2005JD005846. [Google Scholar] [CrossRef]
- Cheng, Z.; Zou, C.; Dong, J. Outlier Detection Using Isolation Forest and Local Outlier Factor. In Proceedings of the Conference on Research in Adaptive and Convergent Systems, Chongqing, China, 24 September 2019; ACM: New York, NY, USA, 2019; pp. 161–168. [Google Scholar]
- Breunig, M.M.; Kriegel, H.-P.; Ng, R.T.; Sander, J. LOF: Identifying Density-Based Local Outliers. In Proceedings of the 2000 ACM SIGMOD International Conference on Management of Data, Dallas, TX, USA, 16 May 2000; ACM: New York, NY, USA, 2000; pp. 93–104. [Google Scholar]
- Hunziker, S.; Gubler, S.; Calle, J.; Moreno, I.; Andrade, M.; Velarde, F.; Ticona, L.; Carrasco, G.; Castellón, Y.; Oria, C.; et al. Identifying, Attributing, and Overcoming Common Data Quality Issues of Manned Station Observations. Int. J. Climatol. 2017, 37, 4131–4145. [Google Scholar] [CrossRef]
- Carrera-Villacrés, D.V.; Guevara-García, P.V.; Tamayo-Bacacela, L.C.; Balarezo-Aguilar, A.L.; Narváez-Rivera, C.A.; Morocho-López, D.R. Relleno de Series Anuales de Datos Meteorológicos Mediante Métodos Estadísticos En La Zona Costera e Interandina Del Ecuador, y Cálculo de La Precipitación Media. Idesia 2016, 34, 81–90. [Google Scholar] [CrossRef]
- Hofstra, N.; Haylock, M.; New, M.; Jones, P.; Frei, C. Comparison of Six Methods for the Interpolation of Daily, European Climate Data. J. Geophys. Res. 2008, 113, D21110. [Google Scholar] [CrossRef]
- Faghih, M.; Brissette, F.; Sabeti, P. Impact of Correcting Sub-Daily Climate Model Biases for Hydrological Studies. Hydrol. Earth Syst. Sci. Discuss. 2021, 26, 1545–1563. [Google Scholar] [CrossRef]
- Armanuos, A.M.; Al-Ansari, N.; Yaseen, Z.M. Cross Assessment of Twenty-One Different Methods for Missing Precipitation Data Estimation. Atmosphere 2020, 11, 389. [Google Scholar] [CrossRef]
- Sirpa-Poma, J.W.; Satgé, F.; Resongles, E.; Pillco-Zolá, R.; Molina-Carpio, J.; Flores Colque, M.G.; Ormachea, M.; Pacheco Mollinedo, P.; Bonnet, M.-P. Towards the Improvement of Soil Salinity Mapping in a Data-Scarce Context Using Sentinel-2 Images in Machine-Learning Models. Sensors 2023, 23, 9328. [Google Scholar] [CrossRef]
- Gu, J.; Liu, S.; Zhou, Z.; Chalov, S.R.; Zhuang, Q. A Stacking Ensemble Learning Model for Monthly Rainfall Prediction in the Taihu Basin, China. Water 2022, 14, 492. [Google Scholar] [CrossRef]
- Yan, X.; Zhang, M.; Yin, F.; You, J.; Chen, Y.; Gao, L. Multi-Scale Evaluation of ERA5 Air Temperature and Precipitation Data over the Poyang Lake Basin of China. Water 2024, 16, 3123. [Google Scholar] [CrossRef]
- Bonshoms, M.; Ubeda, J.; Liguori, G.; Körner, P.; Navarro, Á.; Cruz, R. Validation of ERA5-Land Temperature and Relative Humidity on Four Peruvian Glaciers Using on-Glacier Observations. J. Mt. Sci. 2022, 19, 1849–1873. [Google Scholar] [CrossRef]
- Cortes, C.; Vapnik, V. Support-Vector Networks. Mach. Learn. 1995, 20, 273–297. [Google Scholar] [CrossRef]
- Freund, Y.; Schapire, R.E. A Decision-Theoretic Generalization of On-Line Learning and an Application to Boosting. J. Comput. Syst. Sci. 1997, 55, 119–139. [Google Scholar] [CrossRef]
- Lazarevic, A.; Obradovic, Z. Adaptive Boosting Techniques in Heterogeneous and Spatial Databases. Intell. Data Anal. 2001, 5, 285–308. [Google Scholar] [CrossRef]
- Li, Y.; Li, T.; Lv, W.; Liang, Z.; Wang, J. Prediction of Daily Temperature Based on the Robust Machine Learning Algorithms. Sustainability 2023, 15, 9289. [Google Scholar] [CrossRef]
- Fahimi Nezhad, E.; Fallah Ghalhari, G.; Bayatani, F. Forecasting Maximum Seasonal Temperature Using Artificial Neural Networks “Tehran Case Study”. Asia-Pac. J. Atmos. Sci. 2019, 55, 145–153. [Google Scholar] [CrossRef]
- Teixeira de Aguiar, J.; Lobo, M. Reliability and Discrepancies of Rainfall and Temperatures from Remote Sensing and Brazilian Ground Weather Stations. Remote Sens. Appl. Soc. Environ. 2020, 18, 100301. [Google Scholar] [CrossRef]
- Meek, D.W.; Hatfield, J.L. Data Quality Checking for Single Station Meteorological Databases. Agric. For. Meteorol. 1994, 69, 85–109. [Google Scholar] [CrossRef]
- Parra-Plazas, J.; Gaona-Garcia, P.; Plazas-Nossa, L. Time Series Outlier Removal and Imputing Methods Based on Colombian Weather Stations Data. Environ. Sci. Pollut. Res. 2023, 30, 72319–72335. [Google Scholar] [CrossRef] [PubMed]
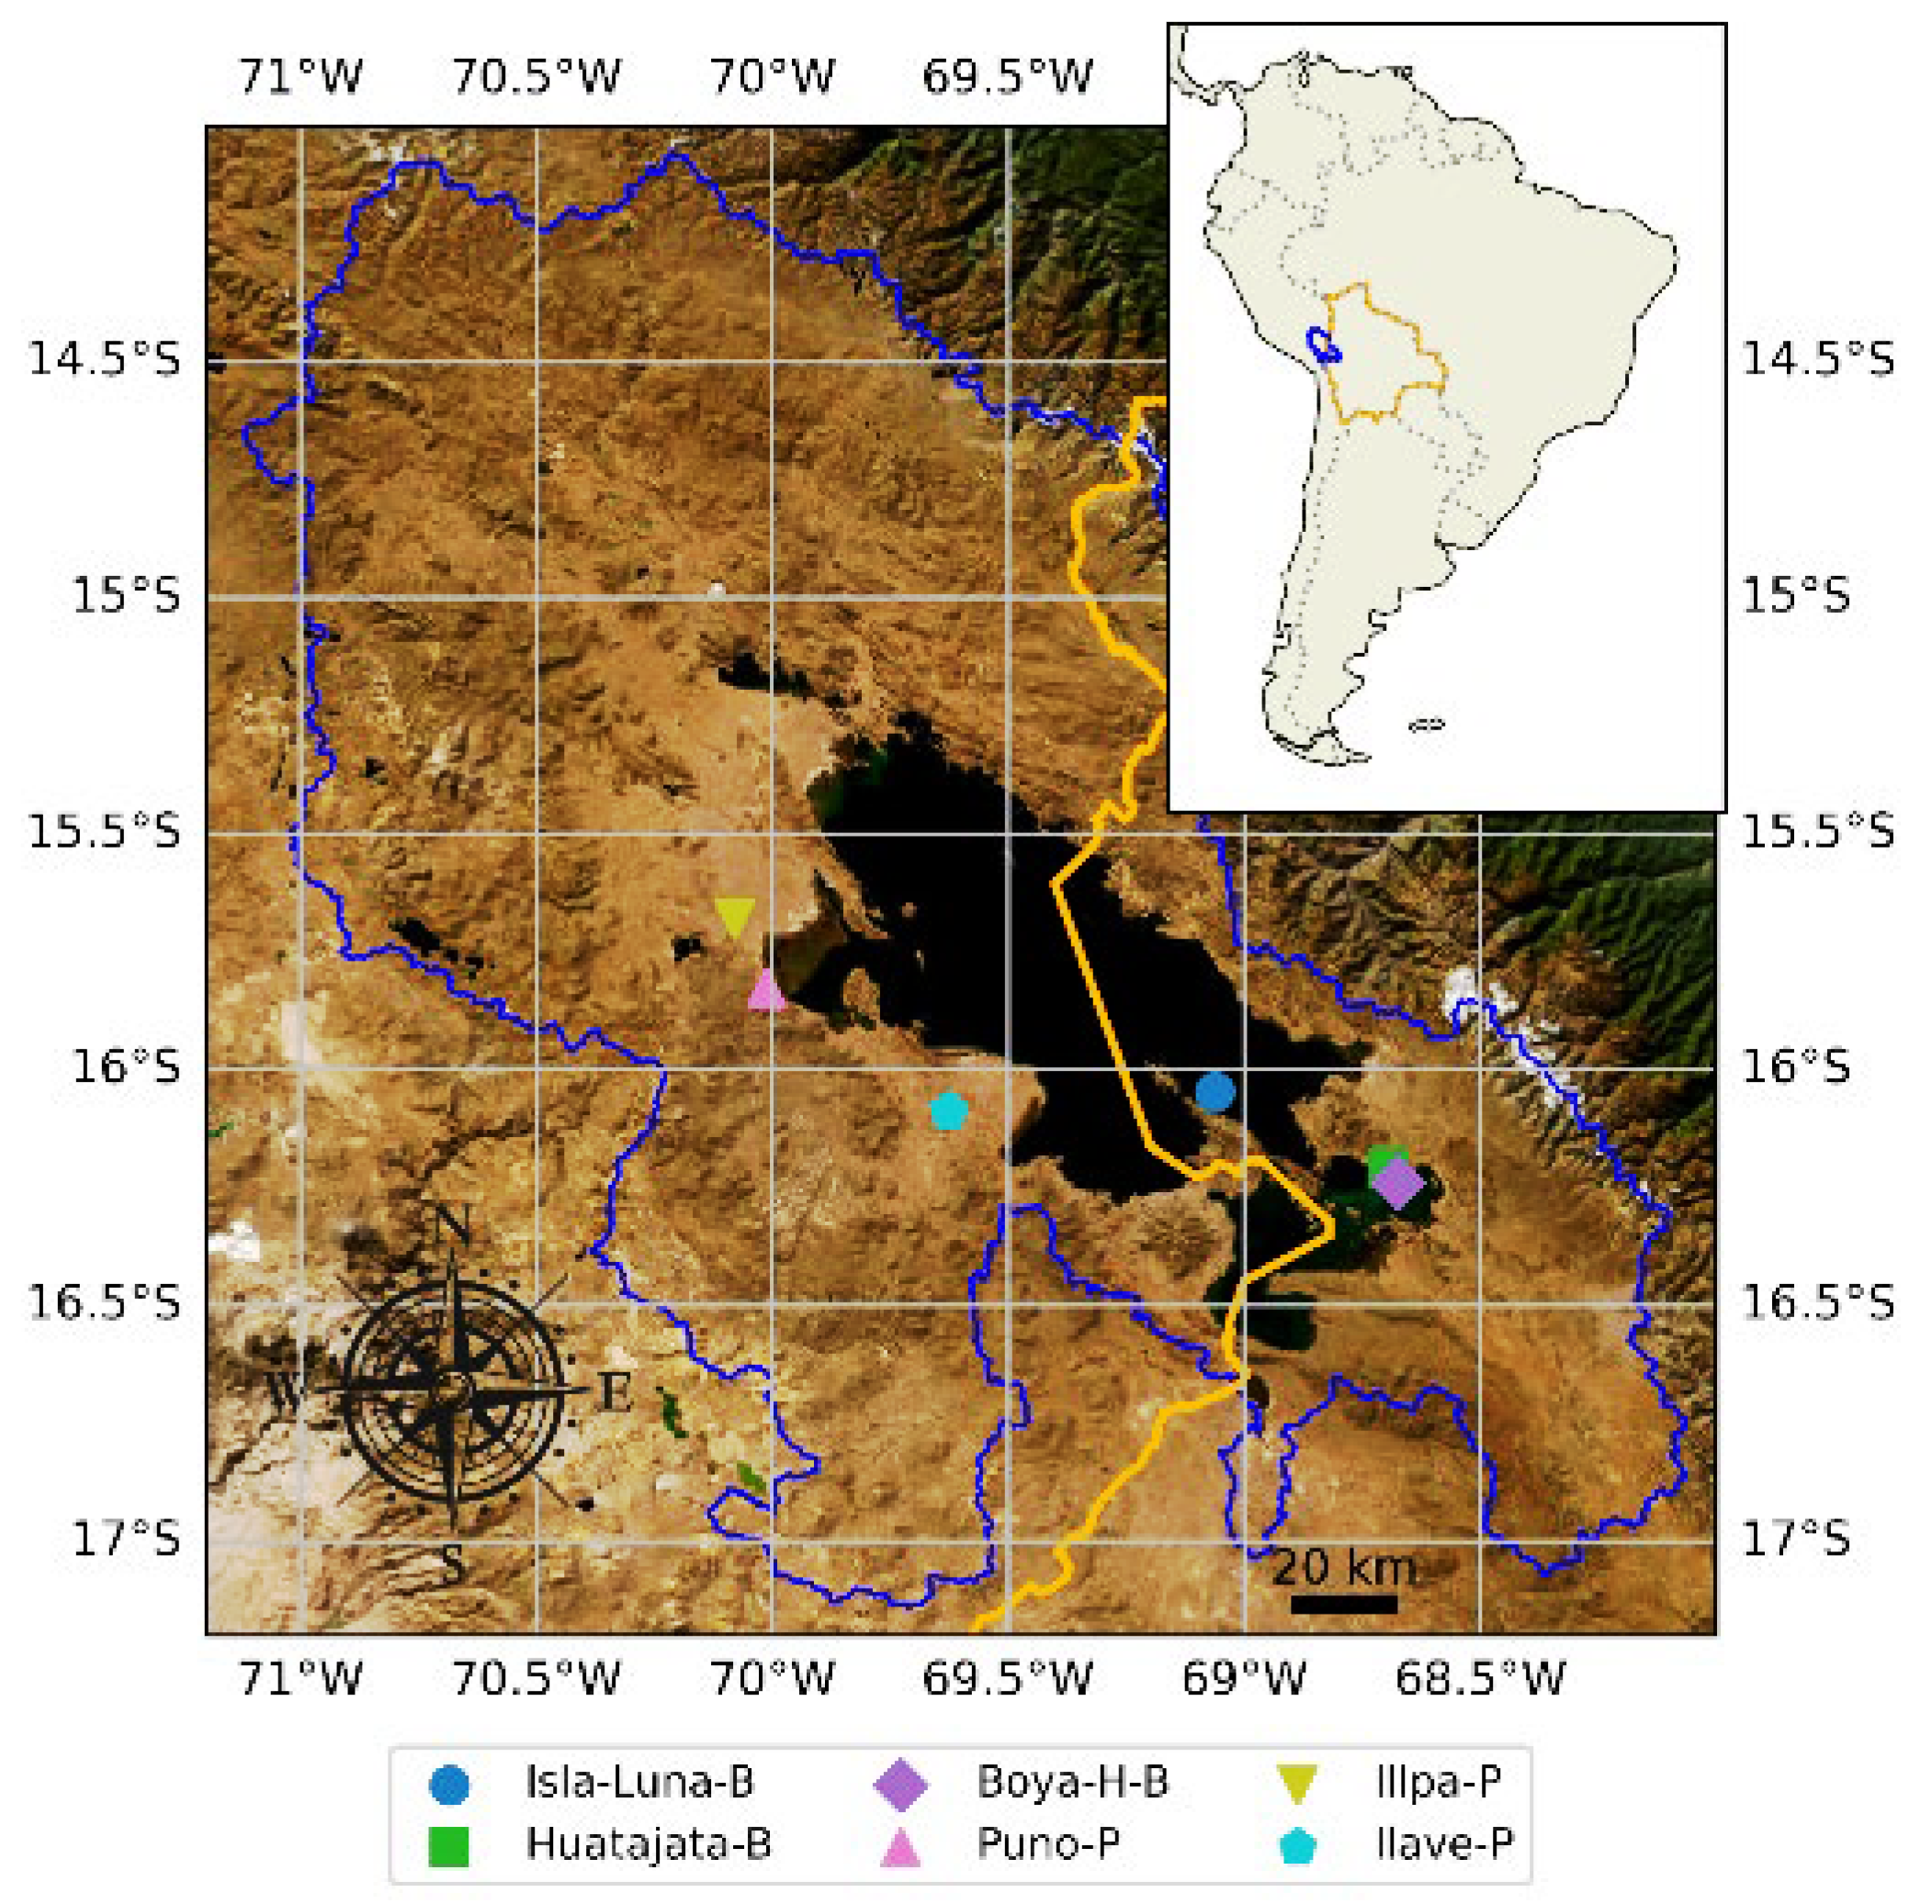
| Stations | Longitud | Latitud | Altitud (m.a.s.l.) | Technical Description |
|---|---|---|---|---|
| Isla de Luna, Bolivia (Isla-Luna-B) | 69° 03′ 44.28″ W | 16° 02′ 50.92″ S | 3812 | Campbell Scientific CSRAWS, Logan (Utah), USA. Equipped with rain gauge (TE525WS-L) [31], probe for RH/T (CS215) [32], anemometer (A100R) [33], wind vane (W200P) [33], pyranometer (SP1100) [34]. |
| Huatajata, Bolivia (Huatajata-B) | 68° 41′ 50.81″ W | 16° 12′ 41.09″ S | 3831 | Campbell Scientific CSRAWS, Logan (Utah), USA. Equipped with rain gauge (TE525WS-L) [31], probe for RH/T (CS215) [32], anemometer (A100R) [33], wind vane (W200P) [33], pyranometer (SP1100) [34]. |
| Boya-HidroMet, Bolivia (Boya-H-B) | 68° 40′ 26.76″ W | 16° 14′ 23.28″ S | 3811 | Vaisala WXT520, Vantaa, Finland [Vaisala, 2019]. Equipped with rain gauge (OTT Pluvio2) [35], sensors for RH/dew point/air temperature (HMP110, HMP155) [36], anemometers (WA15, WMT52, WMT703) [37], pyranometer (Li-200R) [38]. |
| Puno, Perú (Puno-P) | 70° 00′ 43.56″ W | 15° 49′ 34.68″ S | 3820 | Vaisala WXT520, Vantaa, Finland [Vaisala, 2019]. Equipped with rain gauge (OTT Pluvio2) [35], sensors for RH/dew point/air temperature (HMP110, HMP155) [36], anemometers (WA15, WMT52, WMT703) [37] |
| Illpa, Perú (Illpa-P) | 70° 04′ 47.28″ W | 15° 40′ 51.24″ S | 3827 | Vaisala WXT520, Vantaa, Finland [Vaisala, 2019]. Equipped with rain gauge (OTT Pluvio2) [35], sensors for RH/dew point/air temperature (HMP110, HMP155) [36], anemometers (WA15, WMT52, WMT703) [37] |
| Ilave, Perú (Ilave-P) | 69° 37′ 33.24″ W | 16° 05′ 17.52″ S | 3837 | Vaisala WXT520, Vantaa, Finland [Vaisala, 2019]. Equipped with rain gauge (OTT Pluvio2) [35], sensors for RH/dew point/air temperature (HMP110, HMP155) [36], anemometers (WA15, WMT52, WMT703) [37] |
| Weather Monitoring Network | |||||||
|---|---|---|---|---|---|---|---|
| Description | Huatajata-B | Boya-H-B | Isla-luna-B | Puno-P | Illpa-P | Ilave-P | |
| Record period | 2019-09-13T00 2022-04-07T13 | 2019-09-13T00 2022-04-07T13 | 2019-09-13T00 2022-04-07T13 | 2019-09-13T00 2022-04-07T13 | 2020-05-01T00 2022-04-07T13 | 2020-05-01T00 2022-04-07T13 | |
| Gaps, % | 0.00 | 7.73 | 0.00 | 0.30 | 5.87 | 0.09 | |
| raw data records | 22,502 | 20,763 | 22,502 | 22,435 | 15,962 | 16,942 | |
| Outlier values from raw data | 143 (0.77%) | 200 (0.96%) | 265 (1.18%) | 229 (1.02%) | 156 (0.98%) | 190 (1.12%) | |
| Consistency tests * | |||||||
| Range test | Tlow < Tair < Thigh | 0 | 0 | 0 | 0 | 0 | 10 |
| Persistency test | ThTh-1Th-2Th-3 | 0 | 0 | 0 | 4 | 7 | 3 |
| Step test | |Th-Th-1| < 4 | 171 | 1 | 3 | 210 | 953 | 359 |
| |Th-Th-2| < 7 | 20 | 0 | 0 | 35 | 1109 | 392 | |
| |Th-Th-3| < 9 | 4 | 0 | 0 | 20 | 1291 | 543 | |
| |Th-Th-6| < 15 | 0 | 0 | 0 | 7 | 1046 | 244 | |
| |Th-Th-12| < 25 | 0 | 0 | 0 | 0 | 25 | 0 | |
| Erroneous values from consistency tests | 187 (0.831%) | 001 (0.005%) | 003 (0.013%) | 252 (1.123%) | 2803 (17.560%) | 1098 (6.481%) | |
| Overlapping values with outliers | 9 | -- | -- | 18 | 32 | 20 | |
| clean data | 22,142 | 20,562 | 22,234 | 21,944 | 13,003 | 15,654 | |
| Huatajata-B | Boya-H-B | Isla-Luna-B | Illpa-P | Ilave-P | Puno-P | |
|---|---|---|---|---|---|---|
| Boya-H-B | 0.89/1.70 | |||||
| Isla-Luna-B | 0.84/2.23 | 0.79/1.89 | ||||
| Illpa-P | 0.90/3.76 | 0.85/4.65 | 0.74/5.49 | |||
| Ilave-P | 0.91/2.20 | 0.87/2.94 | 0.79/3.66 | 0.96/2.31 | ||
| Puno-P | 0.88/1.83 | 0.81/2.35 | 0.84/2.36 | 0.89/3.68 | 0.92/2.06 | 0.92/2.06 |
| Huatajata-B | Boya-H-B | Isla-Luna-B | Illpa-P | Ilave-P | Puno-P | |||||||
|---|---|---|---|---|---|---|---|---|---|---|---|---|
| Raw-data | Clean-data | Raw-data | Clean-data | Raw-data | Clean-data | Raw-data | Clean-data | Raw-data | Clean-data | Raw-data | Clean-data | |
| / | ||||||||||||
| LR-Spatial | 0.901 | 0.916 | 0.825 | 0.840 | 0.792 | 0.818 | 0.939 | 0.950 | 0.952 | 0.957 | 0.892 | 0.933 |
| RF-Spatial | 0.913 | 0.923 | 0.844 | 0.858 | 0.815 | 0.829 | 0.945 | 0.952 | 0.956 | 0.959 | 0.911 | 0.939 |
| RMSE/ | ||||||||||||
| LR-Spatial | 1.142 | 1.122 | 1.071 | 1.069 | 1.035 | 0.991 | 1.581 | 1.488 | 1.077 | 1.059 | 1.335 | 1.084 |
| RF-Spatial | 1.065 | 1.071 | 1.011 | 1.007 | 0.978 | 0.963 | 1.497 | 1.457 | 1.034 | 1.035 | 1.217 | 1.033 |
| Huatajata-B | Boya-H-B | Isla-Luna-B | Illpa-P | Ilave-P | Puno-P | |||||||
|---|---|---|---|---|---|---|---|---|---|---|---|---|
| Raw data | Clean data | Raw data | Clean data | Raw data | Clean data | Raw data | Clean data | Raw data | Clean data | Raw data | Clean data | |
| RF | 0.876 | 0.883 | 0.830 | 0.837 | 0.793 | 0.810 | 0.944 | 0.951 | 0.938 | 0.946 | 0.908 | 0.917 |
| SVM | 0.794 | 0.808 | 0.755 | 0.762 | 0.741 | 0.753 | 0.887 | 0.891 | 0.883 | 0.895 | 0.860 | 0.867 |
| ADAB | 0.807 | 0.830 | 0.736 | 0.757 | 0.702 | 0.735 | 0.898 | 0.920 | 0.883 | 0.907 | 0.846 | 0.876 |
| STACK | 0.874 | 0.881 | 0.828 | 0.835 | 0.791 | 0.806 | 0.943 | 0.949 | 0.937 | 0.945 | 0.906 | 0.915 |
| RMSE | ||||||||||||
| RF | 1.197 | 1.158 | 1.001 | 0.974 | 1.040 | 0.985 | 1.446 | 1.422 | 1.173 | 1.100 | 1.155 | 1.098 |
| SVM | 1.540 | 1.485 | 1.200 | 1.178 | 1.164 | 1.124 | 2.056 | 2.113 | 1.605 | 1.536 | 1.422 | 1.385 |
| ADAB | 1.491 | 1.396 | 1.247 | 1.189 | 1.249 | 1.165 | 1.952 | 1.810 | 1.607 | 1.452 | 1.492 | 1.336 |
| STACK | 1.207 | 1.169 | 1.005 | 0.979 | 1.046 | 0.995 | 1.464 | 1.441 | 1.182 | 1.111 | 1.169 | 1.105 |
| Clean Data | Huatajata-B | Boya-H-B | Isla-Luna-B | Illpa-P | Ilave-P | Puno-P |
|---|---|---|---|---|---|---|
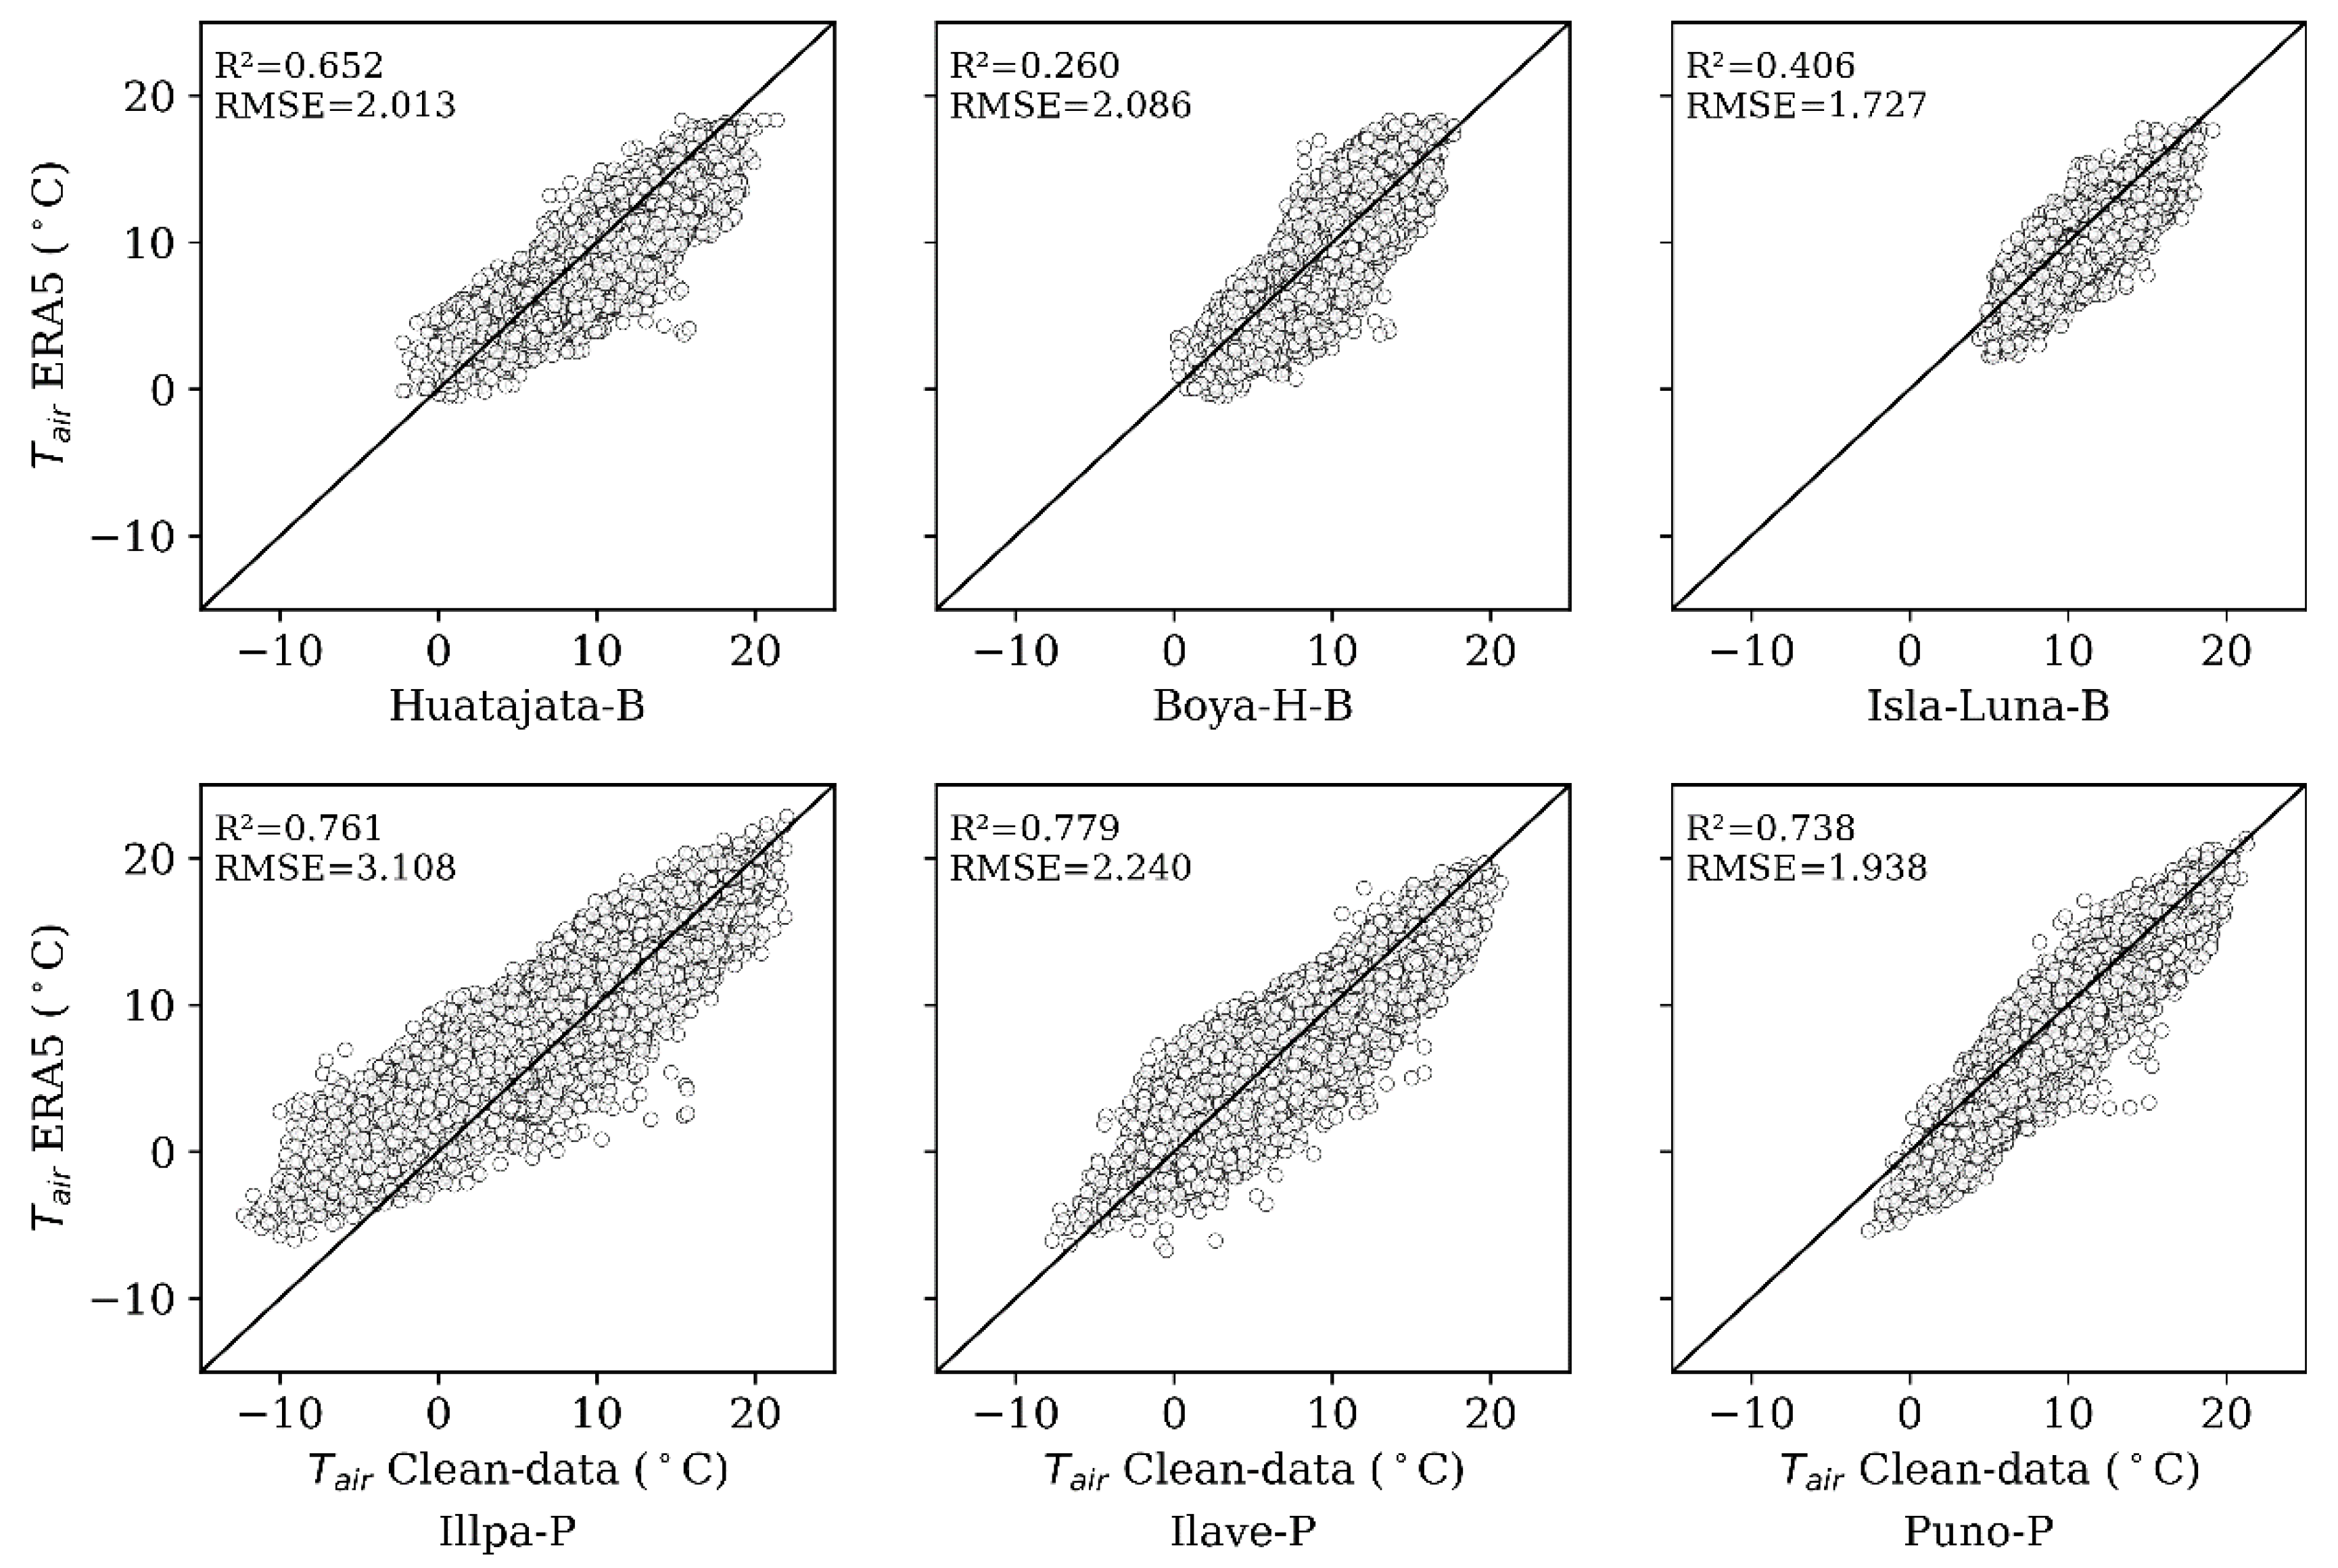
| ERA5 | −1.021 | −0.998 | −1.224 | 1.251 | −0.678 | −1.260 |
| RF-Spatial | −0.033 | −0.030 | 0.012 | −0.006 | 0.047 | −0.064 |
| RF-Temporal | −0.076 | −0.046 | 0.013 | −0.054 | −0.032 | 0.005 |
Disclaimer/Publisher’s Note: The statements, opinions and data contained in all publications are solely those of the individual author(s) and contributor(s) and not of MDPI and/or the editor(s). MDPI and/or the editor(s) disclaim responsibility for any injury to people or property resulting from any ideas, methods, instructions or products referred to in the content. |
© 2025 by the authors. Licensee MDPI, Basel, Switzerland. This article is an open access article distributed under the terms and conditions of the Creative Commons Attribution (CC BY) license (https://creativecommons.org/licenses/by/4.0/).
Share and Cite
Sirpa-Poma, J.W.; Calle, J.; Uscamayta-Ferrano, E.; Molina-Carpio, J.; Satgé, F.; Cuentas Toledo, O.; Duran, R.; Pacheco Mollinedo, P.; Hussain, R.; Pillco-Zolá, R. Development of Hourly Resolution Air Temperature Across Titicaca Lake on Auxiliary ERA5 Variables and Machine Learning-Based Gap-Filling. Sensors 2025, 25, 7165. https://doi.org/10.3390/s25237165
Sirpa-Poma JW, Calle J, Uscamayta-Ferrano E, Molina-Carpio J, Satgé F, Cuentas Toledo O, Duran R, Pacheco Mollinedo P, Hussain R, Pillco-Zolá R. Development of Hourly Resolution Air Temperature Across Titicaca Lake on Auxiliary ERA5 Variables and Machine Learning-Based Gap-Filling. Sensors. 2025; 25(23):7165. https://doi.org/10.3390/s25237165
Chicago/Turabian StyleSirpa-Poma, Jimmy W., Juan Calle, Elvis Uscamayta-Ferrano, Jorge Molina-Carpio, Frederic Satgé, Osmar Cuentas Toledo, Ricardo Duran, Paula Pacheco Mollinedo, Riaz Hussain, and Ramiro Pillco-Zolá. 2025. "Development of Hourly Resolution Air Temperature Across Titicaca Lake on Auxiliary ERA5 Variables and Machine Learning-Based Gap-Filling" Sensors 25, no. 23: 7165. https://doi.org/10.3390/s25237165
APA StyleSirpa-Poma, J. W., Calle, J., Uscamayta-Ferrano, E., Molina-Carpio, J., Satgé, F., Cuentas Toledo, O., Duran, R., Pacheco Mollinedo, P., Hussain, R., & Pillco-Zolá, R. (2025). Development of Hourly Resolution Air Temperature Across Titicaca Lake on Auxiliary ERA5 Variables and Machine Learning-Based Gap-Filling. Sensors, 25(23), 7165. https://doi.org/10.3390/s25237165


