Enhancing Signal and Network Integrity: Evaluating BCG Artifact Removal Techniques in Simultaneous EEG-fMRI Data
Highlights
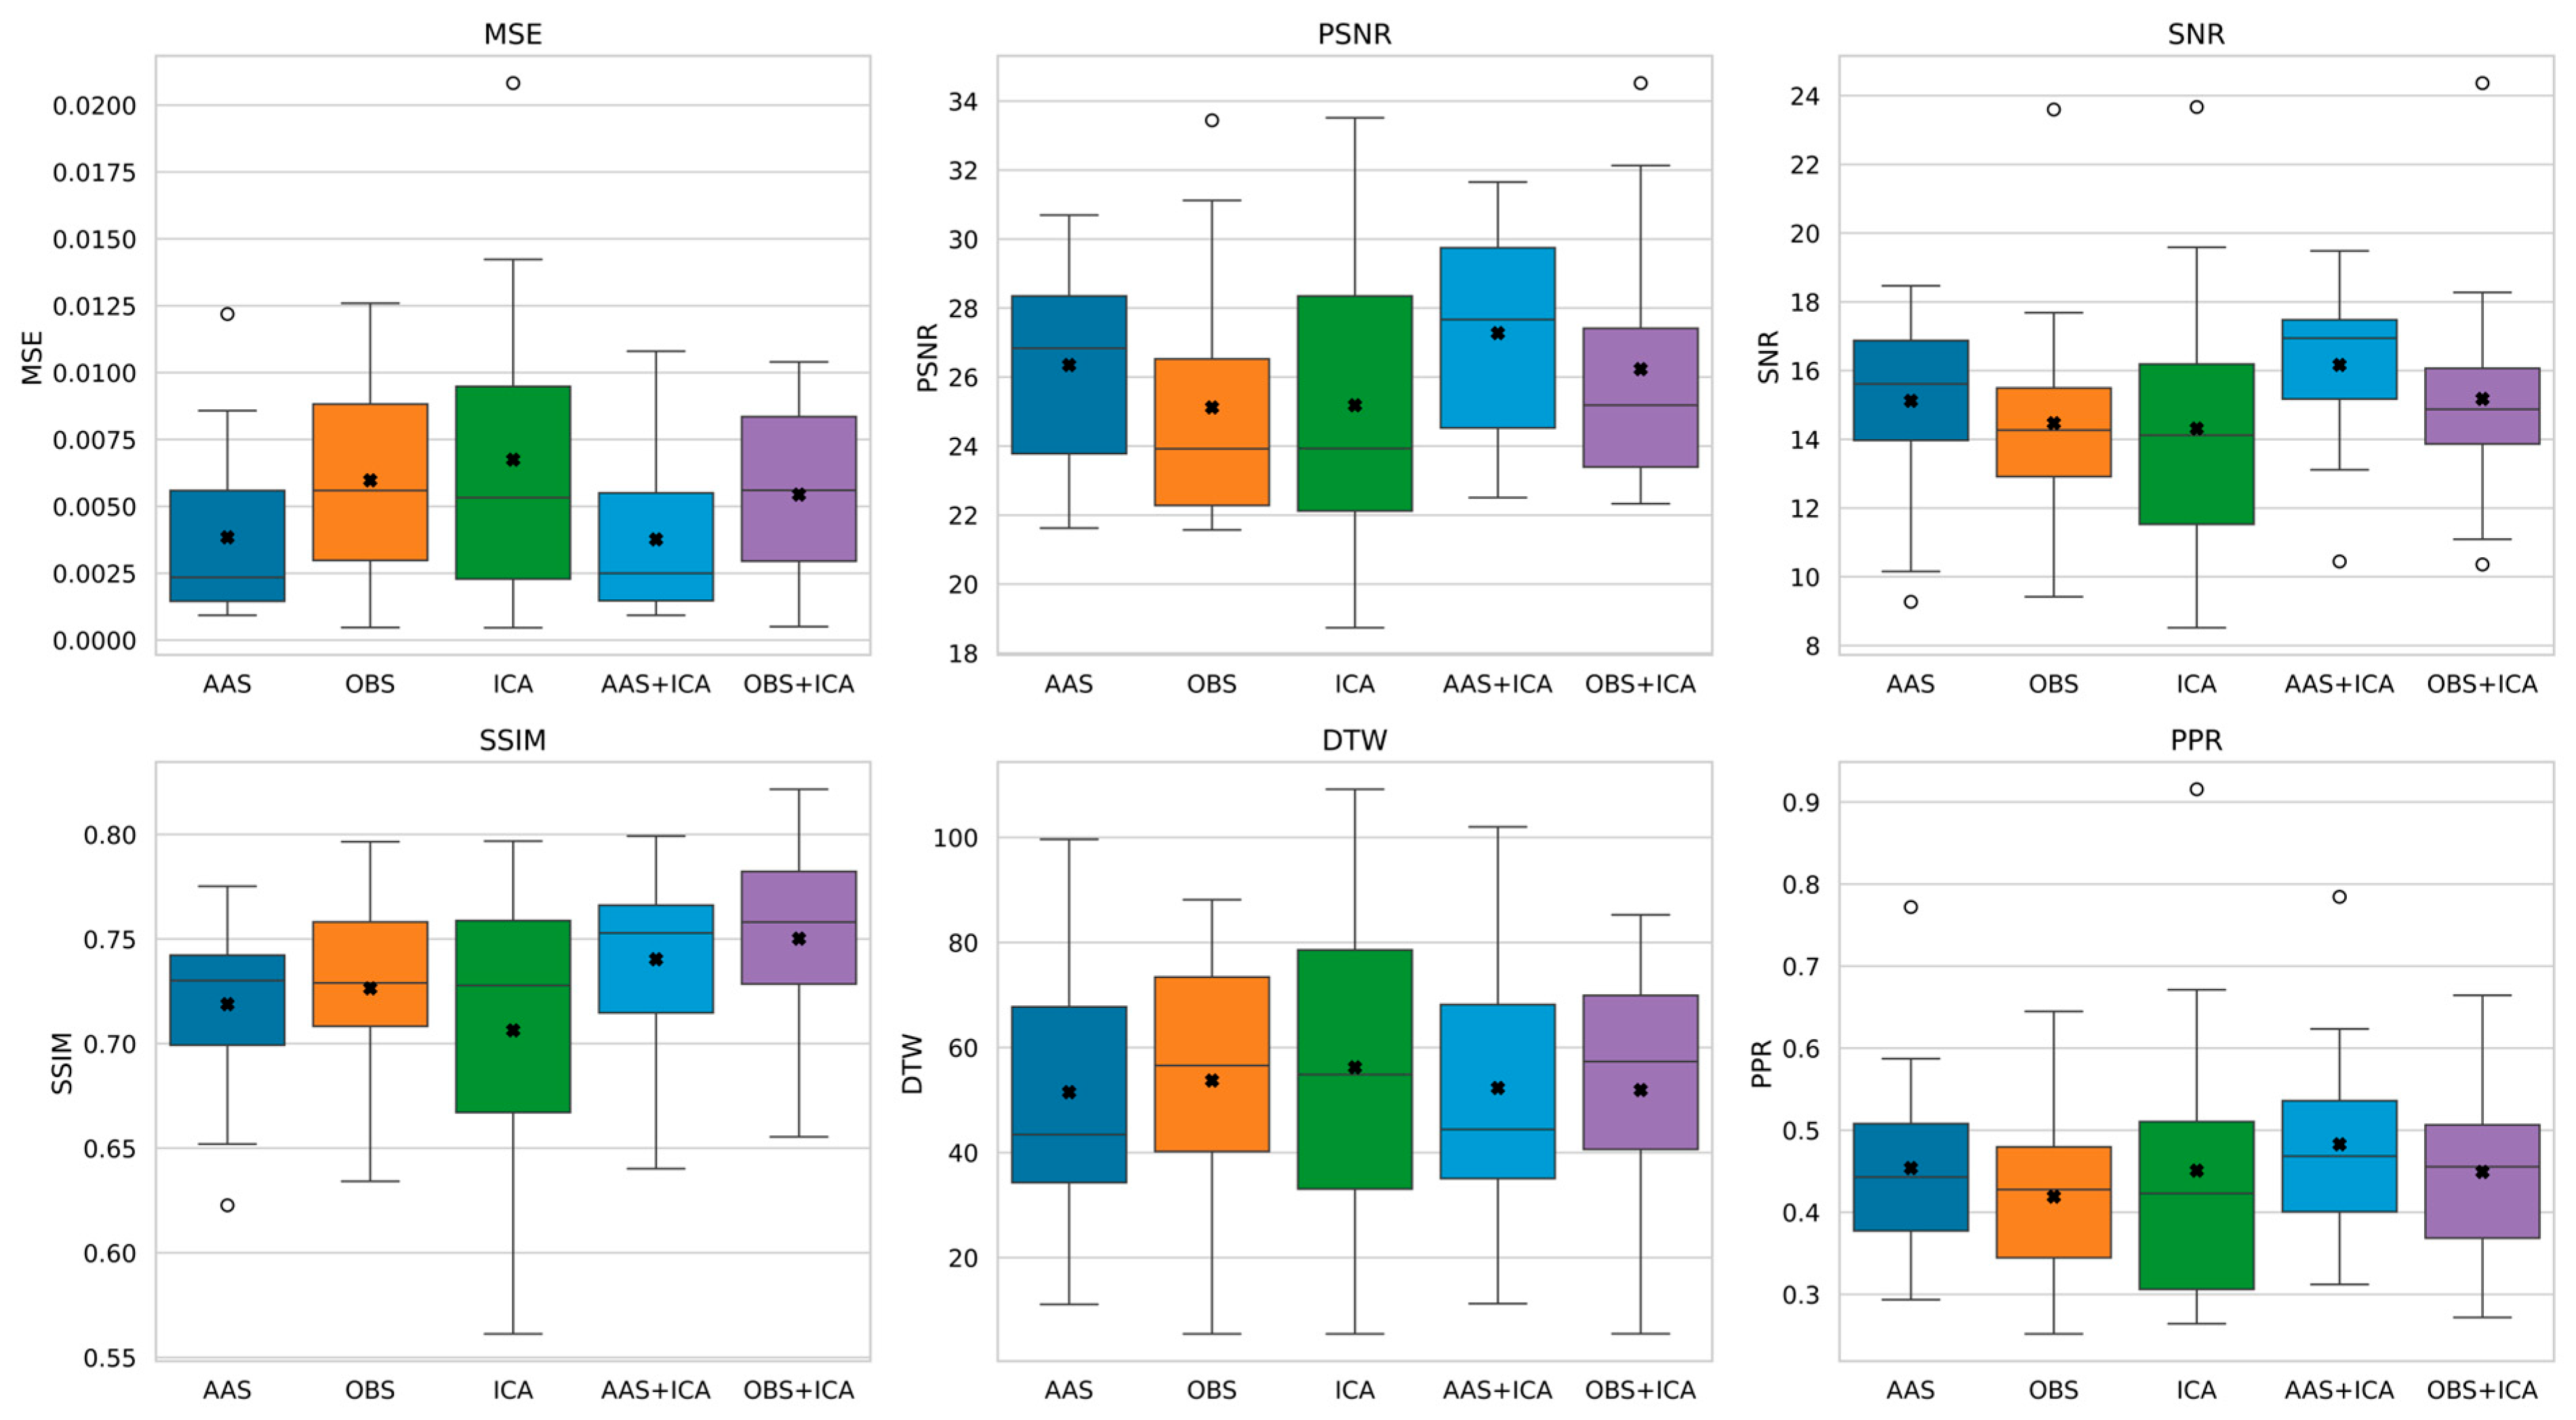
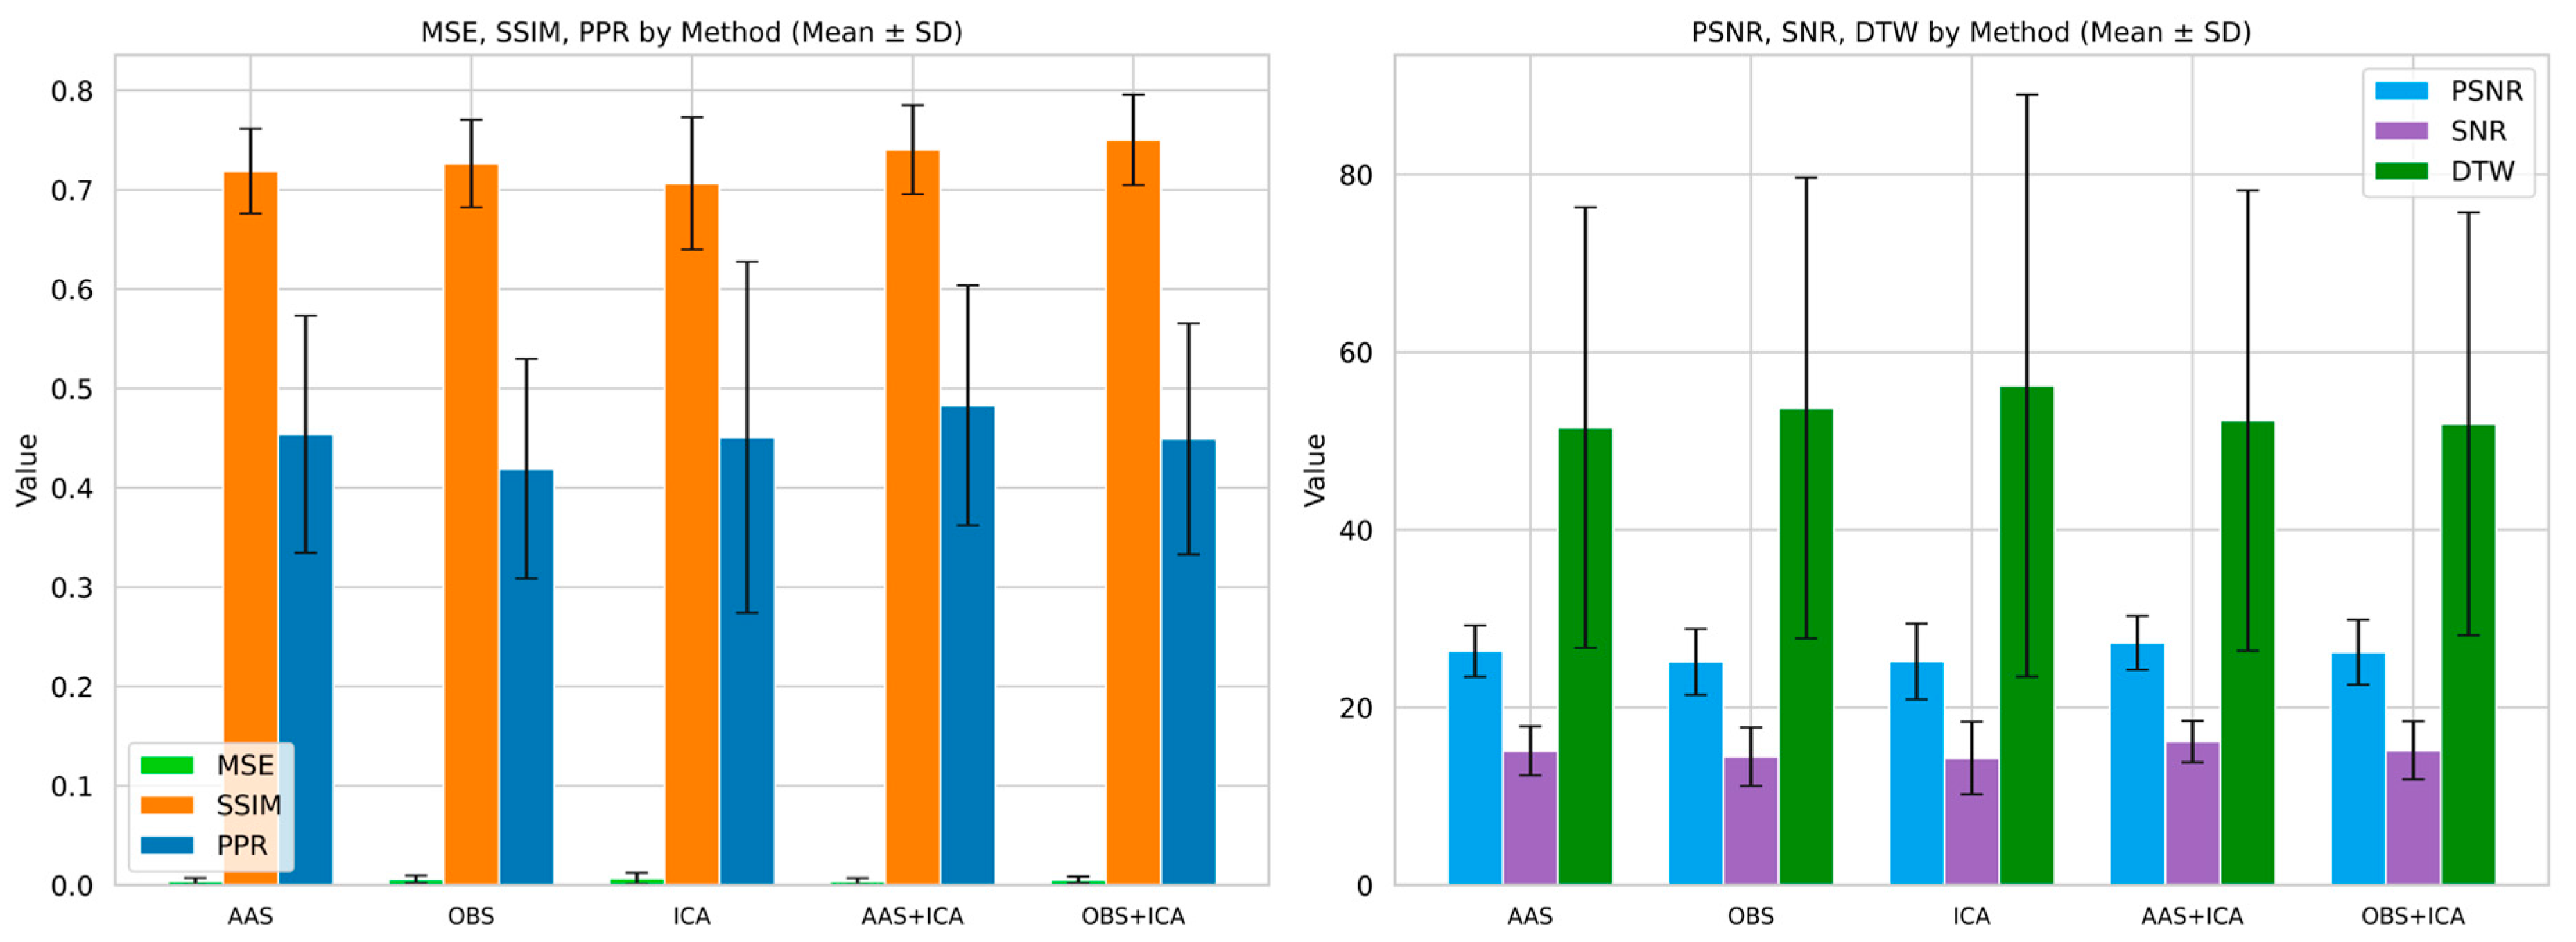
- AAS achieved the best signal fidelity (MSE = 0.0038, PSNR = 26.34 dB), and OBS yielded the highest structural similarity (SSIM = 0.72), whereas ICA showed greater sensitivity in dynamic graph metrics.
- Connectivity graphs after artifact removal displayed distinct frequency-specific patterns, particularly in the beta and gamma bands.
- Artifact removal affects both EEG signal preprocessing and the topological interpretation of the functional brain networks.
- Method selection is critical for reliable connectivity and graph-based analyses in EEG–fMRI studies.
Abstract
1. Introduction
- Artifact removal methods (Average Artifact Subtraction (AAS), Optimal Basis Set (OBS), and Independent Component Analysis (ICA)) were evaluated not only in terms of signal quality but also in terms of their topological effects on functional connectivity.
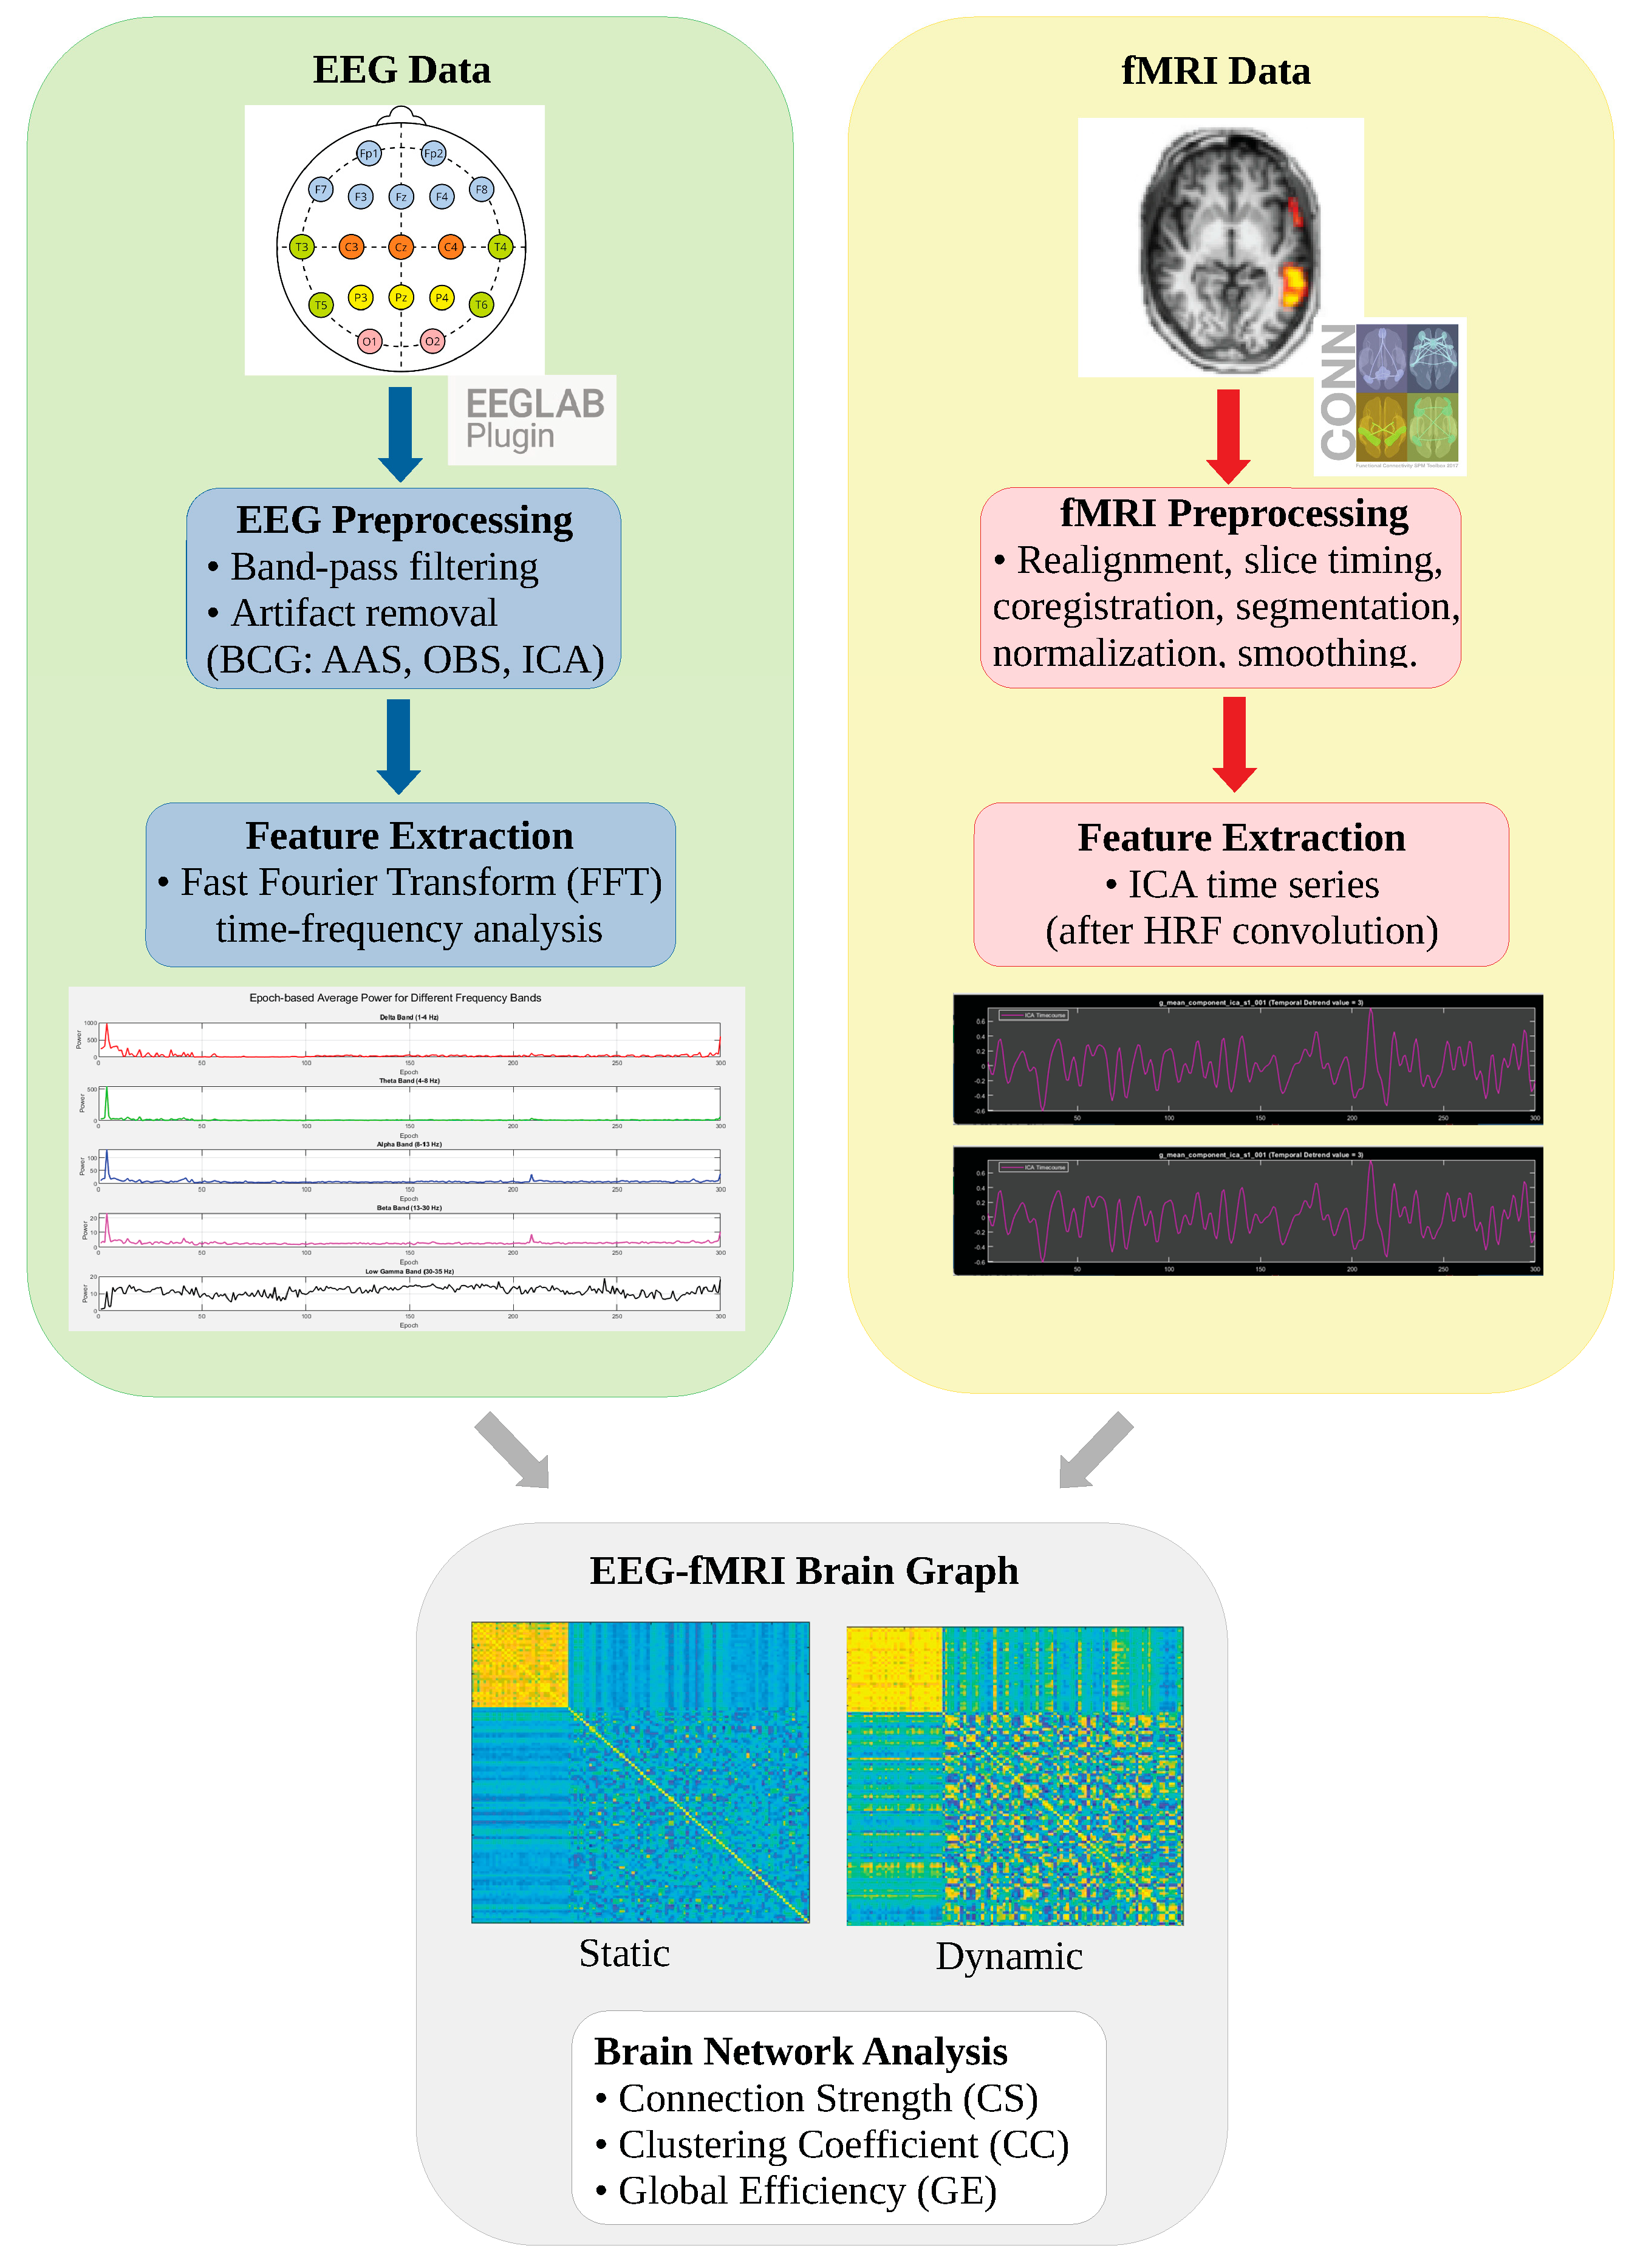
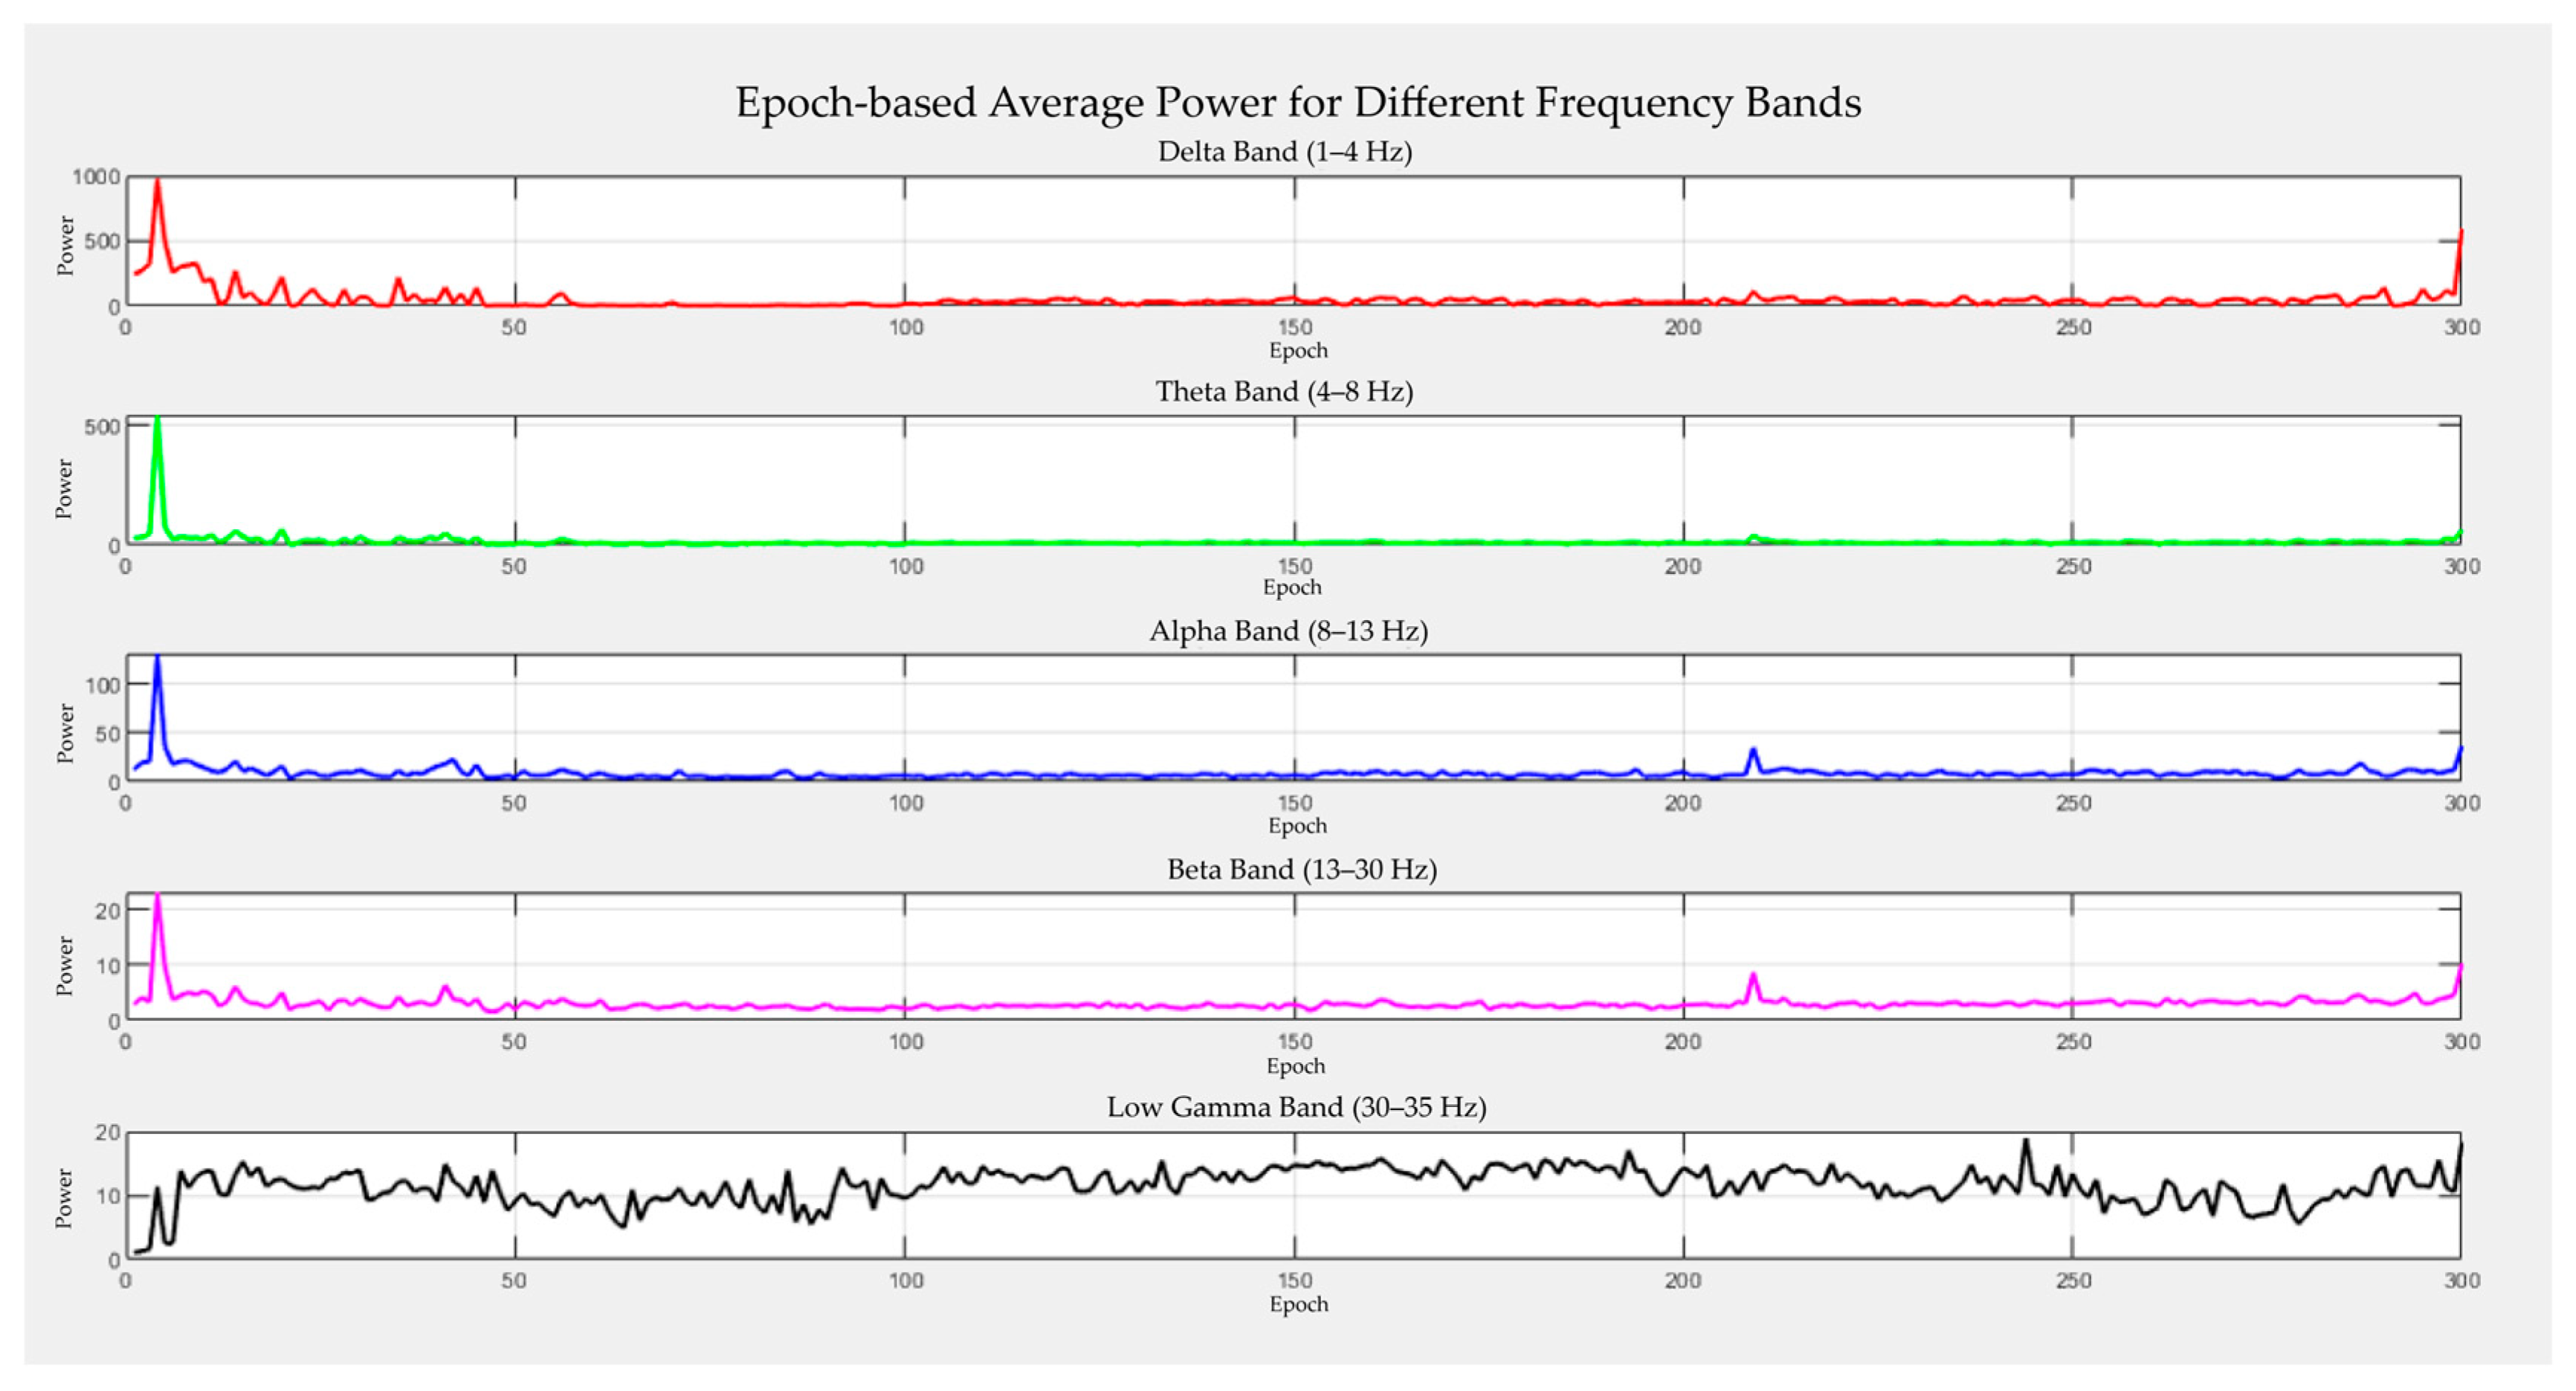
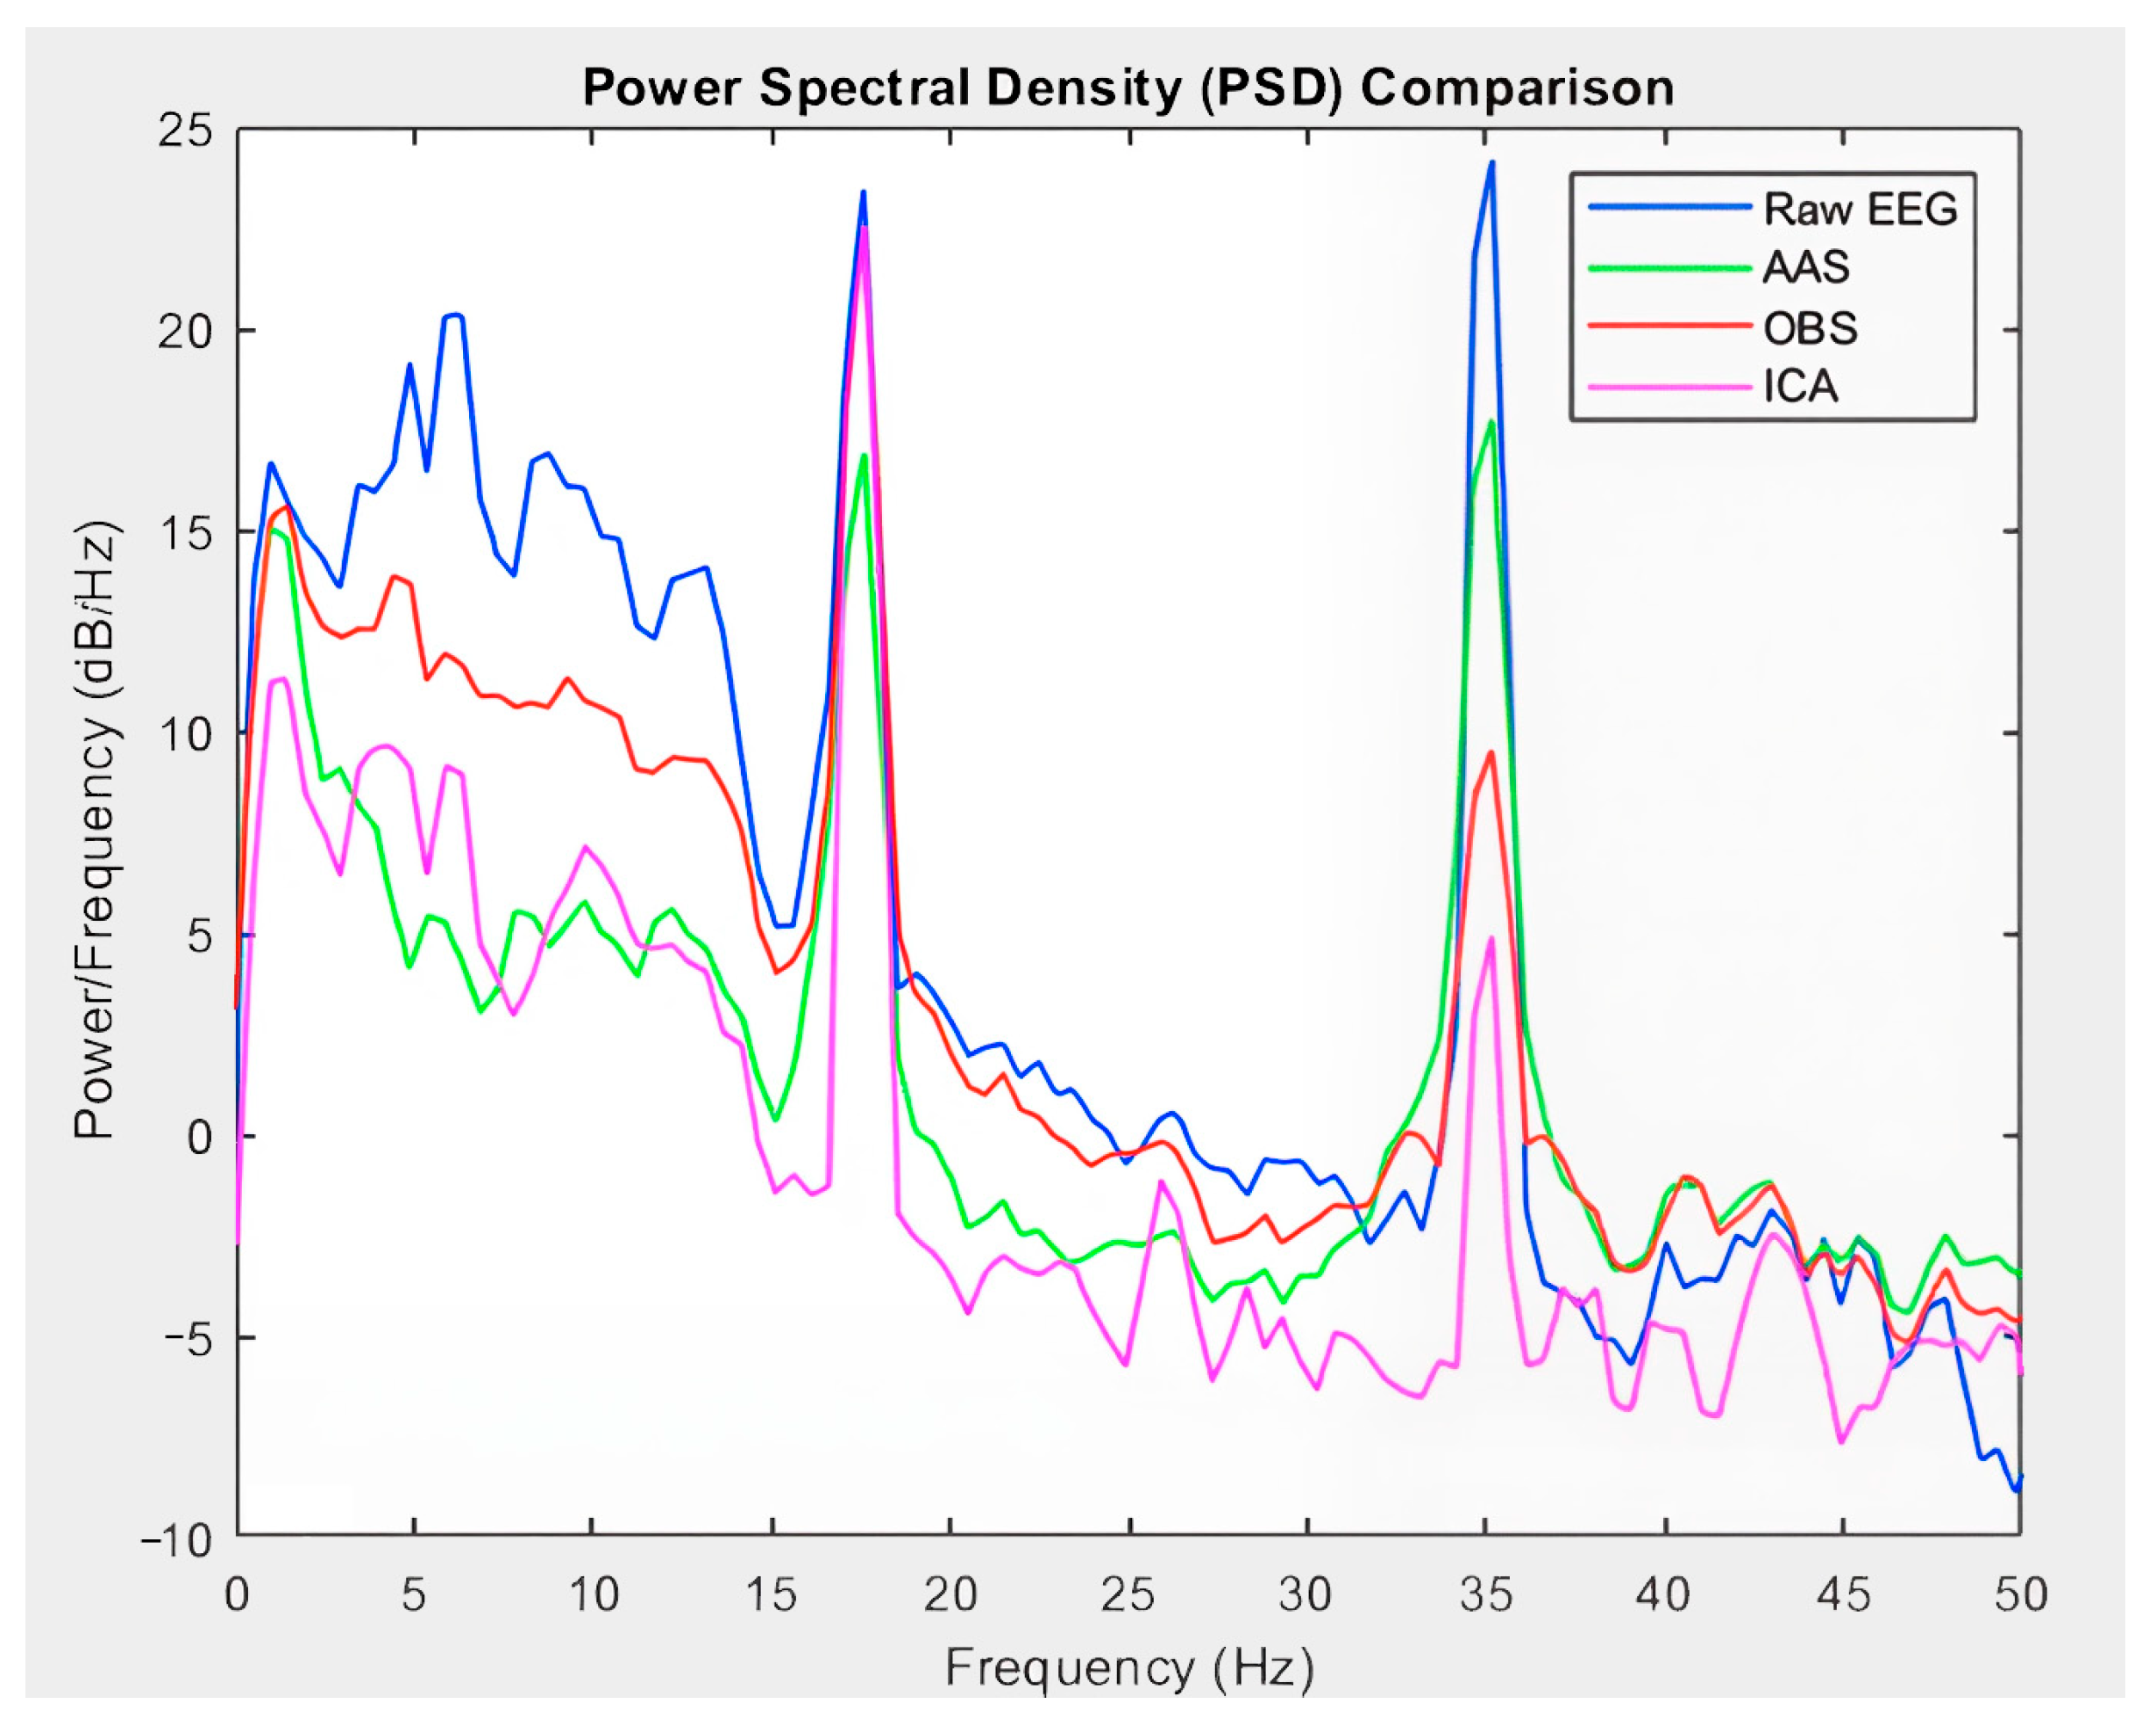
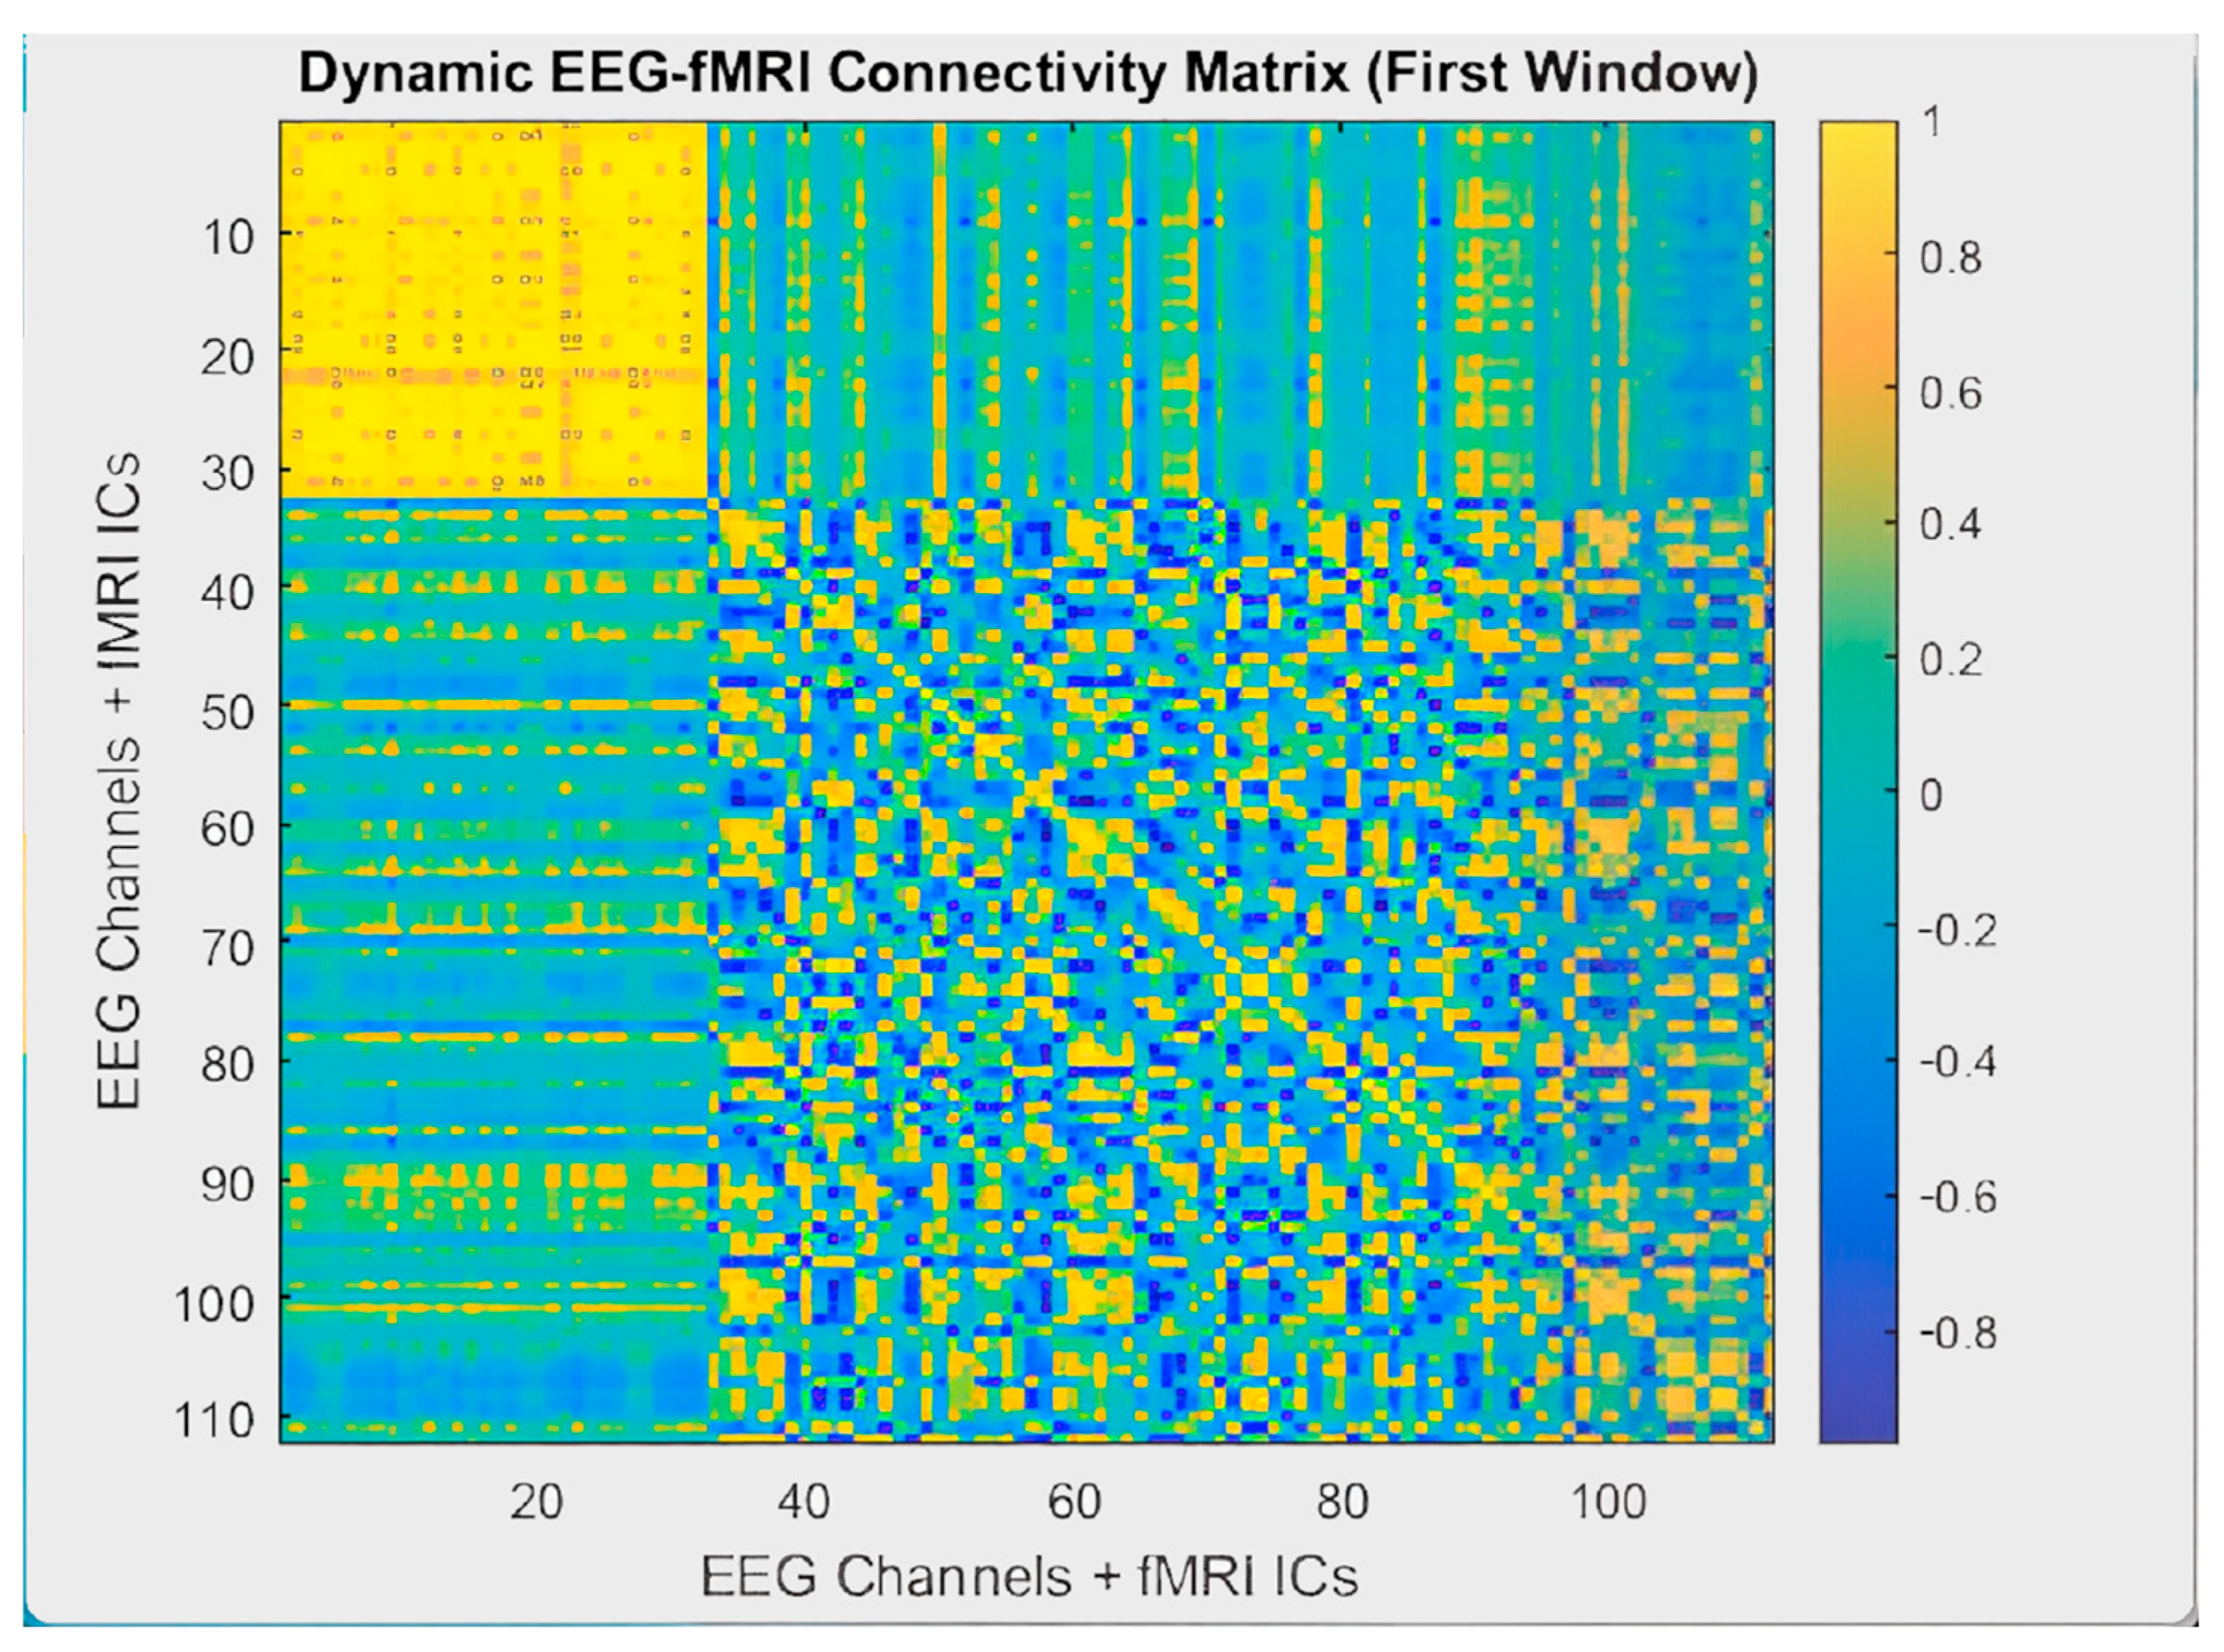
- The signal-level performance was analyzed in a multifaceted manner using independent metrics, such as the Mean Squared Error (MSE), Peak Signal-to-Noise Ratio (PSNR), Signal-to-Noise Ratio (SNR), Structural Similarity Index (SSIM), Dynamic Time Warping (DTW), and Peak-to-Peak Ratio (PPR). The preservation of the frequency components was examined using Power Spectral Density (PSD) analysis. The EEG and fMRI time series were combined on a correlation basis, and static and dynamic brain plots were generated for each frequency band.
- Graph theory metrics, such as Connection Strength (CS), Clustering Coefficient (CC), and Global Efficiency (GE), were used to systematically analyze the effects of the methods on functional connectivity patterns.
Related Works
2. Materials and Methods
2.1. Dataset
- Outside the MRI scanner (artifact-free EEG),
- Inside the scanner without fMRI acquisition (EEG affected only by BCG artifacts),
- During simultaneous EEG-fMRI acquisition (EEG was affected by both the MRI gradient and BCG artifacts).
2.2. EEG Preprocessing
2.2.1. BCG Artifact Removal Methods
2.2.2. Performance Evaluation Metrics
2.3. EEG Analysis
2.4. fMRI Preprocessing
2.5. fMRI Analysis
2.6. EEG-fMRI Brain Graph Construction
2.6.1. Convolution with HRF: Ensuring EEG-fMRI Time Coherence
2.6.2. Correlation Analysis
2.6.3. Static EEG-fMRI Brain Graphs
2.6.4. Dynamic EEG-fMRI Brain Graphs
2.6.5. Brain Graph Evaluation Metrics
3. Results
3.1. Method Comparison on Signal Quality
- The AAS + ICA combination performed best in terms of MSE, PSNR, SNR, and PPR metrics, making it the most effective method in terms of both artifact removal success and signal quality.
- On the other hand, the OBS + ICA method gave the highest result in terms of SSIM value and best preserved the structural integrity of the signal.
3.2. Statistical Evaluation: Graph Metric Comparisons Across Frequency Bands
4. Discussion
5. Conclusions
Author Contributions
Funding
Institutional Review Board Statement
Informed Consent Statement
Data Availability Statement
Acknowledgments
Conflicts of Interest
Abbreviations
| AAS | Average Artifact Subtraction |
| BCG | Directory of open access journals |
| BIDS | Brain imaging data structure |
| CC | Clustering coefficient |
| CS | Connection strength |
| DTW | Dynamic time warping |
| DMN | Default mode network |
| EC | Eyes closed |
| EEG | Electroencephalography |
| EPI | Echo planar imaging |
| EO | Eyes open |
| FDR | False discovery rate |
| FOV | Field of view |
| FFT | Fast Fourier transform |
| fMRI | Functional magnetic resonance imaging |
| GE | Global efficiency |
| GIFT | Group ICA of the fMRI toolbox |
| HRF | Hemodynamic response function |
| ICA | Independent component analysis |
| ICN | Independent component network |
| IQ | Stability index |
| JICA | Joint independent component analysis |
| MSE | Mean squared error |
| OBS | Optimal basis set |
| PCA | Principal component analysis |
| PSD | Power spectral density |
| PPR | Peak-to-peak ratio |
| SNR | Signal-to-noise ratio |
| SSIM | Structural similarity index |
| TR | Repetition time |
| TE | Echo time |
Appendix A
| Mean ± SD | MSE | PSNR (dB) | SNR (dB) | SSIM | DTW | PPR |
|---|---|---|---|---|---|---|
| AAS | 0.0038 ± 0.0032 | 26.3484 ± 2.8016 | 15.1198 ± 2.6563 | 0.7188 ± 0.0413 | 51.4970 ± 23.9658 | 0.4538 ± 0.1152 |
| OBS | 0.0059 ± 0.0036 | 25.1214 ± 3.5812 | 14.4701 ± 3.1858 | 0.7264 ± 0.0425 | 53.7106 ± 25.0494 | 0.4190 ± 0.1067 |
| ICA | 0.0067 ± 0.0043 | 25.1823 ± 4.0892 | 14.3125 ± 3.8654 | 0.7063 ± 0.0641 | 56.2264 ± 29.5970 | 0.4507 ± 0.1684 |
| AAS + ICA | 0.0035 ± 0.0031 | 27.2753 ± 2.9333 | 16.1648 ± 2.2601 | 0.7403 ± 0.0433 | 52.2920 ± 25.0441 | 0.4828 ± 0.1167 |
| OBS + ICA | 0.0054 ± 0.0031 | 26.2289 ± 3.5166 | 15.1749 ± 3.1685 | 0.7502 ± 0.0440 | 51.9202 ± 22.9925 | 0.4491 ± 0.1123 |
Appendix B
| Frequency Band Pairs | CS | CC | GE |
|---|---|---|---|
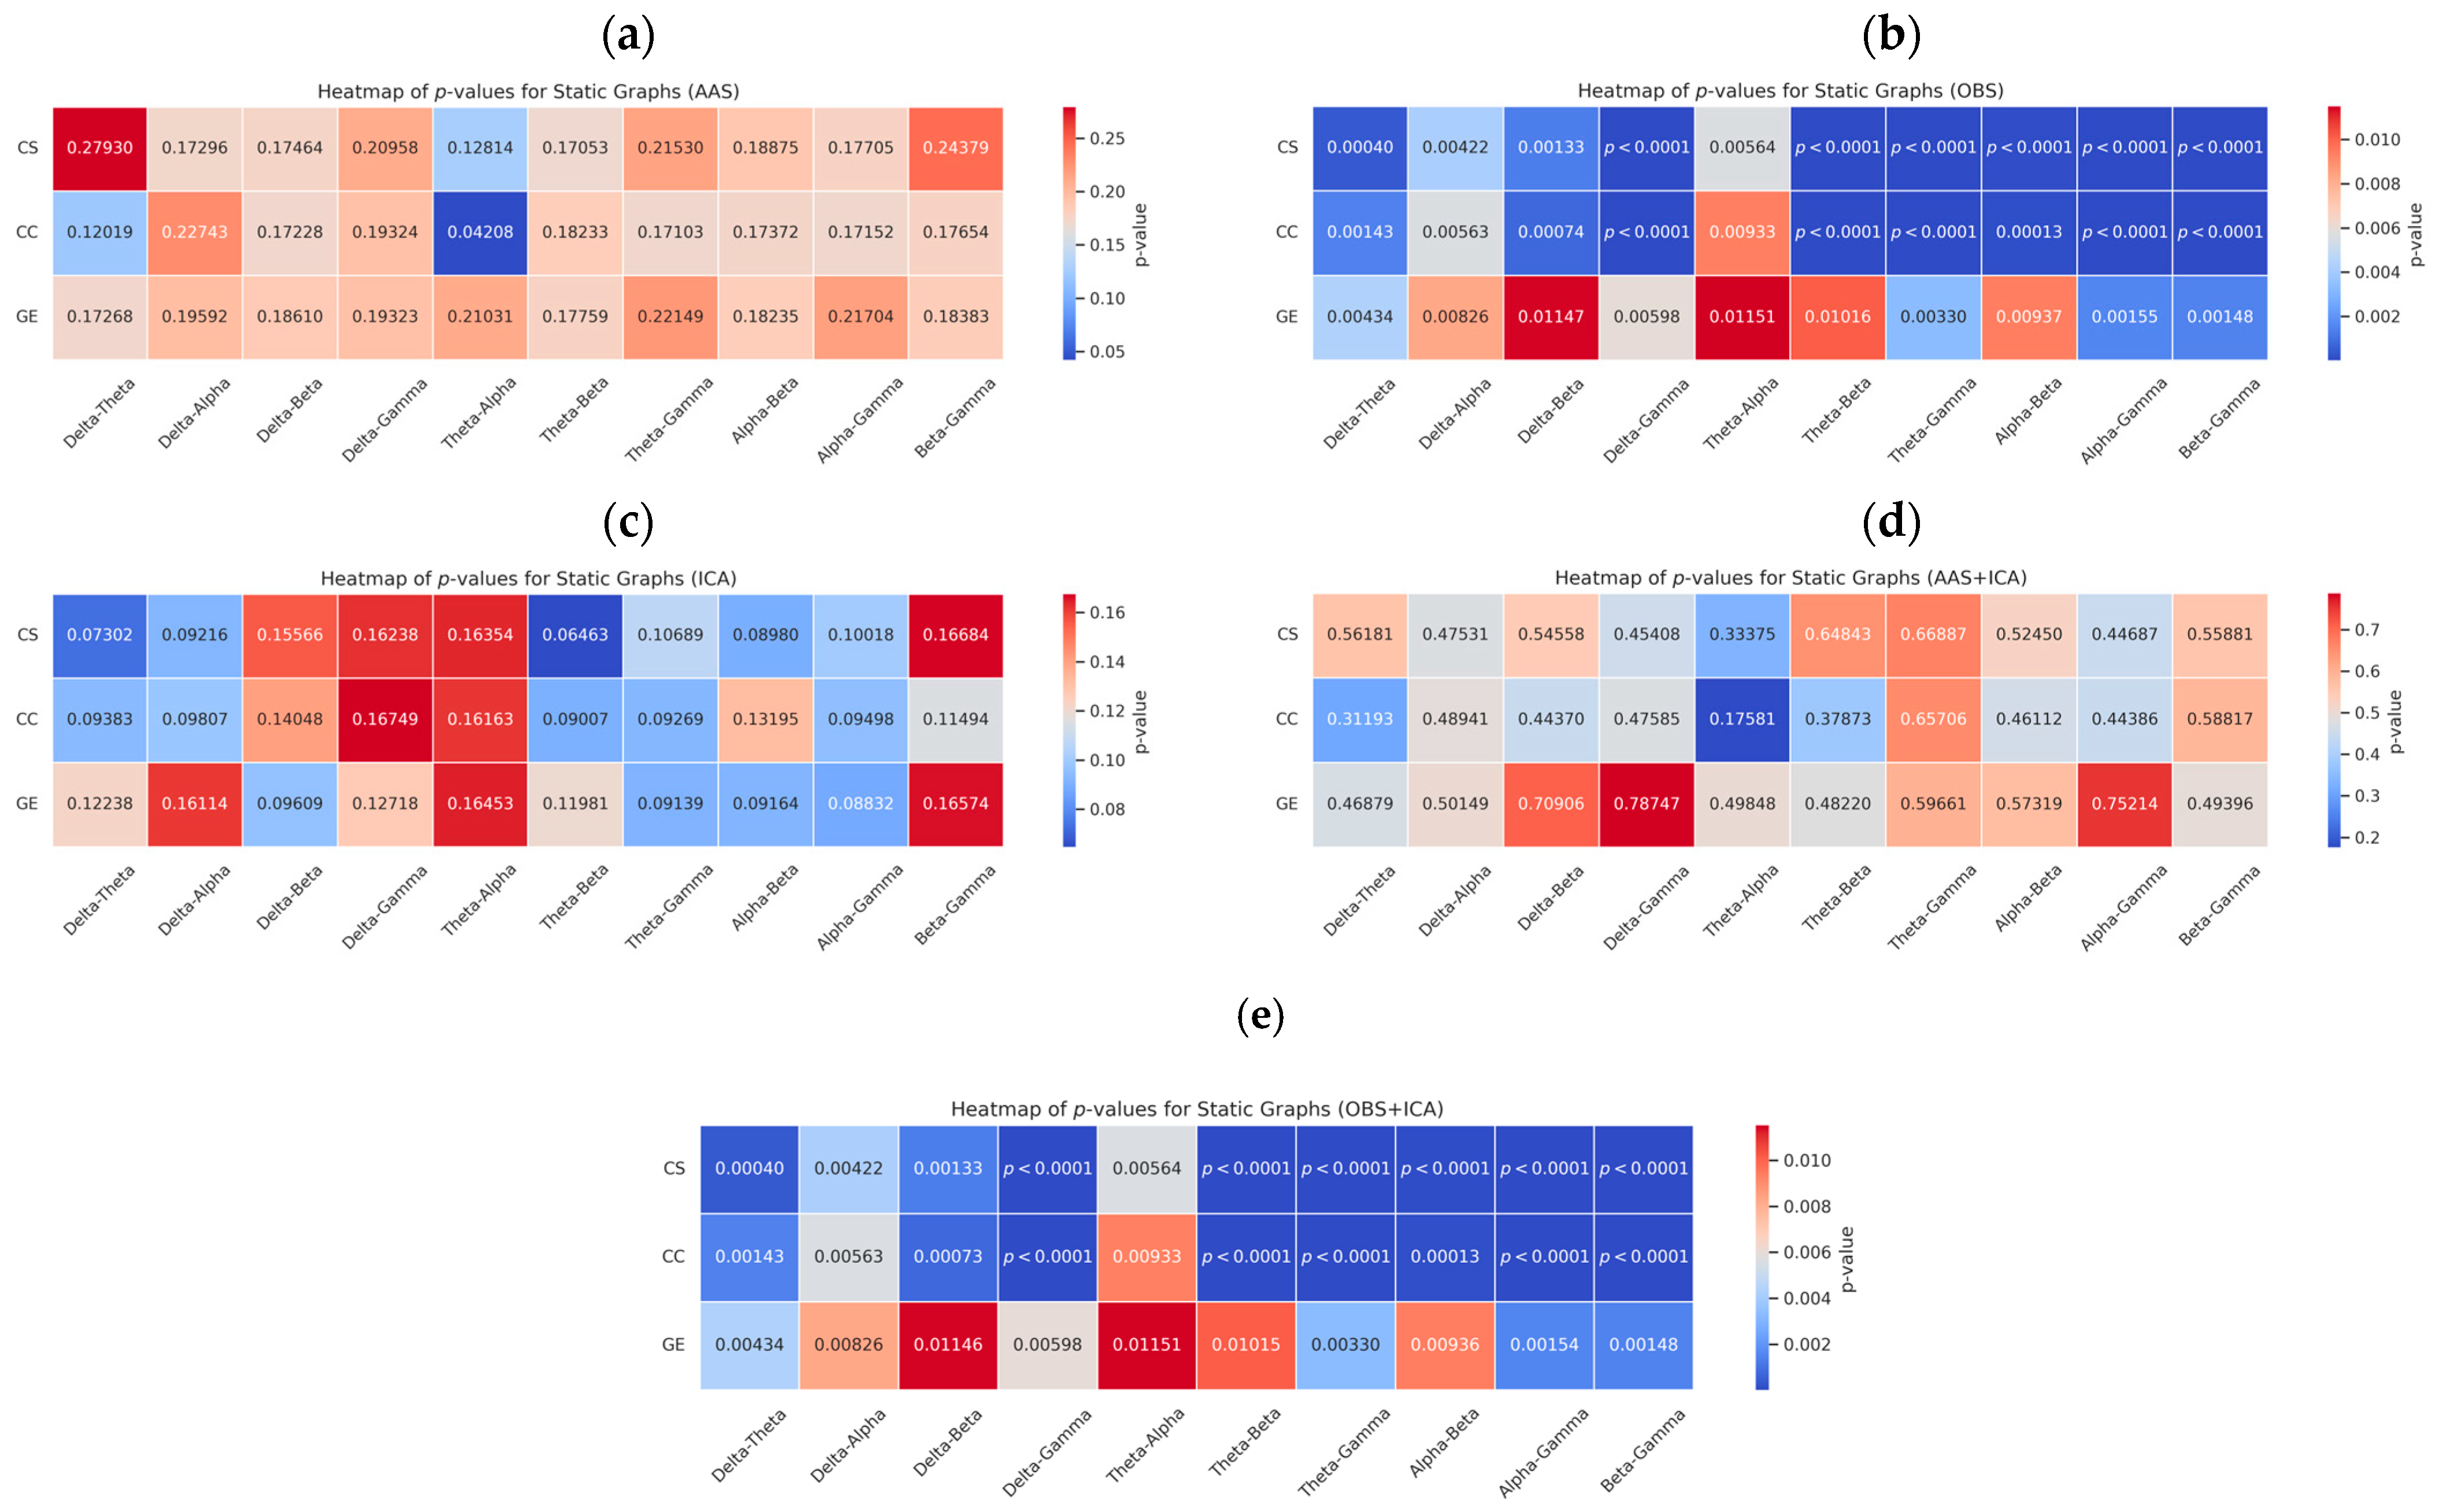
| Delta-Theta | 0.27930 | 0.12019 | 0.17268 |
| Delta-Alpha | 0.17296 | 0.22743 | 0.19592 |
| Delta-Beta | 0.17464 | 0.17228 | 0.18610 |
| Delta-Gamma | 0.20958 | 0.19324 | 0.19323 |
| Theta-Alpha | 0.12814 | 0.04208 | 0.21031 |
| Theta-Beta | 0.17053 | 0.18233 | 0.17759 |
| Theta-Gamma | 0.21530 | 0.17103 | 0.22149 |
| Alpha-Beta | 0.18875 | 0.17372 | 0.18235 |
| Alpha-Gamma | 0.17705 | 0.17152 | 0.21704 |
| Beta-Gamma | 0.24379 | 0.17654 | 0.18383 |
| Frequency Band Pairs | CS | CC | GE |
|---|---|---|---|
| Delta-Theta | 0.0004 | 0.0014 | 0.0043 |
| Delta-Alpha | 0.0042 | 0.0056 | 0.0082 |
| Delta-Beta | 0.0013 | 0.0007 | 0.0114 |
| Delta-Gamma | 0.00001 | 0.000005 | 0.0059 |
| Theta-Alpha | 0.0056 | 0.0093 | 0.0115 |
| Theta-Beta | 0.000006 | 0.000005 | 0.01015 |
| Theta-Gamma | 0.0000002 | 0.00000006 | 0.0033 |
| Alpha-Beta | 0.00006 | 0.0001 | 0.0093 |
| Alpha-Gamma | 0.00000006 | 0.0000003 | 0.0015 |
| Beta-Gamma | 0.00001 | 0.00001 | 0.0014 |
| Frequency Band Pairs | CS | CC | GE |
|---|---|---|---|
| Delta-Theta | 0.0730 | 0.0938 | 0.1223 |
| Delta-Alpha | 0.0921 | 0.0980 | 0.1611 |
| Delta-Beta | 0.1556 | 0.1404 | 0.0960 |
| Delta-Gamma | 0.1623 | 0.1674 | 0.1271 |
| Theta-Alpha | 0.1635 | 0.1616 | 0.1645 |
| Theta-Beta | 0.0646 | 0.0900 | 0.1198 |
| Theta-Gamma | 0.1068 | 0.0926 | 0.0913 |
| Alpha-Beta | 0.0897 | 0.1319 | 0.0916 |
| Alpha-Gamma | 0.1001 | 0.0949 | 0.0883 |
| Beta-Gamma | 0.1668 | 0.1149 | 0.1657 |
| Frequency Band Pairs | CS | CC | GE |
|---|---|---|---|
| Delta-Theta | 0.5618 | 0.3119 | 0.4687 |
| Delta-Alpha | 0.4753 | 0.4894 | 0.5014 |
| Delta-Beta | 0.5455 | 0.4437 | 0.7090 |
| Delta-Gamma | 0.4540 | 0.4758 | 0.7874 |
| Theta-Alpha | 0.3337 | 0.1758 | 0.4984 |
| Theta-Beta | 0.6484 | 0.3787 | 0.4822 |
| Theta-Gamma | 0.6688 | 0.6570 | 0.5966 |
| Alpha-Beta | 0.5245 | 0.4611 | 0.5731 |
| Alpha-Gamma | 0.4468 | 0.4438 | 0.7521 |
| Beta-Gamma | 0.5588 | 0.5881 | 0.4939 |
| Frequency Band Pairs | CS | CC | GE |
|---|---|---|---|
| Delta-Theta | 0.0004 | 0.0014 | 0.0043 |
| Delta-Alpha | 0.0042 | 0.0056 | 0.0082 |
| Delta-Beta | 0.0013 | 0.0007 | 0.0114 |
| Delta-Gamma | 0.00001 | 0.000005 | 0.0059 |
| Theta-Alpha | 0.0056 | 0.0093 | 0.0115 |
| Theta-Beta | 0.000006 | 0.000005 | 0.0101 |
| Theta-Gamma | 0.0000002 | 0.0000006 | 0.0033 |
| Alpha-Beta | 0.00006 | 0.0001 | 0.0093 |
| Alpha-Gamma | 0.00000006 | 0.00000003 | 0.0015 |
| Beta-Gamma | 0.00001 | 0.00001 | 0.0014 |
| Frequency Band Pairs | CS | CC | GE |
|---|---|---|---|
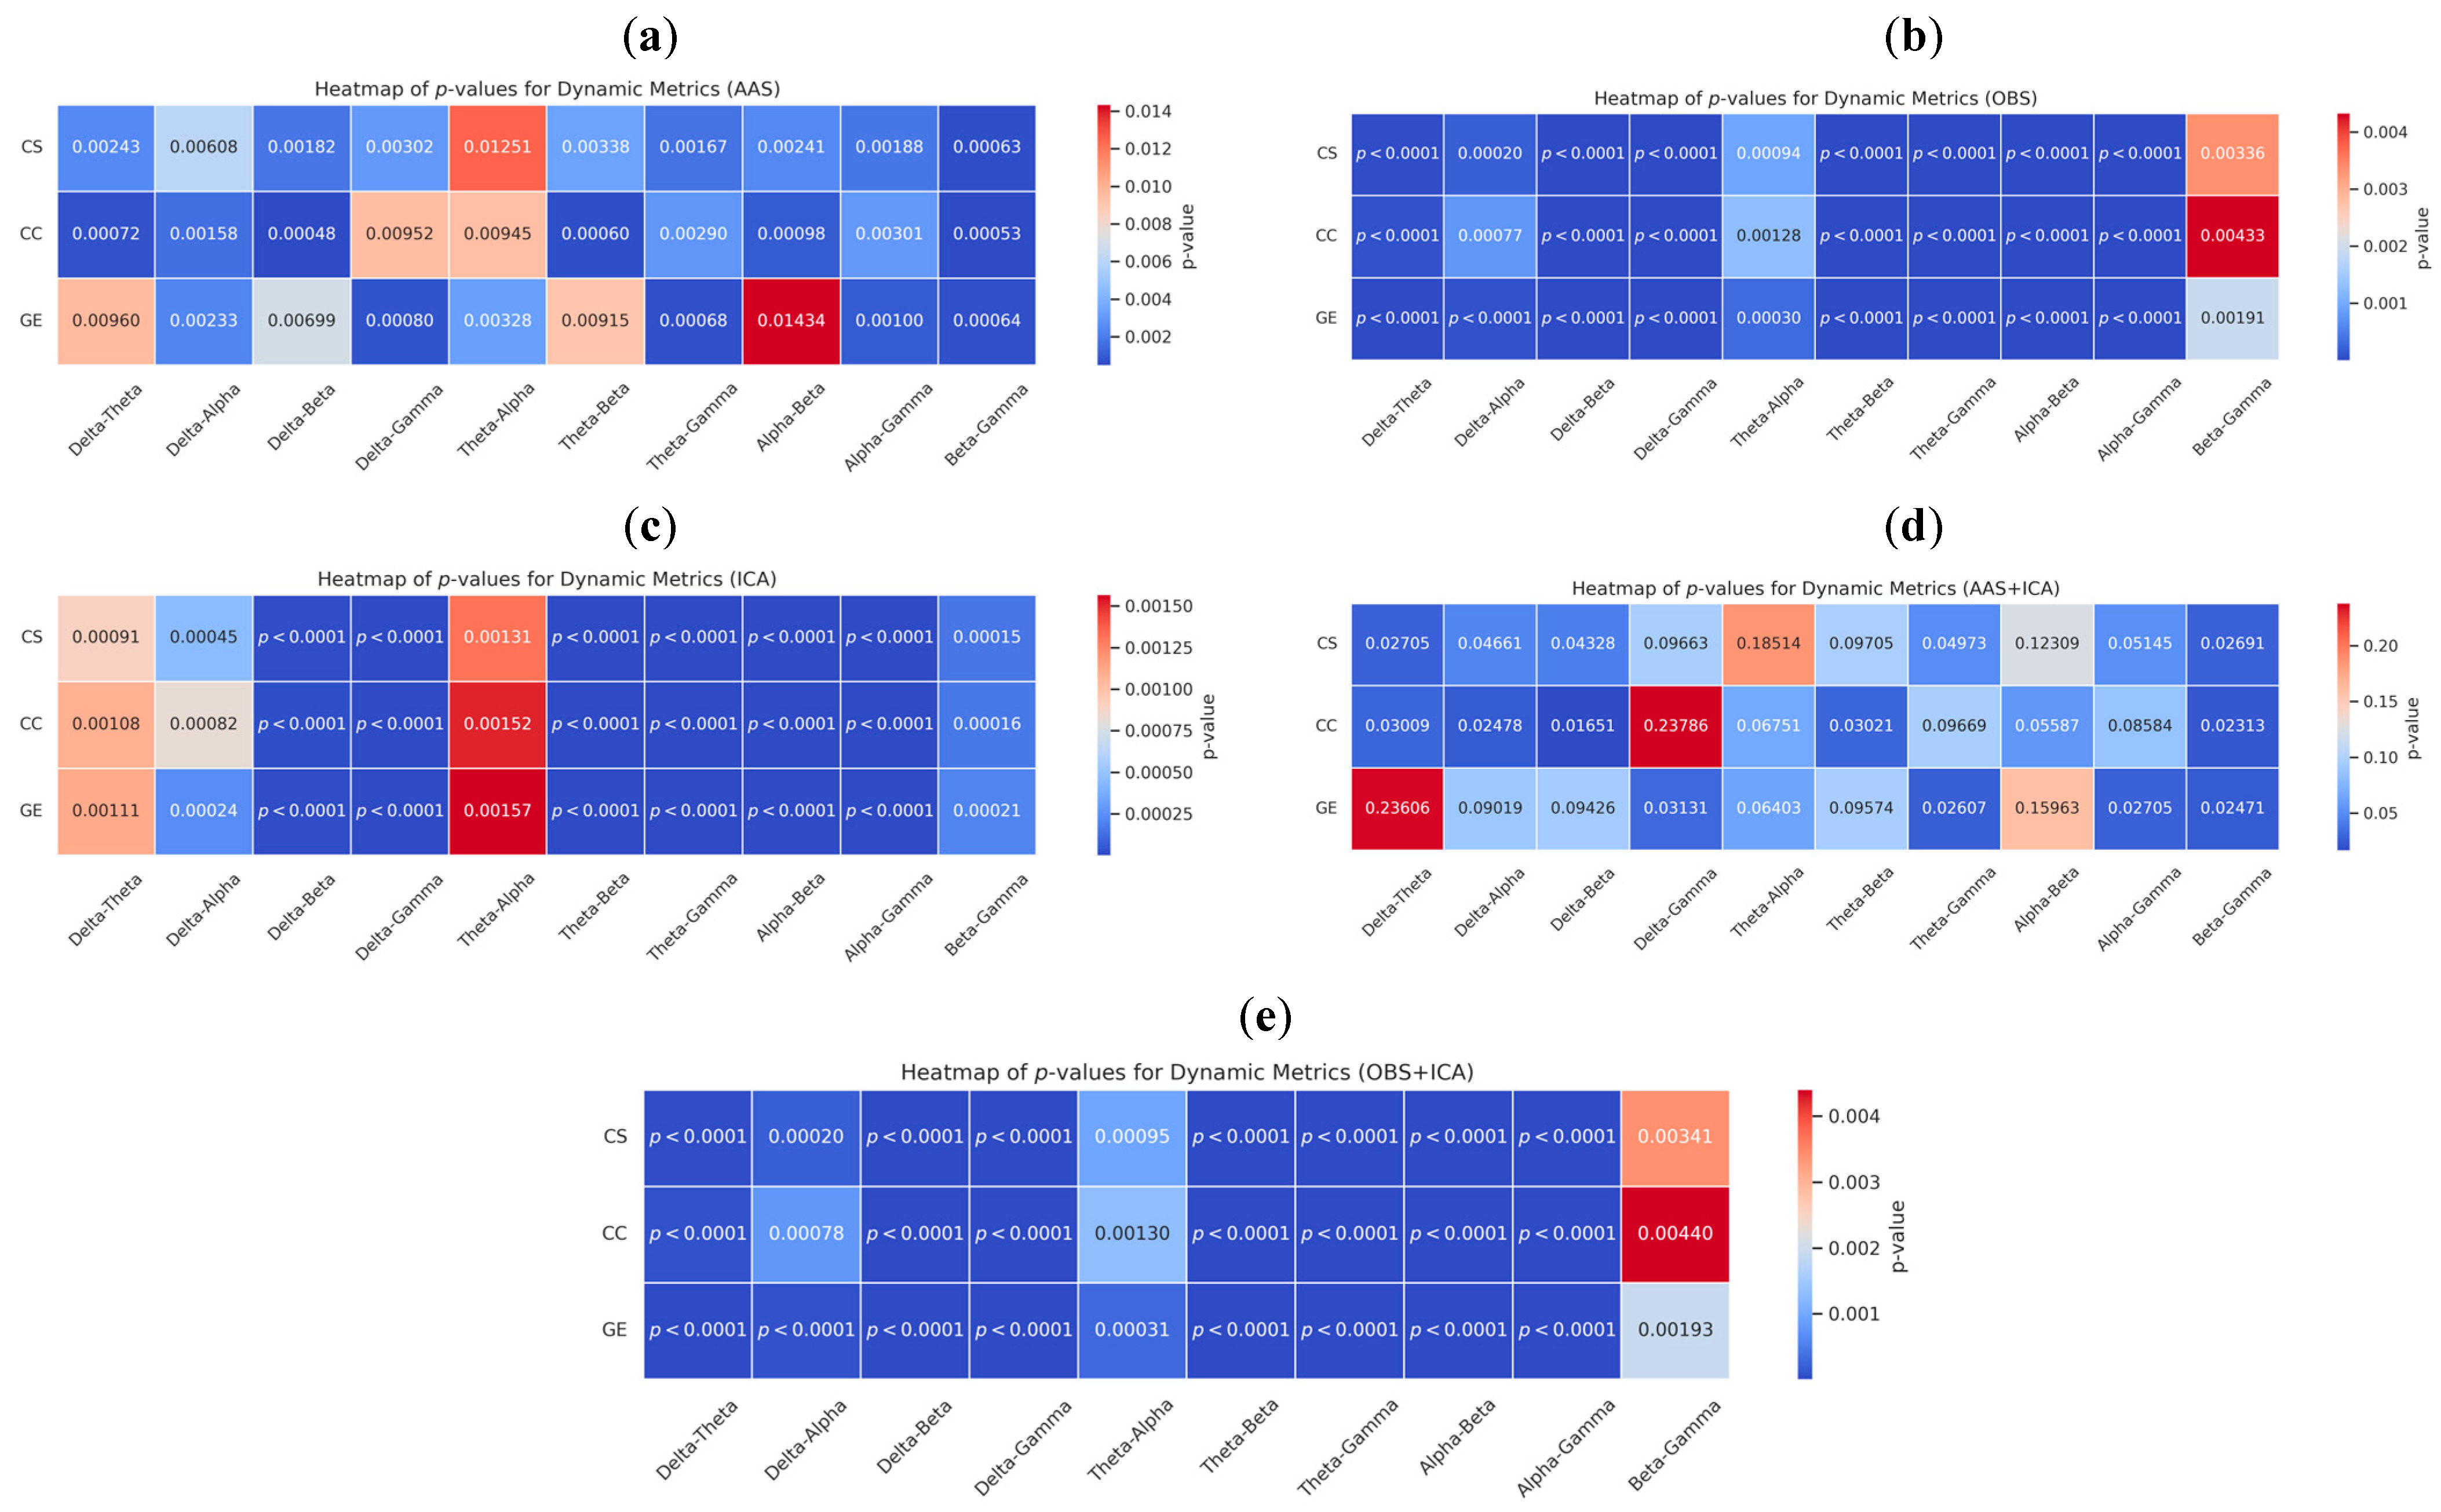
| Delta-Theta | 0.0024 | 0.0007 | 0.0095 |
| Delta-Alpha | 0.0060 | 0.0015 | 0.0023 |
| Delta-Beta | 0.0018 | 0.0004 | 0.0069 |
| Delta-Gamma | 0.0030 | 0.0095 | 0.0008 |
| Theta-Alpha | 0.0125 | 0.0094 | 0.0032 |
| Theta-Beta | 0.0033 | 0.0005 | 0.0091 |
| Theta-Gamma | 0.0016 | 0.0028 | 0.0006 |
| Alpha-Beta | 0.0024 | 0.0009 | 0.0143 |
| Alpha-Gamma | 0.0018 | 0.0030 | 0.0009 |
| Beta-Gamma | 0.0006 | 0.0005 | 0.0006 |
| Frequency Band Pairs | CS | CC | GE |
|---|---|---|---|
| Delta-Theta | 0.00001 | 0.00008 | 0.00001 |
| Delta-Alpha | 0.00019 | 0.00077 | 0.00007 |
| Delta-Beta | 0.0000003 | 0.00000005 | 0.00001 |
| Delta-Gamma | 0.000004 | 0.000007 | 0.000003 |
| Theta-Alpha | 0.00093 | 0.00127 | 0.0003 |
| Theta-Beta | 0.0000006 | 0.0000001 | 0.000001 |
| Theta-Gamma | 0.0000007 | 0.000001 | 0.0000003 |
| Alpha-Beta | 0.0000001 | 0.00000007 | 0.0000004 |
| Alpha-Gamma | 0.000003 | 0.000006 | 0.000001 |
| Beta-Gamma | 0.0033 | 0.0043 | 0.0019 |
| Frequency Band Pairs | CS | CC | GE |
|---|---|---|---|
| Delta-Theta | 0.0009 | 0.00108 | 0.00111 |
| Delta-Alpha | 0.0004 | 0.0008 | 0.00023 |
| Delta-Beta | 0.000007 | 0.00001 | 0.000007 |
| Delta-Gamma | 0.00000005 | 0.0000001 | 0.00000006 |
| Theta-Alpha | 0.0013 | 0.0015 | 0.0015 |
| Theta-Beta | 0.0000007 | 0.0000007 | 0.000003 |
| Theta-Gamma | 0.00000003 | 0.00000005 | 0.00000005 |
| Alpha-Beta | 0.00000004 | 0.00000004 | 0.00000009 |
| Alpha-Gamma | 0.00000001 | 0.00000009 | 0.00000008 |
| Beta-Gamma | 0.000152 | 0.000159 | 0.0002 |
| Frequency Band Pairs | CS | CC | GE |
|---|---|---|---|
| Delta-Theta | 0.0270 | 0.0300 | 0.2360 |
| Delta-Alpha | 0.0466 | 0.0247 | 0.0901 |
| Delta-Beta | 0.0432 | 0.0165 | 0.0942 |
| Delta-Gamma | 0.0966 | 0.2378 | 0.0313 |
| Theta-Alpha | 0.1851 | 0.0675 | 0.0640 |
| Theta-Beta | 0.0970 | 0.0302 | 0.0957 |
| Theta-Gamma | 0.0497 | 0.0966 | 0.0260 |
| Alpha-Beta | 0.1230 | 0.0558 | 0.1596 |
| Alpha-Gamma | 0.0514 | 0.0858 | 0.0270 |
| Beta-Gamma | 0.0269 | 0.0231 | 0.0247 |
| Frequency Band Pairs | CS | CC | GE |
|---|---|---|---|
| Delta-Theta | 0.00001 | 0.00008 | 0.00001 |
| Delta-Alpha | 0.00019 | 0.00078 | 0.00007 |
| Delta-Beta | 0.0000003 | 0.0000005 | 0.00001 |
| Delta-Gamma | 0.000004 | 0.000007 | 0.000003 |
| Theta-Alpha | 0.0009 | 0.0012 | 0.0003 |
| Theta-Beta | 0.00000006 | 0.00000001 | 0.000001 |
| Theta-Gamma | 0.0000008 | 0.000001 | 0.0000003 |
| Alpha-Beta | 0.00000001 | 0.00000006 | 0.0000004 |
| Alpha-Gamma | 0.000003 | 0.000006 | 0.000001 |
| Beta-Gamma | 0.0034 | 0.0044 | 0.0019 |
References
- Mulert, C.; Lemieux, L. EEG-fMRI: Physiological Basis, Technique, and Applications; Springer Nature: Berlin/Heidelberg, Germany, 2023; ISBN 978-3-031-07121-8. [Google Scholar]
- Warbrick, T. Simultaneous EEG-fMRI: What Have We Learned and What Does the Future Hold? Sensors 2022, 22, 2262. [Google Scholar] [CrossRef] [PubMed]
- Jiang, Z.; Liu, Y.; Li, W.; Dai, Y.; Zou, L. Integration of Simultaneous fMRI and EEG Source Localization in Emotional Decision Problems. Behav. Brain Res. 2023, 448, 114445. [Google Scholar] [CrossRef] [PubMed]
- Chang, C.; Chen, J.E. Multimodal EEG-fMRI: Advancing Insight into Large-Scale Human Brain Dynamics. Curr. Opin. Biomed. Eng. 2021, 18, 100279. [Google Scholar] [CrossRef] [PubMed]
- Philiastides, M.G.; Tu, T.; Sajda, P. Inferring Macroscale Brain Dynamics via Fusion of Simultaneous EEG-fMRI. Annu. Rev. Neurosci. 2021, 44, 315–334. [Google Scholar] [CrossRef]
- Baghdadi, G.; Hadaeghi, F.; Kamarajan, C. Editorial: Multimodal Approaches to Investigating Neural Dynamics in Cognition and Related Clinical Conditions: Integrating EEG, MEG, and fMRI Data. Front. Syst. Neurosci. 2025, 19, 1495018. [Google Scholar] [CrossRef]
- Hirata, A.; Niitsu, M.; Phang, C.R.; Kodera, S.; Kida, T.; Rashed, E.A.; Fukunaga, M.; Sadato, N.; Wasaka, T. High-Resolution EEG Source Localization in Personalized Segmentation-Free Head Model with Multi-Dipole Fitting. Phys. Med. Biol. 2024, 69, 055013. [Google Scholar] [CrossRef]
- Abreu, R.; Jorge, J.; Figueiredo, P. EEG Quality: The Pulse Artifact. In EEG-fMRI: Physiological Basis, Technique, and Applications; Mulert, C., Lemieux, L., Eds.; Springer International Publishing: Cham, Switzerland, 2022; pp. 167–188. ISBN 978-3-031-07121-8. [Google Scholar]
- Hüpen, P.; Schulte Holthausen, B.; Regenbogen, C.; Kellermann, T.; Jo, H.-G.; Habel, U. Altered Brain Dynamics of Facial Emotion Processing in Schizophrenia: A Combined EEG/fMRI Study. Schizophrenia 2025, 11, 6. [Google Scholar] [CrossRef]
- Allen, P.J.; Josephs, O.; Turner, R. A Method for Removing Imaging Artifact from Continuous EEG Recorded During Functional MRI. NeuroImage 2000, 12, 230–239. [Google Scholar] [CrossRef]
- Niazy, R.K.; Beckmann, C.F.; Iannetti, G.D.; Brady, J.M.; Smith, S.M. Removal of FMRI Environment Artifacts from EEG Data Using Optimal Basis Sets. NeuroImage 2005, 28, 720–737. [Google Scholar] [CrossRef]
- Marino, M.; Liu, Q.; Koudelka, V.; Porcaro, C.; Hlinka, J.; Wenderoth, N.; Mantini, D. Adaptive Optimal Basis Set for BCG Artifact Removal in Simultaneous EEG-fMRI. Sci. Rep. 2018, 8, 8902. [Google Scholar] [CrossRef]
- Mantini, D.; Perrucci, M.G.; Cugini, S.; Ferretti, A.; Romani, G.L.; Del Gratta, C. Complete Artifact Removal for EEG Recorded During Continuous fMRI Using Independent Component Analysis. NeuroImage 2007, 34, 598–607. [Google Scholar] [CrossRef] [PubMed]
- Srivastava, G.; Crottaz-Herbette, S.; Lau, K.M.; Glover, G.H.; Menon, V. ICA-Based Procedures for Removing Ballistocardiogram Artifacts from EEG Data Acquired in the MRI Scanner. NeuroImage 2005, 24, 50–60. [Google Scholar] [CrossRef]
- Abreu, R.; Leite, M.; Leal, A.; Figueiredo, P. Objective Selection of Epilepsy-Related Independent Components from EEG Data. J. Neurosci. Methods 2016, 258, 67–78. [Google Scholar] [CrossRef]
- Vanderperren, K.; De Vos, M.; Ramautar, J.R.; Novitskiy, N.; Mennes, M.; Assecondi, S.; Vanrumste, B.; Stiers, P.; Van den Bergh, B.R.H.; Wagemans, J.; et al. Removal of BCG Artifacts from EEG Recordings Inside the MR Scanner: A Comparison of Methodological and Validation-Related Aspects. NeuroImage 2010, 50, 920–934. [Google Scholar] [CrossRef]
- Heugel, N.; Beardsley, S.A.; Liebenthal, E. EEG and fMRI Coupling and Decoupling Based on Joint Independent Component Analysis (jICA). J. Neurosci. Methods 2022, 369, 109477. [Google Scholar] [CrossRef]
- Moosmann, M.; Eichele, T.; Nordby, H.; Hugdahl, K.; Calhoun, V.D. Joint Independent Component Analysis for Simultaneous EEG–fMRI: Principle and Simulation. Int. J. Psychophysiol. 2008, 67, 212–221. [Google Scholar] [CrossRef] [PubMed]
- Debener, S.; Strobel, A.; Sorger, B.; Peters, J.; Kranczioch, C.; Engel, A.K.; Goebel, R. Improved Quality of Auditory Event-Related Potentials Recorded Simultaneously with 3-T fMRI: Removal of the Ballistocardiogram Artefact. NeuroImage 2007, 34, 587–597. [Google Scholar] [CrossRef] [PubMed]
- Gilles, J.; Meyer, T.; Douglas, P.K. Low-Rank + Sparse Decomposition (LR + SD) for EEG Artifact Removal. arXiv 2024, arXiv:2411.05812. [Google Scholar]
- Levitt, J.; Yang, Z.; Williams, S.D.; Lütschg Espinosa, S.E.; Garcia-Casal, A.; Lewis, L.D. EEG-LLAMAS: A Low-Latency Neurofeedback Platform for Artifact Reduction in EEG-fMRI. NeuroImage 2023, 273, 120092. [Google Scholar] [CrossRef]
- Shams, N.; Alain, C.; Strother, S. Comparison of BCG Artifact Removal Methods for Evoked Responses in Simultaneous EEG–fMRI. J. Neurosci. Methods 2015, 245, 137–146. [Google Scholar] [CrossRef]
- Gallego-Rudolf, J.; Corsi-Cabrera, M.; Concha, L.; Ricardo-Garcell, J.; Pasaye-Alcaraz, E. Preservation of EEG Spectral Power Features During Simultaneous EEG-fMRI. Front. Neurosci. 2022, 16, 951321. [Google Scholar] [CrossRef]
- Chowdhury, M.E.H.; Mullinger, K.J.; Glover, P.; Bowtell, R. Reference Layer Artefact Subtraction (RLAS): A Novel Method of Minimizing EEG Artefacts During Simultaneous fMRI. NeuroImage 2014, 84, 307–319. [Google Scholar] [CrossRef] [PubMed]
- Steyrl, D.; Krausz, G.; Koschutnig, K.; Edlinger, G.; Müller-Putz, G.R. Reference Layer Adaptive Filtering (RLAF) for EEG Artifact Reduction in Simultaneous EEG-fMRI. J. Neural Eng. 2017, 14, 026003. [Google Scholar] [CrossRef]
- LeVan, P.; Maclaren, J.; Herbst, M.; Sostheim, R.; Zaitsev, M.; Hennig, J. Ballistocardiographic Artifact Removal from Simultaneous EEG-fMRI Using an Optical Motion-Tracking System. NeuroImage 2013, 75, 1–11. [Google Scholar] [CrossRef]
- Kraljič, A.; Matkovič, A.; Purg, N.; Demšar, J.; Repovš, G. Evaluation and Comparison of Most Prevalent Artifact Reduction Methods for EEG Acquired Simultaneously with fMRI. Front. Neuroimaging 2022, 1, 968363. [Google Scholar] [CrossRef]
- van der Meer, J.N.; Pampel, A.; Van Someren, E.J.W.; Ramautar, J.R.; van der Werf, Y.D.; Gomez-Herrero, G.; Lepsien, J.; Hellrung, L.; Hinrichs, H.; Möller, H.E.; et al. Carbon-Wire Loop Based Artifact Correction Outperforms Post-Processing EEG/fMRI Corrections—A Validation of a Real-Time Simultaneous EEG/fMRI Correction Method. NeuroImage 2016, 125, 880–894. [Google Scholar] [CrossRef]
- Bullmore, E.; Sporns, O. Complex Brain Networks: Graph Theoretical Analysis of Structural and Functional Systems. Nat. Rev. Neurosci. 2009, 10, 186–198. [Google Scholar] [CrossRef]
- Yu, Q.; Wu, L.; Bridwell, D.A.; Erhardt, E.B.; Du, Y.; He, H.; Chen, J.; Liu, P.; Sui, J.; Pearlson, G.; et al. Building an EEG-fMRI Multi-Modal Brain Graph: A Concurrent EEG-fMRI Study. Front. Hum. Neurosci. 2016, 10, 476. [Google Scholar] [CrossRef]
- Rabiei, Z.; Kordy, H.M. Generalized Coupled Matrix Tensor Factorization Method Based on Normalized Mutual Information for Simultaneous EEG-fMRI Data Analysis. Neuroinformatics 2025, 23, 19. [Google Scholar] [CrossRef] [PubMed]
- Phadikar, S.; Pusuluri, K.; Jensen, K.M.; Wu, L.; Iraji, A.; Calhoun, V.D. Coupling Between Time-Varying EEG Spectral Bands and Spatial Dynamic FMRI Networks. In Proceedings of the 2024 IEEE International Symposium on Biomedical Imaging (ISBI), Athens, Greece, 27–30 May 2024; pp. 1–4. [Google Scholar]
- Phadikar, S.; Pusuluri, K.; Iraji, A.; Calhoun, V.D. Integrating fMRI Spatial Network Dynamics and EEG Spectral Power: Insights into Resting State Connectivity. Front. Neurosci. 2025, 19, 1484954. [Google Scholar] [CrossRef] [PubMed]
- Gallego-Rudolf, J.; Corsi Cabrera, M.; Concha, L.; Ricardo Garcell, J.; Pasaye Alcaraz, E.H. Simultaneous EEG-fMRI Dataset. Mendeley Data 2023, 2. [Google Scholar] [CrossRef]
- Delorme, A.; Makeig, S. EEGLAB: An Open Source Toolbox for Analysis of Single-Trial EEG Dynamics Including Independent Component Analysis. J. Neurosci. Methods 2004, 134, 9–21. [Google Scholar] [CrossRef]
- Pion-Tonachini, L.; Kreutz-Delgado, K.; Makeig, S. ICLabel: An Automated Electroencephalographic Independent Component Classifier, Dataset, and Website. NeuroImage 2019, 198, 181–197. [Google Scholar] [CrossRef]
- Wang, Z.; Bovik, A.C. Mean Squared Error: Love It or Leave It? A New Look at Signal Fidelity Measures. IEEE Signal Process. Mag. 2009, 26, 98–117. [Google Scholar] [CrossRef]
- Horé, A.; Ziou, D. Image Quality Metrics: PSNR vs. SSIM. In Proceedings of the 2010 20th International Conference on Pattern Recognition, Istanbul, Turkey, 23–26 August 2010; pp. 2366–2369. [Google Scholar]
- Johnson, D.H. Signal-to-Noise Ratio. Scholarpedia 2006, 1, 2088. [Google Scholar] [CrossRef]
- Wang, Z.; Bovik, A.C. A Universal Image Quality Index. IEEE Signal Process. Lett. 2002, 9, 81–84. [Google Scholar] [CrossRef]
- Müller, M. Dynamic Time Warping. In Information Retrieval for Music and Motion; Müller, M., Ed.; Springer: Berlin/Heidelberg, Germany, 2007; pp. 69–84. ISBN 978-3-540-74048-3. [Google Scholar]
- Jacobs, G.D.; Friedman, R. EEG Spectral Analysis of Relaxation Techniques. Appl. Psychophysiol. Biofeedback 2004, 29, 245–254. [Google Scholar] [CrossRef]
- Talebi, S.; Waczak, J.; Fernando, B.A.; Sridhar, A.; Lary, D.J. Data-Driven EEG Band Discovery with Decision Trees. Sensors 2022, 22, 3048. [Google Scholar] [CrossRef]
- Zhang, H.; Zhou, Q.-Q.; Chen, H.; Hu, X.-Q.; Li, W.-G.; Bai, Y.; Han, J.-X.; Wang, Y.; Liang, Z.-H.; Chen, D.; et al. The Applied Principles of EEG Analysis Methods in Neuroscience and Clinical Neurology. Mil. Med. Res. 2023, 10, 67. [Google Scholar] [CrossRef] [PubMed]
- Nieto-Castanon, A. Handbook of Functional Connectivity Magnetic Resonance Imaging Methods in CONN; Hilbert Press: Boston, MA, USA, 2020; ISBN 978-0-578-64400-4. [Google Scholar]
- Rachakonda, S.; Egolf, E.; Correa, N.; Calhoun, V. Group ICA of fMRI Toolbox (GIFT) Manual. Dostupnez Cit 2011-11-5 2007. Available online: https://www.nitrc.org/docman/view.php/55/295/v1_203d_GIFTManual.pdf (accessed on 25 October 2024).
- Bell, A.J.; Sejnowski, T.J. An Information-Maximization Approach to Blind Separation and Blind Deconvolution. Neural Comput. 1995, 7, 1129–1159. [Google Scholar] [CrossRef] [PubMed]
- Himberg, J.; Hyvarinen, A. Icasso: Software for Investigating the Reliability of ICA Estimates by Clustering and Visualization. In Proceedings of the 2003 IEEE XIII Workshop on Neural Networks for Signal Processing, Toulouse, France, 17–19 September 2003; pp. 259–268. [Google Scholar]
- Goldman, R.I.; Stern, J.M.; Engel, J.J.; Cohen, M.S. Simultaneous EEG and fMRI of the Alpha Rhythm. NeuroReport 2002, 13, 2487. [Google Scholar] [CrossRef]
- Moosmann, M.; Ritter, P.; Krastel, I.; Brink, A.; Thees, S.; Blankenburg, F.; Taskin, B.; Obrig, H.; Villringer, A. Correlates of Alpha Rhythm in Functional Magnetic Resonance Imaging and near Infrared Spectroscopy. NeuroImage 2003, 20, 145–158. [Google Scholar] [CrossRef]
- Laufs, H.; Kleinschmidt, A.; Beyerle, A.; Eger, E.; Salek-Haddadi, A.; Preibisch, C.; Krakow, K. EEG-Correlated fMRI of Human Alpha Activity. NeuroImage 2003, 19, 1463–1476. [Google Scholar] [CrossRef]
- Miraglia, F.; Pappalettera, C.; Di Ienno, S.; Nucci, L.; Cacciotti, A.; Manenti, R.; Judica, E.; Rossini, P.M.; Vecchio, F. The Effects of Directional and Non-Directional Stimuli during a Visuomotor Task and Their Correlation with Reaction Time: An ERP Study. Sensors 2023, 23, 3143. [Google Scholar] [CrossRef] [PubMed]
- Rubinov, M.; Sporns, O. Complex Network Measures of Brain Connectivity: Uses and Interpretations. NeuroImage 2010, 52, 1059–1069. [Google Scholar] [CrossRef]
- Watts, D.J.; Strogatz, S.H. Collective Dynamics of ‘Small-World’ Networks. Nature 1998, 393, 440–442. [Google Scholar] [CrossRef]
- Latora, V.; Marchiori, M. Efficient Behavior of Small-World Networks. Phys. Rev. Lett. 2001, 87, 198701. [Google Scholar] [CrossRef]
- Allen, E.A.; Damaraju, E.; Plis, S.M.; Erhardt, E.B.; Eichele, T.; Calhoun, V.D. Tracking Whole-Brain Connectivity Dynamics in the Resting State. Cereb. Cortex 2014, 24, 663–676. [Google Scholar] [CrossRef]
- Shirer, W.R.; Ryali, S.; Rykhlevskaia, E.; Menon, V.; Greicius, M.D. Decoding Subject-Driven Cognitive States with Whole-Brain Connectivity Patterns. Cereb. Cortex 2012, 22, 158–165. [Google Scholar] [CrossRef] [PubMed]


| Metrics | Description | Optimal Direction | Mathematical Expression |
|---|---|---|---|
| MSE | Mean squared difference between the original and processed signal [37] | Low | : Original signal, : Filtered signal : Total number of samples |
| PSNR | Amount of distortion in the signal [38] | High | : Maximum possible value of the signal |
| SNR | Ratio of signal power to noise power [39] | High | : Power of the original signal : Power of the noise |
| SSIM | Structural similarity between signals [40] | High | : Mean of original and filtered signals, : Variance of original and filtered signals : Covariance between the signals and and |
| DTW | Temporal similarity between signals [41] | Low | x, y: Two time series : Distance between corresponding elements |
| PPR | Ratio of amplitude change [13] | Close to 1 | max(y), min(y): Maximum and minimum of the filtered signal max(x), min(x): Maximum and minimum of the original signal |
| PSD | Conservation of frequency components [42] | Spectral Integrity | : Fourier transform of the signal : Total duration of the signal. |
| Methods | Average Processing Time | Total Processing Time |
|---|---|---|
| AAS | 3 min | 45 min |
| OBS | 4 min | 60 min |
| ICA | 10 min | 150 min |
| AAS + ICA | 15 min | 225 min |
| OBS + ICA | 16 min | 240 min |
| Metric | TR | Delta | Theta | Alpha | Beta | Gamma |
|---|---|---|---|---|---|---|
| CS | 10 | 30.368 ± 0.773 | 30.444 ± 0.868 | 30.746 ± 0.804 | 29.436 ± 0.851 | 28.865 ± 0.586 |
| 20 | 23.280 ± 0.881 | 23.502 ± 0.882 | 23.718 ± 0.834 | 22.250 ± 0.994 | 21.595 ± 0.685 | |
| 30 | 20.207 ± 0.962 | 20.430 ± 0.879 | 20.608 ± 0.834 | 19.126 ± 1.110 | 18.345 ± 0.738 | |
| CC | 10 | 0.428 ± 0.011 | 0.428 ± 0.012 | 0.432 ± 0.011 | 0.419 ± 0.010 | 0.414 ± 0.010 |
| 20 | 0.314 ± 0.013 | 0.316 ± 0.013 | 0.319 ± 0.012 | 0.302 ± 0.013 | 0.295 ± 0.010 | |
| 30 | 0.272 ± 0.016 | 0.275 ± 0.015 | 0.276 ± 0.013 | 0.259 ± 0.015 | 0.249 ± 0.011 | |
| GE | 10 | 0.734 ± 0.003 | 0.735 ± 0.003 | 0.736 ± 0.003 | 0.729 ± 0.003 | 0.727 ± 0.002 |
| 20 | 0.726 ± 0.003 | 0.727 ± 0.003 | 0.728 ± 0.003 | 0.720 ± 0.004 | 0.717 ± 0.003 | |
| 30 | 0.718 ± 0.004 | 0.719 ± 0.004 | 0.720 ± 0.003 | 0.712 ± 0.005 | 0.708 ± 0.003 |
Disclaimer/Publisher’s Note: The statements, opinions and data contained in all publications are solely those of the individual author(s) and contributor(s) and not of MDPI and/or the editor(s). MDPI and/or the editor(s) disclaim responsibility for any injury to people or property resulting from any ideas, methods, instructions or products referred to in the content. |
© 2025 by the authors. Licensee MDPI, Basel, Switzerland. This article is an open access article distributed under the terms and conditions of the Creative Commons Attribution (CC BY) license (https://creativecommons.org/licenses/by/4.0/).
Share and Cite
Gülhan, P.G.; Özmen, G. Enhancing Signal and Network Integrity: Evaluating BCG Artifact Removal Techniques in Simultaneous EEG-fMRI Data. Sensors 2025, 25, 7036. https://doi.org/10.3390/s25227036
Gülhan PG, Özmen G. Enhancing Signal and Network Integrity: Evaluating BCG Artifact Removal Techniques in Simultaneous EEG-fMRI Data. Sensors. 2025; 25(22):7036. https://doi.org/10.3390/s25227036
Chicago/Turabian StyleGülhan, Perihan Gülşah, and Güzin Özmen. 2025. "Enhancing Signal and Network Integrity: Evaluating BCG Artifact Removal Techniques in Simultaneous EEG-fMRI Data" Sensors 25, no. 22: 7036. https://doi.org/10.3390/s25227036
APA StyleGülhan, P. G., & Özmen, G. (2025). Enhancing Signal and Network Integrity: Evaluating BCG Artifact Removal Techniques in Simultaneous EEG-fMRI Data. Sensors, 25(22), 7036. https://doi.org/10.3390/s25227036


