1. Introduction
With the rapid development of terrestrial laser scanning (TLS), unmanned aerial vehicle (UAV) photogrammetry, and UAV light detection and ranging (LiDAR), point cloud models have become essential tools for describing and analyzing object shapes [
1]. Point cloud models are now widely utilized across various fields, including environmental monitoring, autonomous navigation, archeological site recording, and urban modeling. In many of these applications, integrating point cloud data from different scanners or sensors is essential to produce complete and accurate 3D models. This work is crucial because of the variations in coordinate systems, resolutions, and measurement accuracies. Proper registration or fusion harmonizes these discrepancies by aligning data to a consistent reference frame, ensuring precise spatial relationships and comprehensive 3D models. This process mitigates the errors and inconsistencies arising from diverse sensor characteristics, enhancing the overall quality and usability of the fused point cloud models.
In the past 10 years, research on the registration of point cloud models has commonly included studies on TLS-TLSs and TLS-UAVs. For example, ref. [
2] presented a practical framework for the integration of UAV-based photogrammetry and TLS in open-pit mine areas. The results show that TLS-derived point clouds can be used as ground control points (GCPs) in mountainous areas or high-risk environments where it is difficult to conduct a global navigation satellite system (GNSS) survey. The framework achieved decimeter-level accuracy for the generated digital surface model (DSM) and digital orthophoto map. Ref. [
3] proposed an efficient registration method based on a genetic algorithm for the automatic alignment of two terrestrial laser scanning (TLS) point clouds (TLS–TLS) and the alignment between TLS and unmanned aerial vehicle (UAV)–LiDAR point clouds (TLS–UAV LiDAR). The experimental results indicate that the root-mean-square error (RMSE) of the TLS–TLS registration is 3–5 mm, and that of the TLS–UAV LiDAR registration is 2–4 cm. Ref. [
4] discussed creating virtual environments from 3D point-cloud data suitable for immersive and interactive virtual reality. Both TLS (LiDAR-based) and UAV photogrammetric point clouds were utilized. The UAV point clouds were generated using optical imagery processed through structure-from-motion (SfM) photogrammetry. These datasets were merged using a custom algorithm that identifies data gaps in the TLS dataset and fills them with data from the UAV photogrammetric model. The result demonstrated an RMSE accuracy of approximately 5 cm. Ref. [
5] designed a method for the global refinement of TLS point clouds on the basis of plane-to-plane correspondences. The experimental results show that the proposed plane-based matching algorithm efficiently finds plane correspondences in partial overlapping scans, providing approximate values for global registration, and indicating that an accuracy better than 8 cm can be achieved. Ref. [
6] extracted key points with stronger expression, expanded the use of multi-view convolutional neural networks (MVCNNs) in point cloud registration, and adopted a graphics processing unit (GPU) to accelerate the matrix calculation. The experimental results demonstrated that this method significantly improves registration efficiency while maintaining an RMSE accuracy of 3 to 4 cm. Ref. [
7] used a feature-level point cloud fusion method to process point cloud data from TLS and UAV LiDAR. The results show that the tally can be achieved quickly and accurately via feature-level fusion of the two point cloud datasets. Ref. [
8] established a high-precision, complete, and realistic bridge model by integrating UAV image data and TLS point cloud data. The integration of UAV image point clouds with TLS point clouds is achieved via the iterative closest point (ICP) algorithm, followed by the creation of a triangulated irregular network (TIN) model and texture mapping via Context Capture 2023 software. The geometric accuracies of the integrated model in the X, Y, and Z directions are 1.2 cm, 0.8 cm, and 0.9 cm, respectively. Other related research on point cloud registration or fusion from TLS-TLS or TLS-UAV over the past ten years has been included [
9,
10,
11,
12,
13,
14,
15,
16,
17,
18,
19,
20,
21,
22,
23].
According to the references, the fusion of TLS–TLS point clouds currently achieves millimeter-level accuracy, while the fusion of TLS–UAV point clouds attains centimeter-level accuracy. Compared with studies on TLS–TLS and UAV–TLS data integration, research specifically addressing the precise registration between UAV-derived point clouds from different flight missions or sensors (e.g., photogrammetry and LiDAR) remains limited. Ref. [
24] presented a novel procedure for fine registration of UAV-derived point clouds by aligning planar roof features. The experimental results demonstrated an average error of 9 cm from the reference distances.
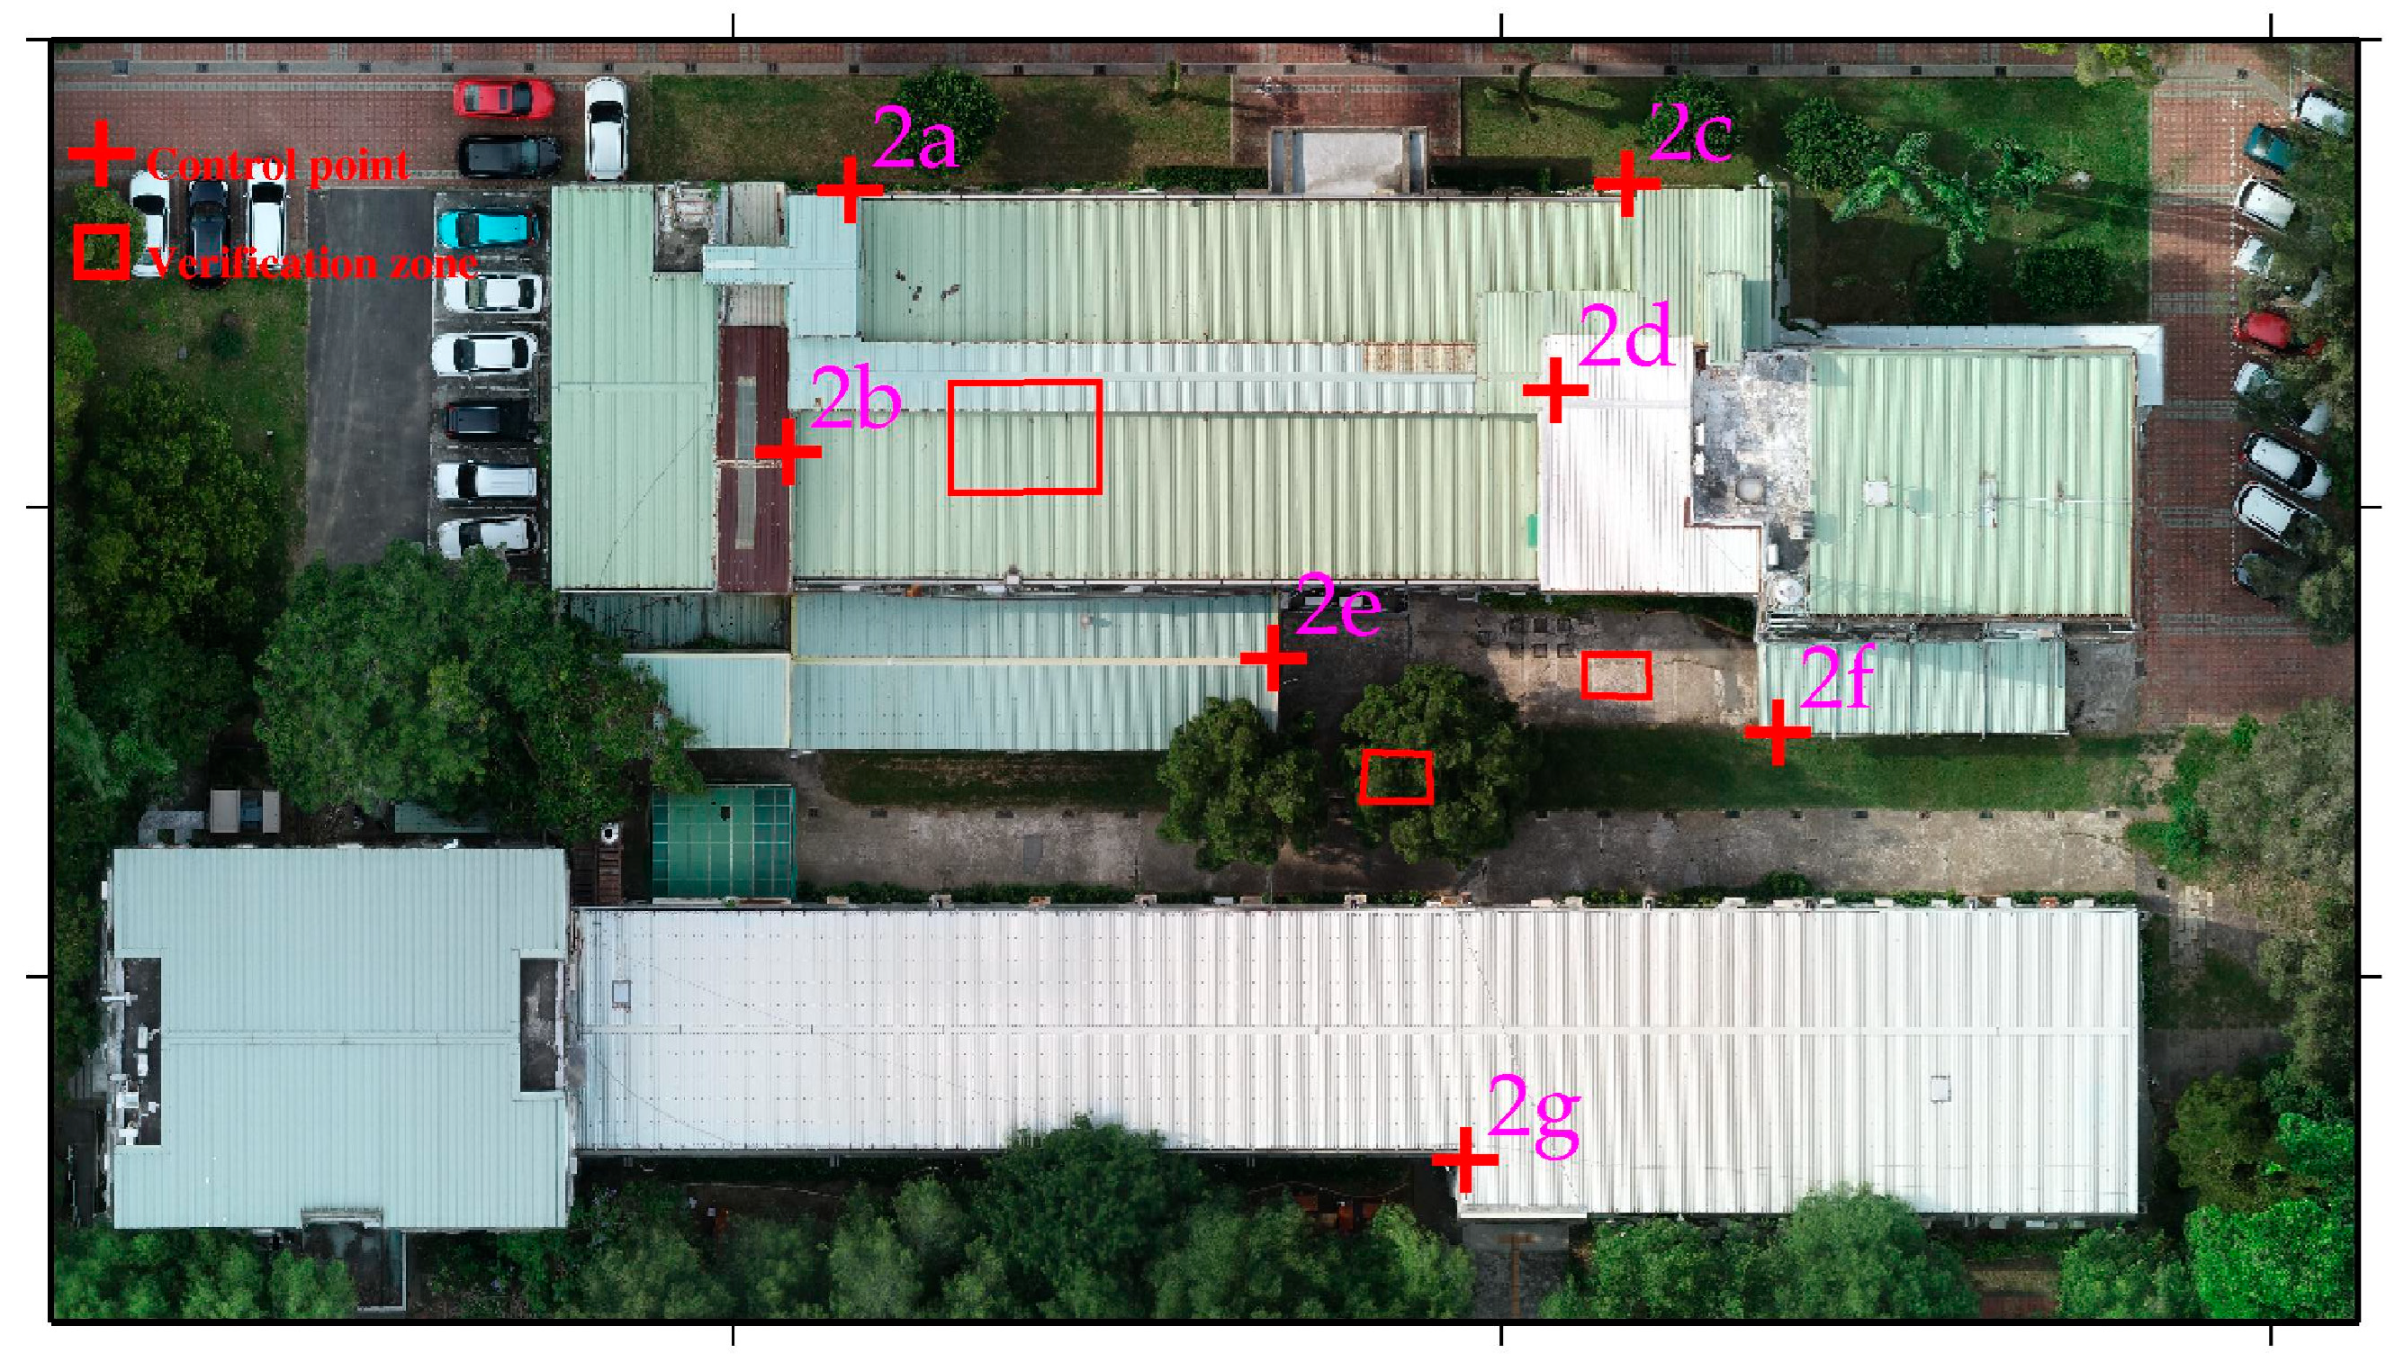
The integration of UAV-UAV point clouds is critical for photogrammetry. Affordable UAVs used for this purpose are often constrained by limited battery capacity and software limitations in processing large volumes of imagery, which makes it challenging to generate comprehensive point cloud models. This challenge can be addressed by merging smaller, individual UAV point cloud models into larger, more complete models. In addition, while the previous studies on TLS-TLS, UAV-TLS, and UAV-UAV point cloud fusion have yielded many high-accuracy results, most of these studies rely on selected GCPs or check points for evaluation. While the use of GCPs is a common practice for evaluating registration accuracy, relying solely on a few discrete points may not fully capture spatial variations. Therefore, in this study, we also evaluate the UAV–UAV coordinate transformation results by incorporating multiple verification zones—such as rooftops, pavements, tree canopies, and grasslands—to provide a more spatially representative assessment of accuracy. This approach will provide a more robust and credible assessment than relying solely on GCPs. On the other hand, unmanned surface vehicle (USV) technology has been widely used in recent years, including for depth measurements in ports, ponds, and reservoirs. This provides important insights into sediment accumulation and the inspection of underwater structures in these areas [
25,
26,
27,
28]. If USVs are combined with UAVs, the integration of the USV-UAV point cloud model can be used to construct a comprehensive aquatic environment, including both above-water and underwater terrains, which is crucial for the further understanding of sediment transportation and ecological environments. While some studies have addressed UAV and USV data integration, research specifically dealing with the registration of USV–UAV point cloud data for this purpose is still limited. Due to the limited research on UAV-UAV and USV-UAV point cloud fusion, this study aims to address two key issues. First, the results of the USV and UAV point cloud registration are investigated to construct a comprehensive terrain model of the aquatic environment, which will be followed by accuracy evaluation. Second, we explore the outcomes of fusing point clouds from two UAV-SfM (structure from motion) datasets to overcome the current limitations of low-cost drones in terms of the flight range and the number of images processed by photogrammetry software. The entire integration of the USV-UAV and UAV-UAV point cloud models was conducted via 4-parameter, 6-parameter, and 7-parameter coordinate transformation methods (CT methods), which are all essential for precise geodetic coordinate conversions and aligning different geospatial datasets. All the point cloud fusion results were uploaded to the Pointbox website, allowing anyone to easily access and view the research findings.
3. Study Area and Data
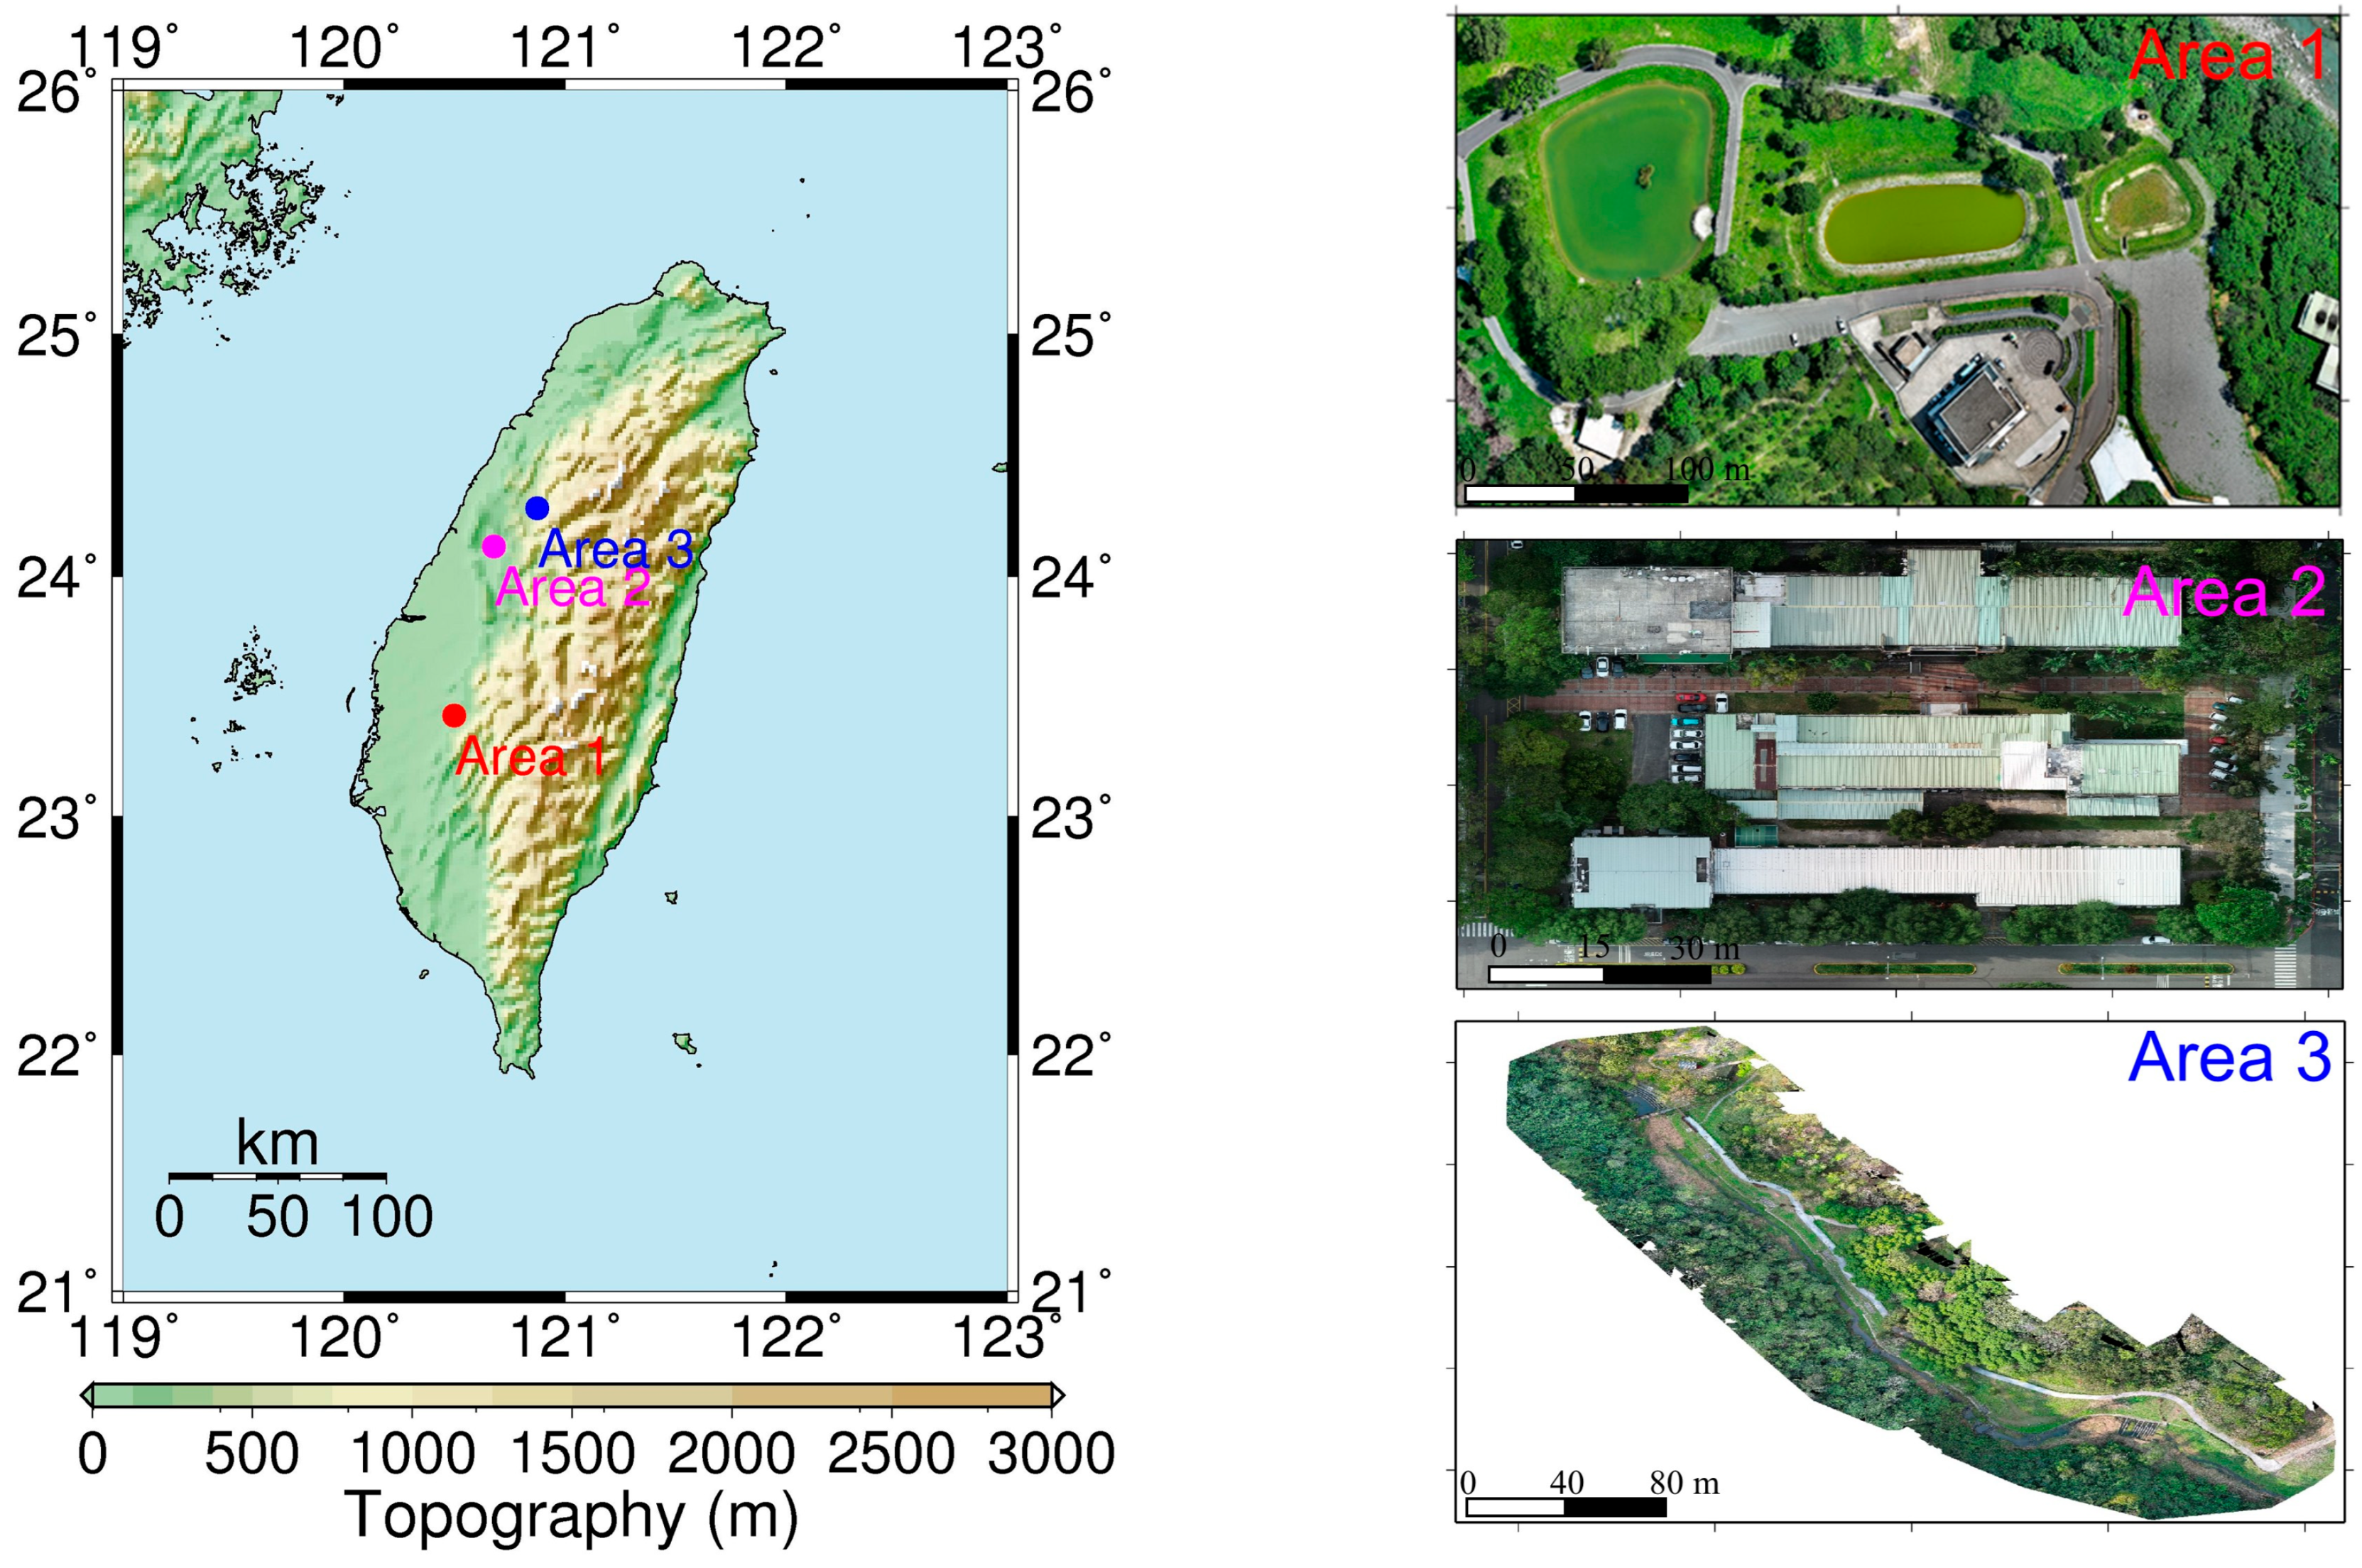
This paper includes three study areas. Their locations and aerial images are shown in
Figure 1. Study area 1 is located in the Cien retention basin area in Zhongpu Township, Chiayi County. The area comprises three ponds, with this study using the central pond as a case example for the registration of USV and UAV point cloud data. The USV was employed to survey the bathymetry of the pond bottom, whereas the UAV was used to survey the terrain around this pond. Study area 2 is located at the buildings of the Department of Soil and Water Conservation (SWC) of National Chung Hsing University (NCHU), Taichung City, and study area 3 is located at the Sijiaolin Stream within Dongshi Forestry Culture Park in Taichung City. There are several soil and water conservation structures in the Sijiaolin Stream. We test the registration results of the USV-derived and UAV-derived point cloud models in the study area 1 and those of the UAV-derived point cloud models in the study areas 2 and 3.
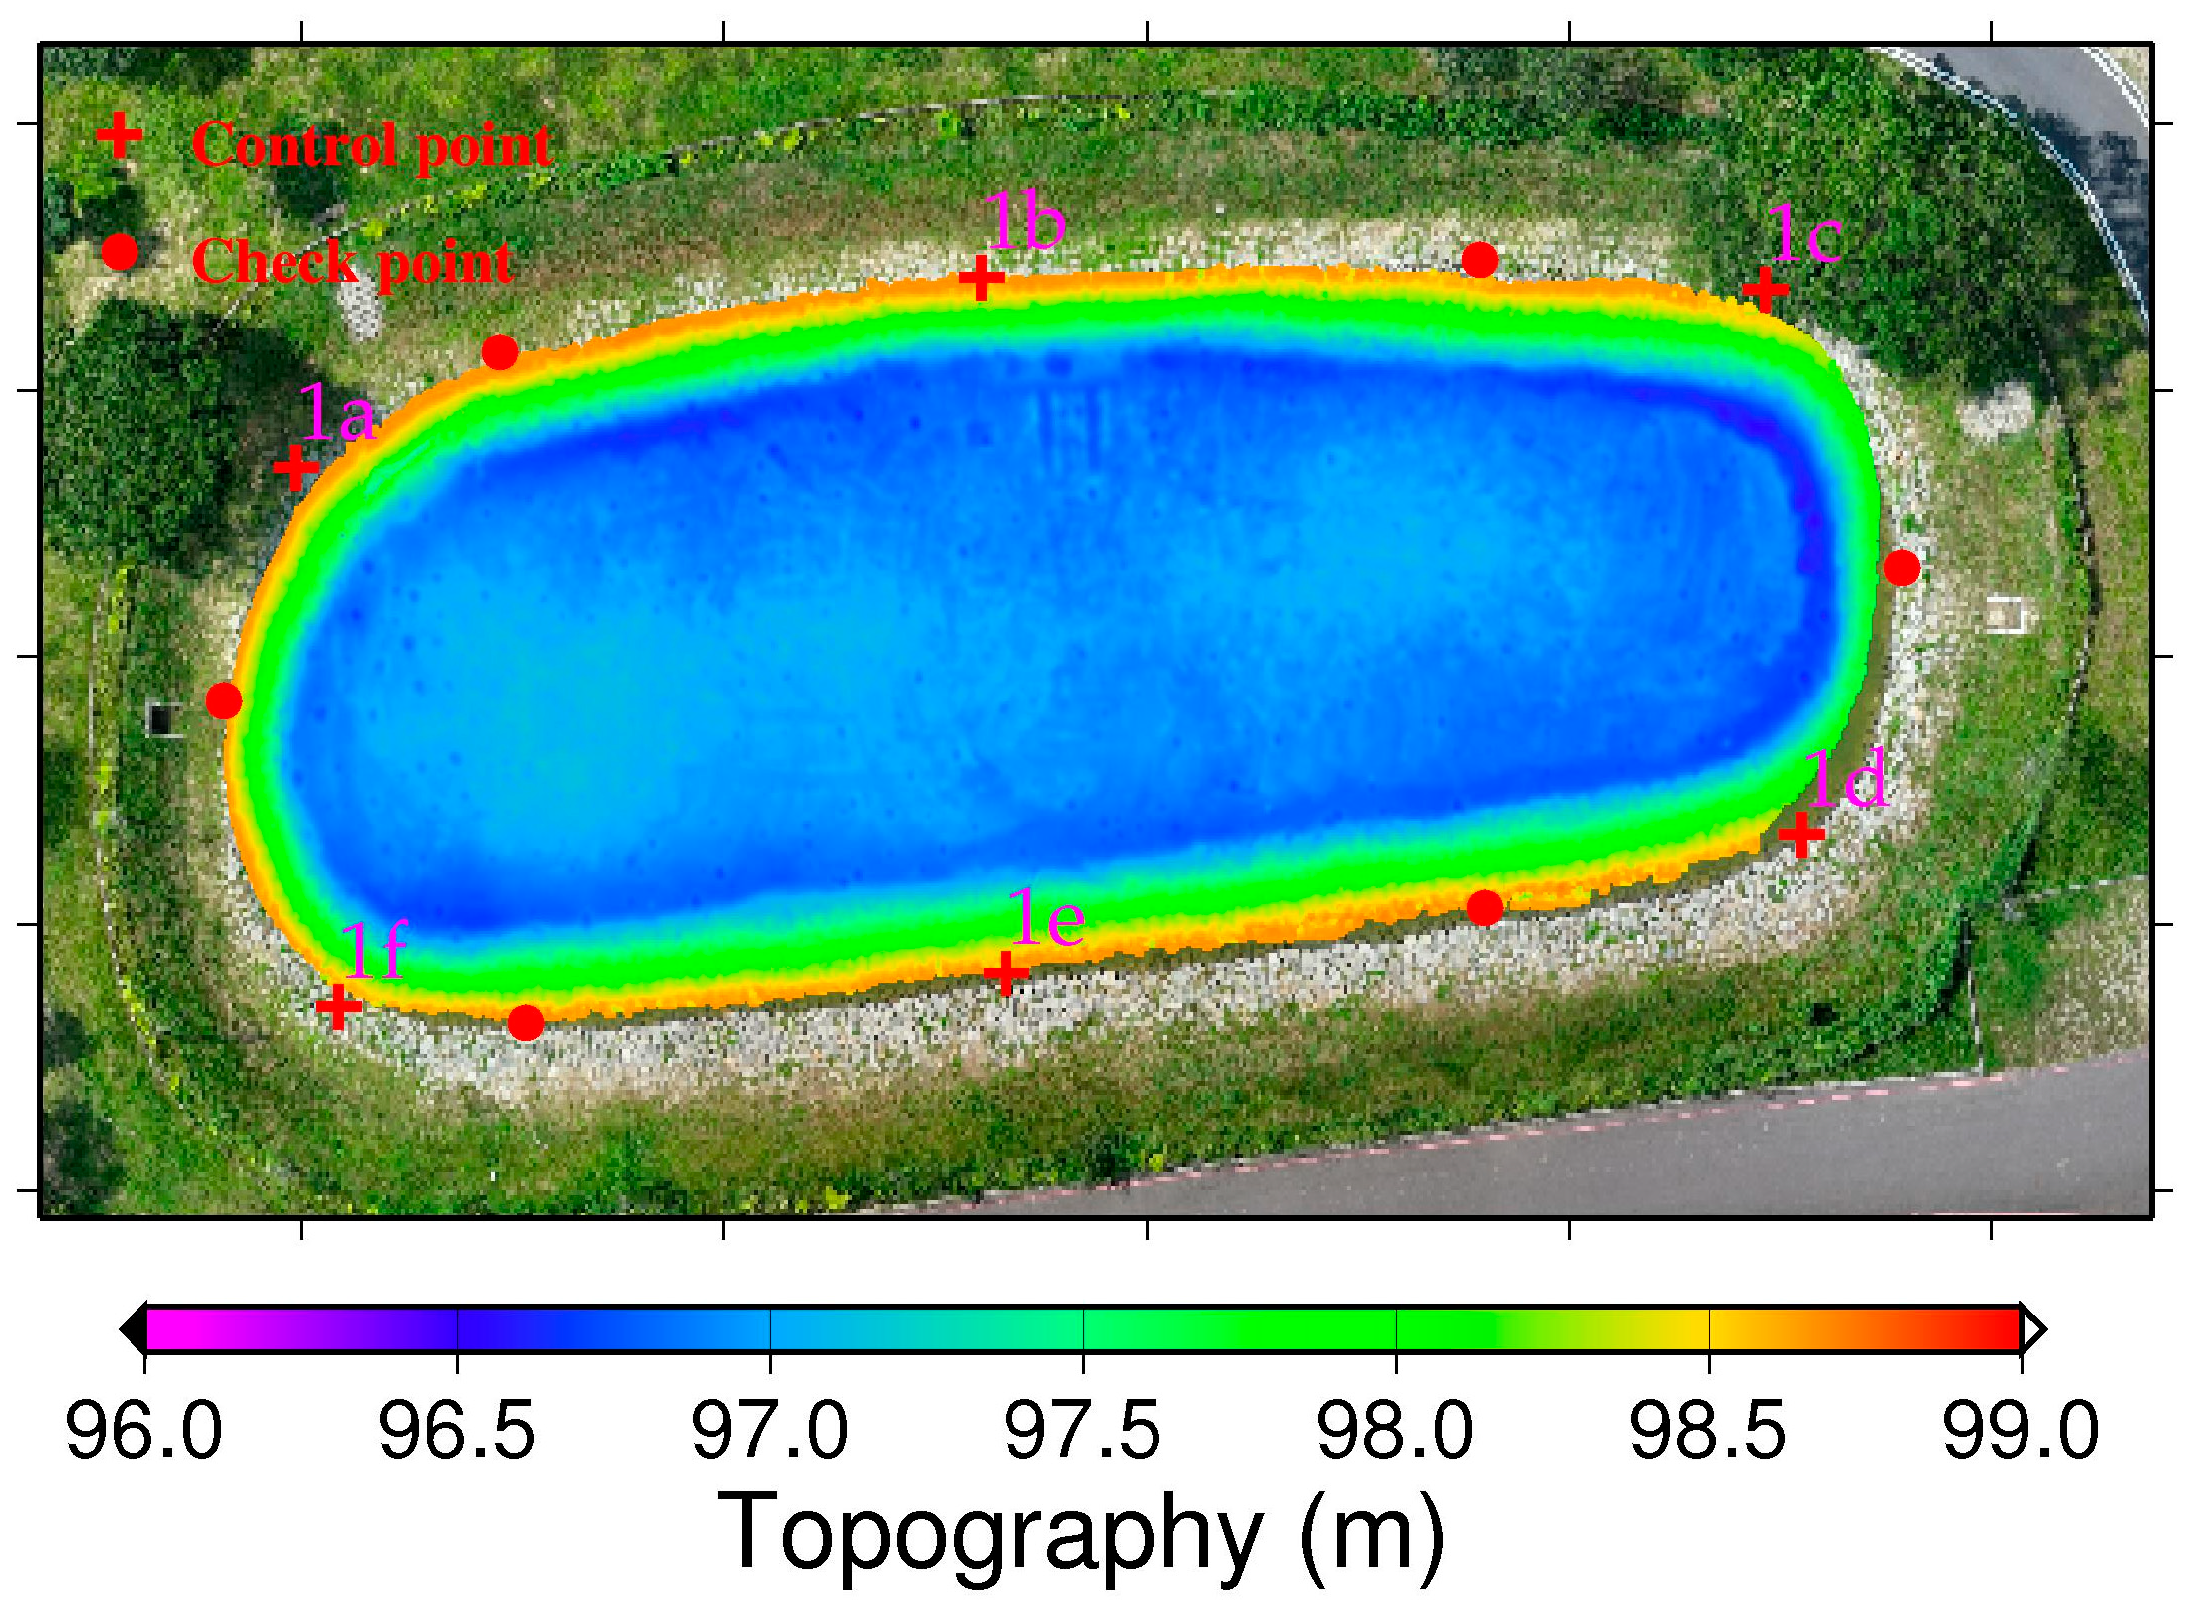
For each study area, control points were selected based on geometric distinctiveness, clear visibility in both UAV and USV datasets, and adequate spatial coverage. Points were arranged as uniformly as possible within the overlap or boundary zones to minimize spatial bias, while collinear configurations were avoided to maintain geometric stability. All control points corresponded to sharp and easily identifiable terrain features—such as embankment corners, building edges, and spillway intersections—ensuring repeatable and reliable registration across datasets. The control points were selected as comprehensively as possible within each study area, considering the geometric and visibility constraints of both UAV and USV datasets. Although some regions offered limited distinctive features due to vegetation or water-surface reflections, the selected points provided sufficient spatial coverage and geometric stability for reliable registration.
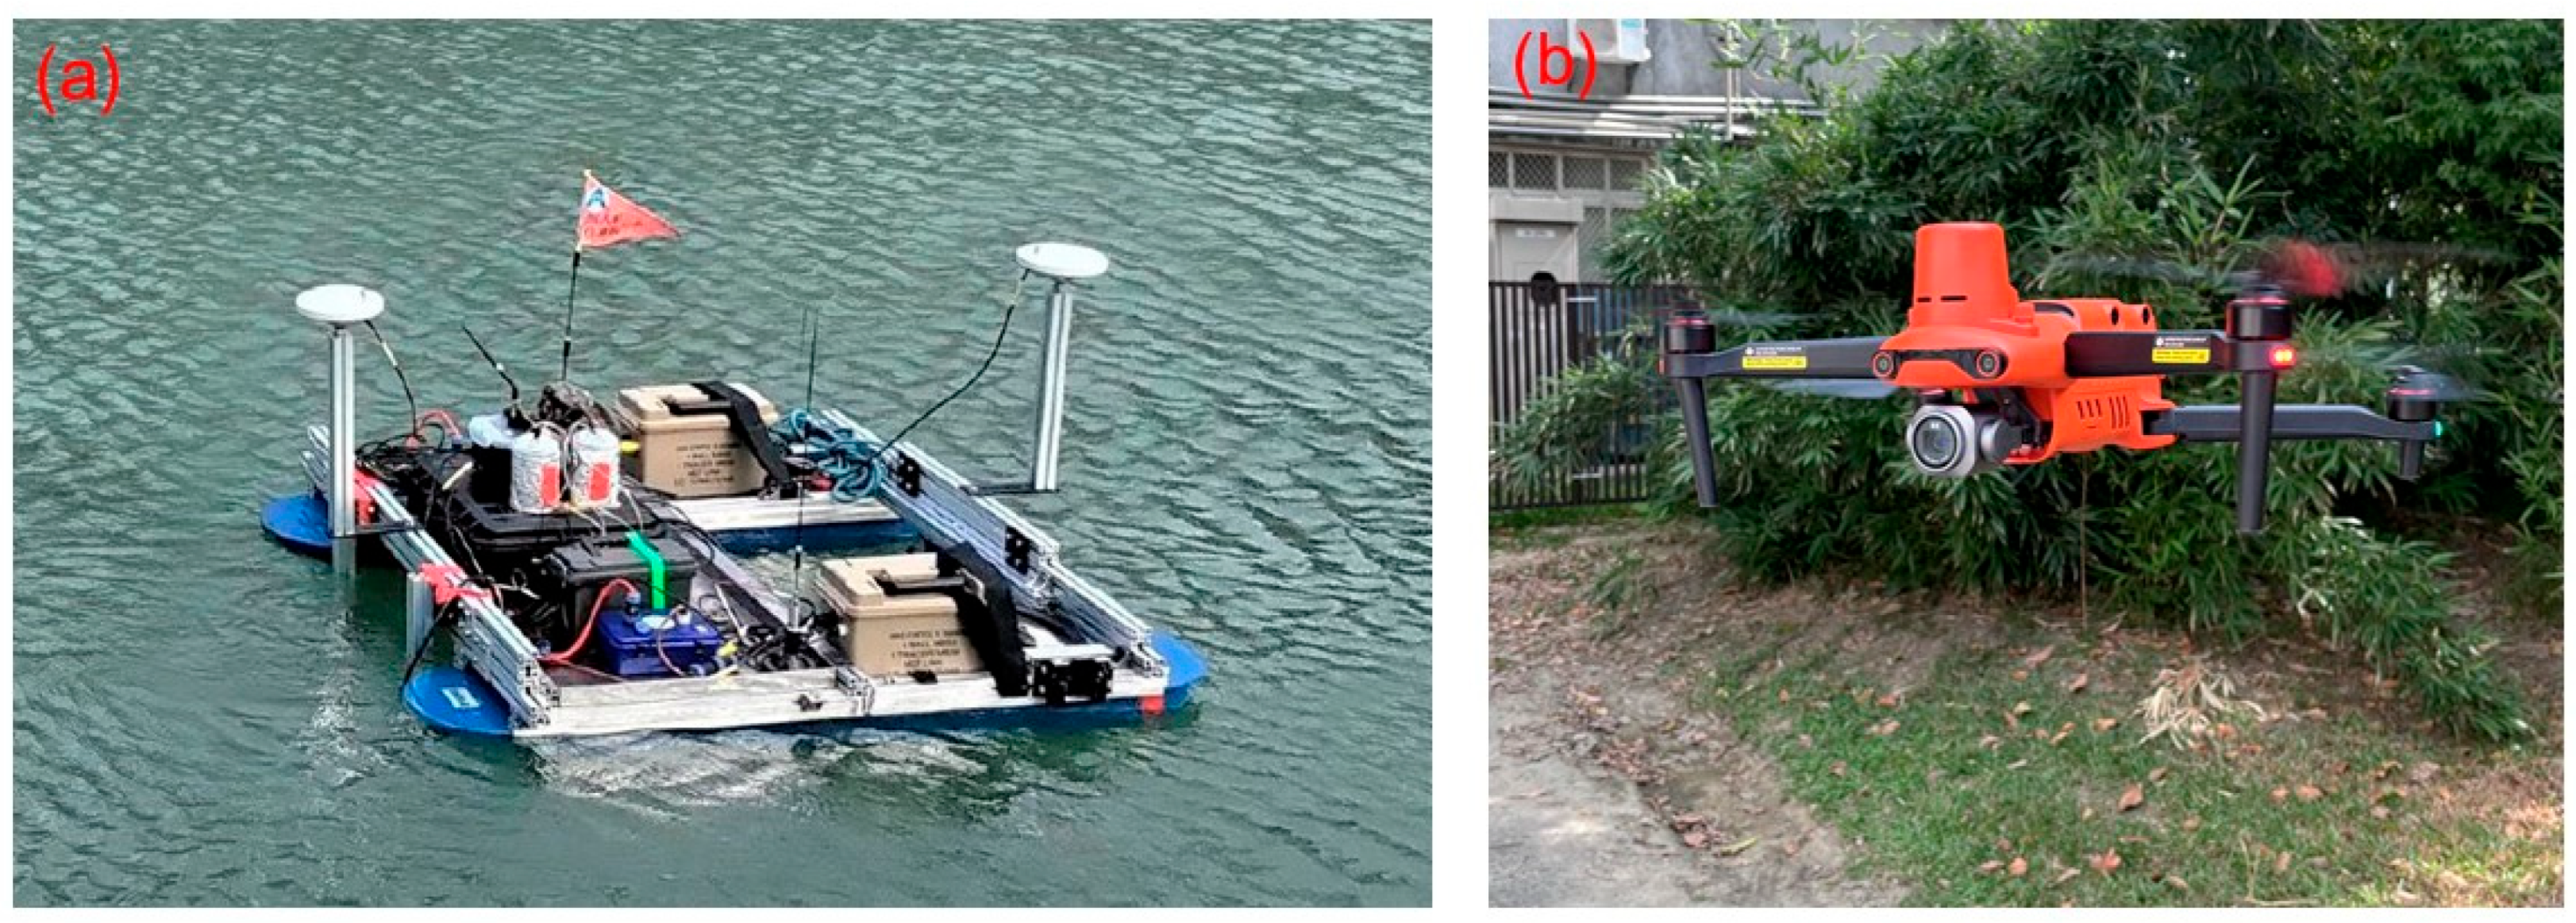
The USV system used in study area 1 is the NORBIT iWBMS multibeam sonar system [
41] mounted in an unmanned vehicle from Chen Kai Technology (
Figure 2a). Additionally, the drone used in study areas 1–3 is the AUTEL EVO II, as shown in
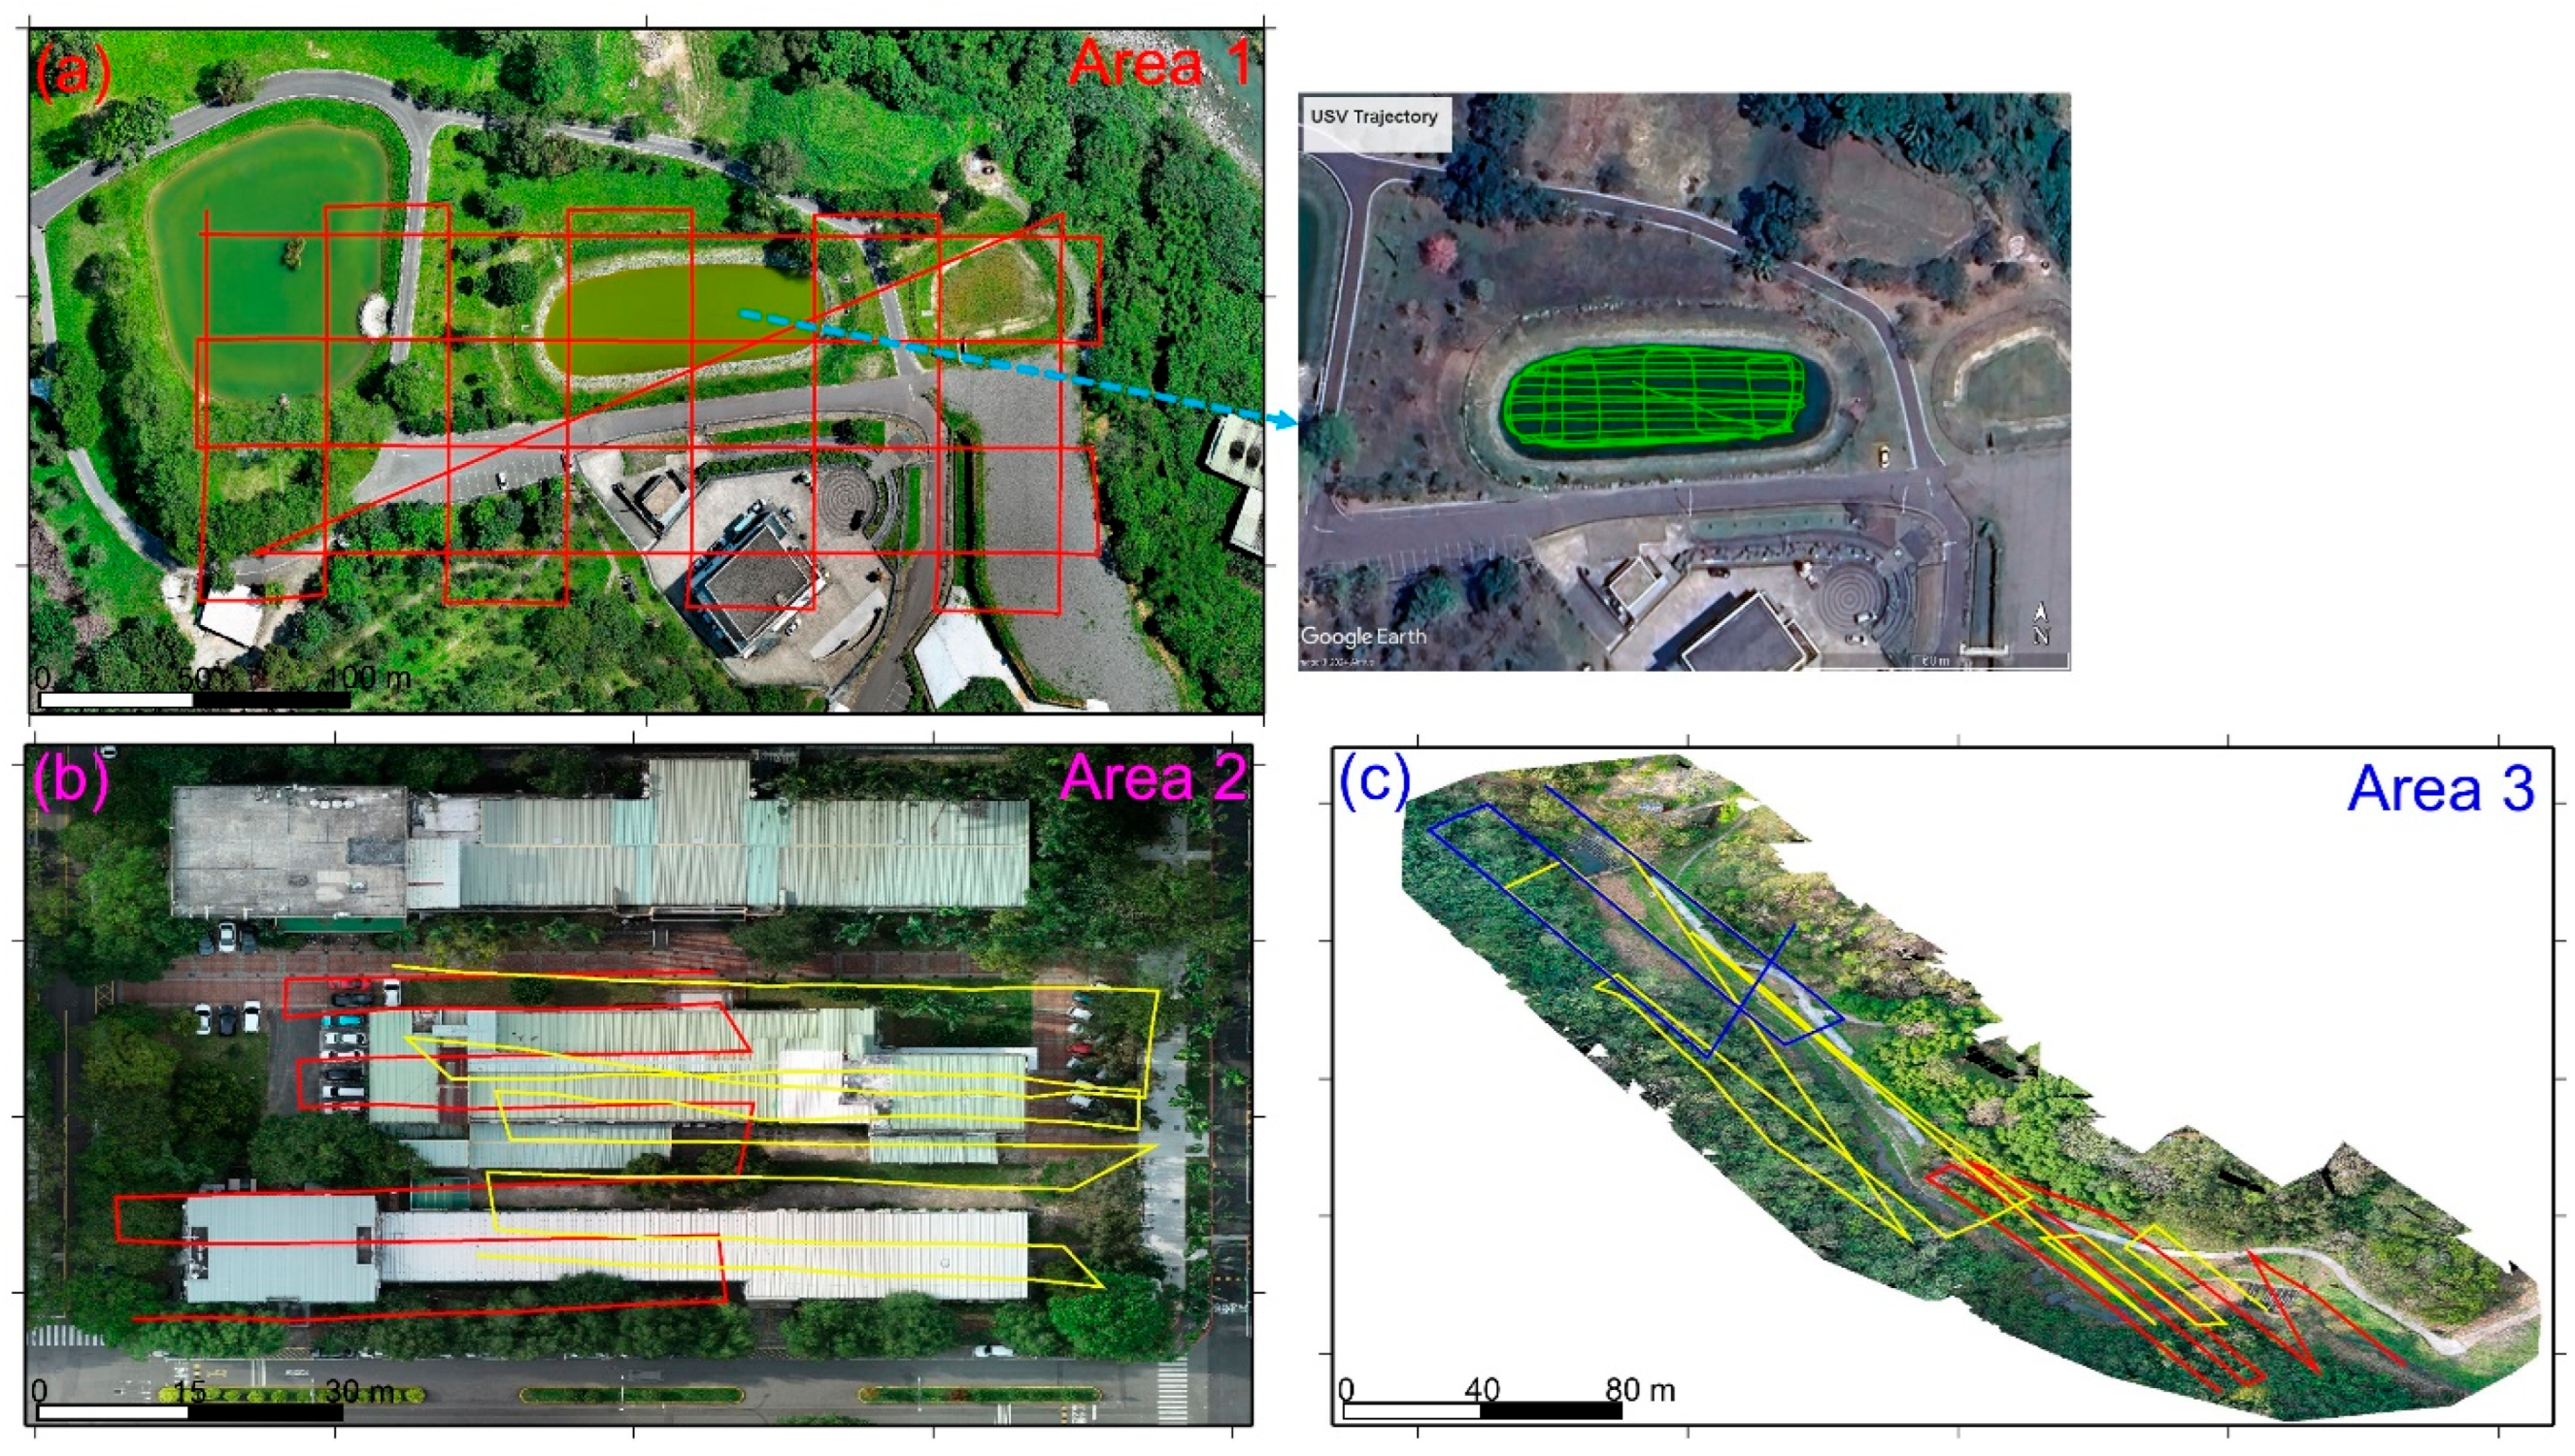
Figure 2b. The trajectories of the USV and UAV missions in study areas 1–3 are shown in
Figure 3. In
Figure 3a, the red dots and green dots represent the UAV and USV mission trajectories, respectively. The photos over study area 1 were taken on 4 July 2023, at an altitude of 80 m, with a forward overlap of 70% and a side overlap of 60%, totaling 151 photos. The USV survey in study area 1 was also conducted on 4 July 2023, yielding a total of 502,521 point cloud data points. In
Figure 3b, the trajectories with red and yellow dots represent Models 2-1 and 2-2, respectively. The aerial photography dates for the two models were 23 October 2023, and 24 October 2023. The flight altitude was 30 m, with a forward overlap of approximately 70% and a side overlap of approximately 60%. The number of aerial photos taken was 53 for Model 2-1 and 99 for Model 2-2. In
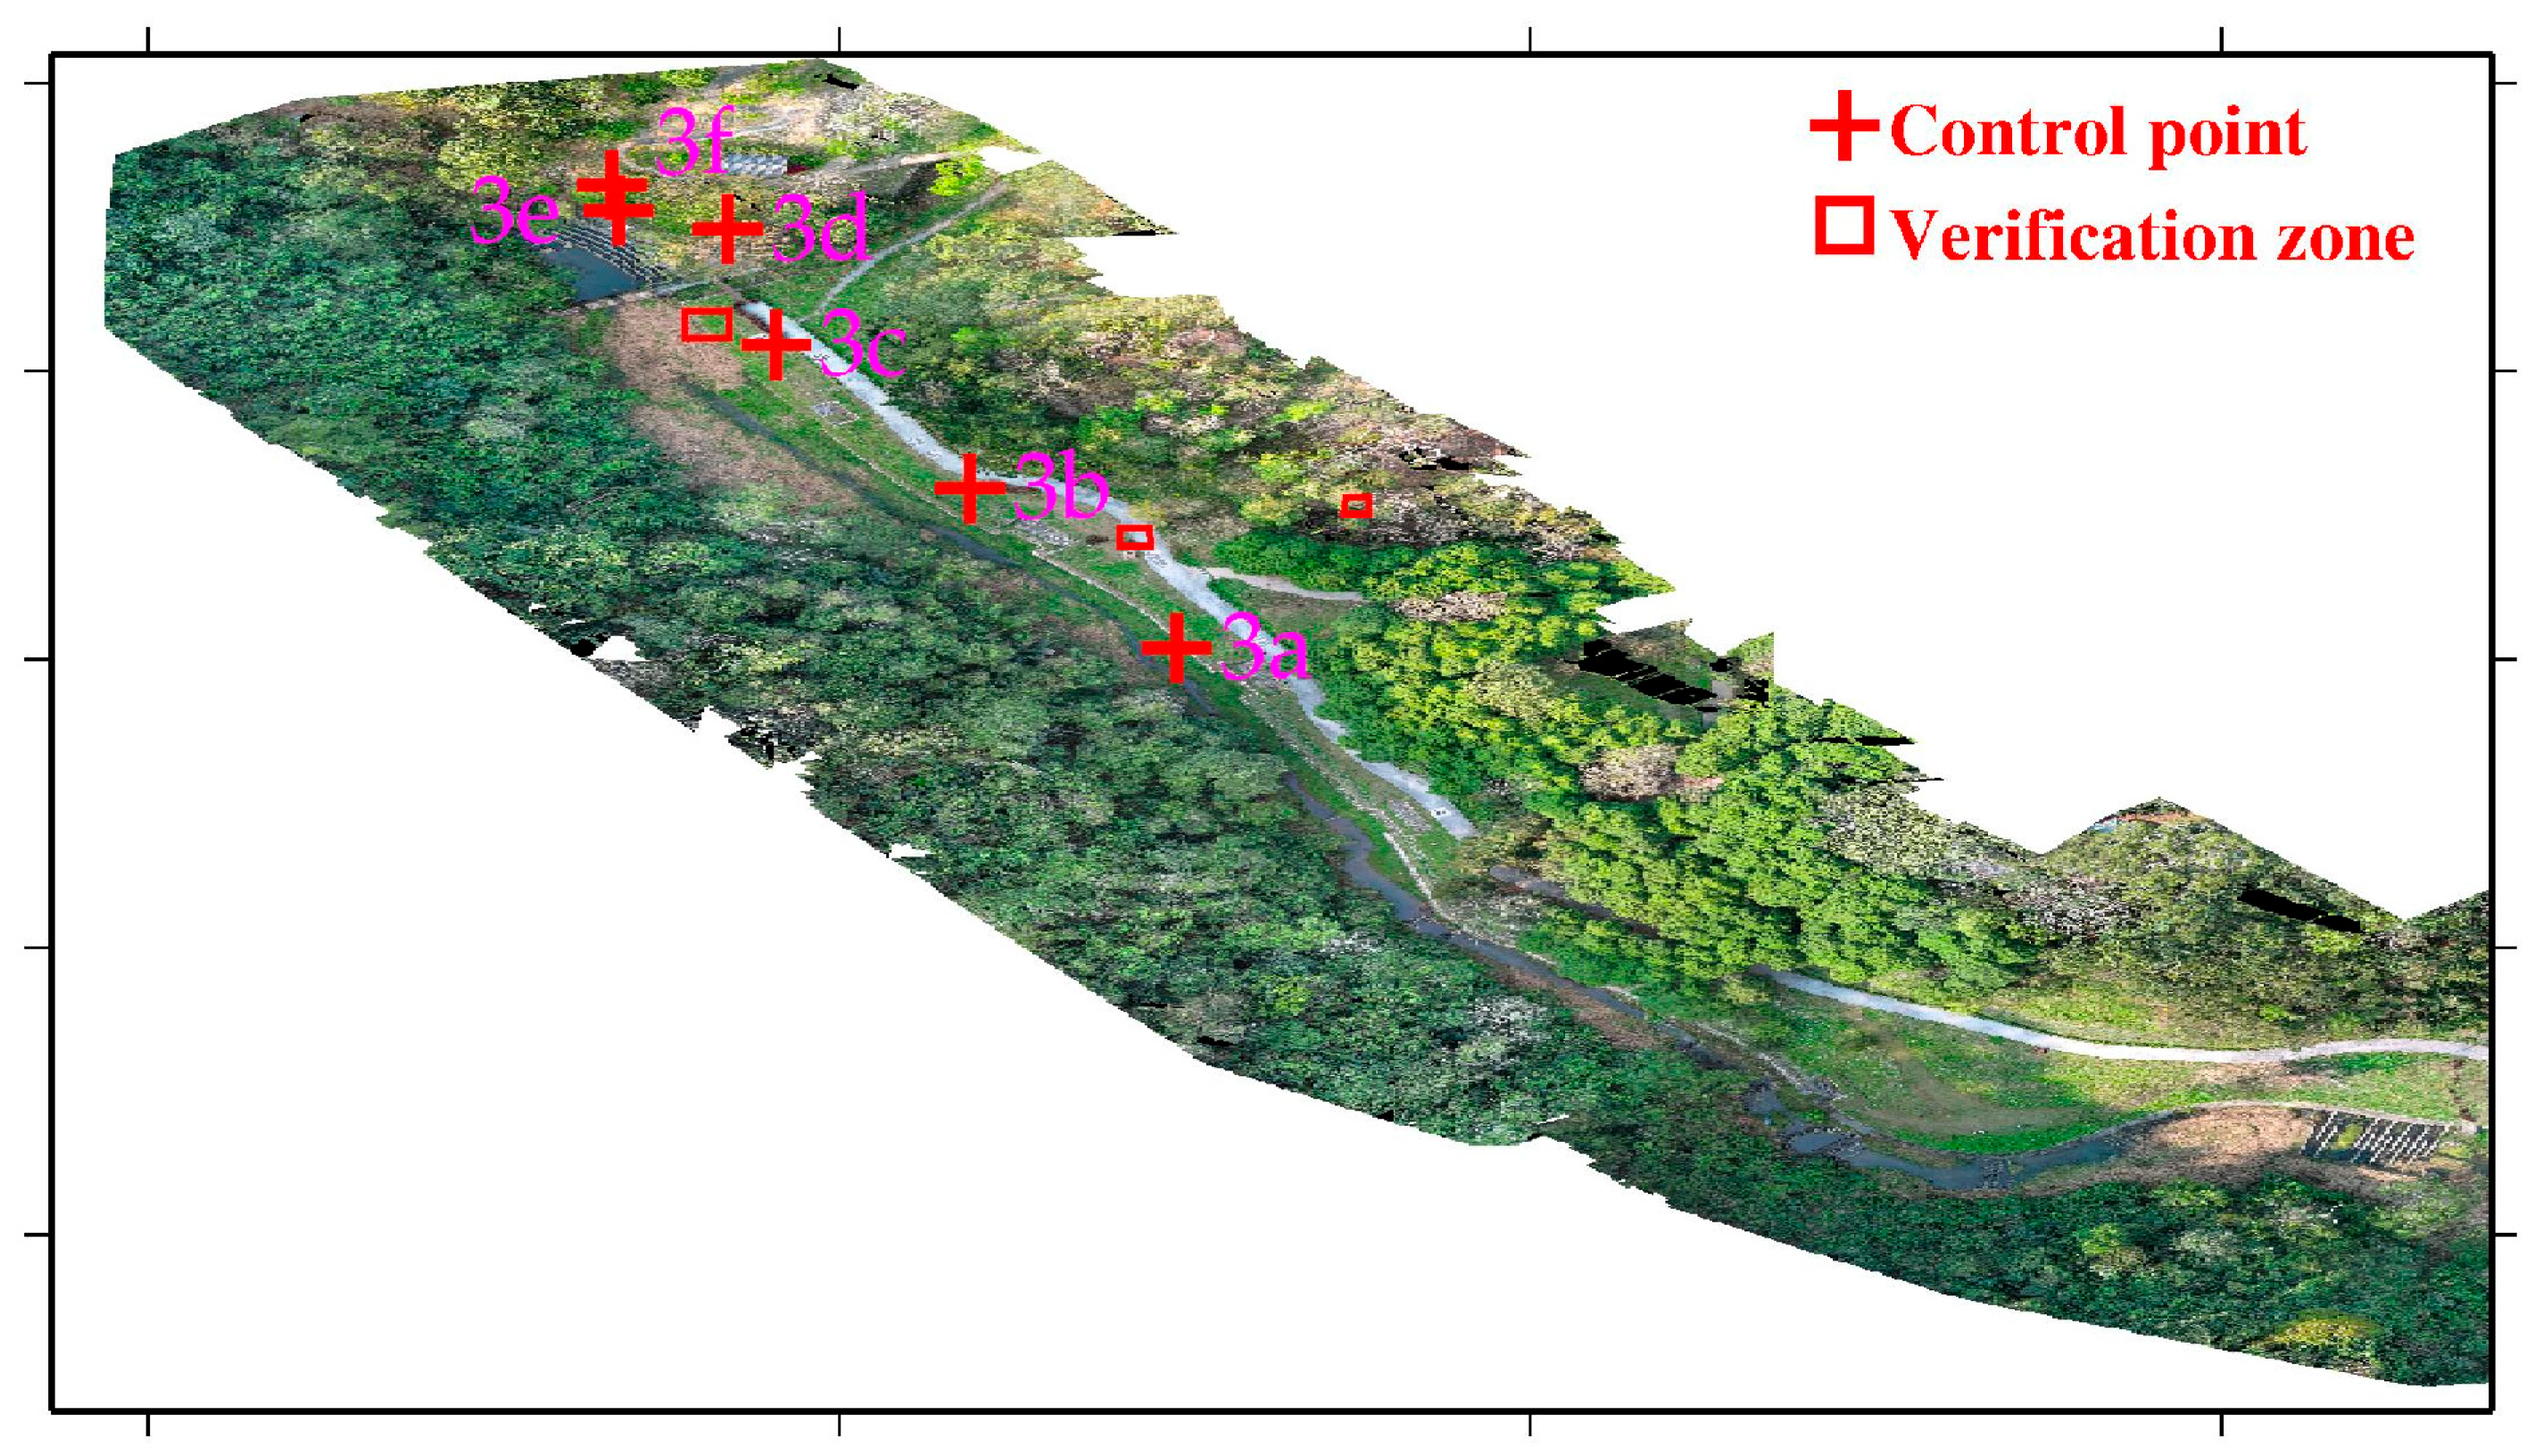
Figure 3c, the trajectories with red, yellow, and blue dots represent Models 3-1, 3-2, and 3=3, respectively. The UAV aerial photography date for study area 3 was 4 March 2024. The flight altitude was 100 m, with a forward overlap of approximately 80%, and a side overlap of approximately 70%. The number of aerial photos taken for Models 3-1 to 3-3 was 43, 106, and 55, respectively. Although there are three point cloud models in study area 3, this paper analyzes only the registration results of Models 3-1 and 3-2. All of the registrations of the USV-derived and UAV-derived point cloud models in the three study areas are implemented with 4-parameter, 6-parameter, and 7-parameter CT methods.
5. Conclusions
This study investigates the integration of point cloud data from UAVs and USVs to generate comprehensive terrain models in aquatic environments, and from UAVs to develop continuous terrain models in urban and stream areas. The research includes three study sites: a retention basin in Chiayi County (study Area 1), the Department of SWC at NCHU (study Area 2), and the Sijiaolin stream (study Area 3). Point cloud models were generated using UAV and USV technologies, followed by integration of the USV-UAV and UAV-UAV data using 4-parameter, 6-parameter, and 7-parameter CT methods. These methods were employed to align disparate datasets and produce accurate geospatial models.
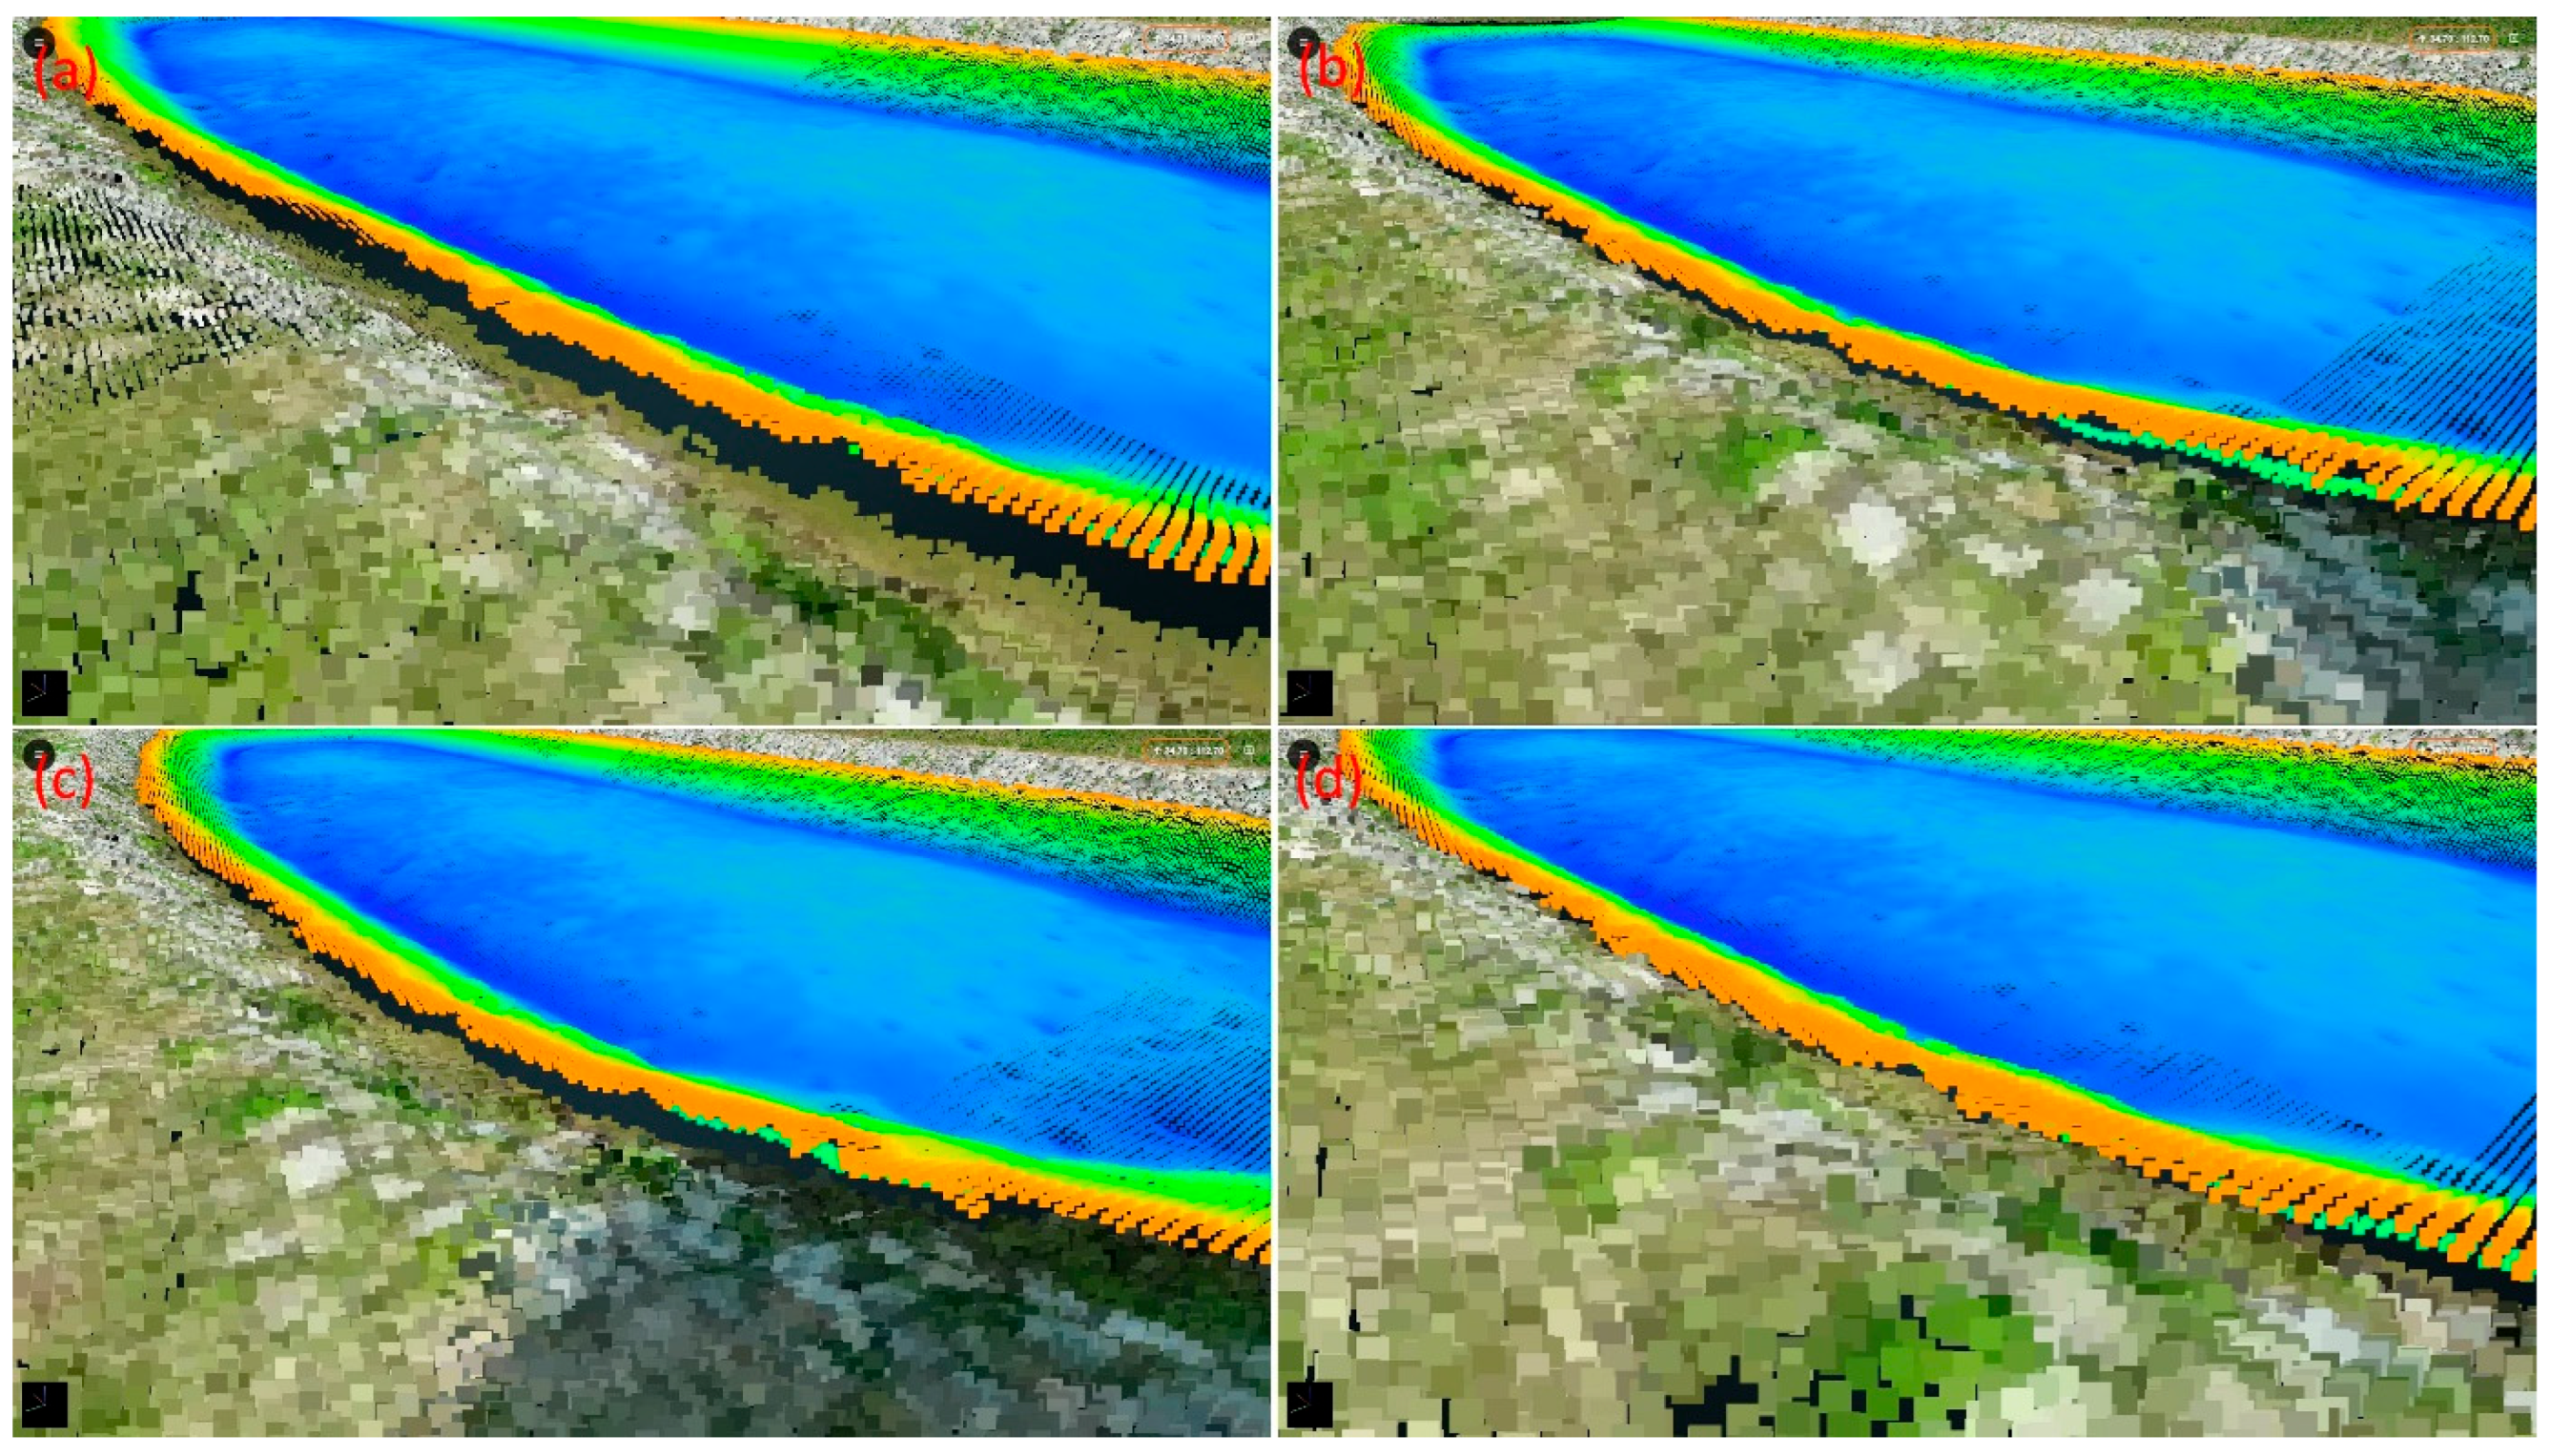
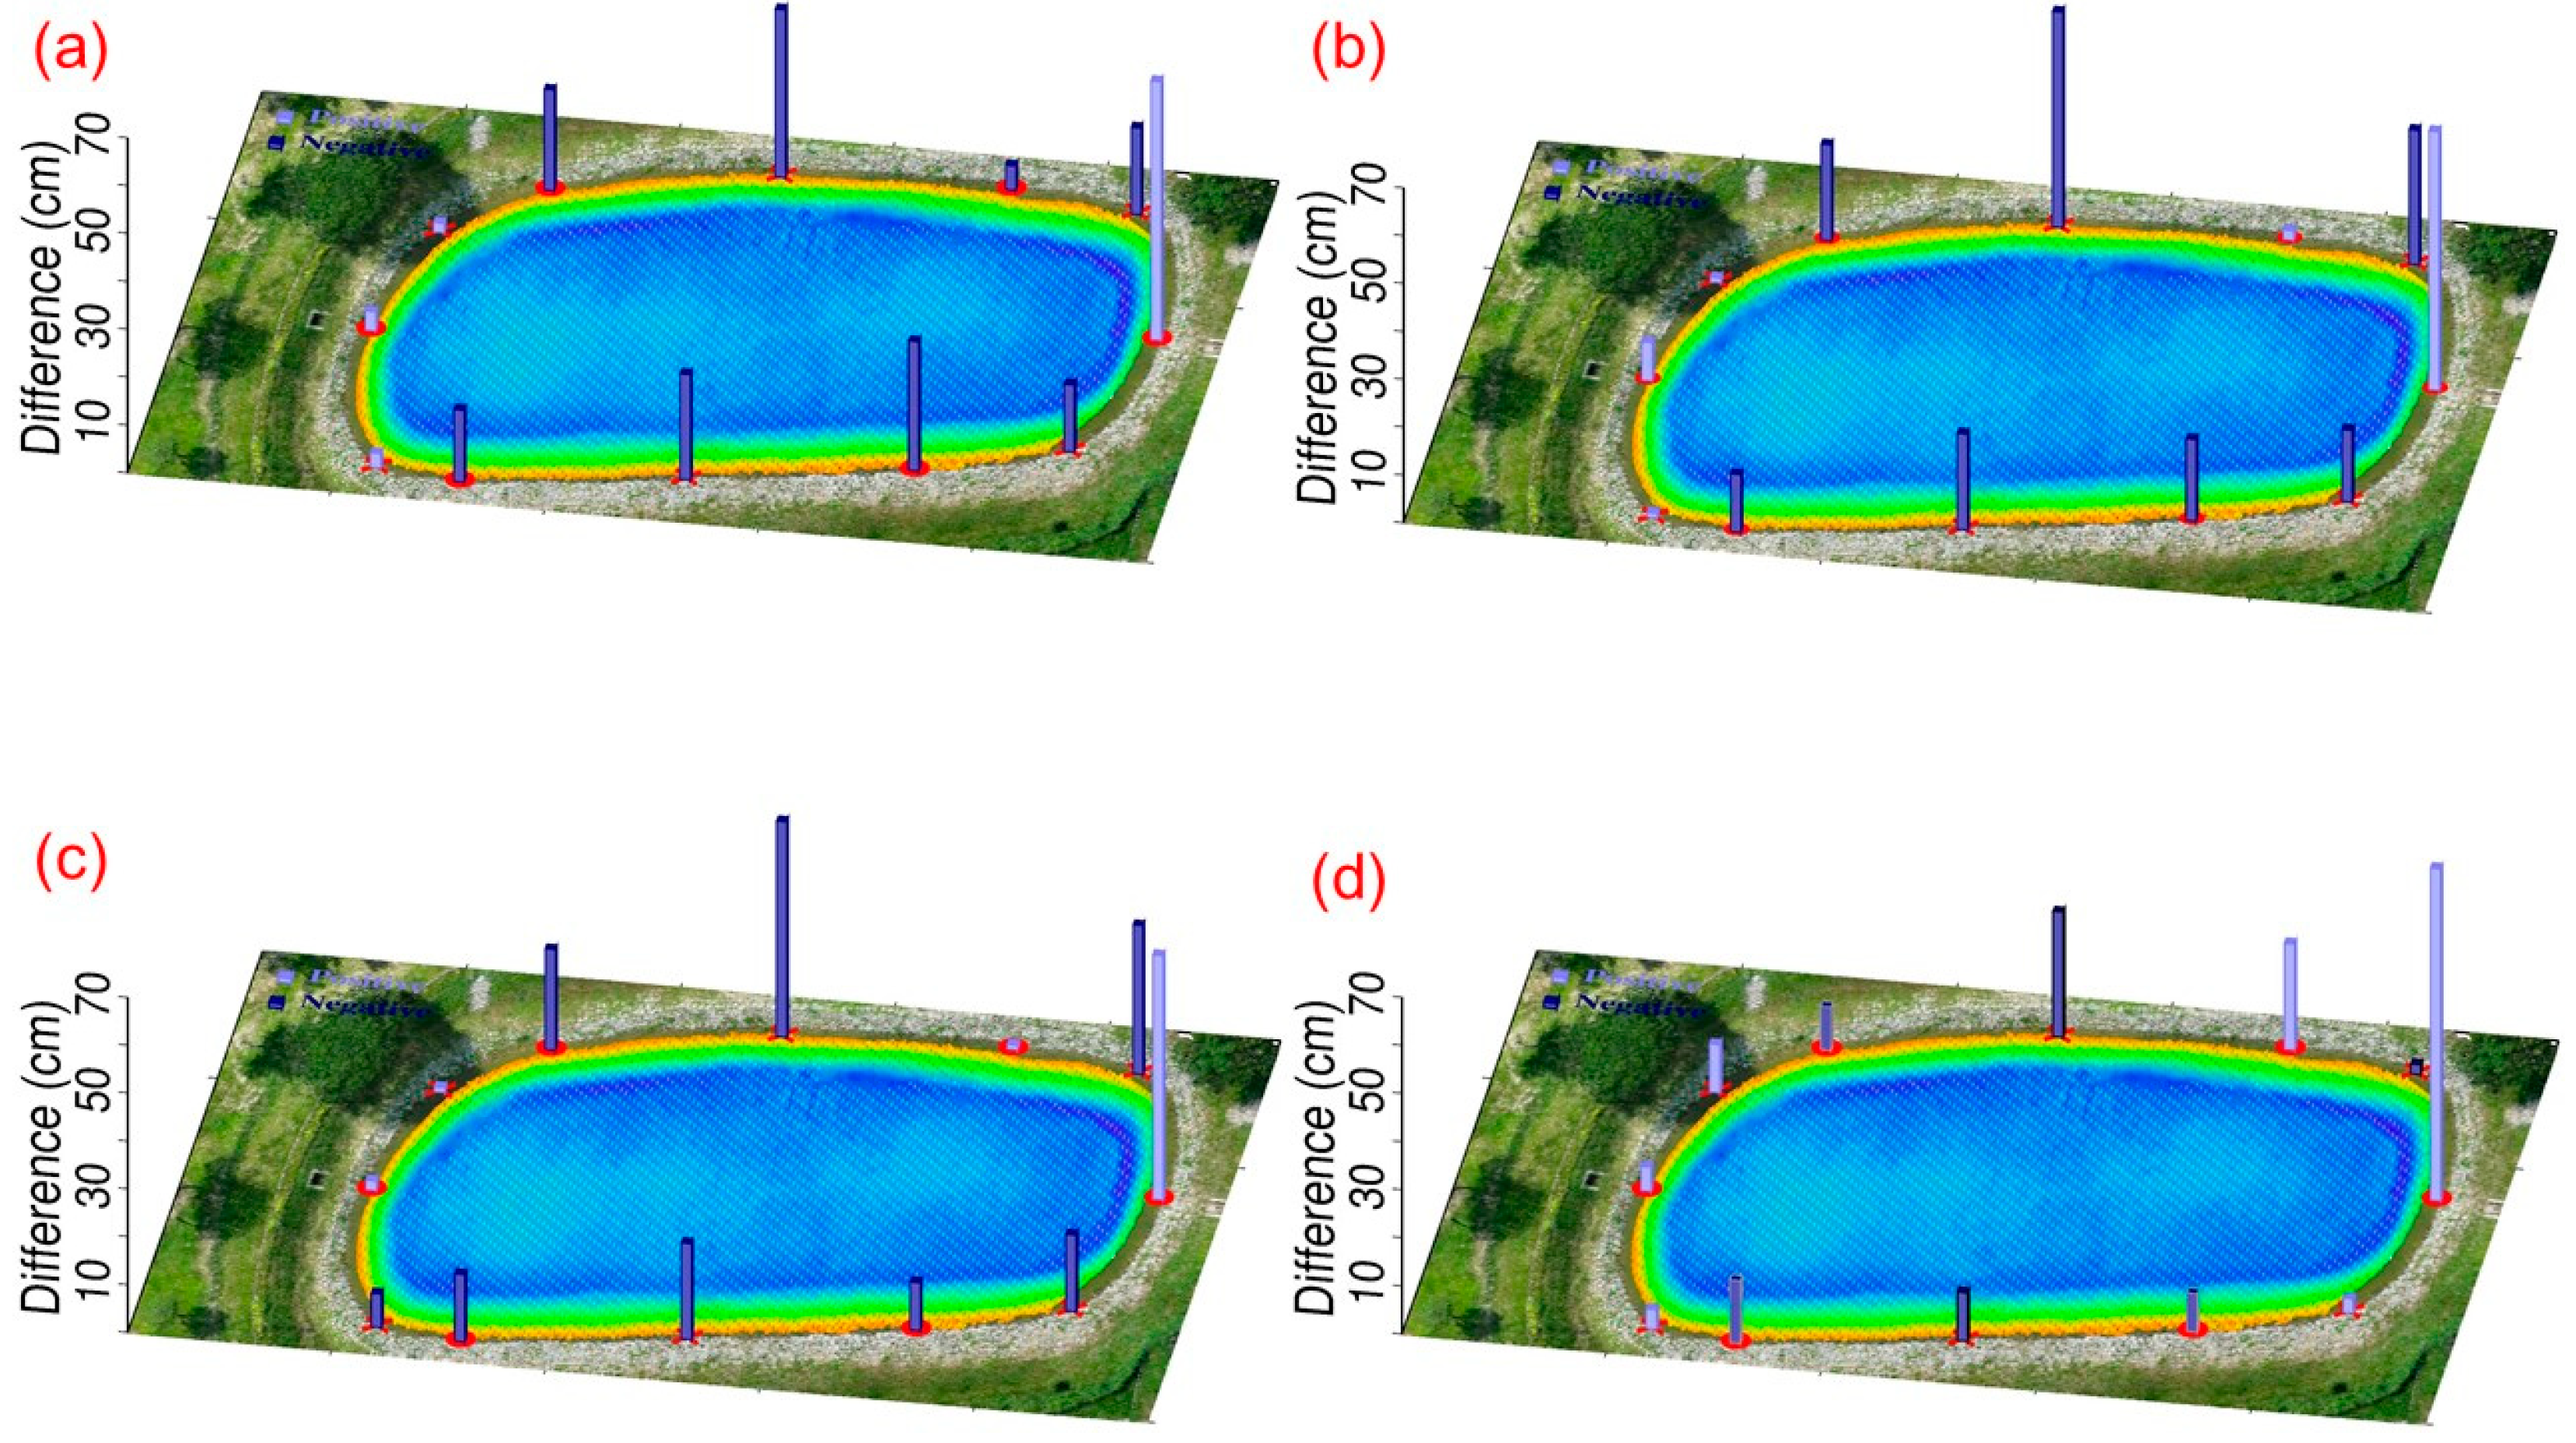
The results of the USV-UAV integration demonstrate that CT methods effectively reduce discrepancies between the USV and UAV point clouds, achieving decimeter-level accuracy across all three CT methods (4-, 6-, and 7-parameter) in study area 1. Among these, the 6-parameter CT method delivered the best performance, with a standard deviation of 12.9 cm in elevation differences. However, the overall improvement in standard deviation remained modest, primarily due to the non-overlapping nature of the point clouds and potential errors in control point selection. These findings emphasize the importance of precise control point selection and highlight the inherent challenges in integrating heterogeneous point cloud datasets. Overall, this study provides valuable insights into sediment transport and ecological conditions in retention basins.
The USV–UAV integration benefited from the built-in GNSS–sonar time synchronization in the USV system, which ensured temporal consistency between the datasets. However, for larger-scale or highly dynamic environments, detailed sensor calibration and synchronization procedures remain essential to minimize systematic errors.
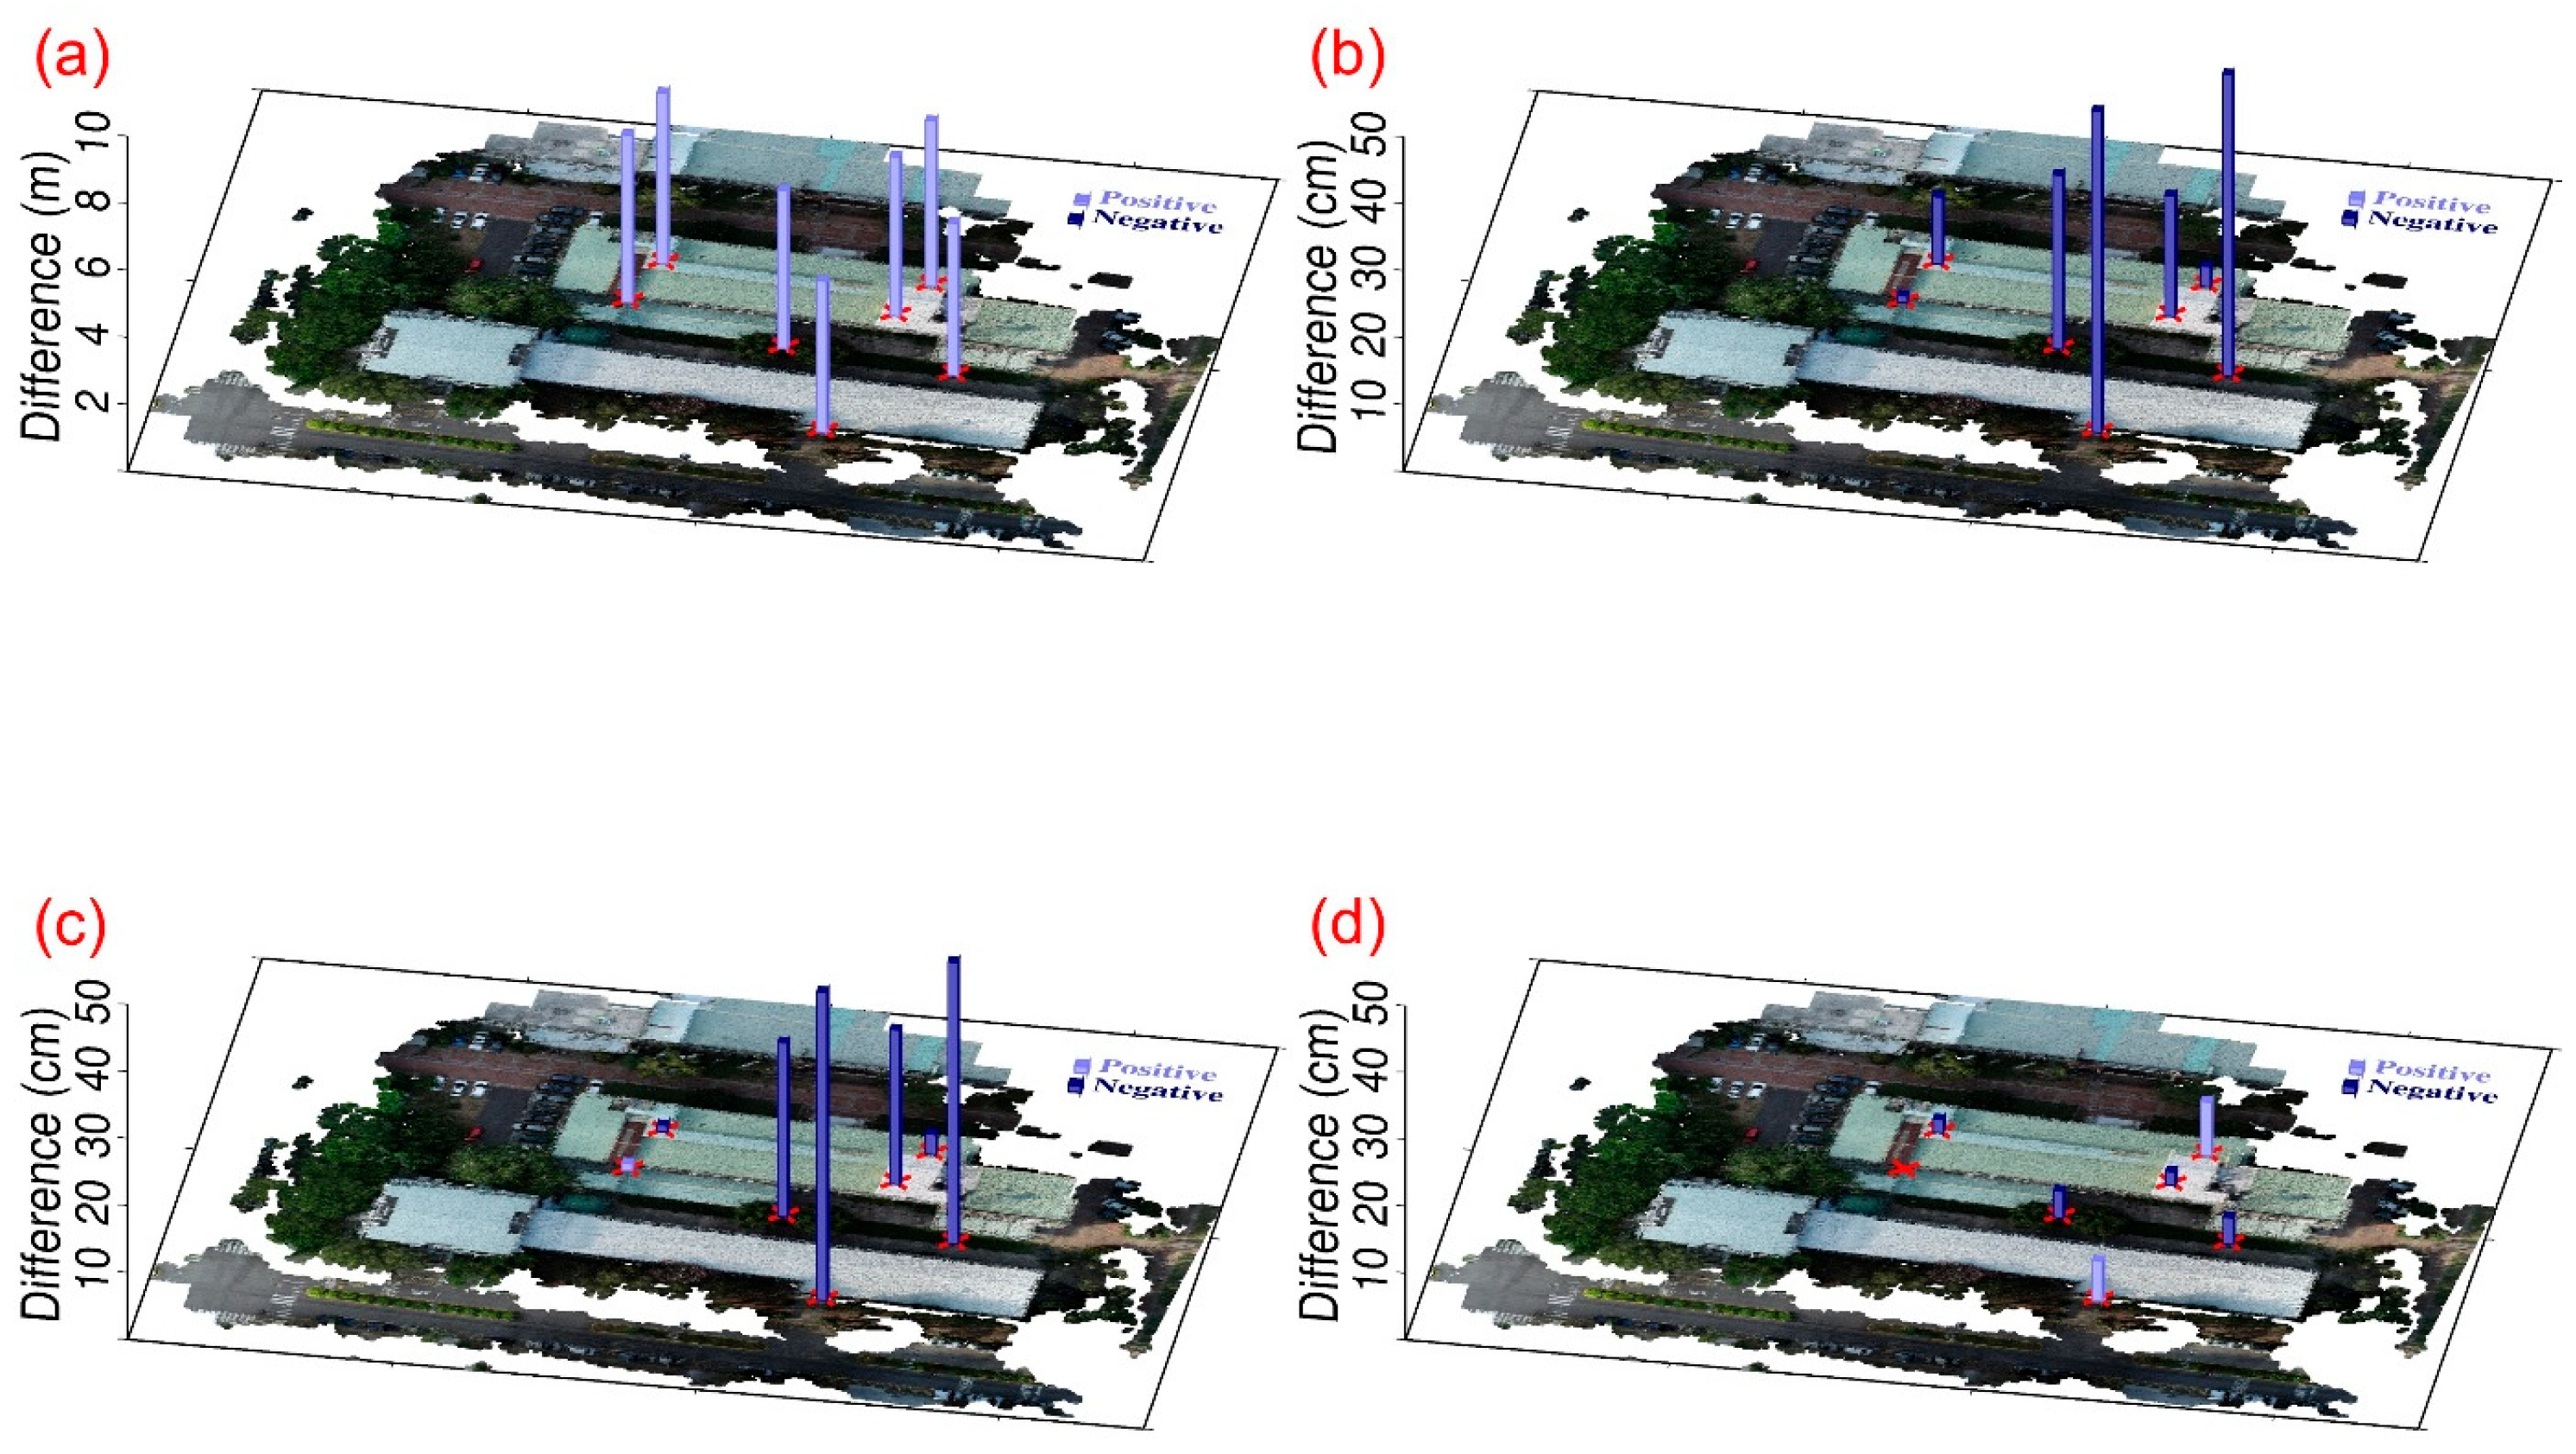
The UAV-UAV integration results show that, regardless of the CT method (4-, 6-, or 7-parameter), the difference in control points before and after transformation consistently achieved centimeter-level accuracy. When validation was performed using verification zones, significant improvements were observed in reducing elevation discrepancies and achieving better point cloud alignment, particularly in areas with less terrain roughness, such as pavements and rooftops. In study area 2, CT methods achieved an accuracy of 1 to 3 cm for rooftops, and less than 1 cm for pavements. In study area 3, the CT methods resulted in accuracies of 11 to 19 cm for pavements and 4 to 14 cm for grasslands. These findings align with previous research. However, in areas with more complex terrain, such as tree canopies, accuracy improvements were less pronounced, although the 7-parameter CT method still outperformed the others. In general, the 7-parameter CT method consistently provided superior results compared to the 4-parameter and 6-parameter methods, in both study area 2 and 3. Notably, the 4- and 6-parameter methods yielded results closer to the 7-parameter method in study area 2, while in study area 3, the 4- and 6-parameter methods performed significantly worse. This discrepancy is attributed to the more even distribution of control points in study area 2 compared to study area 3.
The key contributions of this study are as follows: In USV-UAV integration research, this paper is the first to explore the acquisition of both underwater and above-water terrain data using USV-UAV systems and to perform point cloud model registration. These findings provide a valuable reference for future efforts in integrating UAV and USV point cloud data, facilitating more accurate and comprehensive modeling of diverse terrains, particularly in aquatic and adjacent environments. In the UAV-UAV research, this study evaluates the accuracy of different CT methods for registering UAV-based point cloud models. Notably, replacing traditional check points with verification zones may provide a more representative and comprehensive assessment.
While numerous studies on TLS-TLS, TLS-UAV, and UAV-UAV point cloud integration (e.g., [
1,
2,
3,
4,
5,
6,
7,
23]) report high accuracy, many rely on commercial or custom software for data processing, which involves complex computational procedures. Additionally, point cloud fusion results are often confined to specific commercial software platforms, limiting their broader applicability and dissemination. In contrast, this paper employs widely used CT methods, offering a simpler, more accessible approach to merging point cloud models. The results demonstrate that this method achieves high accuracy while remaining straightforward. Furthermore, all point cloud fusion results from this study are available on the Pointbox website, a free platform for viewing point cloud models, facilitating easy access and sharing of the research findings.
