1. Introduction
Pest pressure remains a persistent drag on the yield, quality, and input efficiency in edible crops, making early detection and continuous monitoring essential pillars of precision agriculture and integrated pest management (IPM) [
1,
2]. Beyond farm-level losses, invasive and range-shifting species underscore the need for scalable, technology-enabled monitoring pipelines that can generalize across geographies and seasons [
3]. Over roughly the last decade, three sensing umbrellas have matured for agricultural pest detection and monitoring: (i) vision-based systems using RGB imagery from fixed nodes, handhelds, or UAVs with classical CNNs, modern one-stage detectors (YOLO family), and transformer variants [
4,
5,
6,
7]; (ii) spectral and imaging spectroscopy (multispectral, hyperspectral, NIR/FTIR, fluorescence) that captures physio-biochemical cues preceding visible damage and extends to satellite/airborne remote sensing [
8,
9,
10]; and (iii) indirect sensing (electronic noses/VOC sensing, acoustics/vibration, and IoT micro-stations) that infer pest activity via chemical or physical signatures [
11,
12,
13].
Within the vision families, the work spans from curated benchmarks and lab conditions to increasingly realistic field deployments. Large-scale datasets such as IP102 catalyzed progress, but also made explicit the long-tail and domain-shift challenges typical of small targets in cluttered backgrounds [
6]. Field-facing pipelines now include autonomous camera traps for insect counting and identification [
7], embedded YOLO-style detectors tailored to constrained hardware in paddy fields [
14], and architectures specialized for tiny pests (e.g., brown planthoppers) under dense foliage [
15]. In row crops such as cotton, hybrid designs that combine efficient vision backbones with knowledge graphs illustrate a broader trend toward task-specific priors for decision support [
16]. Parallel to vision, imaging spectroscopy has moved from controlled settings toward outdoor/operational use, e.g., the hyperspectral detection of early mite damage in cotton [
9] and broader remote-sensing syntheses that situate pest signatures within vegetation indices and multi-sensor time series [
8,
10]. Indirect sensing modalities have also matured: e-nose platforms and VOC analytics offer compact, low-power options for enclosed environments or proximal sensing [
12], bioacoustics leverage the flight tones and stridulation with modern deep learning [
13], and IoT architectures integrate environmental context, communications, and fleet management [
2,
11].
Multiple umbrella reviews already cover these three modalities: comprehensive surveys of deep learning for crop pests [
4,
5], spectroscopy-centric overviews [
8,
10], and syntheses of sensor/IoT-based monitoring [
11,
12,
13]. However, these are predominantly performance-centric: they benchmark models or instruments using in-distribution datasets and laboratory protocols, emphasizing accuracy, mAP, F1, and related metrics. In contrast, the determinants of adoption in farms, the on-device compute class and power envelope, the acquisition workflow and calibration stability, the enclosure/IP rating and environmental robustness, the communications and fleet operations, and seasonal maintenance are often under-specified or incomparable across studies [
4,
8,
11]. The gap widens as pipelines incorporate heavier temporal models (e.g., hybrid transformer–ConvLSTM for pest forecasting) whose runtime and memory footprints complicate edge deployment, despite promising predictive value [
17]. Practitioners thus face a practical question: not “what is the single best algorithm/instrument,” but “which sensing modality is realistically fit for purpose under budget, energy, labour, and connectivity constraints?”
This review addresses that gap from an embedded-engineering standpoint for edible crops. Instead of ranking algorithms or instruments in absolute terms, we organized the ecosystem by the sensing modality (vision/AI, spectroscopy, indirect sensing) and evaluated works through a modality-aware performance–cost–implementability (PCI) lens that explicitly elevates the implementability, the feasibility of running, maintaining, and scaling a solution in real environments. Concretely, implementability in our use comprises the following: (i) the inference compute class and power/thermal envelope (MCU/SoC/edge GPU); (ii) the acquisition workflow and calibration (illumination control, reflectance/white references, warm-up times); (iii) the enclosure and environmental robustness (dust, wind, condensation, vibration); (iv) communications/backhaul and fleet operations (LoRa/cellular/Wi-Fi duty-cycling, synchronization, over-the-air updates); and (v) seasonal maintenance overhead. These factors cut across modalities and directly condition the viability of on-farm deployments, from solar-powered camera nodes [
7,
14] to spectral rigs susceptible to illumination drift [
8,
9] and IoT traps requiring robust duty cycles and remote management [
2,
11].
Methodologically, we performed a systematic screening of peer-reviewed literature (2015–2025) restricted to edible crops and to studies with some degree of implementation/testing. Within each modality, we scored the selected works for the PCI and applied category-specific weights to reflect typical deployment trade-offs (e.g., higher emphasis on implementability for spectroscopy). To improve the transparency and reproducibility beyond accuracy-only reporting, we assessed the inter-reviewer agreement using weighted quadratic Cohen’s
[
18] on the PCI components and synthesized the evidence into compact decision maps that help choose a modality under common field constraint profiles (e.g., limited power with intermittent connectivity vs. high-throughput scouting with controlled illumination). In doing so, we aimed to complement performance-centered syntheses [
4,
5] with deployment metadata from concrete systems, including tiny-object pipelines [
15] and hybrid knowledge-driven solutions [
16].
Aims. To focus the review and make the guidance testable, we addressed four objectives: (i) map pest-detection technologies by sensing modality with deployment metadata [
1,
10,
11]; (ii) compare studies with a modality-aware PCI rubric that foregrounds implementability and cost, spanning vision datasets and field systems [
6,
7,
14]; (iii) assess the inter-reviewer reliability (weighted quadratic
) for PCI scoring; and (iv) deliver decision maps that guide modality selection under typical field constraints in edible crops, accounting for IoT, e-nose, and bioacoustic options alongside imaging spectroscopy and embedded vision [
8,
11,
12,
13].
2. Materials and Methods
2.1. Review Objective and Scope
This review aimed to identify, classify, and comparatively evaluate technological approaches for pest detection in agriculture, with a particular focus on their potential deployment in embedded systems. The review emphasizes the technical feasibility of each approach in real-world, resource-constrained environments, rather than from purely theoretical or performance-centric perspectives.
The scope was restricted to three major technological domains that have shown either academic prominence or commercial viability in recent years:
Detection via imaging systems: Approaches using visual data (e.g., RGB, UAV-based imaging) for pest detection, typically processed via convolutional neural networks (CNNs) or other deep learning models.
Spectral imaging techniques: Techniques that include hyperspectral, multispectral, and infrared imaging modalities, capable of capturing physiological or biochemical plant indicators.
Sensor-based systems: Strategies involving gas sensors, volatile organic compound (VOC) detectors, or environmental sensors that capture indirect indicators of pest activity.
While many of these systems leverage artificial intelligence (AI) for classification and inference, this review categorizes technologies based on the sensing modality rather than the computational technique employed.
These categories were selected based on two key considerations: (i) their relevance in current scientific literature and (ii) their compatibility with embedded or semi-autonomous platforms. In this context, an embedded system is defined as a purpose-specific hardware and software configuration capable of operating independently or semi-independently in an agricultural environment. This review deliberately excludes solutions that merely involve data acquisition with centralized/cloud-only processing unless the design is explicitly intended for later embedded integration. An exception was made for imaging/AI, for which we included dataset-validated studies that offer a clear and commonly used deployment path to embedded inference (e.g., one-stage YOLO detectors with exportable weights), even in the absence of a reported hardware prototype.
Rather than focusing exclusively on conventional performance metrics such as the classification accuracy, this review proposes a comparative framework grounded in technical dimensions relevant to embedded system integration. These include, but are not limited to, aspects such as the implementation feasibility and operational constraints. A detailed evaluation framework is introduced in a subsequent section to systematically compare technological solutions across the selected categories.
2.2. Information Sources and Search Strategy
To ensure comprehensive coverage of technological developments in pest detection, a structured literature search was performed using two leading bibliographic databases: IEEE Xplore and Scopus. These platforms were selected due to their strong indexing in embedded systems, artificial intelligence, sensor technologies, and agricultural applications.
The search was restricted to peer-reviewed journal articles and conference proceedings, published between 2015 and 2025, and written in English. Only final, published versions were included; preprints, theses, and other forms of gray literature were excluded.
A primary Boolean query was designed to retrieve works addressing pest or insect detection through image-based systems, spectral imaging, or sensor-based technologies. The query used was as follows (
Figure 1):
The query shown in
Figure 1 returned a total of 152 documents from IEEE Xplore and 240 from Scopus.
To reinforce the coverage of spectral imaging technologies, an additional targeted search was conducted using the Boolean expression shown in
Figure 2.
This supplementary search yielded 20 documents from IEEE Xplore and 36 from Scopus. Articles from the SPIE conference proceedings indexed in Scopus were excluded from the corpus due to restricted access limitations.
The complete set of results was exported and consolidated for further screening. A structured selection process inspired by the PRISMA framework was then applied to remove duplicates and assess article eligibility. Details on the screening strategy, inclusion/exclusion criteria, and review flow are provided in the next section.
2.3. Article Selection and Eligibility Criteria
The selection of articles followed a systematic process aligned with the PRISMA framework, focusing on the identification of studies that applied technological methods for pest or insect detection through computer vision, spectroscopy, or sensor-based systems.
The inclusion criteria were as follows:
Peer-reviewed journal or conference articles published between 2015 and 2025.
Written in English and available in final, full-text form.
Focused on pest or insect detection in the context of agricultural applications.
Employed one of the following approaches: (1) image-based systems (e.g., CNNs), (2) spectral imaging (e.g., hyperspectral or infrared), or (3) chemical/environmental sensors.
The exclusion criteria included the following:
Studies dealing with plant diseases unrelated to pest activity.
Articles focused on non-edible or industrial crops (e.g., cotton, wild plants).
Duplicates across databases (IEEE and Scopus).
Preliminary or inaccessible content (e.g., articles published only in SPIE, which were excluded due to access limitations).
Studies lacking any form of implementation, testing, or system description, especially relevant for AI-based proposals.
All the exclusion criteria were systematically applied during both the title and abstract screening stages.
The primary search was conducted using the Boolean expression presented in
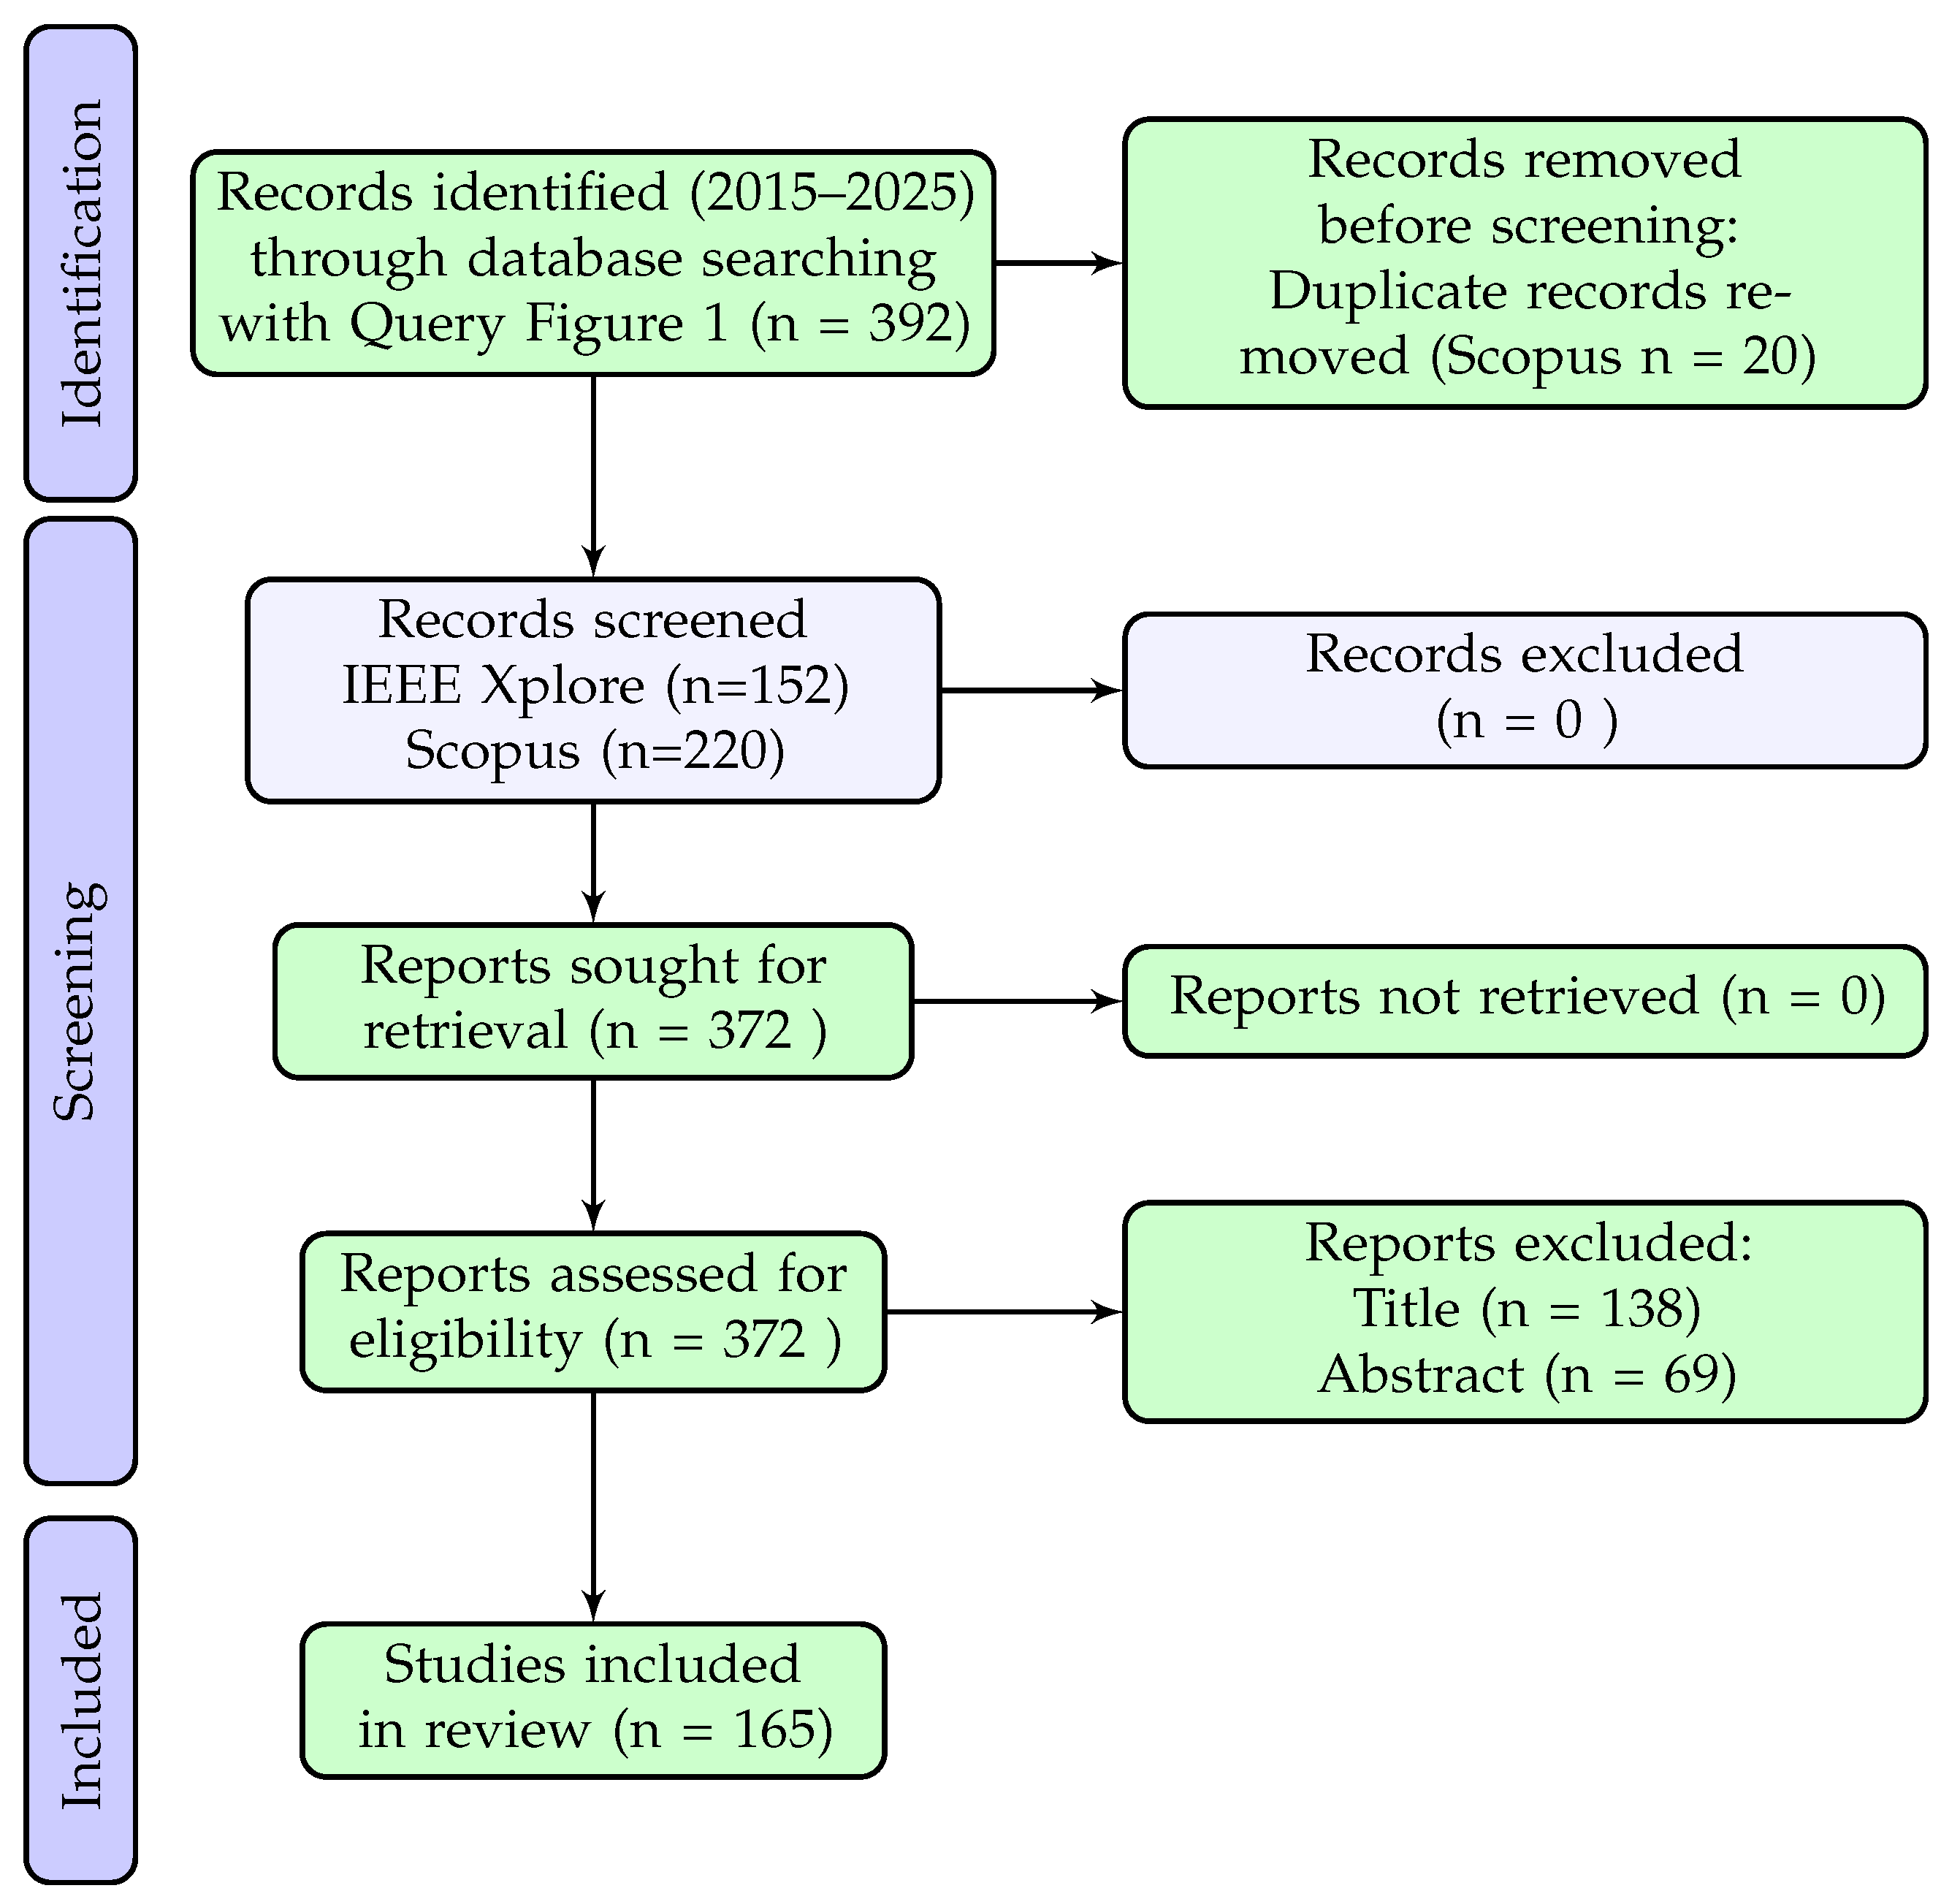
Figure 1, which returned 152 results from IEEE Xplore and 240 from Scopus, totaling 392 records. After removing 20 duplicates from Scopus, 372 records were screened.
Title screening led to the exclusion of 138 articles, and abstract screening removed an additional 69, resulting in 165 articles included for the full analysis.
To reinforce the coverage of spectral imaging technologies, an additional targeted search was conducted using the Boolean expression shown in
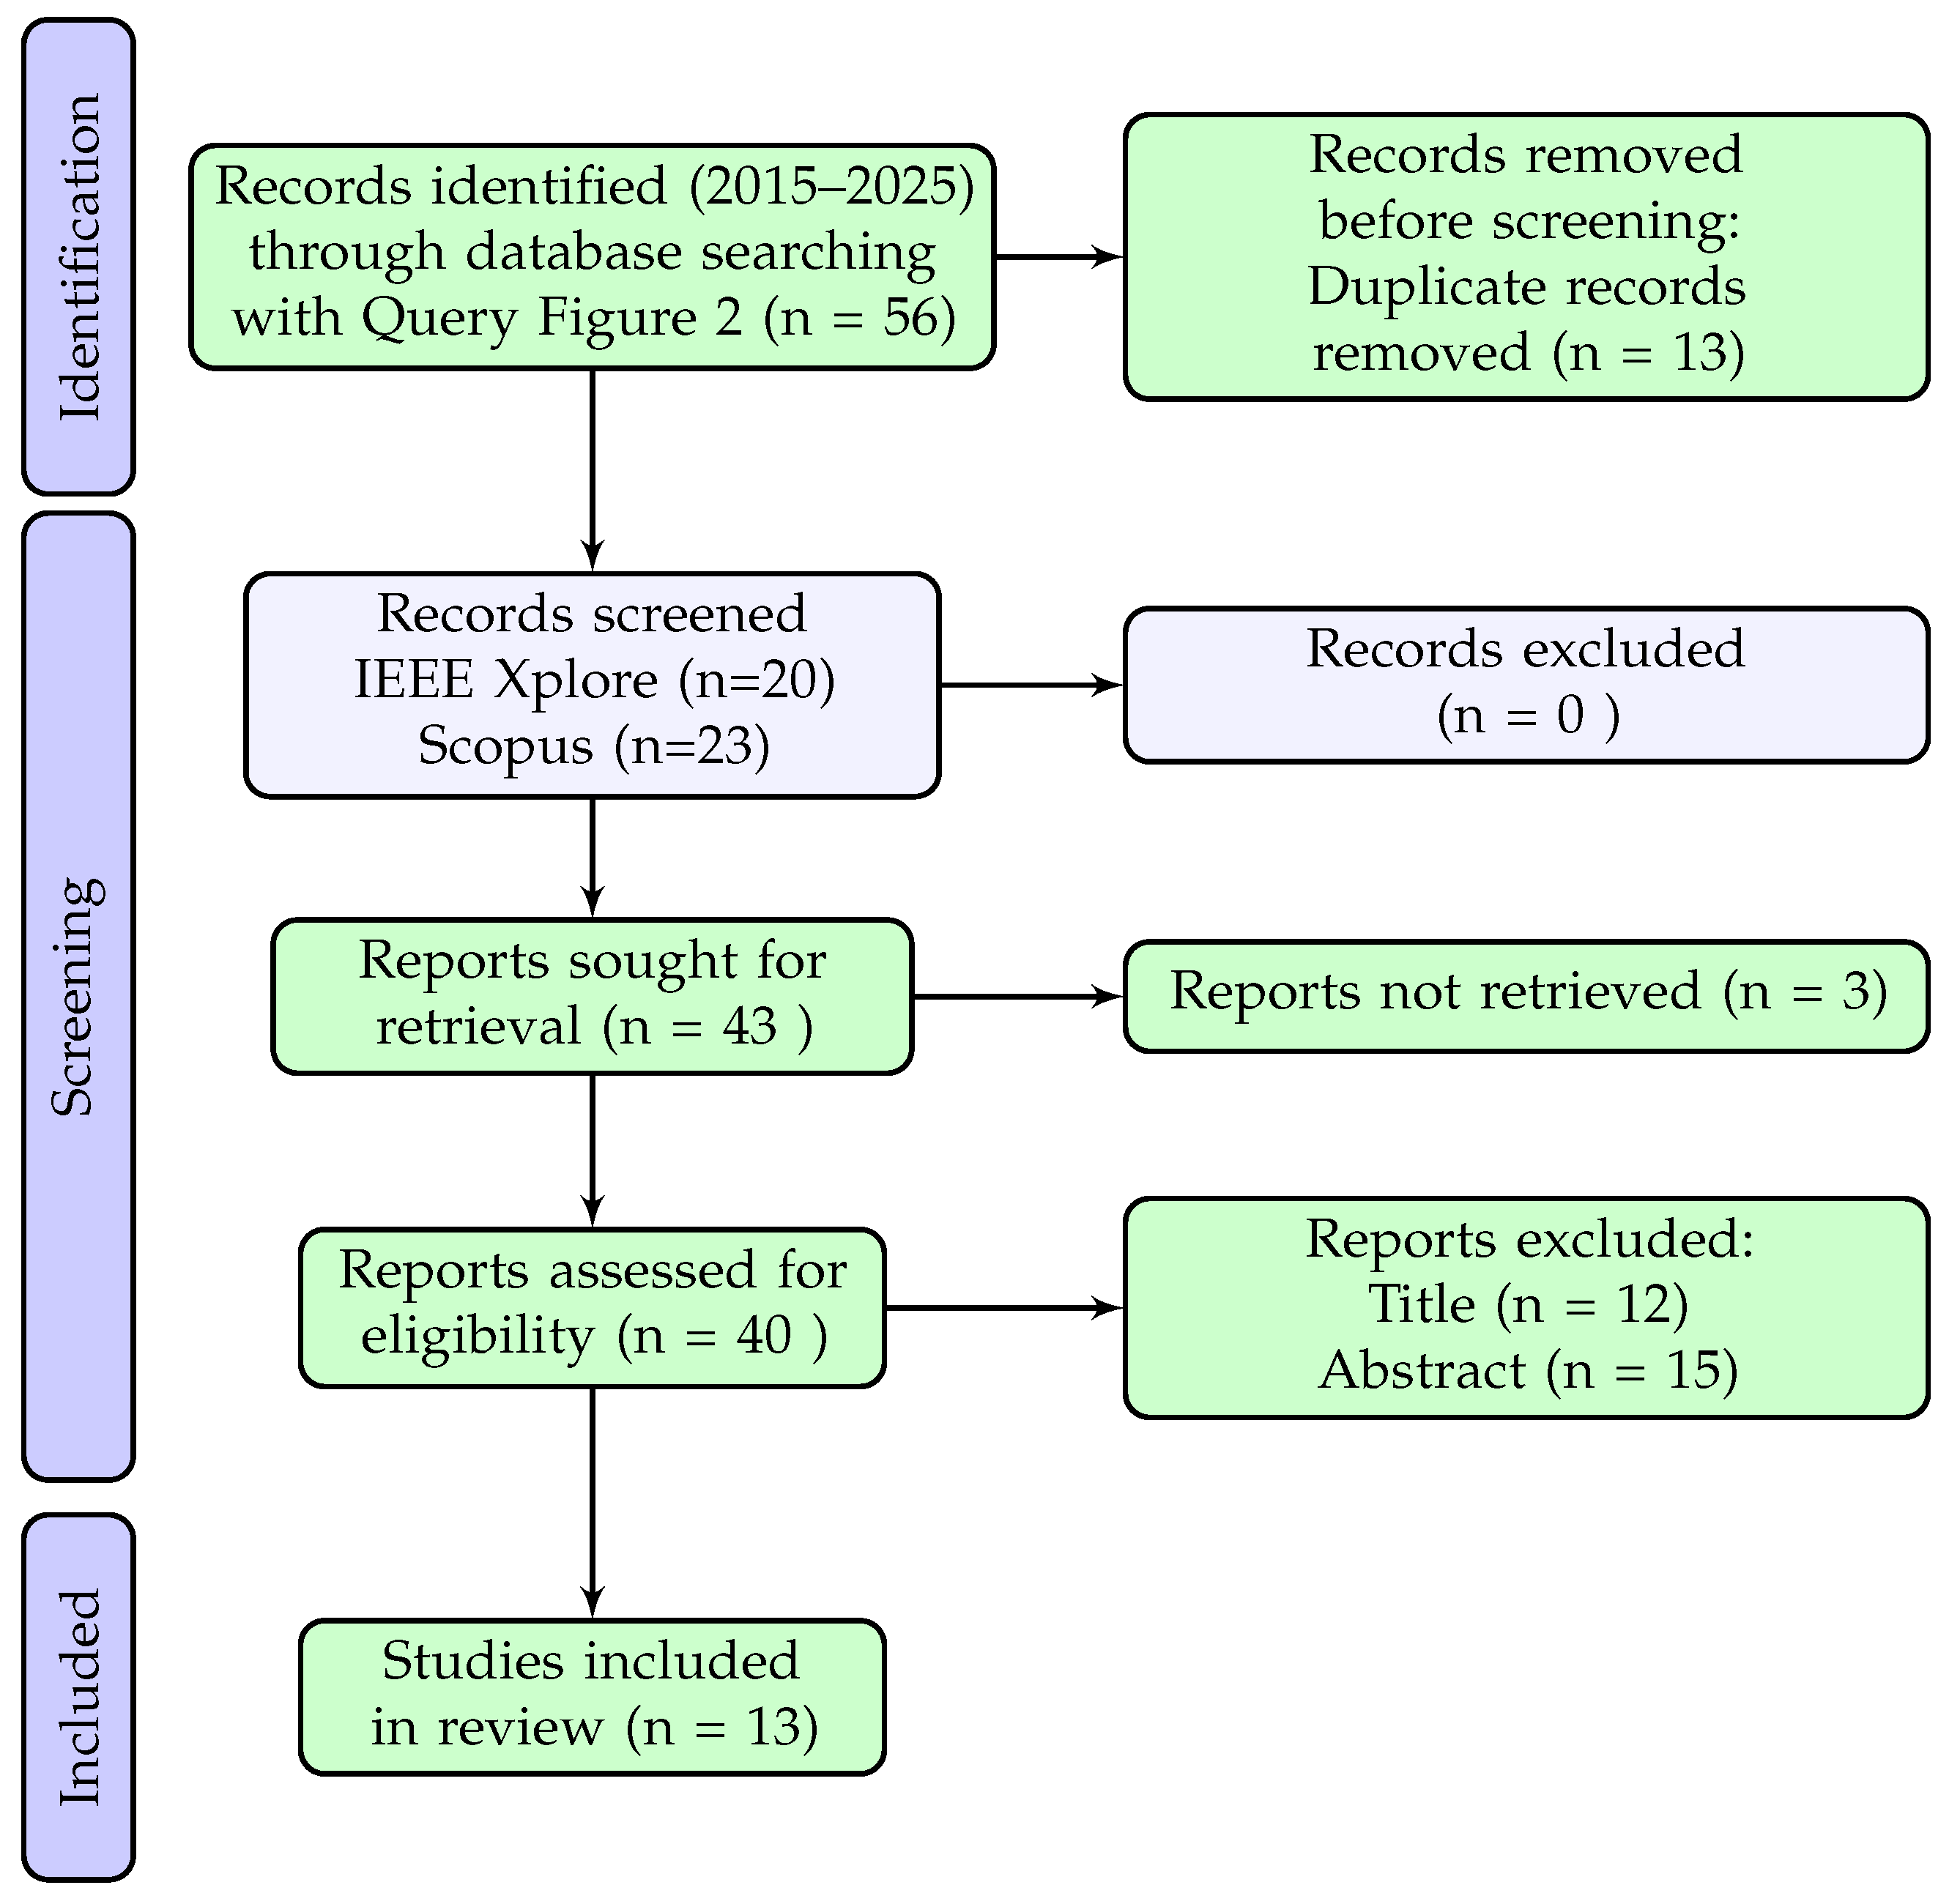
Figure 2. This returned 56 records (20 from IEEE Xplore and 36 from Scopus). After removing 13 duplicates, 43 records were screened. Of these, 3 could not be retrieved due to access limitations (SPIE publications), while 12 were excluded by title and 15 by abstract. The final contribution of this additional search was 13 spectroscopy-focused articles. To ensure a transparent and reproducible article selection process, the PRISMA framework was applied to both search strategies. The first query (Q1) was designed to broadly capture studies involving pest-detection technologies across computer vision, spectroscopy, and sensor-based systems. The second query (Q2) targeted spectral imaging techniques more specifically to reinforce coverage in that category.
The following two PRISMA diagrams (
Figure 3 and
Figure 4) summarize the identification, screening, and inclusion stages for each query. The same inclusion and exclusion criteria were applied consistently to both searches, and the outcomes are shown independently to highlight the contribution of each query to the final article pool.
As shown in
Figure 3 and
Figure 4, the primary query (Q1) contributed a total of 165 unique articles, while the additional spectral-focused query (Q2) contributed 13 more. In both processes, duplicate records were removed prior to screening, and the same eligibility criteria were applied at the title and abstract levels. These criteria included the exclusion of studies on plant diseases unrelated to pest activity, non-edible or industrial crops, and non-implementable or inaccessible approaches.
Together, these searches yielded a combined total of 178 articles for technical evaluation. This merged dataset provided the foundation for the subsequent scoring and categorization by technological approach.
2.3.1. Screening Procedure
The screening process was conducted in two stages (title and abstract), applying the same inclusion and exclusion criteria. Two independent reviewers participated in this process, both of whom are co-authors of this study. Disagreements regarding eligibility were discussed and resolved by consensus, ensuring the consistent application of the criteria across all records.
This dual-review strategy was employed to enhance the reliability and objectivity of the selection process, particularly in borderline cases where the article relevance was not immediately clear from the titles or abstracts.
2.3.2. Inter-Rater Agreement (Weighted Cohen’s )
To quantify inter-reviewer reliability during screening and subsequent ordinal assessments, we used weighted Cohen’s
on five-level scales (1–5). In Cohen’s formulation, the weighted version assigns smaller penalties to near disagreements and yields a chance-corrected proportion of a weighted agreement [
18]. We report both the linearly and quadratically weighted
, considering the quadratic version as the primary estimator for ordered categories.
Two independent comparisons were run to reflect complementary expertise: (i) the Primary Author (PA) vs. Author 1 in spectroscopy and sensors and (ii) the PA vs. Author 2 in imaging (AI). An agreement was computed per domain and per rating dimension.
Items within each domain were matched primarily by article title + domain. The five-category scale was retained even if some categories were unused in a subset.
Let
O be the observed agreement matrix (normalized to proportions) and
E the chance-expected matrix from the product of the marginals. For a
k-level ordinal scale (
here) with weights
on cell
, the estimator is
with linear and quadratic disagreement weights
Following common practice for ordered categories, we treat quadratically weighted
as the primary reliability index and linearly weighted
as a sensitivity analysis [
18].
A representative divergence occurred in the imaging (AI) category regarding the Pest-PVT study by Chen et al. [
20], specifically on the cost axis. The Primary Author (PA) assigned a high score, reasoning that the architecture’s compact profile (24.74M parameters, 7.82 GFLOPs) suggested efficient inference compatible with a range of embedded platforms, even in the absence of explicit FPS metrics. The PA interpreted the reported Jetson TX2 deployment not as a strict minimum requirement, but as a representative embedded-class target, and inferred practical feasibility from the model’s reported complexity. In contrast, Author 2 applied a stricter reading, treating the TX2 as the baseline hardware assumption and discounting the score due to its relatively high cost in low-resource settings. The disagreement reflects distinct, but valid, interpretations of deployment framing: one emphasizing architectural efficiency and inferred generalizability, and the other prioritizing concrete evidence and direct affordability.
2.4. Article Categorization Framework
Given the diversity of technological approaches identified during the screening phase, the selected articles were first organized into three primary thematic categories based on their sensing modality and core technological principle:
Imaging-based systems: Studies focused on the application of algorithm-based machine learning or deep learning algorithms to visual data (e.g., RGB images, UAV footage) for pest detection.
Spectroscopy-based techniques: Articles employing spectral imaging methods such as near-infrared (NIR), hyperspectral, FTIR, or Raman spectroscopy to infer pest presence via biochemical or physiological indicators.
Sensor-based systems: Works describing the use of physical, chemical, or environmental sensors (e.g., gas sensors, VOC detectors, electronic noses) to capture indirect or non-visual indicators of pest activity. A few AI-heavy studies with a strong embedded component, where the primary focus is hardware/software integration, also fall under this category.
This thematic division was guided by both conceptual and practical considerations. Conceptually, these three categories represent distinct mechanisms of sensing. From an implementation perspective, they also differ significantly in terms of hardware integration, data acquisition workflows, and real-time processing feasibility, factors that are especially relevant in the context of embedded system deployment.
To ensure consistent classification, each article was analyzed based on its methodological description, focusing on the primary technology implemented rather than on keywords or title references. Articles with overlapping elements were assigned to the category most representative of their core sensing approach.
2.4.1. Subcategorization Within Imaging-Based Studies
Due to the large number of articles in this group and their architectural diversity, a dedicated subcategorization scheme was applied to further refine the analysis. This technical classification grouped imaging-based studies into five subcategories based on the neural network architecture or computational model reported:
CNN-based: Traditional convolutional neural networks used for image classification or object detection (e.g., AlexNet, VGG, ResNet).
Hybrid CNN: Architectures combining CNNs with other mechanisms such as attention modules, recurrent units, or transformer-based components.
YOLO-based: Studies implementing the you only look once (YOLO) family of models, often associated with practical deployments using PyTorch (.pt) formats.
Transformer-based: Models employing Vision Transformer (ViT), Swin Transformer, or other self-attention-based frameworks for visual recognition tasks.
Other methods: Approaches that did not fit any of the above categories, including non-standard or hybrid AI techniques.
This sub-classification enabled a more targeted evaluation of the architectural trade-offs, such as the computational requirements, training complexity, and deployment feasibility in constrained environments. It also allowed for a better comparison among solutions that share similar underlying principles, thereby enhancing the robustness of the analysis. To keep the comparative analysis tractable and technically consistent, within each AI subcategory, we restricted the comparison to the five most-cited papers (based on the citation count available at the time of retrieval). This decision responds to the size of the corpus, the strongly contextual nature of the performance criterion in PCI, and the need to preserve consistency and traceability in the scoring. The citation counts offer a reproducible proxy for influence, but may favour older or highly visible venues; this potential bias is acknowledged. All papers in the selected subset were evaluated using the same PCI rubric; studies outside this subset were not analyzed, and their omission should not be construed as a negative quality judgment.
To assess the practical relevance of the reviewed studies for deployment in embedded agricultural systems, a structured evaluation model was developed based on three key dimensions: performance (P), cost (C), and implementability (I). These three axes form the PCI framework, designed to go beyond accuracy-focused comparisons and capture the technological maturity and field-readiness of each system.
Performance (P) refers to the system’s reported effectiveness in detecting pests or pest-related indicators. It encompasses the accuracy, sensitivity, or qualitative success as described by the authors.
Cost (C) captures the economic burden associated with implementing the technology, based on hardware, instrumentation, and computational resources.
Implementability (I) evaluates the feasibility of deploying the system in realistic agricultural scenarios, considering the robustness, portability, and compatibility with embedded or portable platforms.
Although PCI offers a unified evaluation structure, its application was adapted to reflect the specific nature of each technological domain, as detailed below. In all cases, implementability refers to the feasibility of deployment under real conditions; in imaging-based studies, this is proxied by factors such as real/semi-real validation and lightweight architectures, while in sensor and spectroscopy systems, it emphasizes robustness, calibration stability, and environmental tolerance.
2.4.2. Adaptation of PCI to Imaging (AI)-Based Studies
Imaging (AI)-based approaches, primarily involving deep learning models, differ significantly from hardware systems in that their cost and complexity are largely tied to training and architecture design rather than physical implementation. The PCI dimensions were therefore interpreted as follows:
Performance (P) was assessed using quantitative metrics reported by the authors, such as the classification accuracy, mean average precision (mAP), F1-score, recall, or precision. Object detection models were generally rated higher than classification-only models due to their greater operational relevance.
Cost (C) focused on the computational requirements for inference. This included the type of hardware needed to deploy the model (e.g., microcontrollers, mobile devices, GPUs, TPUs). Training costs were excluded from consideration.
Implementability (I) evaluated the feasibility of deployment under agricultural conditions, proxied in imaging studies by validation under realistic or semi-realistic settings (e.g., variable lighting, UAV imagery, real crop environments) rather than curated laboratory datasets. Lightweight architectures and field testing contributed positively to this score.
To reflect these priorities, the PCI dimensions for imaging (AI)-based studies were weighted as follows:
The chosen weights reflect how imaging-based studies are typically reported: performance dominates the available evidence, whereas implementability is often only partially demonstrated (e.g., proof of concept in field-like settings).
2.4.3. Adaptation of PCI to Sensor- and Spectroscopy-Based Studies
For studies based on physical sensors and spectroscopic devices, the PCI model was applied with the following interpretations:
Performance (P) evaluated the reported detection capabilities of the system, based on quantitative metrics (e.g., limit of detection, sensitivity, specificity) or qualitative success as described in trials. Whether the data were synthetic or collected in-field, the reported values were accepted at face value.
Cost (C) accounted for the estimated economic cost of the required hardware, including sensors, spectrometers, or other measurement instruments. Systems with complex, laboratory-dependent instrumentation were rated lower in this dimension.
Implementability (I) assessed the environmental and practical constraints involved in deploying the system. For example, a device requiring strict thermal stability or long warm-up periods was rated lower than a robust, low-maintenance system suitable for open-field conditions.
To reflect the differences between sensors and spectroscopic systems in terms of their complexity and inherent cost, distinct weighting schemes were applied:
Sensor-based systems: P: 0.33, C: 0.33, I: 0.33.
(Uniform weighting; used as baseline due to balanced technical and practical nature.)
Spectroscopy-based systems: P: 0.40, C: 0.20, I: 0.40.
(Cost was de-emphasized due to the intrinsically higher expense of these techniques; performance and feasibility were prioritized.)
These weighting choices reflect the different evidence profiles of the two domains. Sensor-based systems were assigned uniform weights (0.33/0.33/0.33) because the published works have typically balanced raw detection performance, component cost, and deployment feasibility in a similar proportion. In contrast, spectroscopy studies often report strong detection capabilities, but face recurring challenges in calibration stability, portability, and environmental robustness; therefore, implementability (0.40) was given equal importance to performance (0.40), while cost (0.20) was de-emphasized to account for the intrinsically higher baseline expense of spectroscopic instruments.
2.4.4. Scoring and Normalization Strategy
All articles were scored on each PCI dimension using a discrete scale from 1 (lowest) to 5 (highest), resulting in an unweighted total score ranging from 3 to 15. These raw values reflect the internal merit of each system within its respective technological category.
To facilitate a comparison across domains with differing technical foundations, each score was subsequently normalized using the weighting schemes described above. This produced a weighted PCI score on a 1-to-5 scale, emphasizing deployment-oriented priorities specific to each category.
Formally, for each article, the final weighted score is given by the following:
where
denote the category-specific weights (see
Section 2.4.1,
Section 2.4.2 and
Section 2.4.3), which sum to 1. The resulting normalized PCI scores form the basis for the comparative evaluation in
Section 3, enabling a balanced assessment across heterogeneous technologies while preserving their intrinsic differences.
5. Conclusions
This review reframes pest detection for edible crops around a modality-aware performance–cost–implementability (PCI) lens. Rather than asking which single algorithm or instrument is “best”, we evaluated whether vision/AI, spectroscopy, or indirect sensor systems are fit for purpose under real deployment constraints (power/compute envelopes, acquisition and calibration routines, enclosure/robustness, backhaul and fleet operations, and O&M cadence). Using category-specific PCI weights (
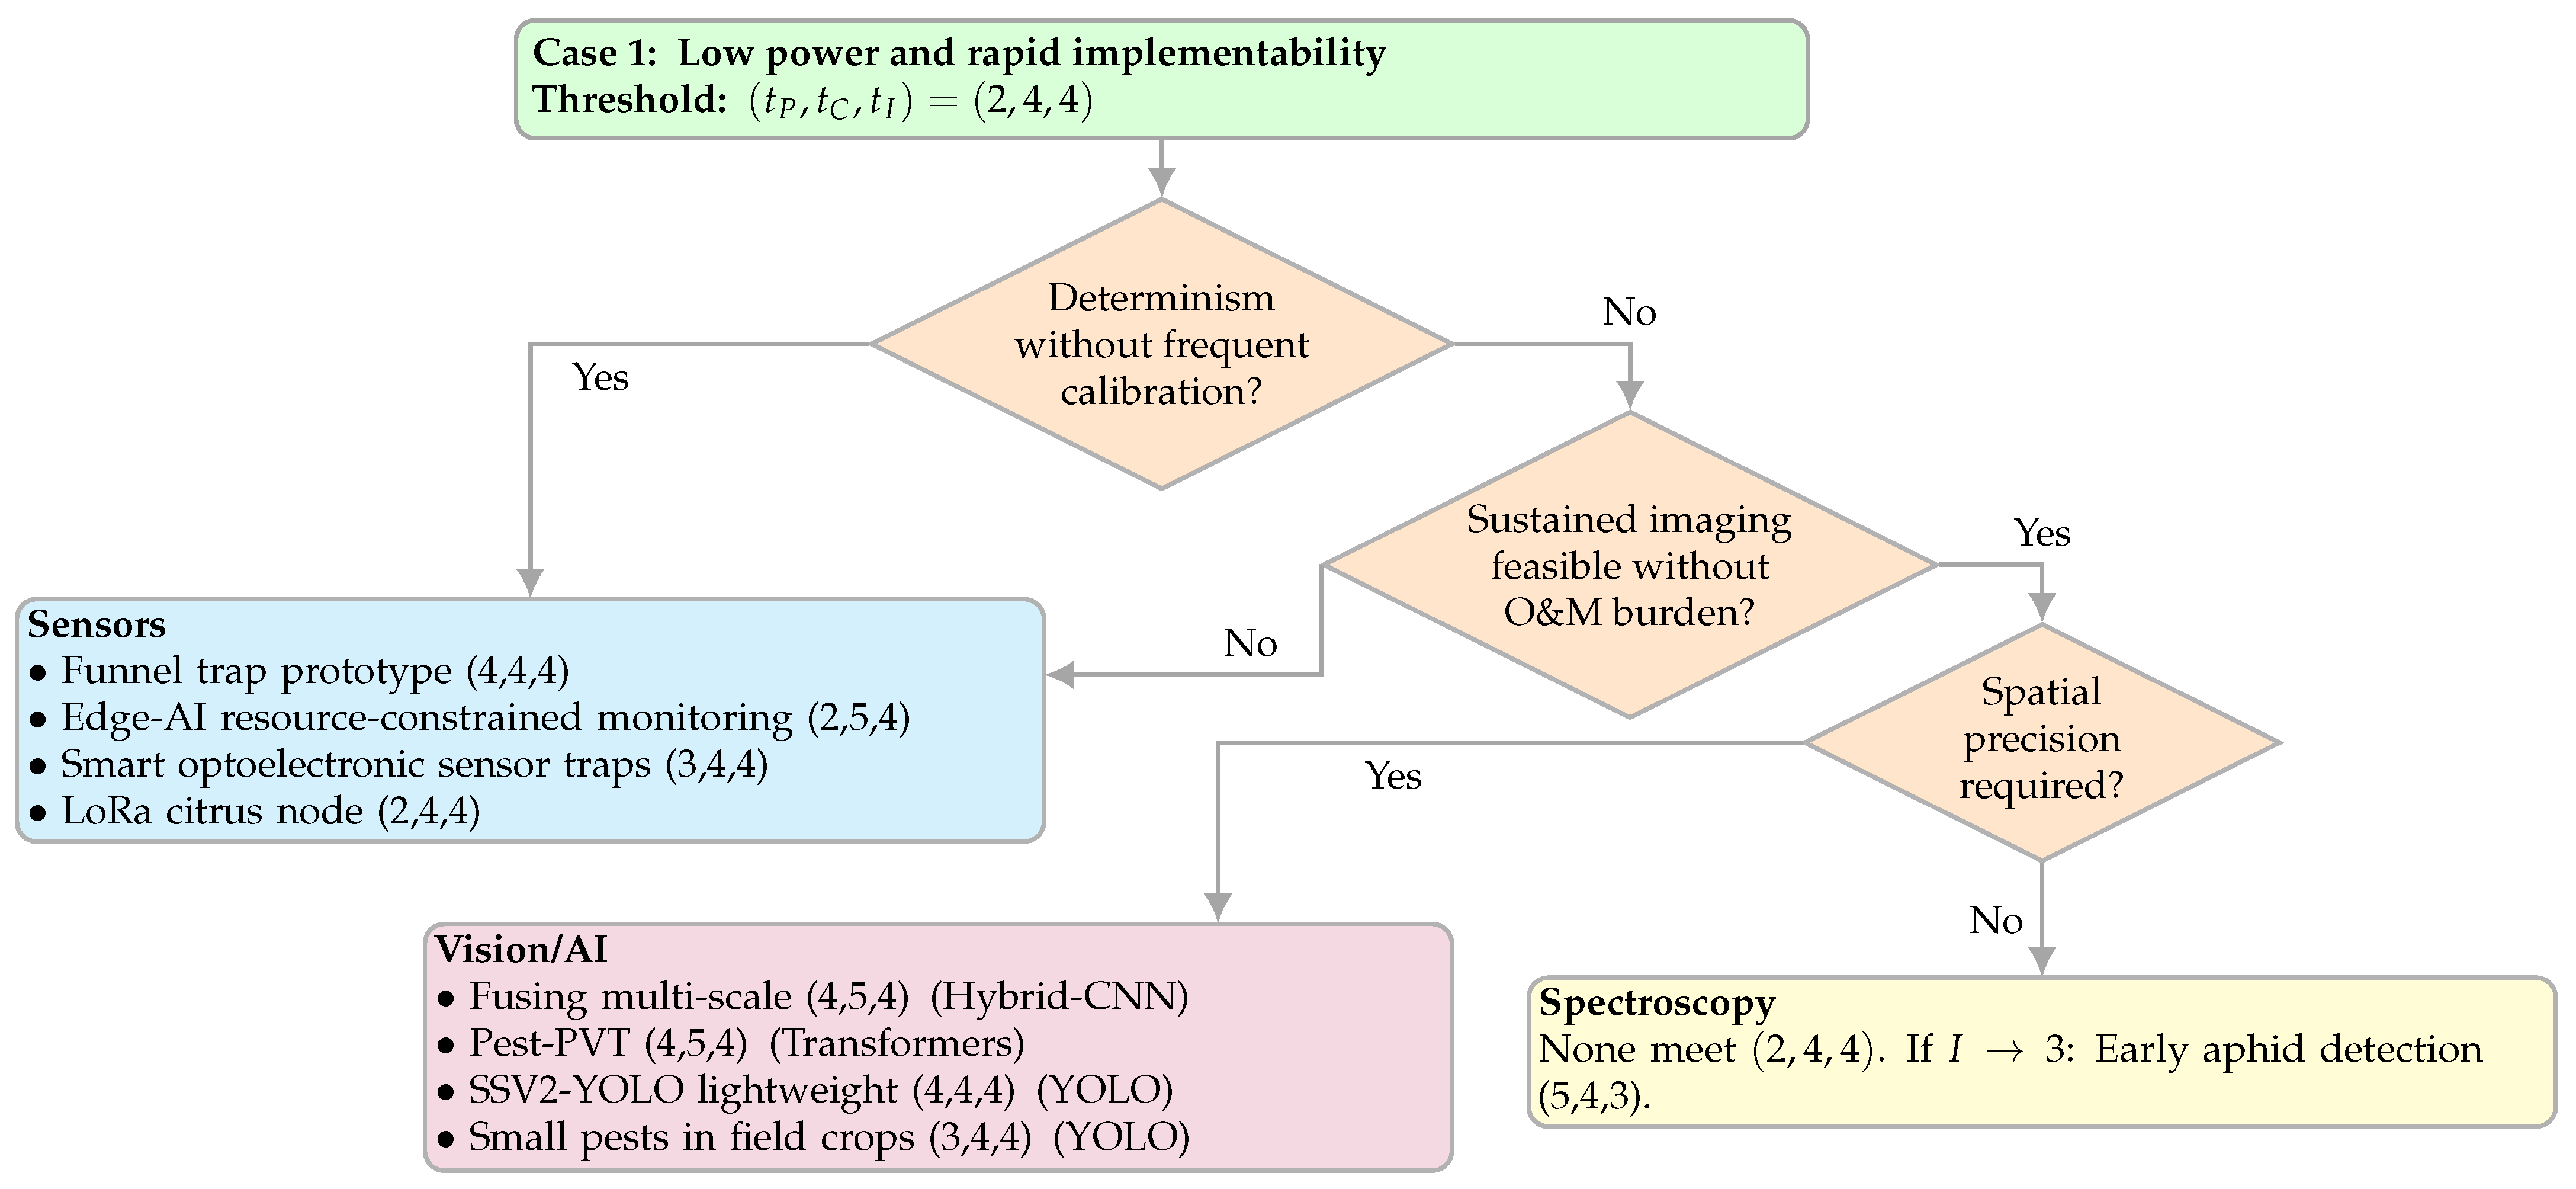
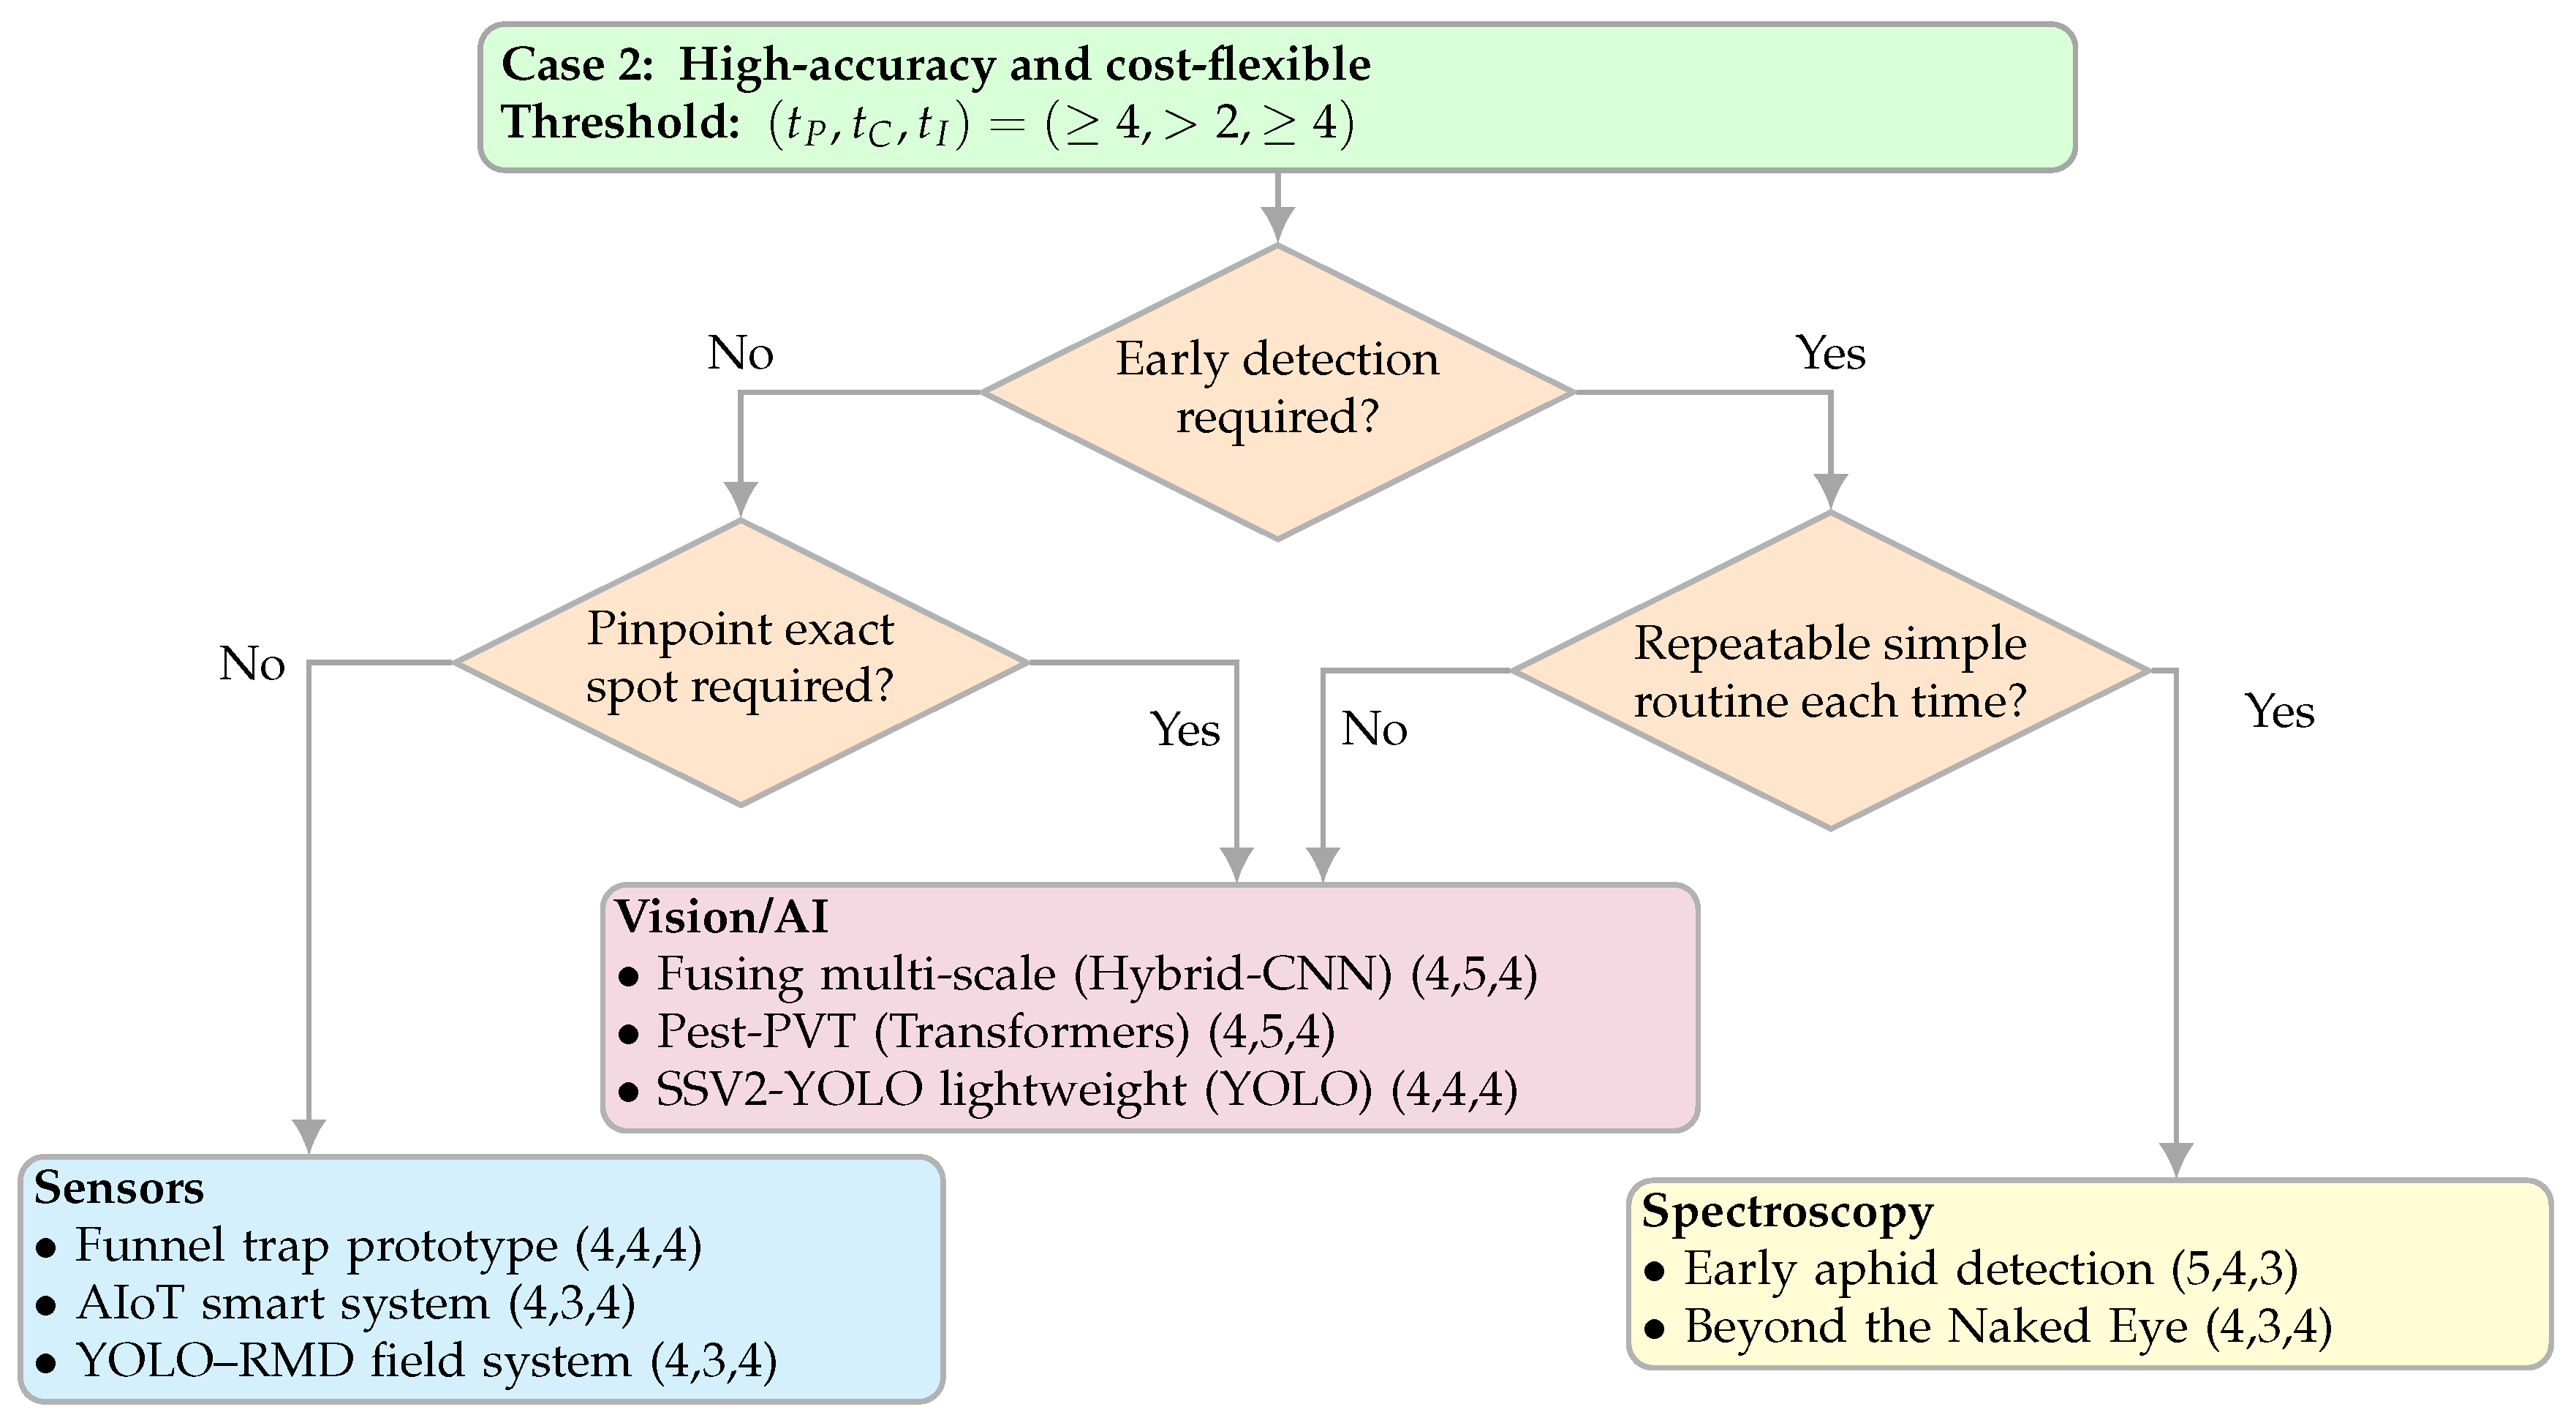
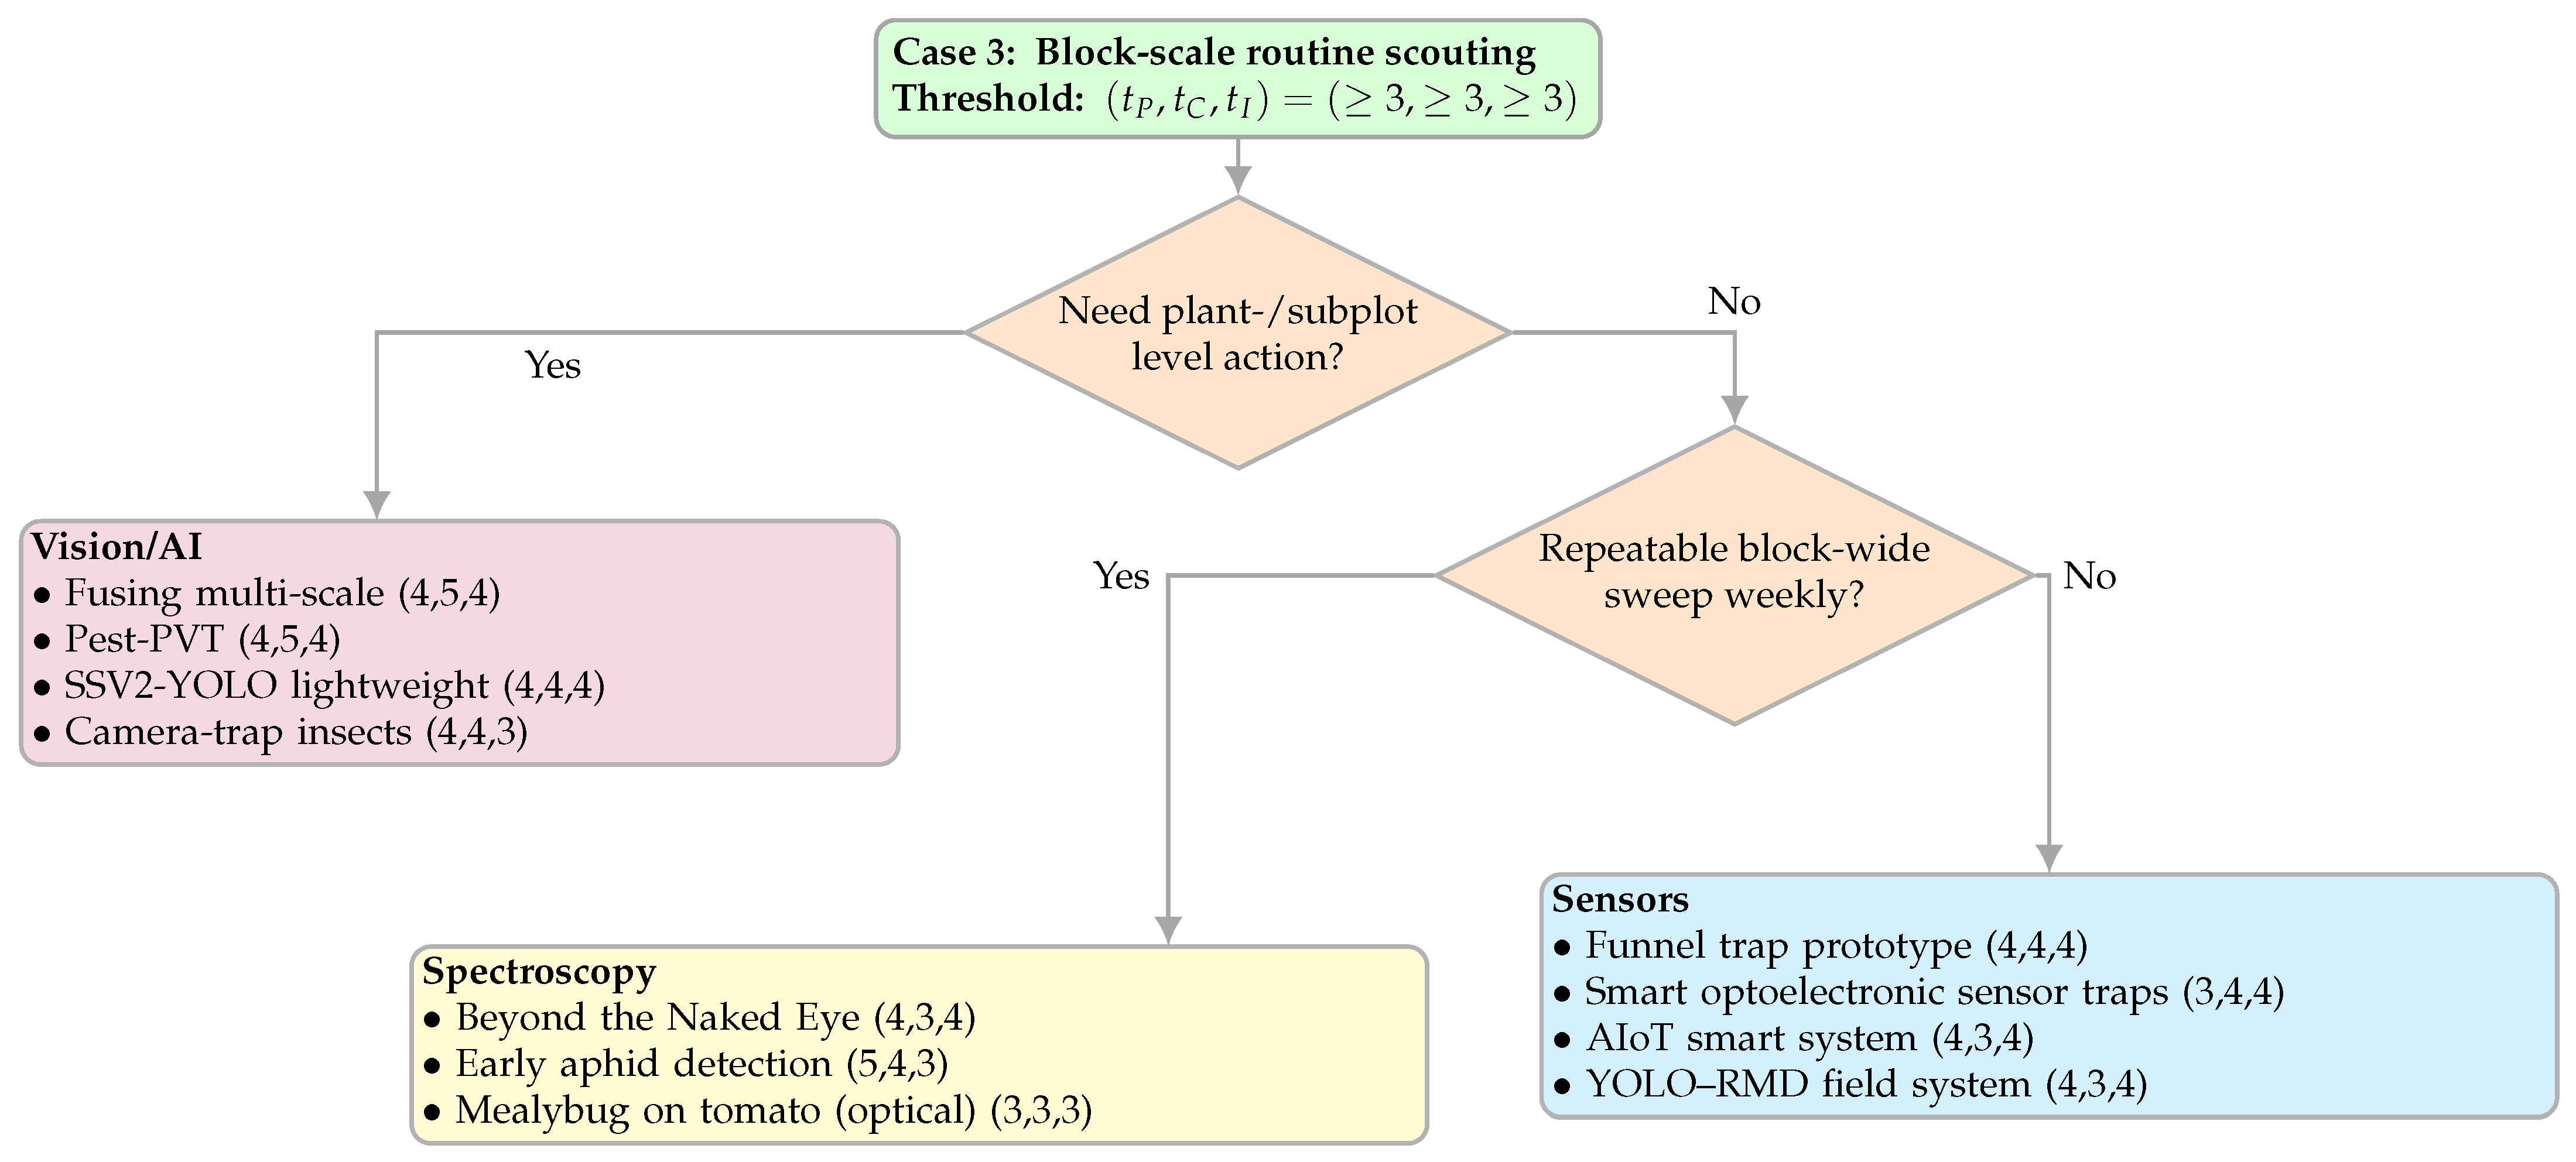
Section 2.4.1), we synthesized 2015–2025 evidence into compact decision maps (
Section 4.3) intended for implementation choices in the field.
Three consistent signals emerged. First, under our weighting policy, imaging (AI) and well-engineered sensor systems more frequently achieved deployment-leaning profiles, with a median (IQR) PCI of 3.20 [2.60–3.60] and 3.17 [2.75–3.67], respectively, compared with 2.60 [2.40–3.10] for spectroscopy (
Table 5,
Figure 5). Roughly one-third of the AI (32.0%) and sensor works (33.33%) exceeded a practical-readiness threshold (
), versus 18.18% for spectroscopy. Second, the Pareto views clarified the trade-offs: detectors and attention-based models near
, sensor nodes spanning balanced
or ultra-lean
philosophies, and spectroscopy split between early-detection strength
and portability
. Third, when translated into decisions, low-power, rapid-deployment scenarios (Case 1) typically favoured sensors or lightweight detectors; high-accuracy, cost-flexible programs (Case 2) favoured spectroscopy for pre-symptomatic cues if a simple, repeatable routine was feasible, or vision/AI when pinpointing is required; and block-scale routine scouting (Case 3) routed to a single modality per operational prompt.
The inter-reviewer reliability supported the robustness of these synthesis steps. For the Primary Author (PA) vs. Author 1, the quadratically weighted Cohen’s
was substantial to very high across domains and dimensions (
Table 6). Most disagreements were adjacent on the five-point scales, which is the pattern expected when a shared rubric is applied consistently. For the PA vs. Author 2, the agreement was modest and limited to imaging/AI (
Table 7;
), with
–
. Disagreements were primarily adjacent in cost and implementability, whereas performance showed occasional non-adjacent differences. This profile indicates a coherent rubric with room for minor calibration (for example, metric anchoring for performance and mapping hardware classes for cost). Because the PA vs. Author 2 covers only one domain, these estimates are not directly comparable to the PA vs. Author 1.
Practically, we recommend that future studies across modalities report a minimum PCI metadata set: (i) inference hardware class and Wh/day; (ii) acquisition and calibration routine (illumination control, references, warm-up); (iii) enclosure/IP and optics maintenance; (iv) backhaul, duty-cycling, synchronization, and OTA; (v) O&M cadence and minutes/visit; (vi) action granularity (leaf/plant/subplot/block); (vii) evidence setting and domain shift; and (viii) BOM/cost class. Adopting this minimum set will make cross-study comparisons reproducible and deployment-oriented, rather than accuracy-only. Together, the weighted PCI scores, decision maps, and reporting checklist offer a deployment-oriented approach that supports modality selection under real-world constraints, enabling practitioners to identify acceptable systems without relying solely on accuracy.
This work has limitations. The PCI weights reflect our deployment-centric stance; spectroscopy’s mid-range PCI does not negate its value for early, non-visible cues, but highlights integration frictions under field variability. Our AI sub-sampling by citations is pragmatic and may have under-represented recent deployable designs. The reported metrics were accepted at face value. Nonetheless, the convergence of distributional results, Pareto structure, decision maps, and substantial inter-rater agreement gives confidence in the main conclusions.
Looking ahead, we see four priorities: (i) A community risk-of-bias instrument tailored to ML and sensing for agriculture. (ii) Prospective, multi-season field trials that expand the evidence base for tuple selections and refine the binary questions in our decision maps. In our framework, most terms reflect implementability and real-world constraints such as power, labour, and connectivity, but temporal factors (e.g., seasonal variability, calibration drift, and the annotation burden across crop cycles) are not yet systematically captured. Multi-season trials would therefore provide the missing longitudinal evidence needed to translate PCI scoring into deployment guidance. (iii) Uncertainty-aware, on-device inference for actionable thresholds. (iv) Living PCI templates and decision maps that update as modalities and embedded platforms evolve. For practitioners, the takeaway is straightforward: select the sensing modality that matches your power, labour, connectivity, and action-granularity constraints—PCI and the provided maps translate published evidence into field-ready choices, accelerating the time to deployment beyond accuracy-only benchmarks.


