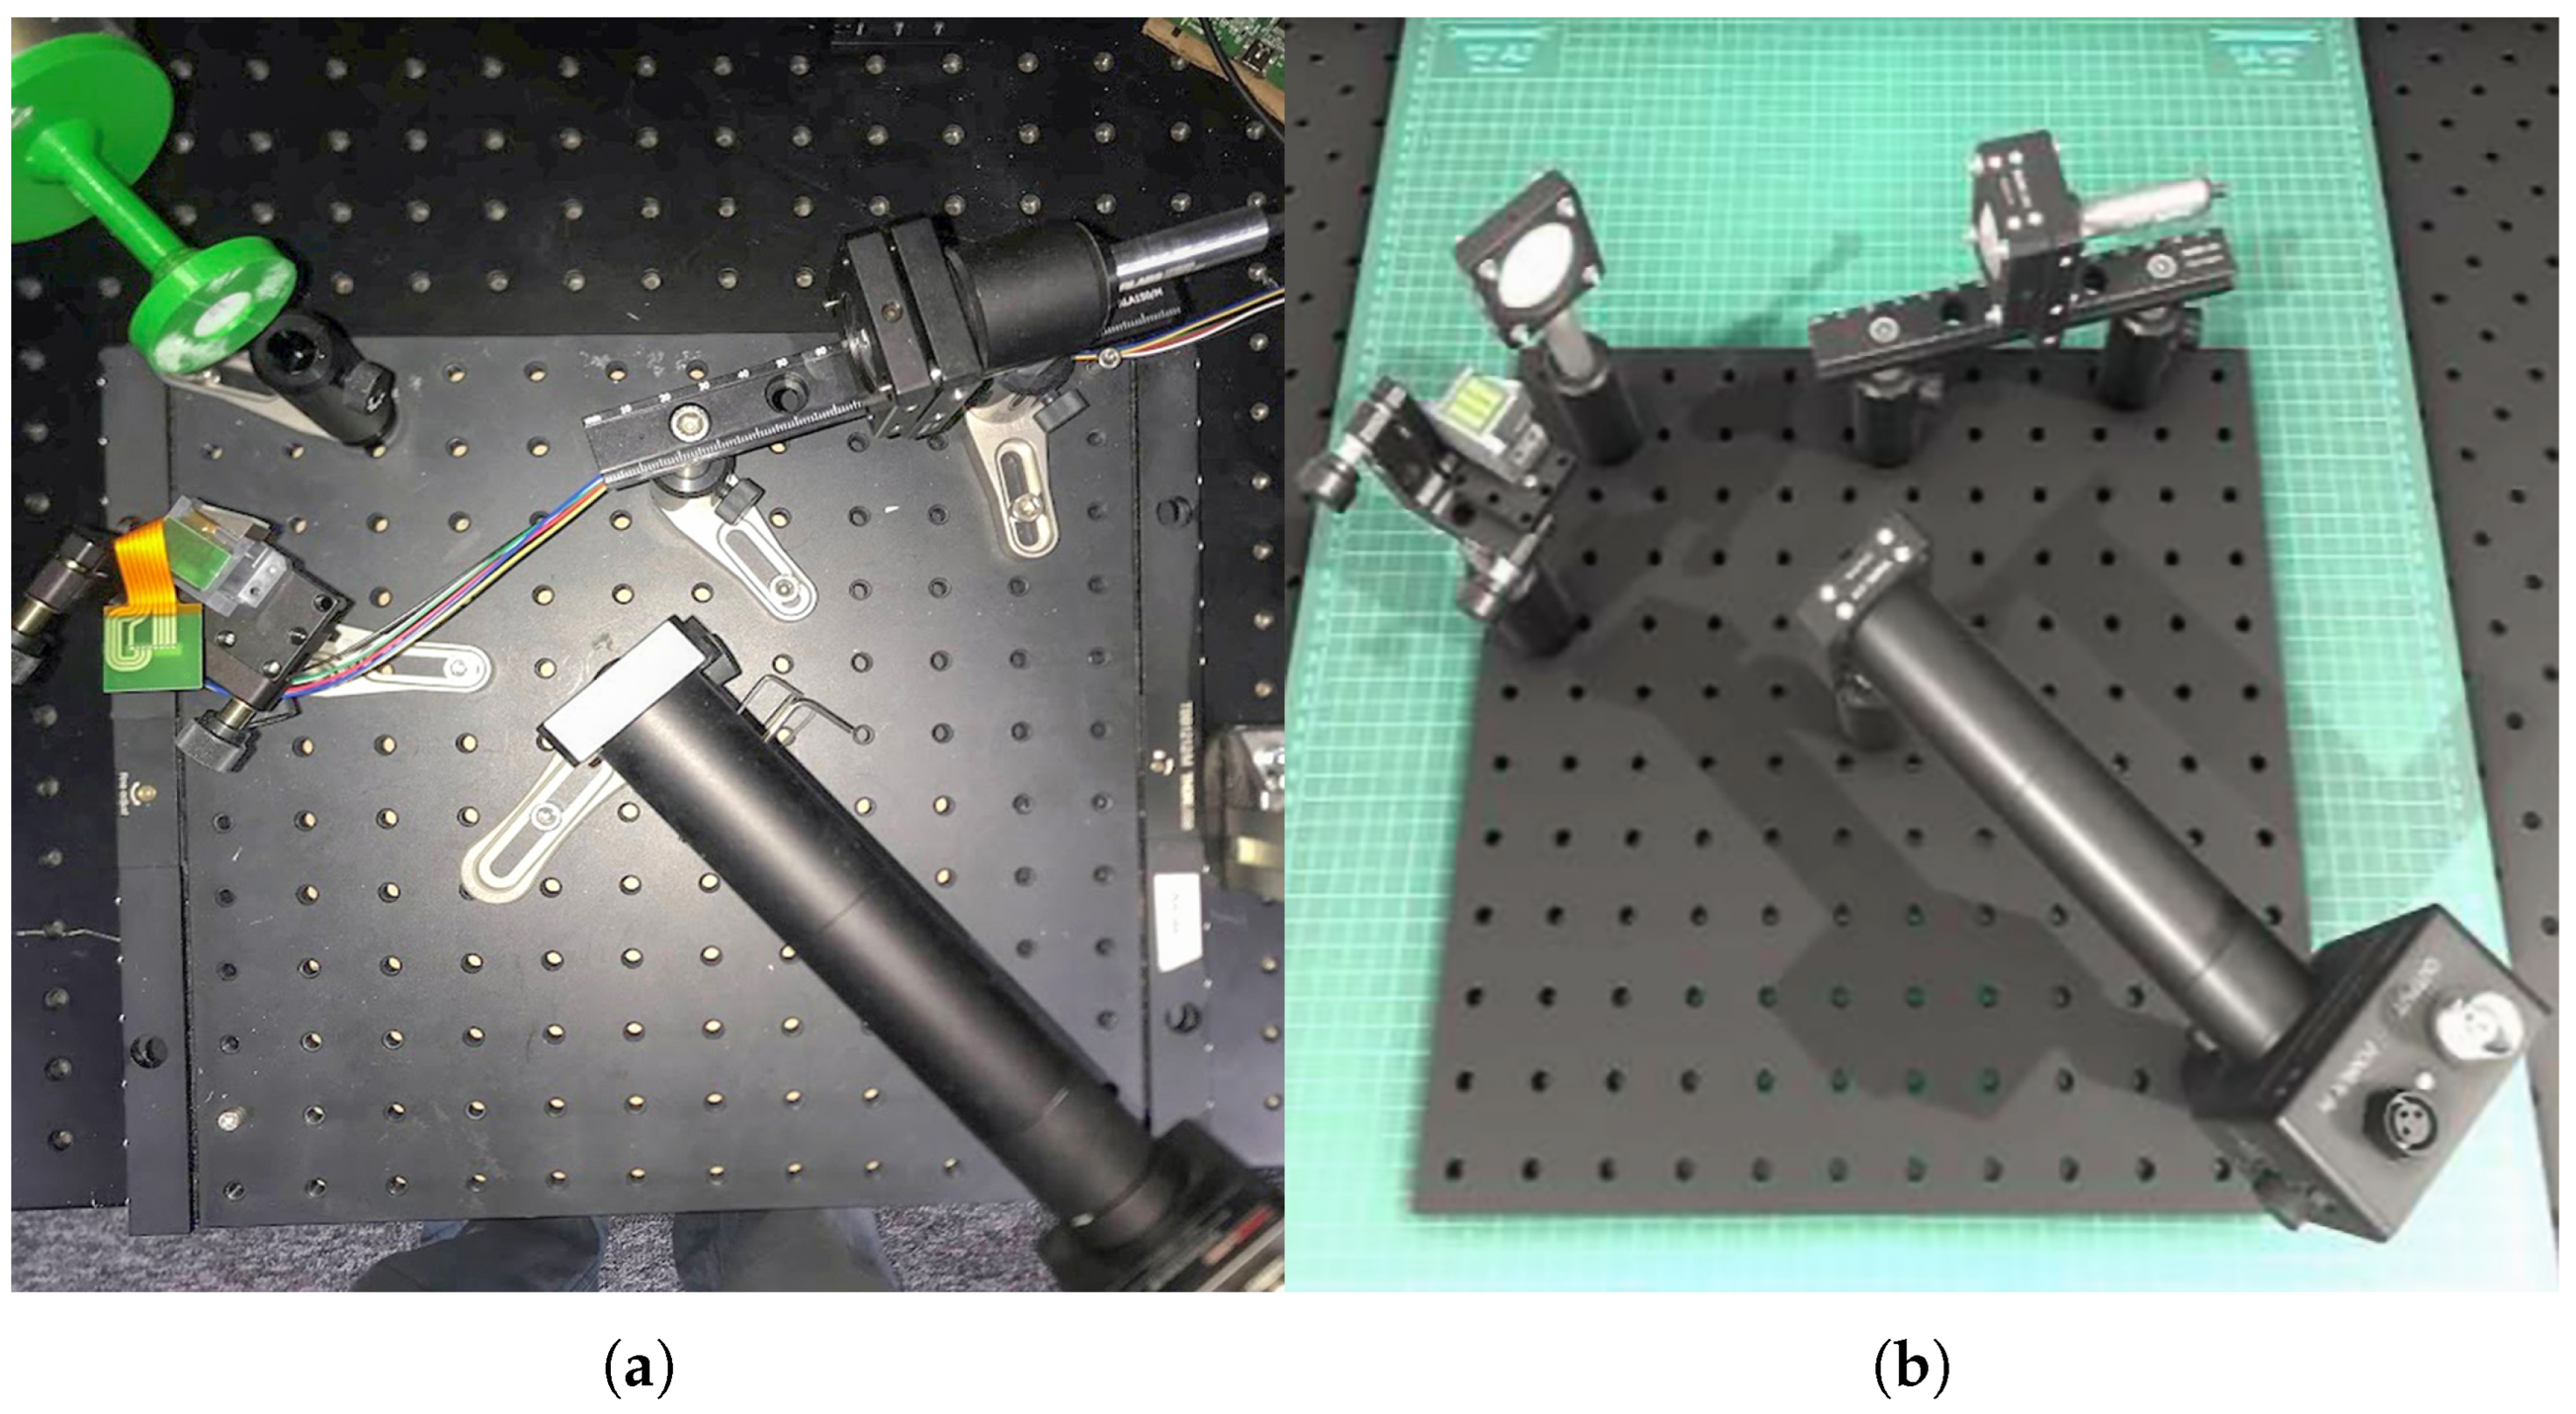
The proposed methods for estimating pupil position [
32] based on the use of small data sets and the possibility of processing them using controllers with relatively low computing power involved the use of MEMS micromirrors. From a hardware perspective, these methods are based on so-called “sparse” data acquisition, which means that the minimum amount of data (measurement points from the scanned surface) is collected to enable the algorithms to function correctly. The main problem with verifying the proposed pupil position estimation methods was obtaining data to validate the developed algorithmic solutions.
2.2. The High-Fidelity Digital Twin
Part of this study included the development of a digital twin of the physical measurement station. The Unity 3D engine (version 2020.3.20f1) with its High Definition Render Pipeline (HDRP) was selected as the base simulation platform. This choice was motivated by its robust support for Physically Based Rendering (PBR), which is essential for accurate light–material interaction simulation, and its extensive C# scripting API, which allowed for seamless integration of our custom control and data acquisition logic. Furthermore, its well-documented architecture facilitated the future integration of machine learning frameworks for real-time data analysis.
All optical and mechanical components were modeled in SolidWorks 2014 with 0.01 mm precision, based on CAD files provided by the manufacturers. Their virtual surfaces were described with appropriate materials and shaders estimating their appearance and real-life parameters, including surface color, color of reflected and scattered light, textures and their modifications, transparency, light refraction index, etc. [
36]. The virtual setup mirrored the physical one, with component positions initially set according to the design and subsequently fine-tuned based on initial calibration measurements.
Furthermore, a 3D model of a scan of a real male head by Digital Reality Lab, a company specializing in photogrammetric human scans, was implemented into the created environment. The scanned head and neck covered a skin surface area of 146 thousand mm
2 but was manually reduced to 51,272 vertices. The average diagonal of the grid vertices of the model is 25 µm. The imported model was overlaid with 5 textures, responsible for color, reflectivity, convexity, occlusion, and the direction of the normal vector under which the light will be reflected. Each of these textures had a resolution of 8192 × 8192 and a depth of 48 bits. Additional 3D models of eyebrows and eyelashes for each eye were added. The eyebrow model consisted of 108 thousand surfaces, creating approximately 2630 hairs in each eyebrow. The teeth, in turn, consisted of 10,735 surfaces, and 135 hairs for a single eye (88 above the eye, 47 below). The digital twin setup is shown in
Figure 1b.
2.3. Validation Protocol
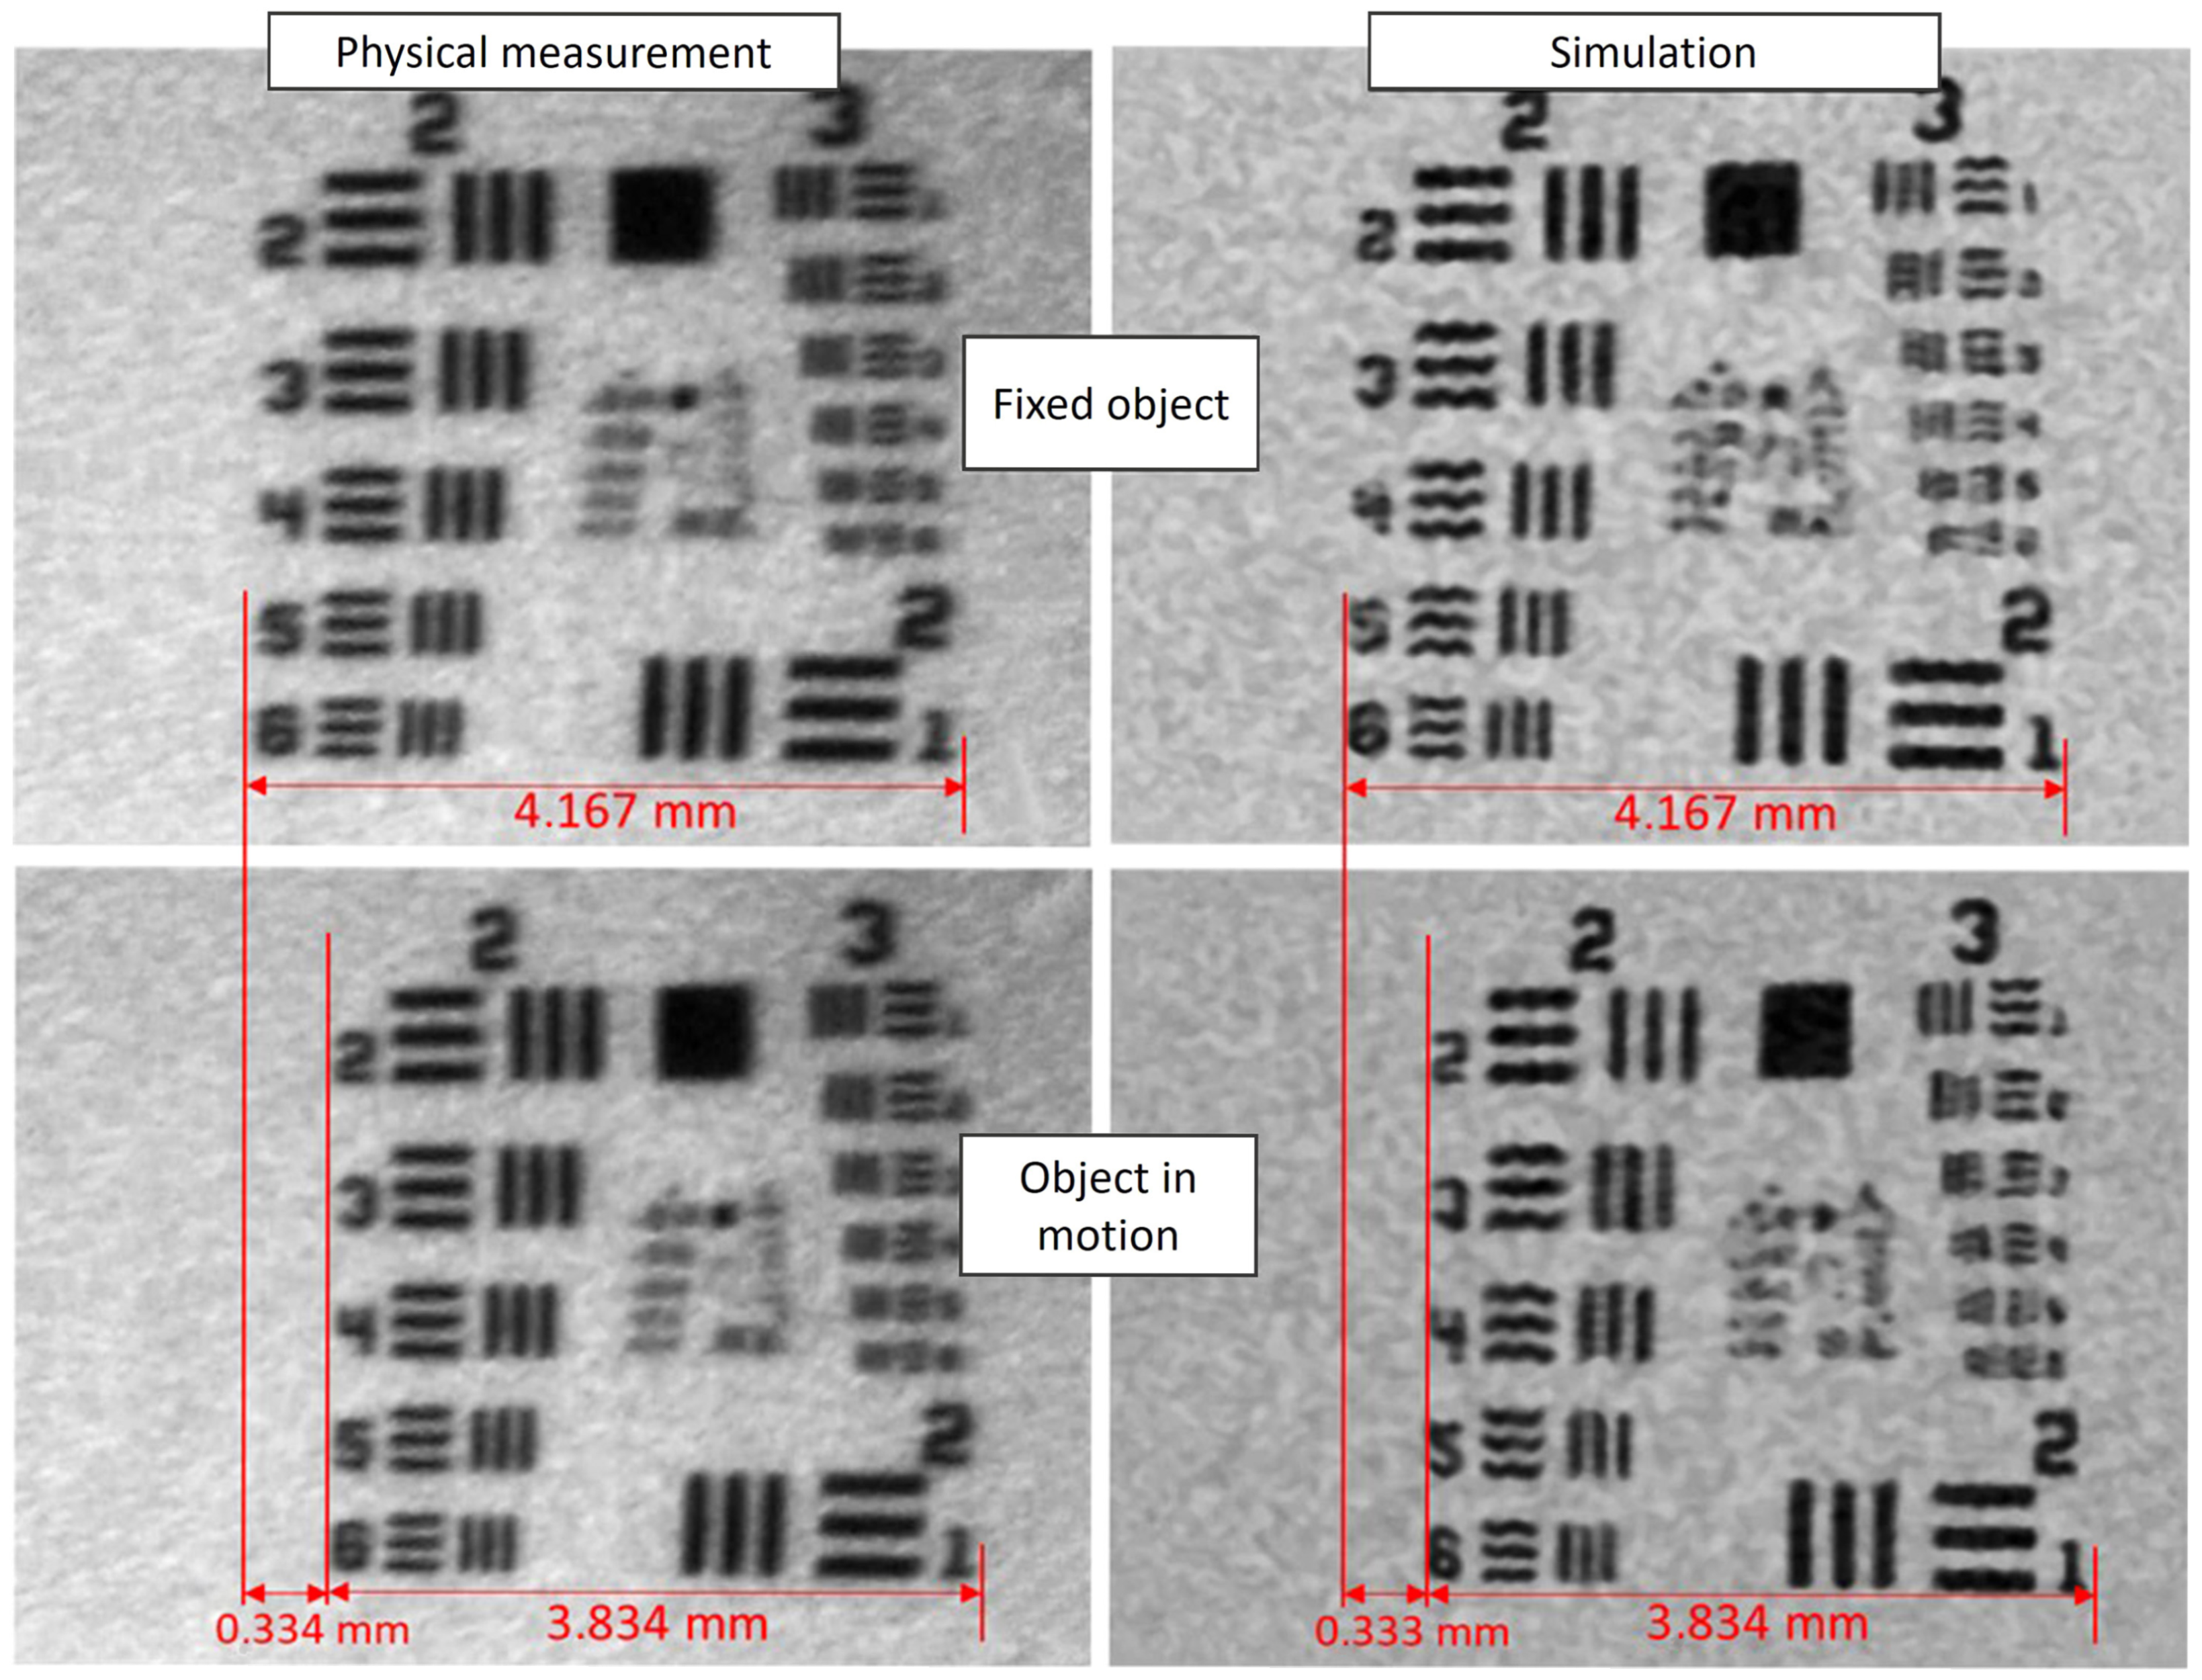
To establish whether the in silico simulations are a valid alternative to physical measurements, a comprehensive validation protocol was developed. The protocol focuses on a direct comparison of data acquired from both the physical system and its DT. The USAF 1951 resolution test chart was used as the standardized measurement object due to its well-defined geometric patterns. The validation was performed under two distinct conditions:
- 1.
Static Conditions: The test chart was held stationary, allowing for a baseline assessment of the system’s geometric and radiometric accuracy in resolving fine details down to 10 µm.
- 2.
Dynamic Conditions: The test chart was mounted on a robotic arm moving at a constant velocity of 150 mm/s to simulate rapid eye movements (saccades). This test evaluated the system’s ability to maintain tracking accuracy under dynamic stress.
In both scenarios, the MEMS performed a dense scan of the target, and the resulting data was compared against data from the identical scenario simulated within the DT.
Although the considered methods of estimating the pupil of the eye are based on “sparse” data (from the surface of the object under study), it was decided to use a dense data set to validate the data obtained from the physical and virtual test stations, which enabled (using the same algorithm) the synthesis of images based on both physical and in silico data. This solution offered the opportunity for a much more accurate verification of similarities and possible differences between data sources (and thus discrepancies in the functioning of the physical system and its DT).
From a measurement and algorithmic point of view (for pupil position estimation methods), the position of rare measurement points is more important than their absolute intensity. For this reason, the proposed data validation draws on image analysis solutions, focusing more on geometric differences while being less sensitive to non-geometric differences (such as noise, blurring, or contrast changes).
In searching for good methods and indicators for validating synthesized data sets, attention was paid to both general-purpose metrics and more targeted techniques, i.e., solutions that are more sensitive to changes in geometry. Among the geometry-sensitive solutions with greater resistance to photometric changes, the following were analyzed: Phase Correlation (good for estimating translation between two images based on the Fourier Transform, with low sensitivity to changes in intensity and noise), Normalized Cross-Correlation of Edge Maps (good for comparing spatial structure based on calculated edge maps, with low sensitivity to changes in contrast and intensity), Deformation Fields (good for detecting local geometric distortions by determining dense displacement vector fields), and Keypoint-Based Geometric Matching (good for detecting global geometric transformations such as translation, rotation, scale, and perspective, thanks to the use of detectors such as ORB and the estimation of homography to describe geometric transformations while maintaining low sensitivity to noise, contrast, and, to some extent, blur).
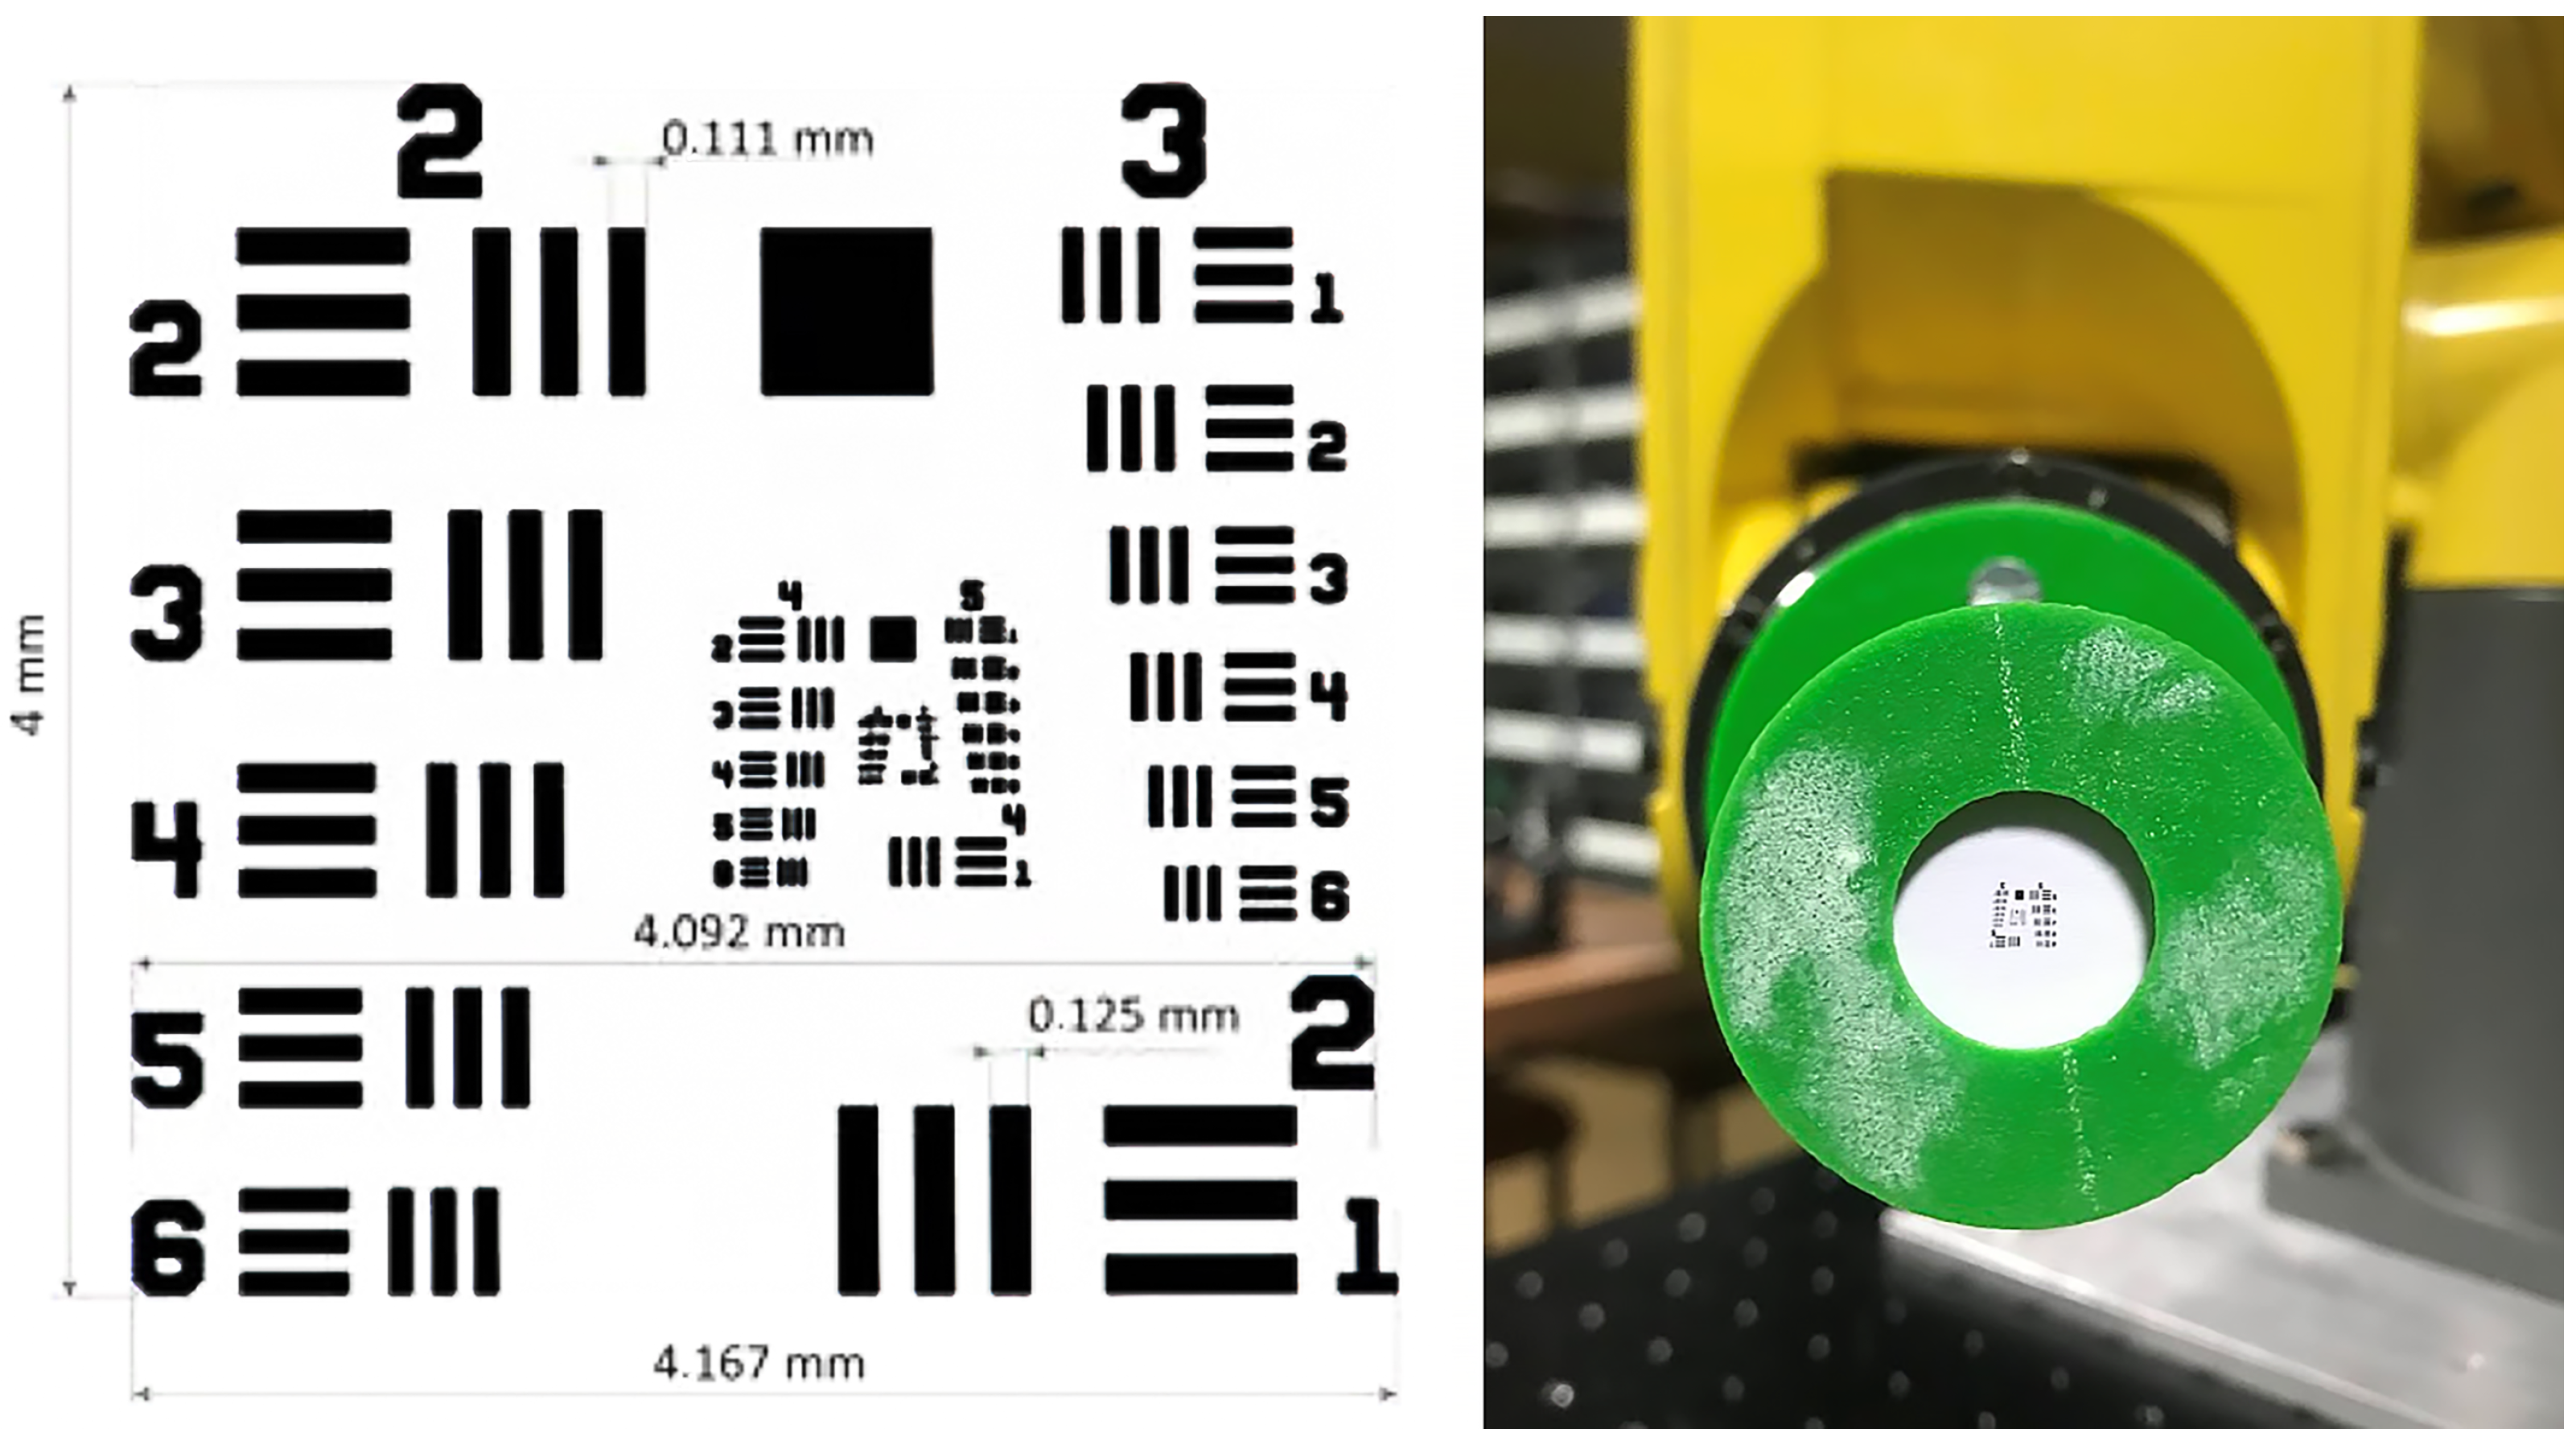
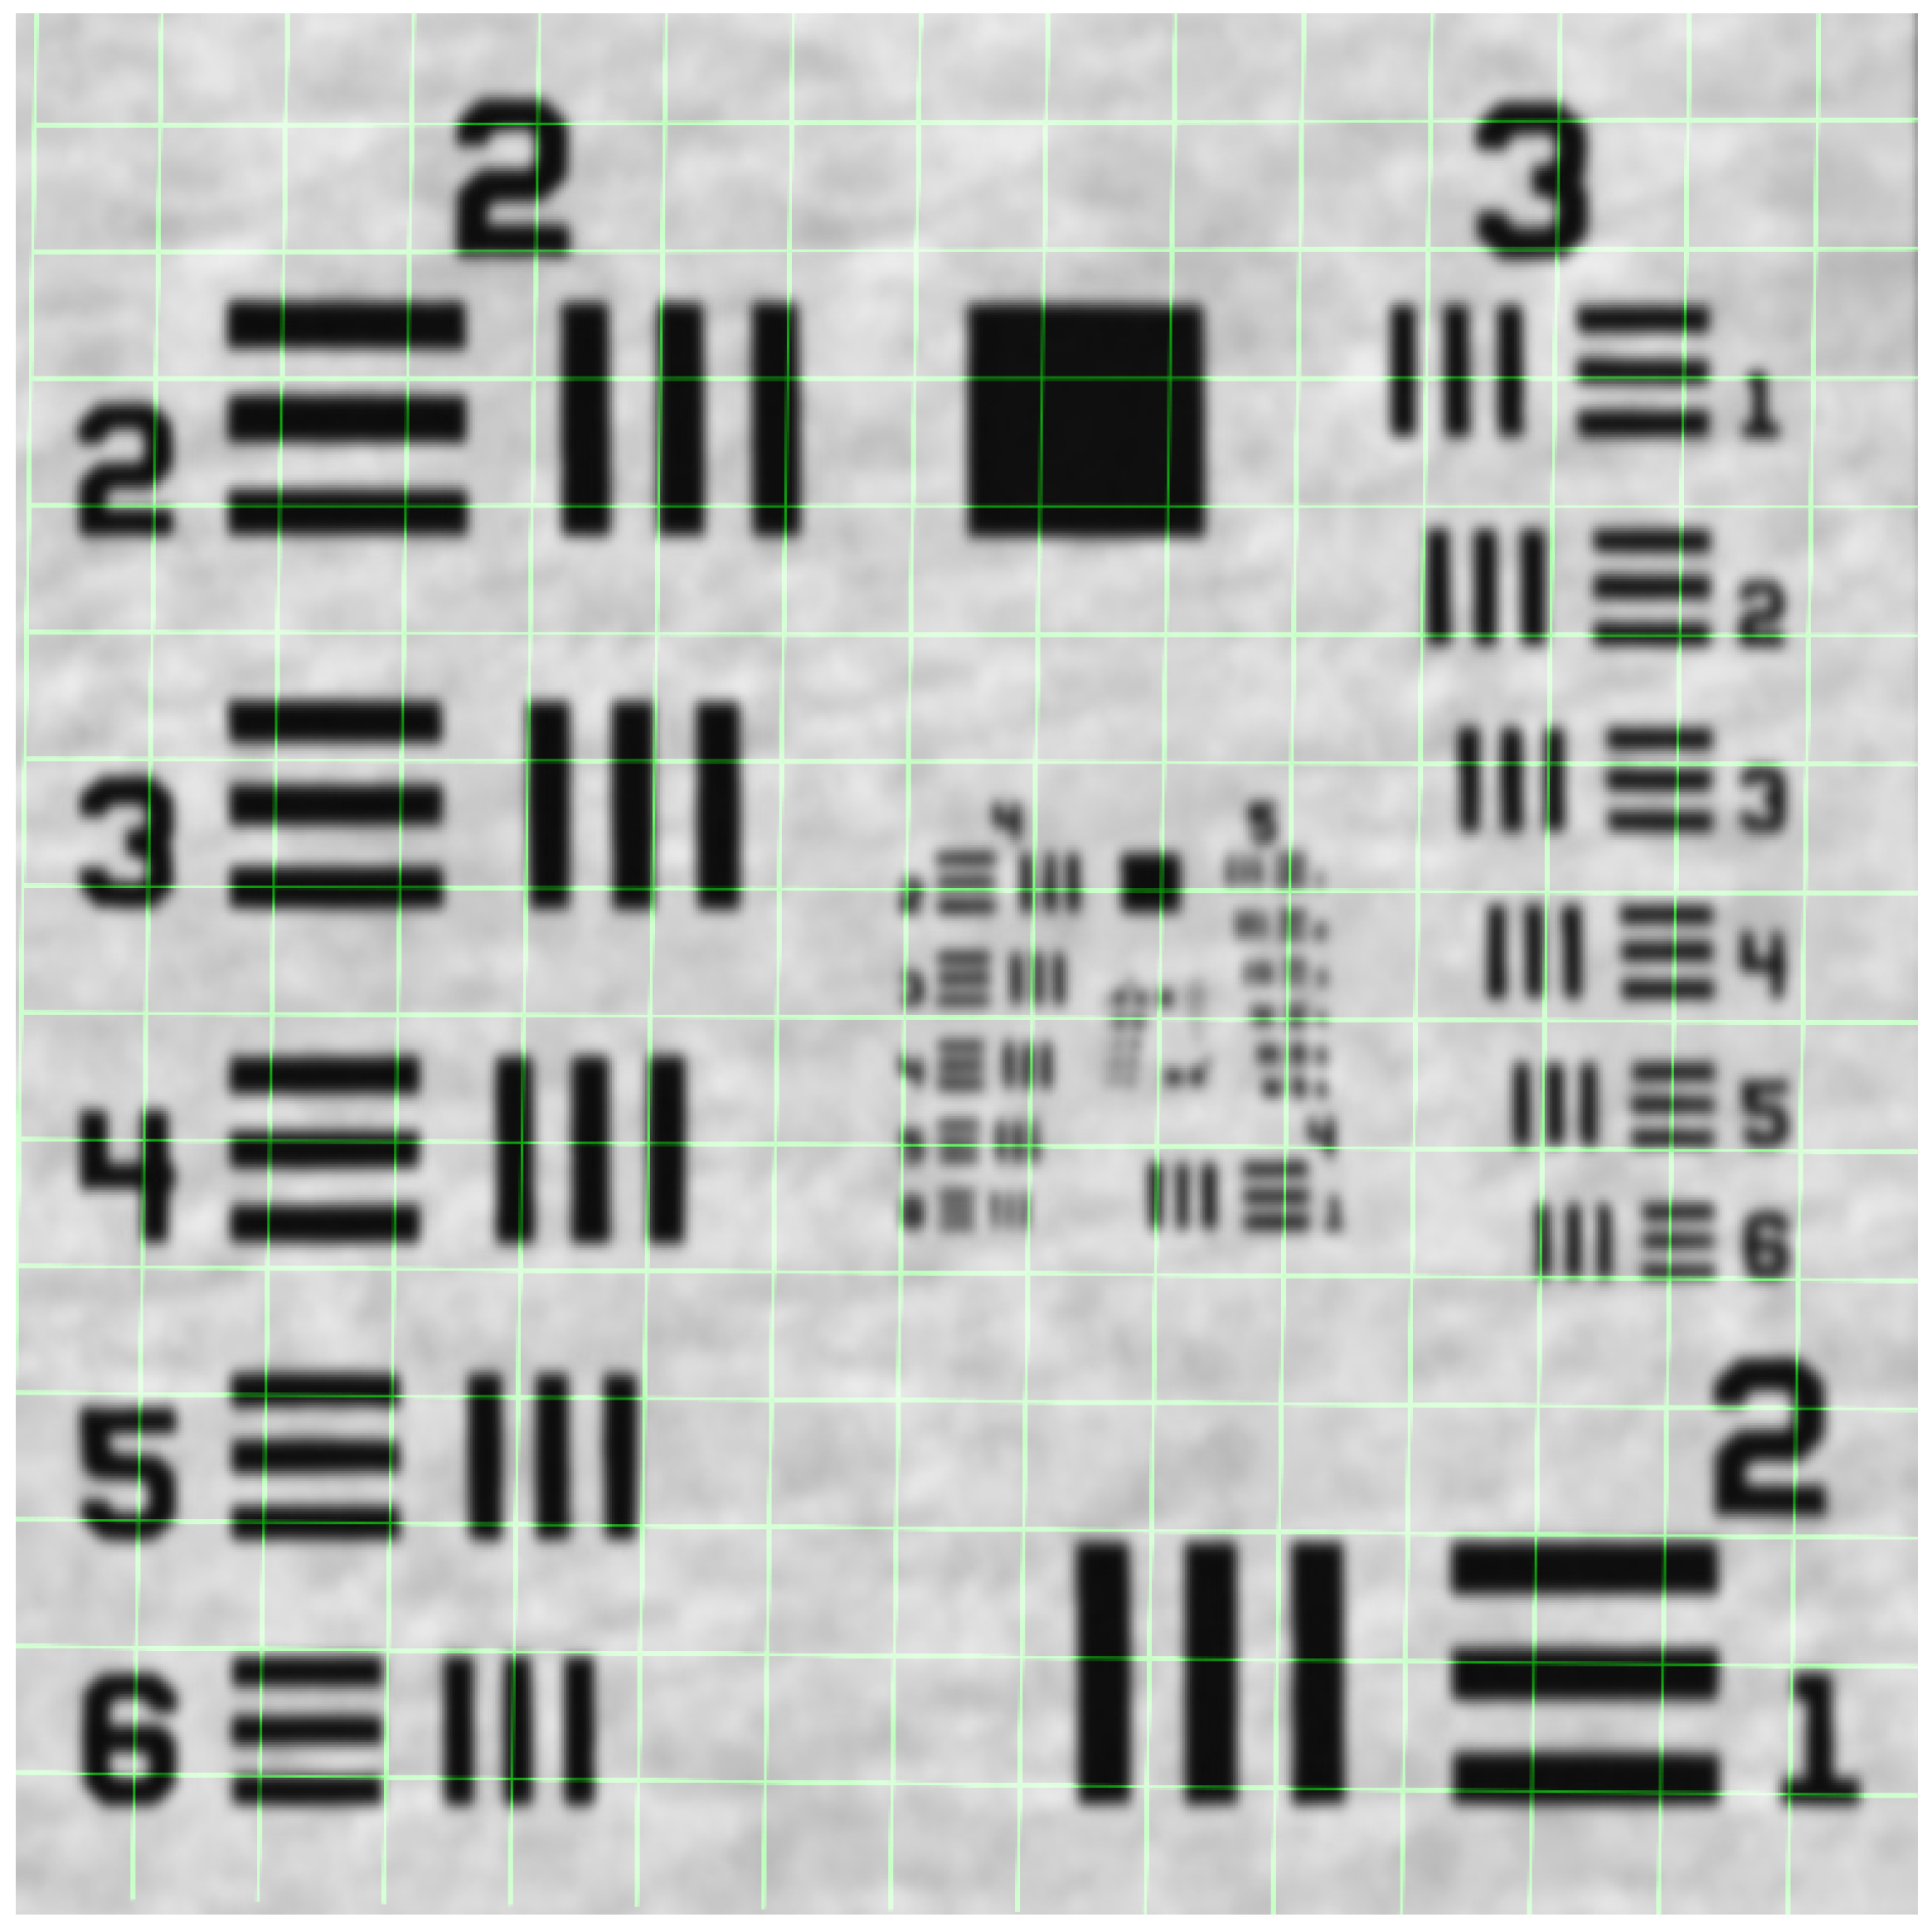
The USAF 1951 test card (
Figure 2) used is a high-contrast, structured pattern designed to test spatial resolution. However, containing groups of pairs of lines of different sizes and orientations, it can also be particularly useful for detecting small geometric displacements and directional deformations. This set of strong geometric features with known locations and properties appears to be ideal for matching and comparison tasks between the system and its DT.
2.4. Selection and Validation of Comparison Metrics
A systematic evaluation of the stability and sensitivity of selected image quality metrics was conducted for three types of degradation: shift (crop-shift), Gaussian blur, and various noise models (Gaussian, speckle, salt-and-pepper). For each transformation, the behavior of ten metrics was analyzed, including classic pixel-based measures (MSE/PSNR [
37], SSIM [
38]), gradient and edge-based measures (Gradient Magnitude [
39], Canny Edges [
40]), distance measures (Euclidean [
41], Chi-squared [
41], Hamming [
42]), and perceptual metrics based on spectral phase (FSIM [
43]), and features from deep convolutional networks (LPIPS [
44]). These methods, along with a brief description, are shown in
Table 2.
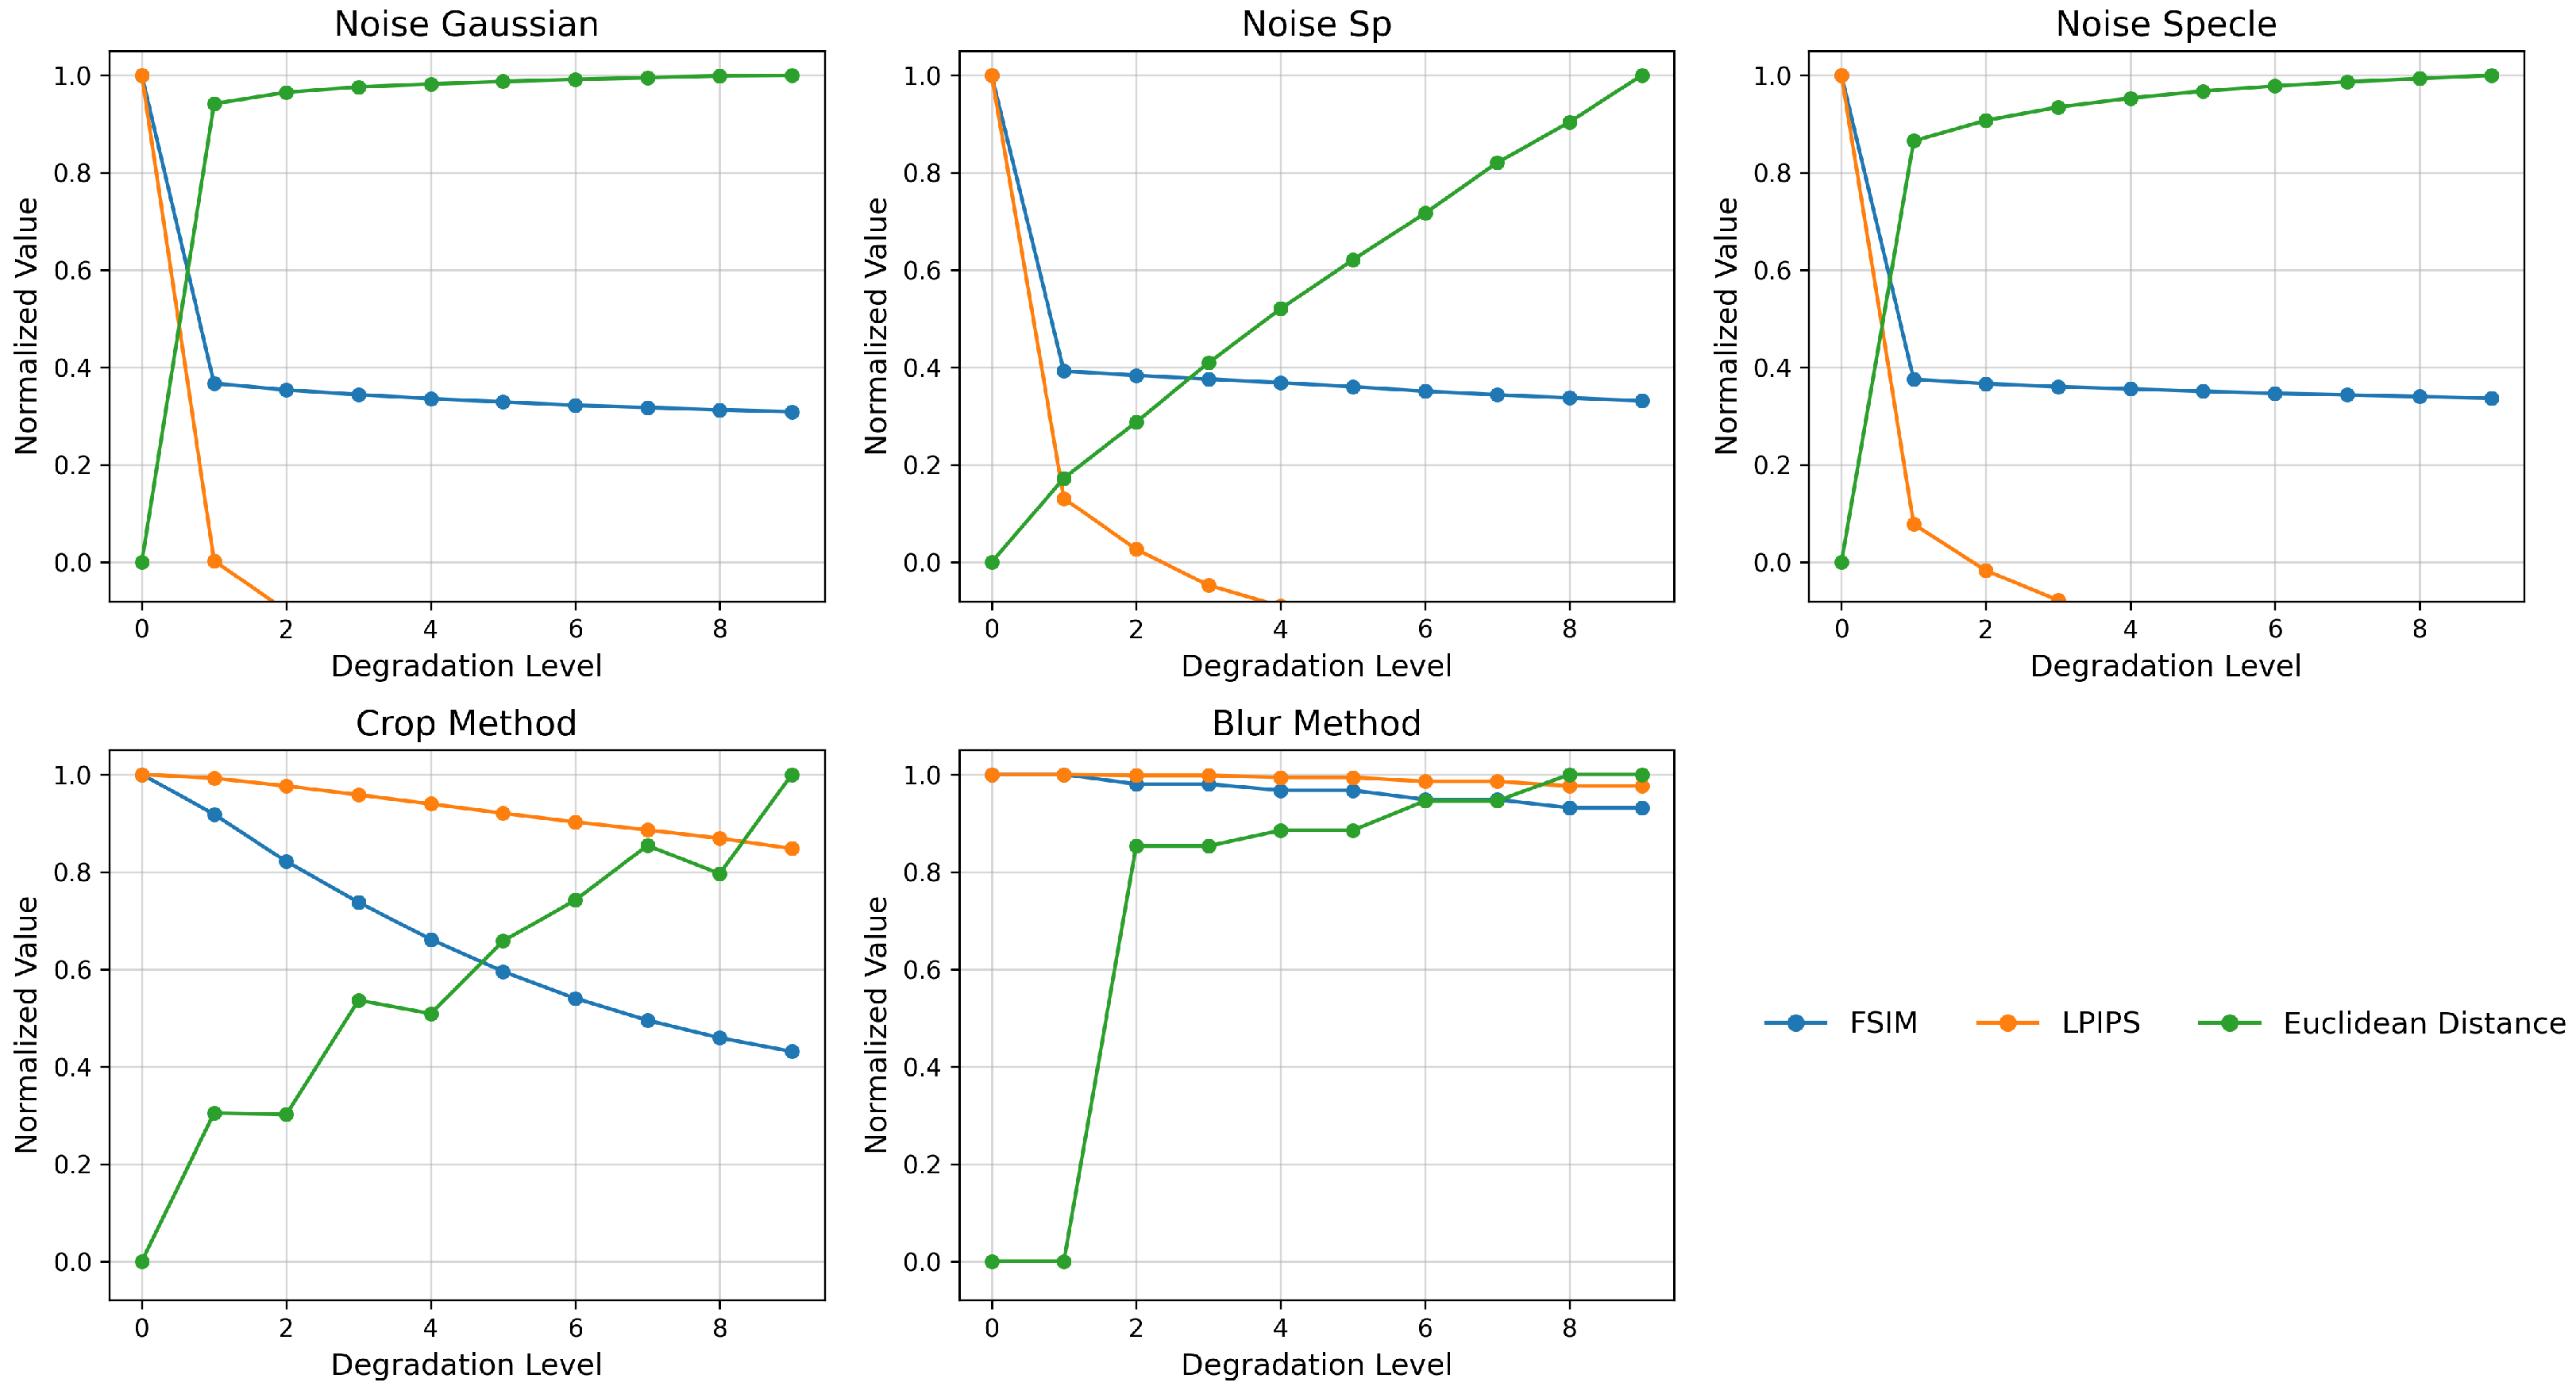
The results presented on
Figure 3 show that while MSE, PSNR, and SSIM detect the presence of even minimal distortion, their values saturate quickly and do not differentiate between further levels of degradation. In contrast, Gradient Magnitude and Hamming Distance react too discretely to increasing changes. On the other hand, FSIM and LPIPS, by incorporating relevant phase features of the image and features from the network space, provide a smooth, almost linear response to both blur and increasing noise. Euclidean Distance enables a precise, monotonic mapping of the increase in pixel-to-pixel differences. Based on this, for the final comparison of images obtained from real-world measurements and VR simulations, we used a combination of metrics in further analyses: FSIM (to capture structural dissimilarities), LPIPS (to assess perceptual similarity), and Euclidean Distance (for quantitative gradation of changes). This allowed us to obtain both an objective and a subjective characterization of the differences between the images obtained from the measurement setup and the VR simulator.
In order to compare the generated VR image (comparison image) with the real image (reference image, ground truth), a multi-stage pipeline was developed that minimizes both geometric and photometric discrepancies between the two modalities.
- 1.
Enhanced Correlation Coefficient (ECC) algorithm
Initially, a global geometric alignment of the VR image to the real-world image was performed using the ECC algorithm with an affine model. This method optimizes the correlation coefficient between the grayscale intensities of both images, compensating for shifts, rotations, and scaling [
45]. As a result, any subsequent metric differences arise solely from differences in intensity and structure, not from frame misalignment. The application of this method slightly improved the metrics, indicating good initial geometric matching.
- 2.
Histogram Matching
The next step was to match the pixel intensity distributions of the compared image (VR) to the histogram of the reference image (real). The match_histograms operation (from sci-kit-image) equalizes both the center of gravity and the contrast range [
37]. The use of this method resulted in a significant improvement in global quality metrics (SSIM increased from ≈0.628 to ≈0.721, PSNR from ≈18.3 dB to ≈18.9 dB) and a reduction in the LPIPS perceptual distance.
- 3.
Gaussian Blur Tuning
In the next phase, Gaussian blur filtering was applied to match the characteristics of the VR image to the real image by reducing high-frequency differences resulting from rendering artefacts. The Gaussian filter was chosen for its ability to simulate the effects of natural optical distortions (defocus, aberrations) and its ability to smooth intensity without significantly affecting the image structure.
The values of the standard deviation of the kernel were analyzed, with a result image generated for each value and a set of quality metrics calculated: RMSE, PSNR, SSIM, and LPIPS. The results obtained showed a systematic improvement with increasing :
RMSE decreased from ∼ to ∼,
PSNR increased from 18.3 dB () to 19.7 dB (),
SSIM improved from 0.681 () to 0.756 (),
LPIPS decreased from ∼0.63 to ∼0.55, which means a reduction in perceptual differences.
On this basis, it was concluded that the optimal quality compromise was achieved for the range
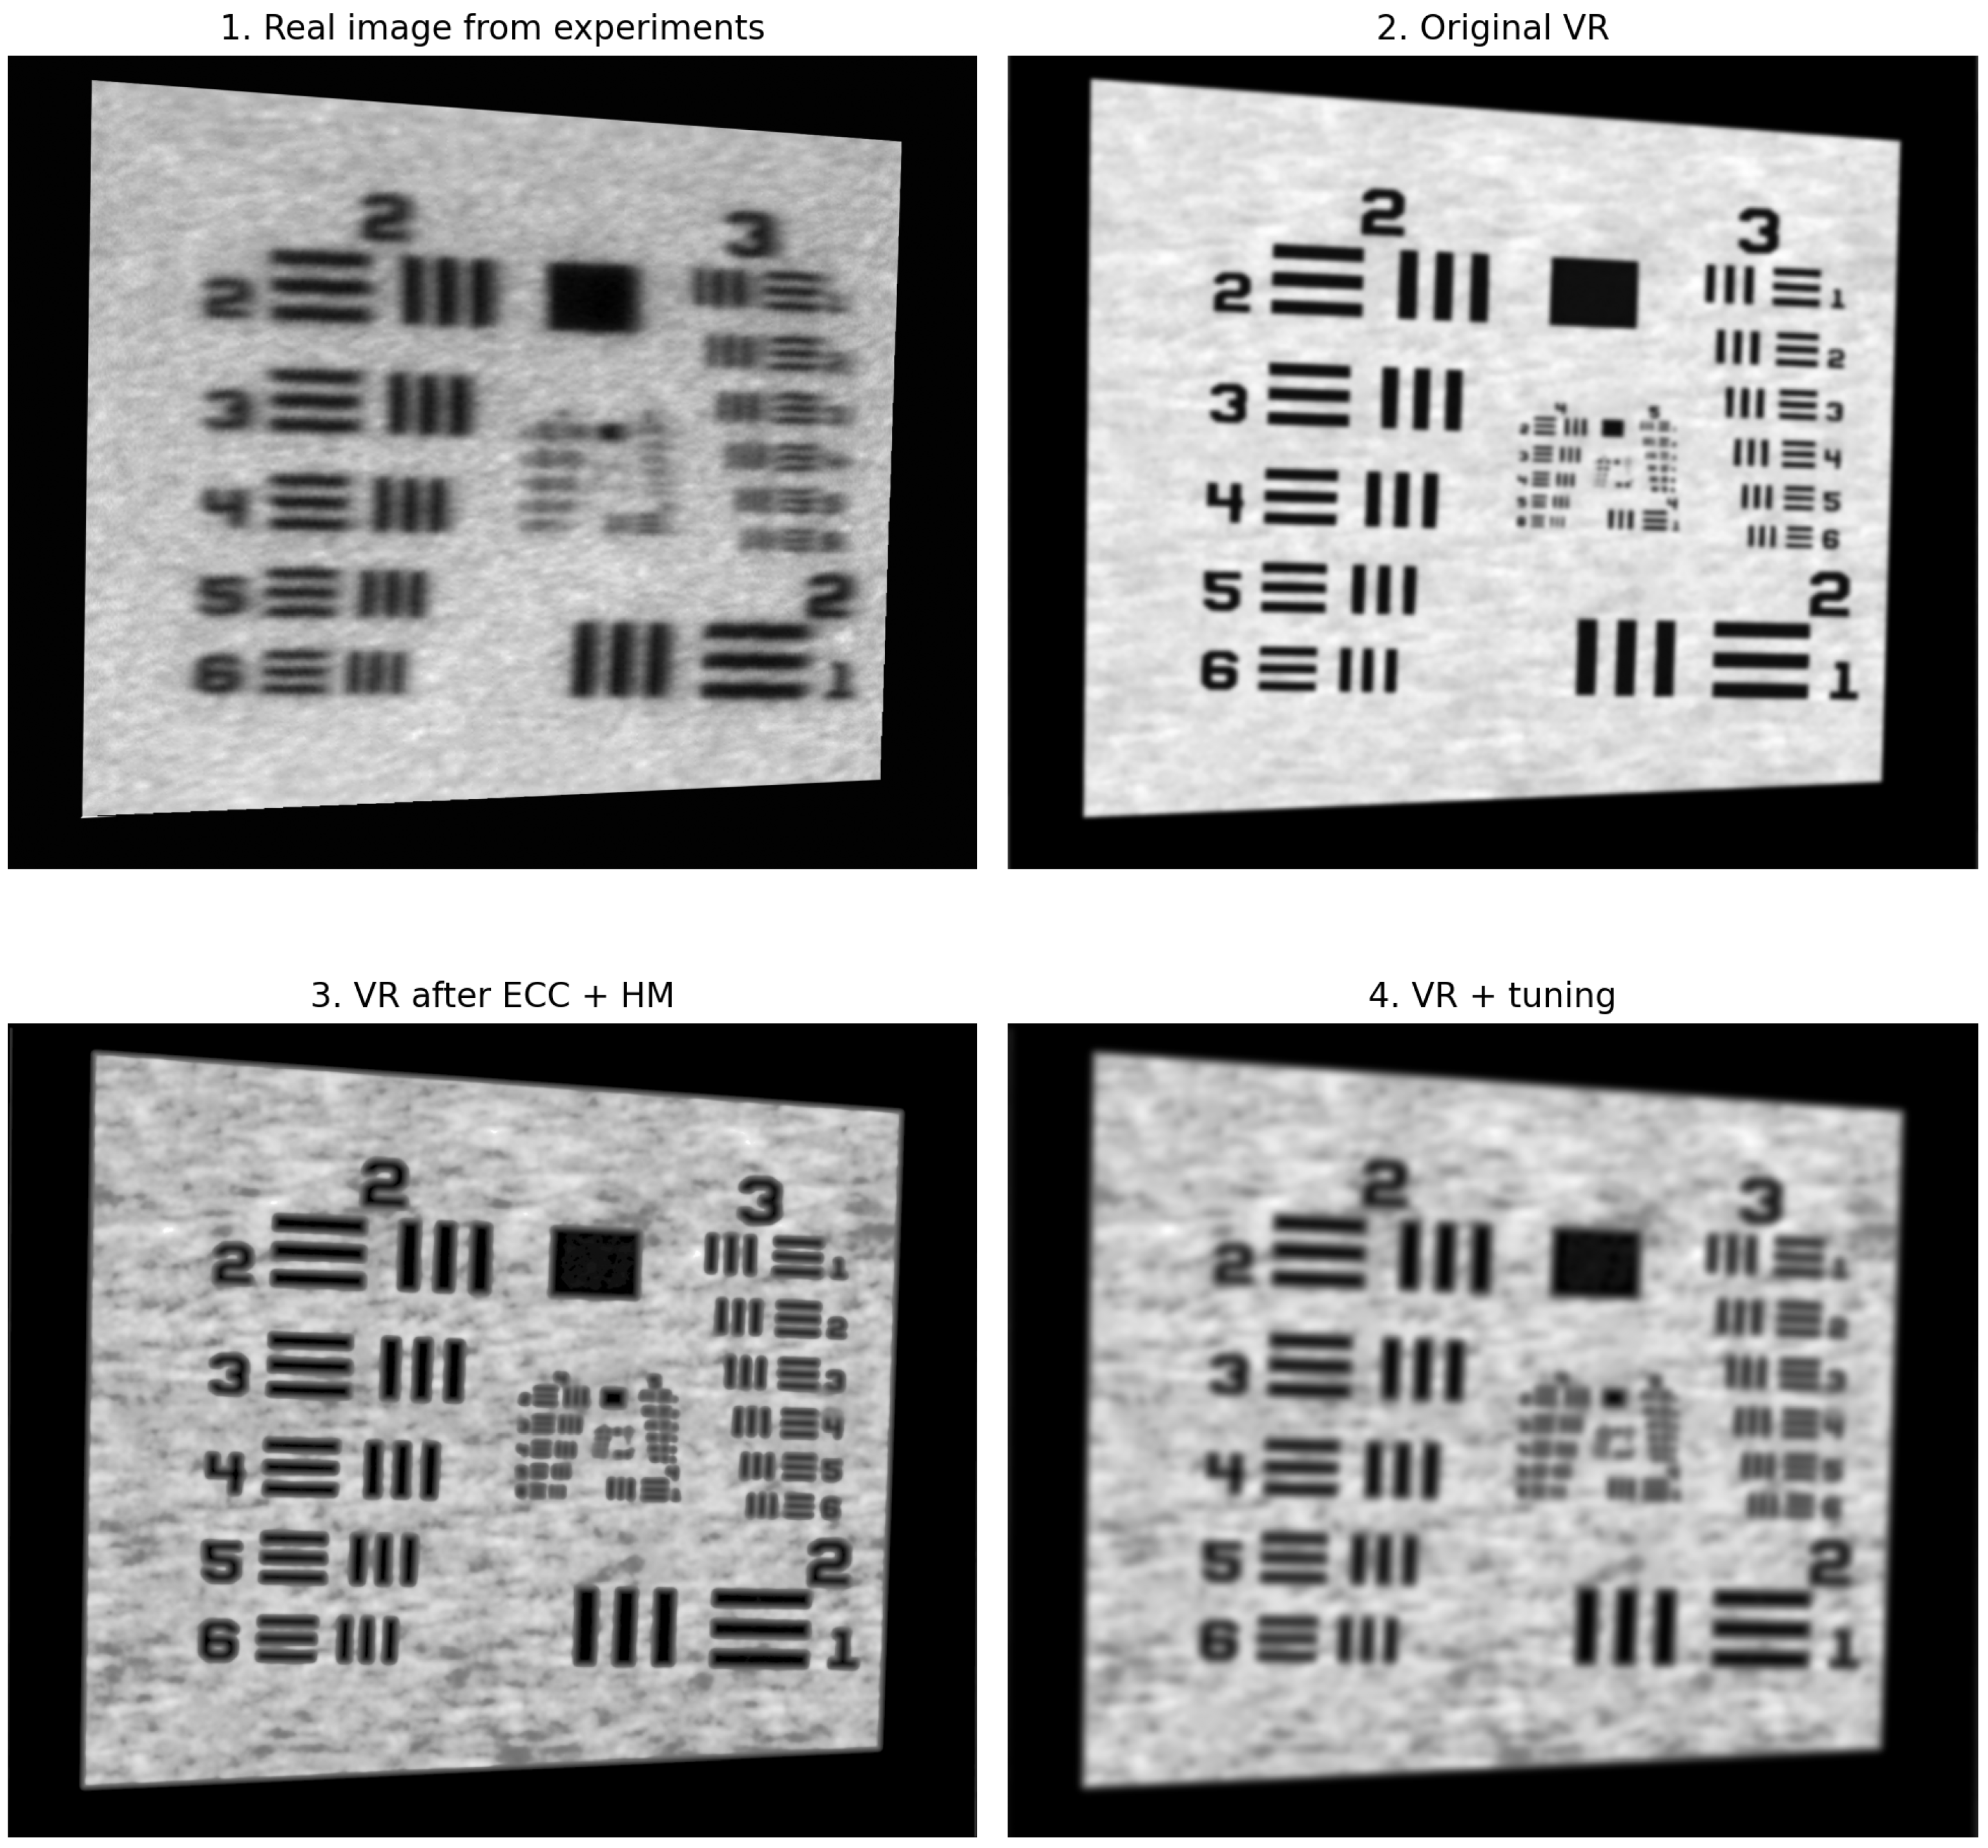
6.0–8.5, where SSIM > 0.75, low RMSE error, and reduced LPIPS perceptual distance were obtained. Despite relatively low PSNR values (≈19 dB), indicating pixel differences, the high SSIM score confirms the preservation of important structural features of the image. A detailed summary of the results discussed, and their corresponding visual representations, are presented in
Table 3 and
Figure 4.
The reference image serves as the benchmark for optimal image quality, against which the similarity of the virtual images (both raw and processed) is assessed using the selected metrics, as shown in
Table 4. A value of 0 for RMSE and LPIPS, and 1.000 for SSIM, indicates a perfect match to this reference. The `HM + tuning’ column refers to the result after applying histogram matching (HM) followed by the optimized pipeline steps, including CLAHE, Unsharp Mask, and the addition of Gaussian noise.
Interpretation of Results
The selection and comparison of images using objective quality metrics is a common practice, particularly in the fields of medical imaging, VR simulation, and analyses related to perceptual and structural quality. In this study, it was ultimately decided to use a set of metrics including SSIM, PSNR/RMSE, and LPIPS, which have been thoroughly justified and are well-supported in the literature.
The literature emphasizes the relationship between SSIM and PSNR. For instance, ref. [
46] provides a detailed analysis of the interdependence of the aformenetioned parameters. It highlights that PSNR, being a pixel-based metric, exhibits higher sensitivity to noise, an effect also observed in the examples presented in our work. Several studies report that in the context of source image reconstruction even for PSNR values below 30 dB, a high SSIM may indicate satisfactory visual fidelity, with MRI images being an example [
47]. Conversely, other research suggests that only exceeding a PSNR threshold of 35 dB (within the examined range of 18–100 dB) ensures the reproducibility of subsequent image analysis results [
48]. Therefore, interpretation of PSNR and SSIM must be conducted within the context of the intended analytical objectives. It was determined that the obtained value falls within an acceptable range, which confirms the preservation of essential structural features in the image synthesized from the data generated by the DT.
Meanwhile, Zhang et al. showed that perceptual metrics based on distances in deep feature spaces (LPIPS) outperform PSNR and SSIM in correlation with observer scores; LPIPS values below 0.15 are practically indistinguishable to the human eye [
38]. In our experiments, LPIPS decreased from ≈0.535 (raw VR) to ≈0.426 after full processing—an improvement of
≈ 0.109, which places the difference well below the threshold of subjective noticeability.
In conclusion, the joint application of complementary quality metrics—SSIM (structural fidelity), PSNR/RMSE (pixel-level accuracy), and LPIPS (perceptual similarity)—offers a robust and multidimensional assessment framework for evaluating the fidelity of VR-generated images with respect to real-world counterparts. By benchmarking against threshold values reported in the literature, the obtained results consistently demonstrate that the proposed pre-processing pipeline (ECC alignment, histogram matching, Gaussian blur tuning) yields VR images with reliable structural integrity and perceptual plausibility. This level of similarity is sufficient to support subsequent quantitative analyses, thereby reducing the reliance on direct physical image acquisition.
2.5. Fidelity Analysis Metrics
We developed an experiment to establish whether in silico digital twin simulations are a valid alternative during the development phase of eye-tracking systems. The methodology for comparing the physical system with its digital twin is twofold, focusing on both geometric and radiometric fidelity.
Table 5 shows a comprehensive insight into validation stages performed on the physical system, and the digital twin, along with the chosen metrics.
Geometric Fidelity: Imaging systems can be described using an equivalent optical system, which is a camera model, the operation of which is described by the implementation of the central projection). The parameters of this equivalent camera (e.g., focal length, position, orientation) can be derived from the images it produces. By comparing these parameters between the real system and the digital twin, we can quantify their geometric differences.
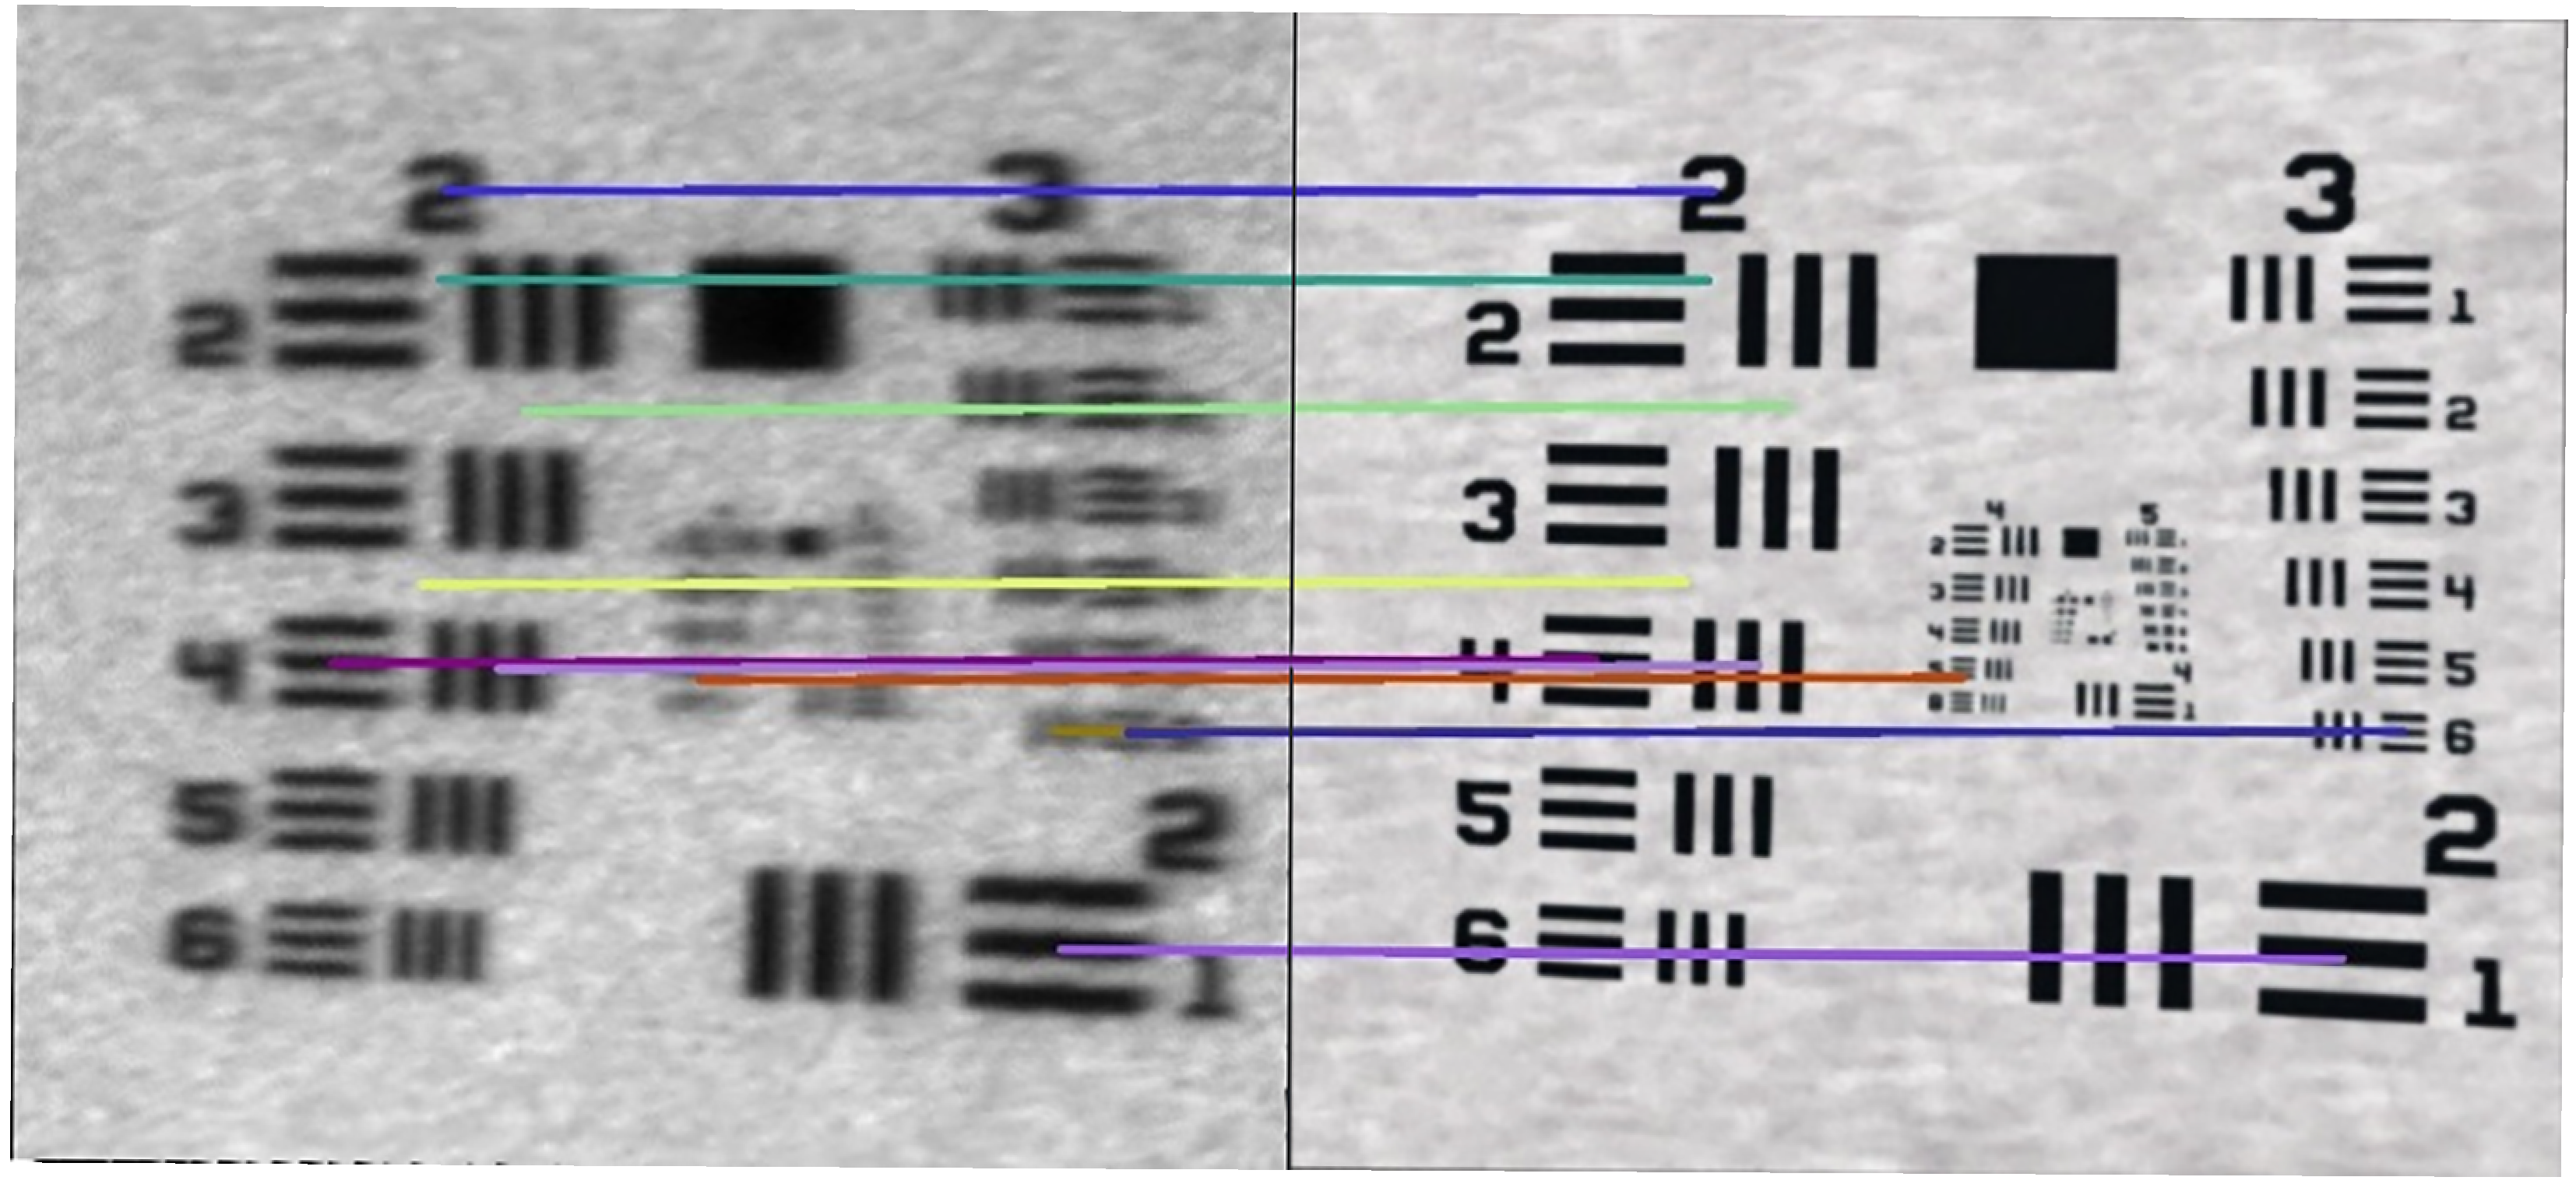
The geometric comparison of the physical and virtual systems means aligning the images they create so that the corresponding pixels in both images represent the same point of the observed scene. Such alignment should be performed separately for each of the images, e.g., using techniques such as feature matching and the implementation of perspective transformation that best describes the geometric aspects of equivalent optical systems. The result of this operation is perspective transformation matrices (
Figure 5). Comparing the coefficients of these matrices allows us to estimate the discrepancies between the systems.
Radiometric Fidelity: This aspect concerns how the systems capture light, color, and brightness. We compare radiometric properties by analyzing differences in image characteristics like blur, which can be described by the point spread function. The core of the comparison procedure involves analyzing images acquired from both systems. This includes two key elements:
Comparison of geometric parameters of the equivalent cameras and quantifying the differences in 3D-to-2D projection, translation, and rotation between them.
Comparison of radiometric parameters, such as differences related to the point blur function, to assess how accurately the digital twin replicates the optical properties of the physical setup.
2.5.1. Geometric Fidelity Analysis (Homography)
To quantify these geometric differences, we employed homography analysis. A homography matrix H is a 3 × 3 transformation that maps points from one image plane to another, effectively describing the geometric distortion (including perspective, rotation, and translation) between two views of the same planar object. The relationship is given by the following equation:
where x and x′ are corresponding points in the physical and virtual images. The homography H can be decomposed as follows:
where K represents the camera intrinsic parameters, R and t describe the relative pose between views, and n and d characterize the planar target geometry.
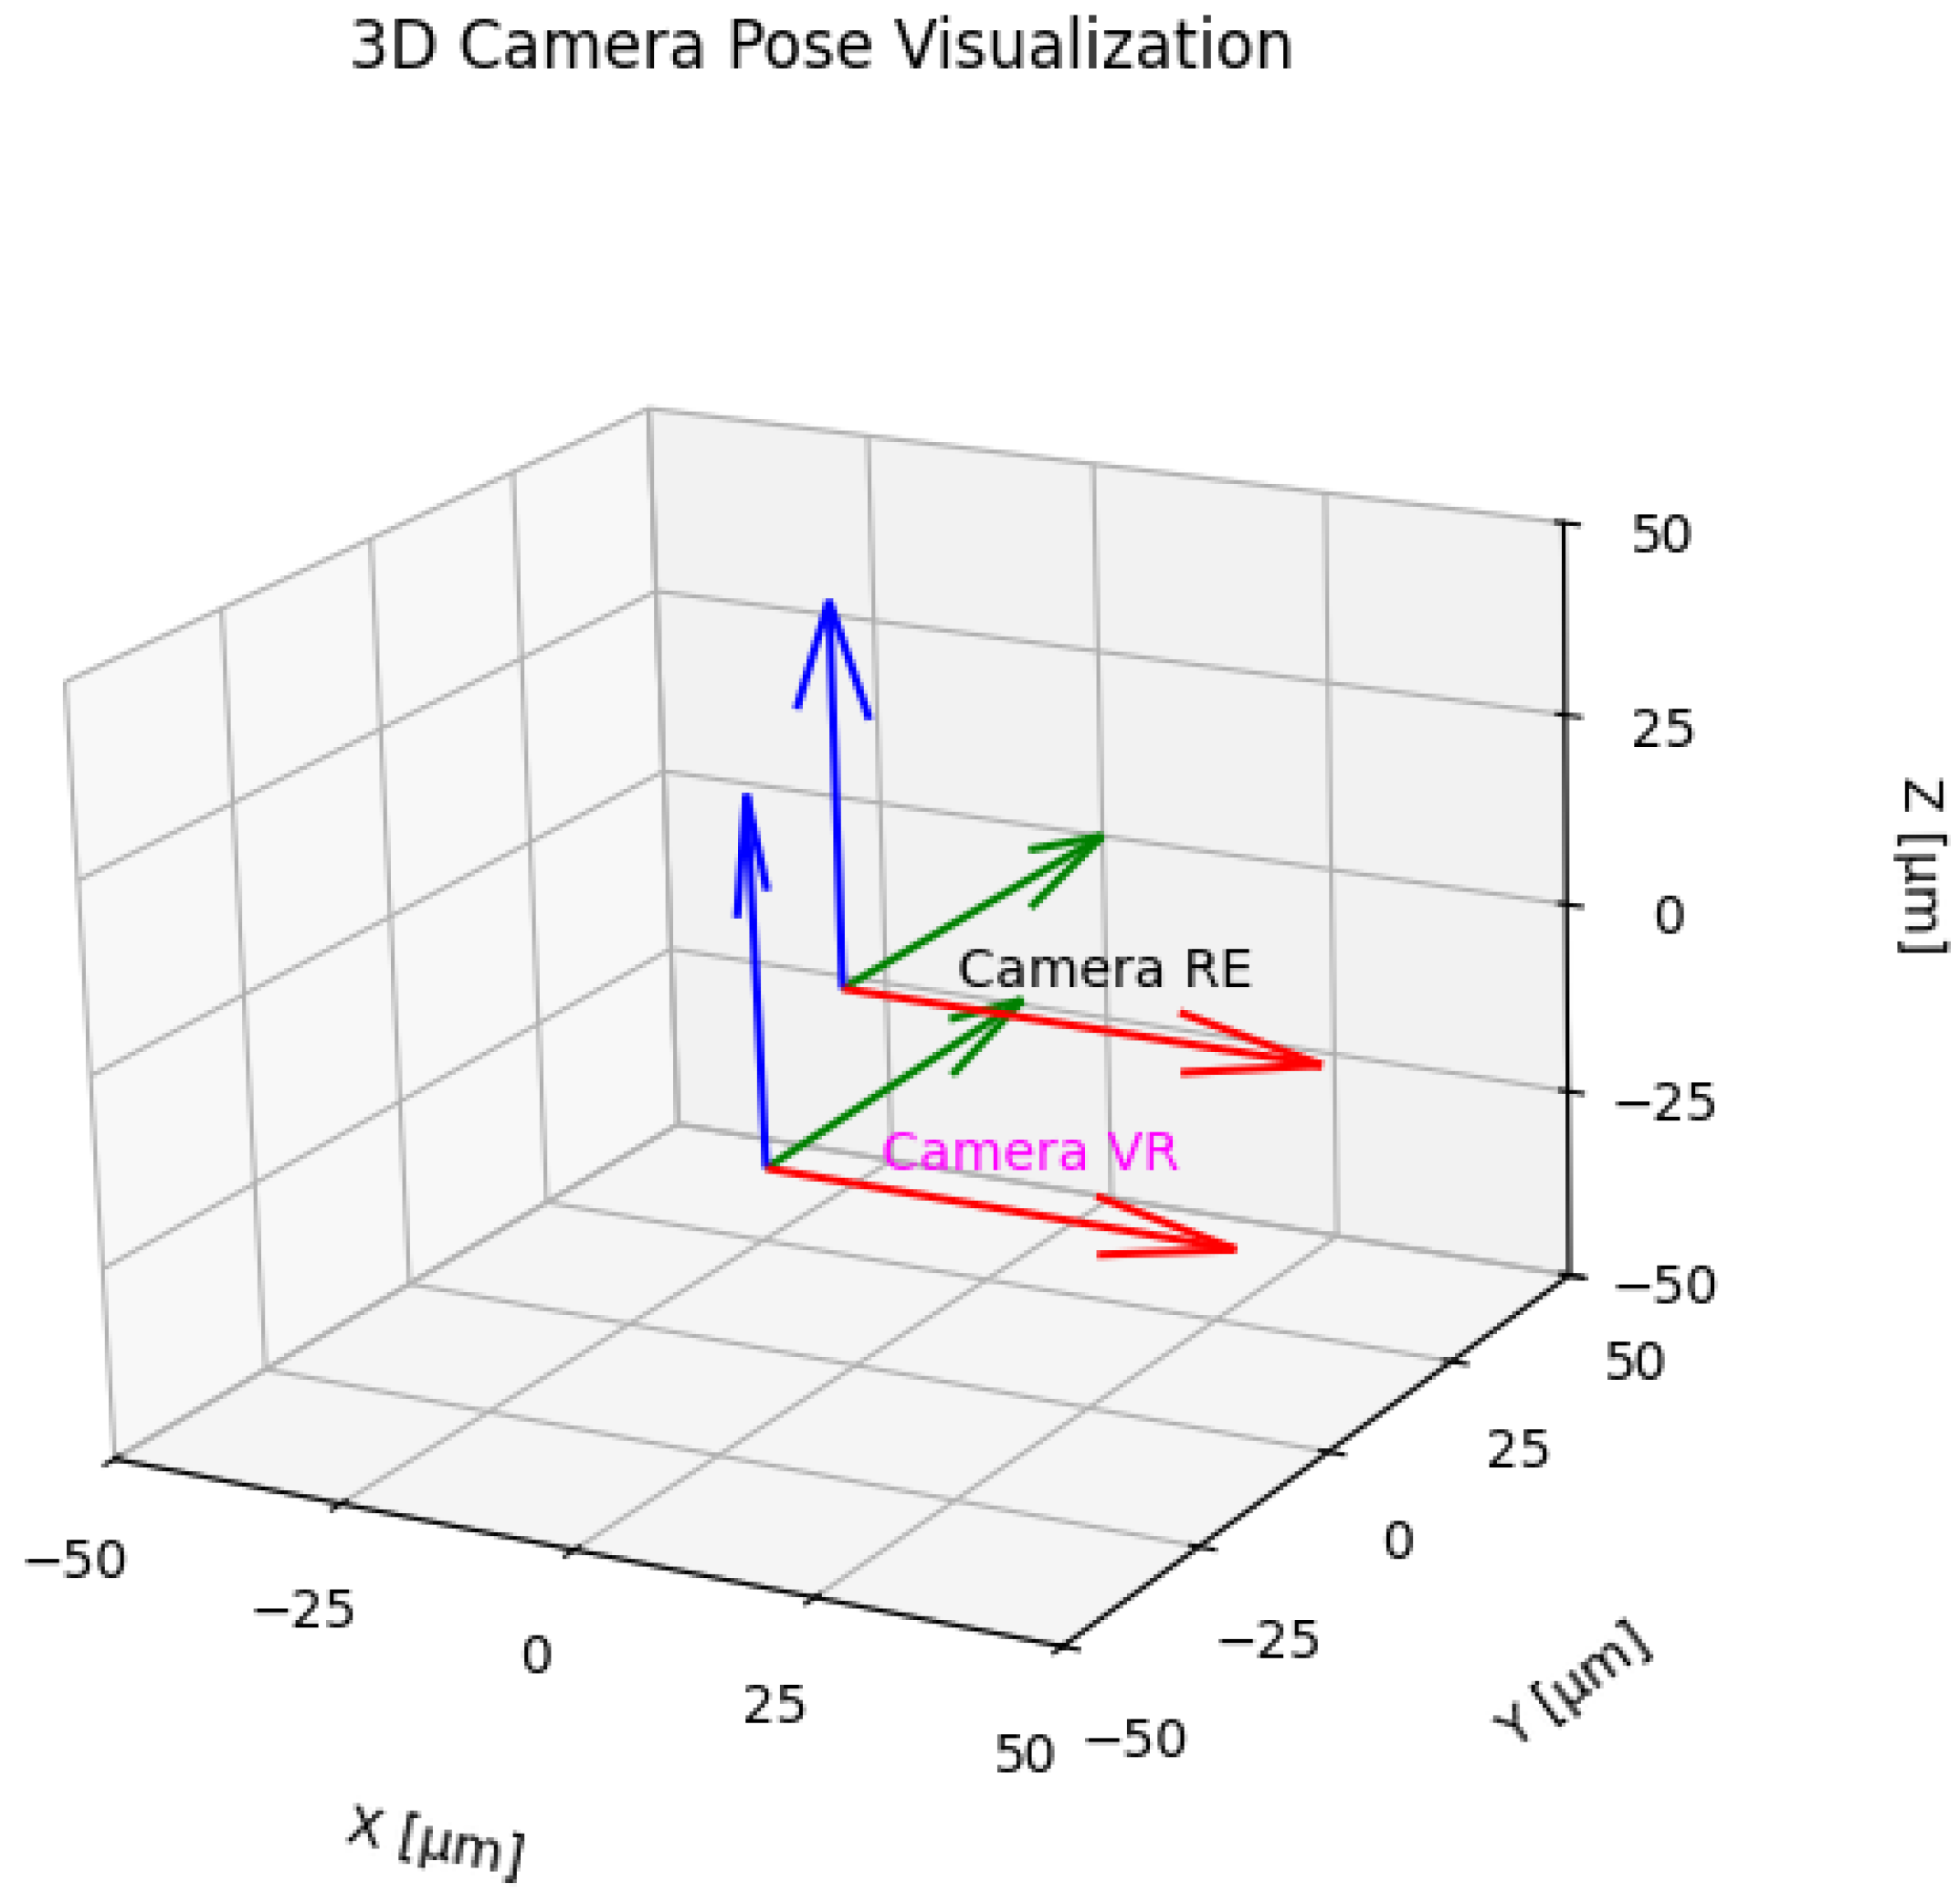
Determining the relative displacement t and rotation R of the camera is possible by executing Algorithm 1, and the results are shown in
Figure 6.
| Algorithm 1 Computing relative camera transformation. |
- 1:
- 2:
- 3:
- 4:
- 5:
- 6:
- 7:
- 8:
- 9:
|
2.5.2. Radiometric Fidelity Analysis
Radiometric fidelity concerns the accurate reproduction of light, color, and brightness. In practice, images from the physical system exhibit a degree of blur due to optical imperfections and minute mechanical vibrations, which are absent in the idealized virtual environment. This difference can be modeled by a point spread function (PSF), which represents the system’s blur kernel. The relationship between the sharp, synthesized image from the digital twin (
) and the blurrier image from the physical station (
) can be described as a convolution:
where K(x,y) is the point spread function.
We estimate K by convolving the DT image with a candidate PSF until the radiometric characteristics (e.g., blur level, grayscale distribution) match those of the physical image. Successful estimation of the PSF indicates how accurately the DT replicates the optical properties of the physical setup.
To estimate the PSF, both images are transformed into the spatial frequency domain via a Fourier Transform. By dividing the spectrum of the physical image by the spectrum of the virtual image, we isolate the spectral representation of the PSF. An inverse Fourier Transform then yields the PSF in the spatial domain, providing a quantitative measure of the physical system’s blur characteristics.
