


Opportunities and Challenges for Clinical Practice in Detecting Depression Using EEG and Machine Learning
 , ,
, ,  , , and
Abstract
1. Introduction
2. Materials and Methods
- 1.
- Dataset acquisition;
- 2.
- Preprocessing;
- 3.
- Feature extraction;
- 4.
- Classification.
2.1. Dataset Acquisition
2.2. Preprocessing
2.3. Feature Extraction
2.4. Classification
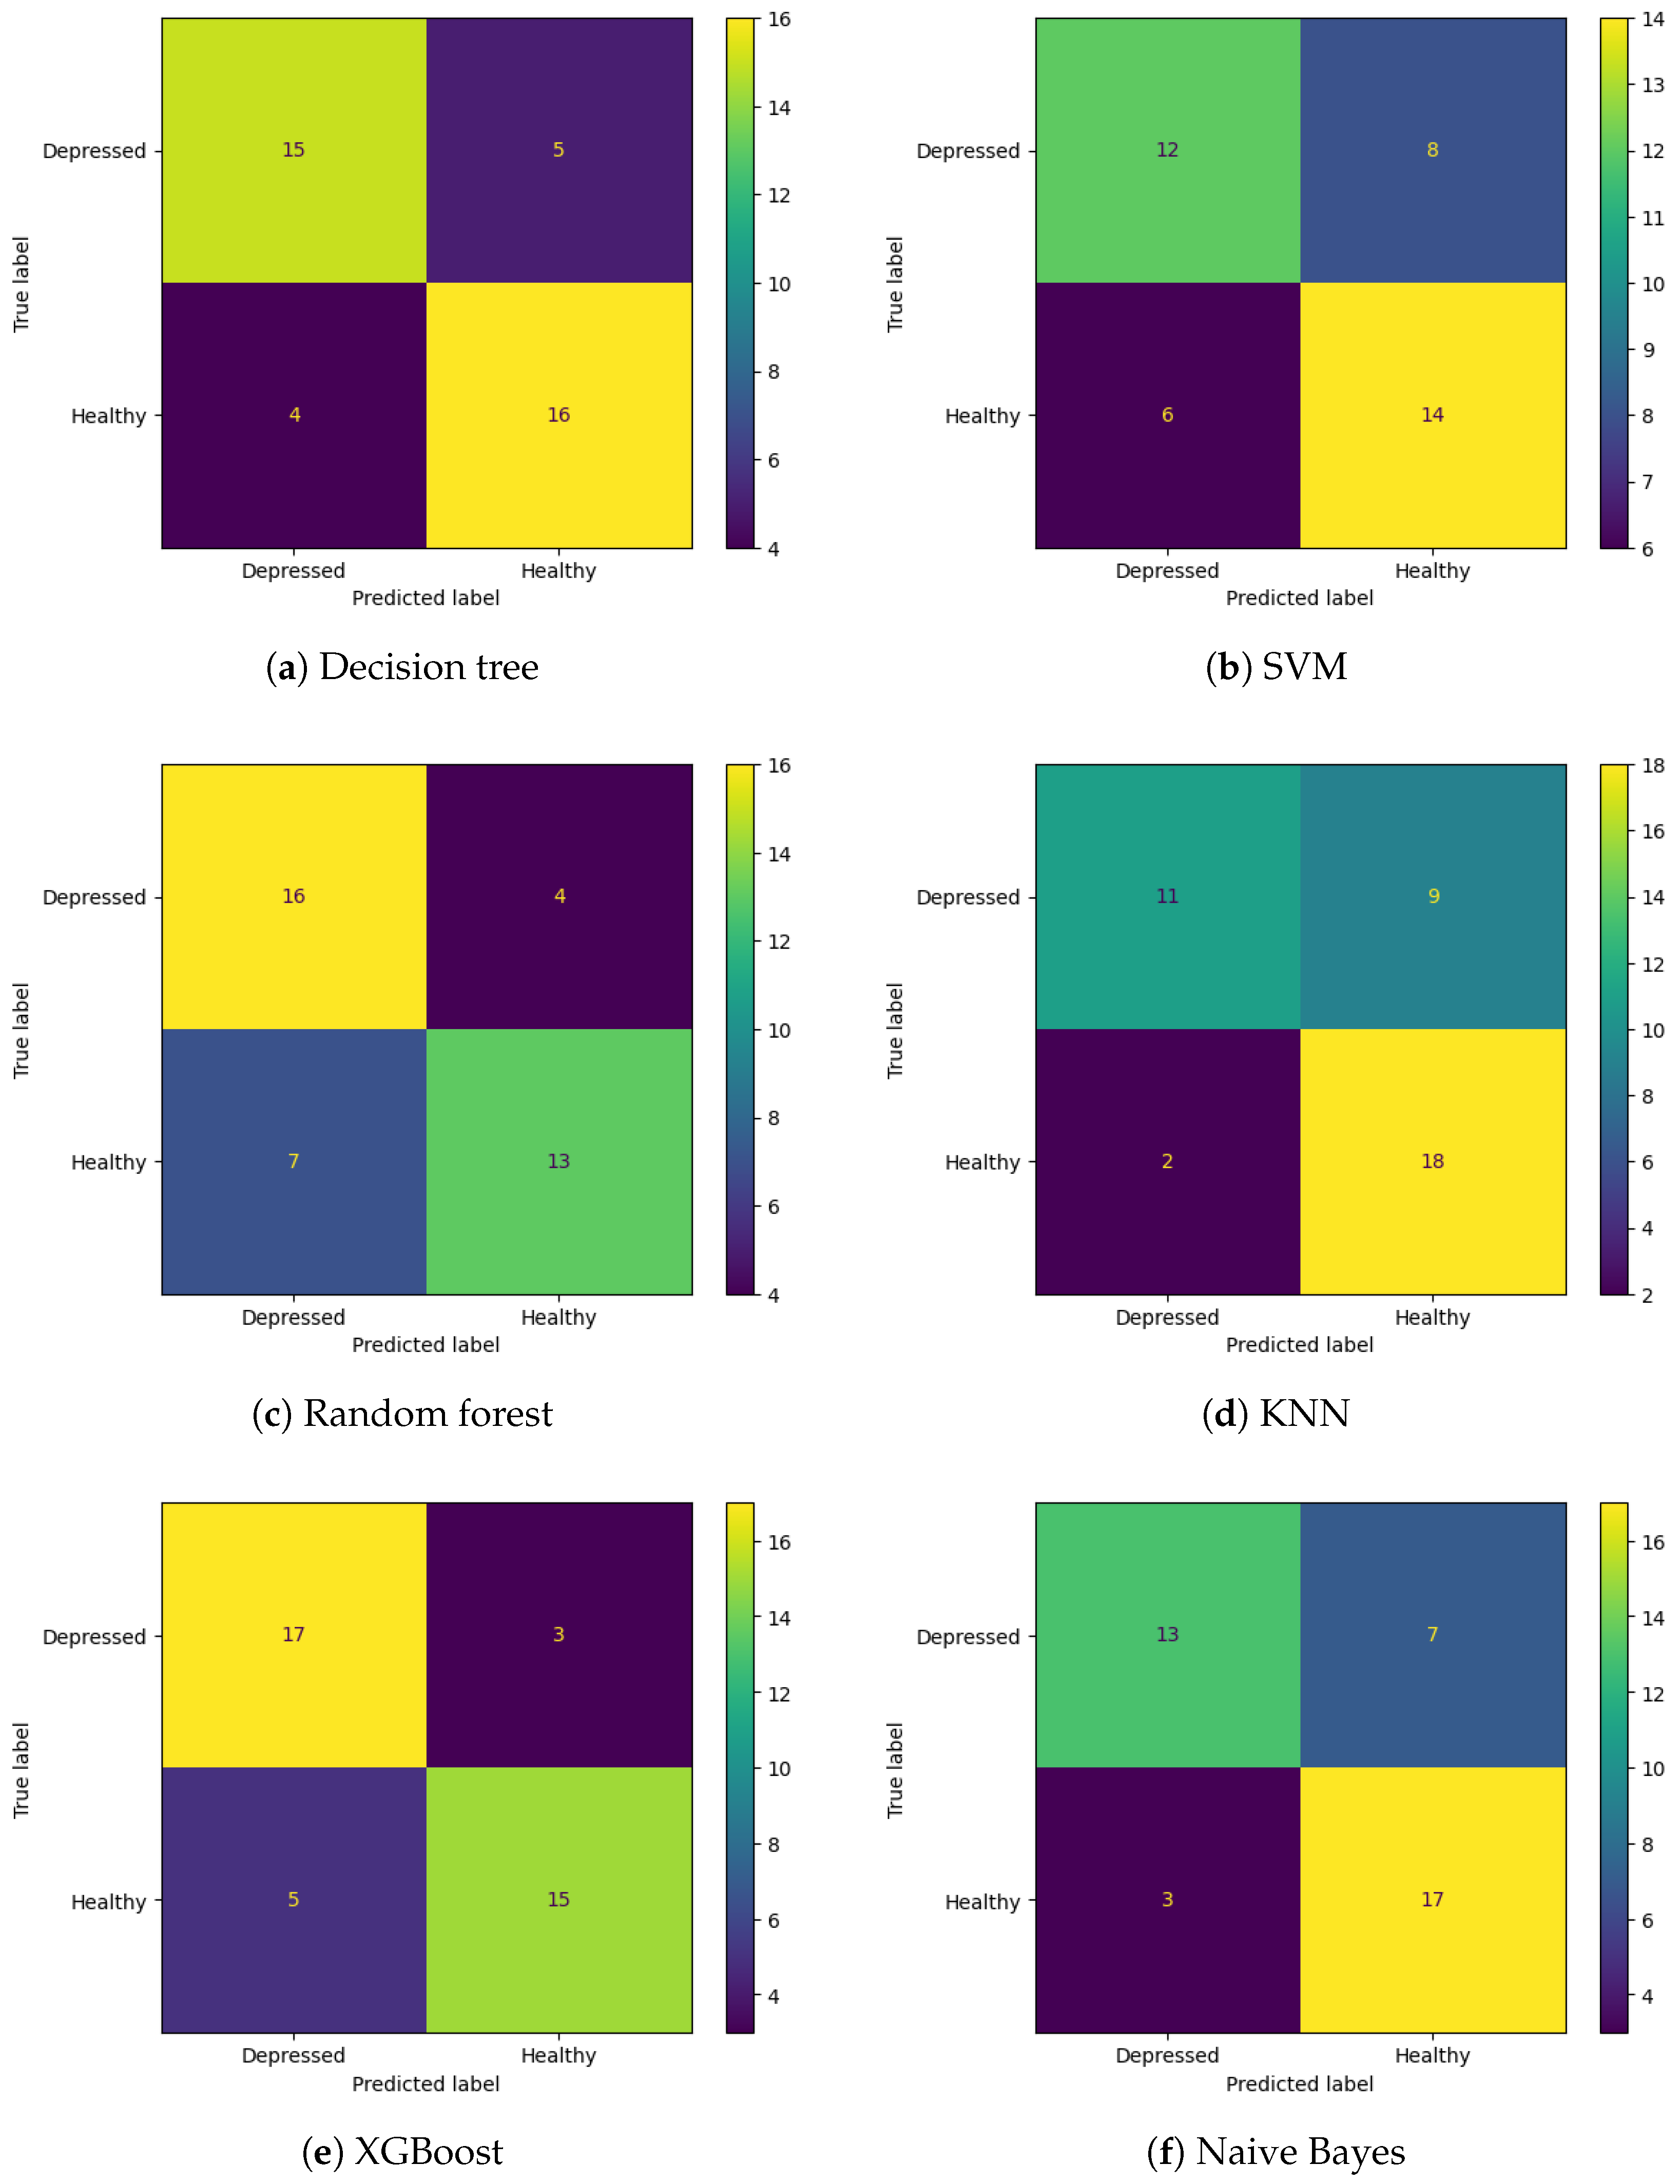
3. Results
4. Discussion
5. Conclusions
Author Contributions
Funding
Institutional Review Board Statement
Informed Consent Statement
Data Availability Statement
Conflicts of Interest
Abbreviations
| MDD | major depressive disorder |
| EEG | electroencephalography |
| ML | machine learning |
| ICD-10 | International Classification of Diseases, Tenth Revision |
| DSM-5 | The Diagnostic and Statistical Manual of Mental Disorders, Fifth Edition |
| ICA | independent component analysis |
| FIR | finite impulse response |
| DT | decision tree |
| SVM | support vector machine |
| KNN | K-nearest neighbors |
| XGBoost | eXtreme Gradient Boosting |
| NB | Naïve Bayes |
| PSD | power spectral density |
| RWE | relative wavelet energy |
| WE | wavelet entropy |
References
- James, S.L.; Abate, D.; Abate, K.H.; Abay, S.M.; Abbafati, C.; Abbasi, N.; Abbastabar, H.; Abd-Allah, F.; Abdela, J.; Abdelalim, A.; et al. Global, regional, and national incidence, prevalence, and years lived with disability for 354 diseases and injuries for 195 countries and territories, 1990–2017: A systematic analysis for the Global Burden of Disease Study 2017. Lancet 2018, 392, 1789–1858. [Google Scholar] [CrossRef] [PubMed]
- Zimmerman, M.; Ellison, W.; Young, D.; Chelminski, I.; Dalrymple, K. How many different ways do patients meet the diagnostic criteria for major depressive disorder? Compr. Psychiatry 2015, 56, 29–34. [Google Scholar] [CrossRef] [PubMed]
- Nelson, G.H.; O’Hara, M.W.; Watson, D. National norms for the expanded version of the inventory of depression and anxiety symptoms (IDAS-II). J. Clin. Psychol. 2018, 74, 953–968. [Google Scholar] [CrossRef]
- Cuijpers, P.; Noma, H.; Karyotaki, E.; Vinkers, C.H.; Cipriani, A.; Furukawa, T.A. A network meta-analysis of the effects of psychotherapies, pharmacotherapies and their combination in the treatment of adult depression. World Psychiatry 2020, 19, 92–107. [Google Scholar] [CrossRef]
- Kendler, K.S. The phenomenology of major depression and the representativeness and nature of DSM criteria. Am. J. Psychiatry 2016, 173, 771–780. [Google Scholar] [CrossRef]
- Kessing, L.V.; González-Pinto, A.; Fagiolini, A.; Bechdolf, A.; Reif, A.; Yildiz, A.; Etain, B.; Henry, C.; Severus, E.; Reininghaus, E.Z.; et al. DSM-5 and ICD-11 criteria for bipolar disorder: Implications for the prevalence of bipolar disorder and validity of the diagnosis—A narrative review from the ECNP bipolar disorders network. Eur. Neuropsychopharmacol. 2021, 47, 54–61. [Google Scholar] [CrossRef]
- Barbano, A.C.; van der Mei, W.F.; deRoon Cassini, T.A.; Grauer, E.; Lowe, S.R.; Matsuoka, Y.J.; O’Donnell, M.; Olff, M.; Qi, W.; Ratanatharathorn, A.; et al. Differentiating PTSD from anxiety and depression: Lessons from the ICD-11 PTSD diagnostic criteria. Depress. Anxiety 2019, 36, 490–498. [Google Scholar] [CrossRef]
- Beatson, J.A.; Rao, S. Depression and borderline personality disorder. Med. J. Aust. 2013, 199, S24–S27. [Google Scholar] [CrossRef]
- Rubin, R. Exploring the relationship between depression and dementia. JAMA 2018, 320, 961–962. [Google Scholar] [CrossRef]
- Cerbo, A. Convergences and divergences in the ICD-11 vs. DSM-5 classification of mood disorders. Turk. Psikiyatr. Derg. Turk. J. Psychiatry 2021, 32, 293–295. [Google Scholar]
- Horwitz, A.V.; Wakefield, J.C. The Loss of Sadness: How Psychiatry Transformed Normal Sorrow into Depressive Disorder; Oxford University Press: Oxford, UK, 2007. [Google Scholar]
- Zimmerman, M.; Balling, C.; Chelminski, I.; Dalrymple, K. Understanding the severity of depression: Which symptoms of depression are the best indicators of depression severity? Compr. Psychiatry 2018, 87, 84–88. [Google Scholar] [CrossRef] [PubMed]
- Rush, A.J. The varied clinical presentations of major depressive disorder. J. Clin. Psychiatry 2007, 68, 4. [Google Scholar] [PubMed]
- Fried, E.I. The 52 symptoms of major depression: Lack of content overlap among seven common depression scales. J. Affect. Disord. 2017, 208, 191–197. [Google Scholar] [CrossRef] [PubMed]
- Musil, R.; Seemüller, F.; Meyer, S.; Spellmann, I.; Adli, M.; Bauer, M.; Kronmüller, K.T.; Brieger, P.; Laux, G.; Bender, W.; et al. Subtypes of depression and their overlap in a naturalistic inpatient sample of major depressive disorder. Int. J. Methods Psychiatr. Res. 2018, 27, e1569. [Google Scholar] [CrossRef]
- Kessler, R.C.; Bromet, E.J. The epidemiology of depression across cultures. Annu. Rev. Public Health 2013, 34, 119–138. [Google Scholar] [CrossRef]
- Hosseinifard, B.; Moradi, M.H.; Rostami, R. Classifying depression patients and normal subjects using machine learning techniques and nonlinear features from EEG signal. Comput. Methods Programs Biomed. 2013, 109, 339–345. [Google Scholar] [CrossRef]
- Mumtaz, W.; Xia, L.; Ali, S.S.A.; Yasin, M.A.M.; Hussain, M.; Malik, A.S. Electroencephalogram (EEG)-based computer-aided technique to diagnose major depressive disorder (MDD). Biomed. Signal Process. Control 2017, 31, 108–115. [Google Scholar] [CrossRef]
- Cai, H.; Han, J.; Chen, Y.; Sha, X.; Wang, Z.; Hu, B.; Yang, J.; Feng, L.; Ding, Z.; Chen, Y.; et al. A pervasive approach to EEG-based depression detection. Complexity 2018, 2018, 5238028. [Google Scholar] [CrossRef]
- Aleem, S.; Huda, N.u.; Amin, R.; Khalid, S.; Alshamrani, S.S.; Alshehri, A. Machine learning algorithms for depression: Diagnosis, insights, and research directions. Electronics 2022, 11, 1111. [Google Scholar] [CrossRef]
- de Aguiar Neto, F.S.; Rosa, J.L.G. Depression biomarkers using non-invasive EEG: A review. Neurosci. Biobehav. Rev. 2019, 105, 83–93. [Google Scholar] [CrossRef]
- Jaworska, N.; Blier, P.; Fusee, W.; Knott, V. Alpha power, alpha asymmetry and anterior cingulate cortex activity in depressed males and females. J. Psychiatr. Res. 2012, 46, 1483–1491. [Google Scholar] [CrossRef] [PubMed]
- Shim, M.; Im, C.H.; Kim, Y.W.; Lee, S.H. Altered cortical functional network in major depressive disorder: A resting-state electroencephalogram study. NeuroImage Clin. 2018, 19, 1000–1007. [Google Scholar] [CrossRef] [PubMed]
- Mahato, S.; Paul, S. Classification of depression patients and normal subjects based on electroencephalogram (EEG) signal using alpha power and theta asymmetry. J. Med. Syst. 2020, 44, 28. [Google Scholar] [CrossRef] [PubMed]
- Fitzgerald, P.J.; Watson, B.O. Gamma oscillations as a biomarker for major depression: An emerging topic. Transl. Psychiatry 2018, 8, 177. [Google Scholar] [CrossRef] [PubMed]
- Dharmadhikari, A.; Tandle, A.; Jaiswal, S.; Sawant, V.; Vahia, V.; Jog, N. Frontal theta asymmetry as a biomarker of depression. East Asian Arch. Psychiatry 2018, 28, 17–22. [Google Scholar]
- Kaiser, A.K.; Gnjezda, M.T.; Knasmüller, S.; Aichhorn, W. Electroencephalogram alpha asymmetry in patients with depressive disorders: Current perspectives. Neuropsychiatr. Dis. Treat. 2018, 14, 1493–1504. [Google Scholar] [CrossRef]
- Reznik, S.J.; Allen, J.J. Frontal asymmetry as a mediator and moderator of emotion: An updated review. Psychophysiology 2018, 55, e12965. [Google Scholar] [CrossRef]
- Van Der Vinne, N.; Vollebregt, M.A.; Van Putten, M.J.; Arns, M. Frontal alpha asymmetry as a diagnostic marker in depression: Fact or fiction? A meta-analysis. NeuroImage Clin. 2017, 16, 79–87. [Google Scholar] [CrossRef]
- Cukic, M.; Pokrajac, D.; Stokic, M.; Radivojevic, V.; Ljubisavljevic, M. EEG machine learning with Higuchi fractal dimension and Sample Entropy as features for successful detection of depression. arXiv 2018, arXiv:1803.05985. [Google Scholar]
- Wilkinson, J.; Arnold, K.F.; Murray, E.J.; van Smeden, M.; Carr, K.; Sippy, R.; de Kamps, M.; Beam, A.; Konigorski, S.; Lippert, C.; et al. Time to reality check the promises of machine learning-powered precision medicine. Lancet Digit. Health 2020, 2, e677–e680. [Google Scholar] [CrossRef]
- Chen, Z.S.; Galatzer-Levy, I.R.; Bigio, B.; Nasca, C.; Zhang, Y. Modern views of machine learning for precision psychiatry. Patterns 2022, 3, 100602. [Google Scholar] [CrossRef] [PubMed]
- Sanei, S.; Chambers, J.A. EEG Signal Processing; John Wiley & Sons: Hoboken, NJ, USA, 2013. [Google Scholar]
- Mumtaz, W.; Malik, A.S.; Ali, S.S.A.; Yasin, M.A.M. A Study to Investigate Different EEG Reference Choices in Diagnosing Major Depressive Disorder. In Proceedings of the Neural Information Processing: 22nd International Conference, ICONIP 2015, Istanbul, Turkey, 9–12 November 2015; Proceedings, Part IV 22. Springer: Berlin/Heidelberg, Germany, 2015; pp. 77–86. [Google Scholar]
- Pion-Tonachini, L.; Kreutz-Delgado, K.; Makeig, S. ICLabel: An automated electroencephalographic independent component classifier, dataset, and website. NeuroImage 2019, 198, 181–197. [Google Scholar] [CrossRef] [PubMed]
- Damborská, A.; Tomescu, M.I.; Honzírková, E.; Barteček, R.; Hořínková, J.; Fedorová, S.; Ondruš, Š.; Michel, C.M. EEG resting-state large-scale brain network dynamics are related to depressive symptoms. Front. Psychiatry 2019, 10, 548. [Google Scholar] [CrossRef] [PubMed]
- Mahato, S.; Paul, S. Detection of major depressive disorder using linear and non-linear features from EEG signals. Microsyst. Technol. 2019, 25, 1065–1076. [Google Scholar] [CrossRef]
- Mohammadi, M.; Al-Azab, F.; Raahemi, B.; Richards, G.; Jaworska, N.; Smith, D.; de la Salle, S.; Blier, P.; Knott, V. Data mining EEG signals in depression for their diagnostic value. BMC Med. Inform. Decis. Mak. 2015, 15, 108. [Google Scholar] [CrossRef]
- Kulkarni, N. Use of complexity based features in diagnosis of mild Alzheimer disease using EEG signals. Int. J. Inf. Technol. 2018, 10, 59–64. [Google Scholar] [CrossRef]
- Bairy, G.M.; Niranjan, U.; Puthankattil, S.D. Automated classification of depression EEG signals using wavelet entropies and energies. J. Mech. Med. Biol. 2016, 16, 1650035. [Google Scholar] [CrossRef]
- Puthankattil, S.D.; Joseph, P.K. Analysis of EEG signals using wavelet entropy and approximate entropy: A case study on depression patients. Int. J. Bioeng. Life Sci. 2014, 8, 430–434. [Google Scholar]
- Akar, S.A.; Kara, S.; Agambayev, S.; Bilgiç, V. Nonlinear analysis of EEG in major depression with fractal dimensions. In Proceedings of the 2015 37th Annual International Conference of the IEEE Engineering in Medicine and Biology Society (EMBC), Milan, Italy, 25–29 August 2015; IEEE: New York, NY, USA, 2015; pp. 7410–7413. [Google Scholar]
- Kinder, I.; Friganovic, K.; Vukojevic, J.; Mulc, D.; Slukan, T.; Vidovic, D.; Brecic, P.; Cifrek, M. Comparison of machine learning methods in classification of affective disorders. In Proceedings of the 2020 43rd International Convention on Information, Communication and Electronic Technology (MIPRO), Opatija, Croatia, 28 September–2 October 2020; IEEE: New York, NY, USA, 2020; pp. 177–181. [Google Scholar]
- Zebari, R.; Abdulazeez, A.; Zeebaree, D.; Zebari, D.; Saeed, J. A comprehensive review of dimensionality reduction techniques for feature selection and feature extraction. J. Appl. Sci. Technol. Trends 2020, 1, 56–70. [Google Scholar] [CrossRef]
- Obi, J.C. A comparative study of several classification metrics and their performances on data. World J. Adv. Eng. Technol. Sci. 2023, 8, 308–314. [Google Scholar]
- Bhadra, S.; Kumar, C.J. An insight into diagnosis of depression using machine learning techniques: A systematic review. Curr. Med. Res. Opin. 2022, 38, 749–771. [Google Scholar] [CrossRef] [PubMed]
- Pinto, S.J.; Parente, M. Comprehensive review of depression detection techniques based on machine learning approach. Soft Comput. 2024, 28, 10701–10725. [Google Scholar] [CrossRef]
- Kessler, R.C. The potential of predictive analytics to provide clinical decision support in depression treatment planning. Curr. Opin. Psychiatry 2018, 31, 32–39. [Google Scholar] [CrossRef]
- Buch, A.M.; Liston, C. Dissecting diagnostic heterogeneity in depression by integrating neuroimaging and genetics. Neuropsychopharmacology 2021, 46, 156–175. [Google Scholar] [CrossRef]
- Nusslock, R.; Shackman, A.J.; McMenamin, B.W.; Greischar, L.L.; Davidson, R.J.; Kovacs, M. Comorbid anxiety moderates the relationship between depression history and prefrontal EEG asymmetry. Psychophysiology 2018, 55, e12953. [Google Scholar] [CrossRef]
- Lin, I.M.; Chen, T.C.; Lin, H.Y.; Wang, S.Y.; Sung, J.L.; Yen, C.W. Electroencephalogram patterns in patients comorbid with major depressive disorder and anxiety symptoms: Proposing a hypothesis based on hypercortical arousal and not frontal or parietal alpha asymmetry. J. Affect. Disord. 2021, 282, 945–952. [Google Scholar] [CrossRef]
- Vukojević, J.; Mulc, D.; Kinder, I.; Jovičić, E.; Friganović, K.; Savić, A.; Cifrek, M.; Vidović, D. Borderline and depression: A thin EEG line. Clin. Eeg Neurosci. 2023, 54, 224–227. [Google Scholar] [CrossRef]
- Wu, W.; Zhang, Y.; Jiang, J.; Lucas, M.V.; Fonzo, G.A.; Rolle, C.E.; Cooper, C.; Chin-Fatt, C.; Krepel, N.; Cornelssen, C.A.; et al. An electroencephalographic signature predicts antidepressant response in major depression. Nat. Biotechnol. 2020, 38, 439–447. [Google Scholar] [CrossRef]
- Härpfer, K.; Spychalski, D.; Kathmann, N.; Riesel, A. Diverging patterns of EEG alpha asymmetry in anxious apprehension and anxious arousal. Biol. Psychol. 2021, 162, 108111. [Google Scholar] [CrossRef]
- Kaltsouni, E.; Schmidt, F.; Zsido, R.G.; Eriksson, A.; Sacher, J.; Sundström-Poromaa, I.; Sumner, R.L.; Comasco, E. Electroencephalography findings in menstrually-related mood disorders: A critical review. Front. Neuroendocrinol. 2024, 72, 101120. [Google Scholar] [CrossRef]
- Surova, G.; Ulke, C.; Schmidt, F.M.; Hensch, T.; Sander, C.; Hegerl, U. Fatigue and brain arousal in patients with major depressive disorder. Eur. Arch. Psychiatry Clin. Neurosci. 2021, 271, 527–536. [Google Scholar] [CrossRef] [PubMed]
- Ulke, C.; Tenke, C.E.; Kayser, J.; Sander, C.; Böttger, D.; Wong, L.Y.; Alvarenga, J.E.; Fava, M.; McGrath, P.J.; Deldin, P.J.; et al. Resting EEG measures of brain arousal in a multisite study of major depression. Clin. EEG Neurosci. 2019, 50, 3–12. [Google Scholar] [CrossRef] [PubMed]
- Rodríguez-Ruiz, J.G.; Galván-Tejada, C.E.; Zanella-Calzada, L.A.; Celaya-Padilla, J.M.; Galván-Tejada, J.I.; Gamboa-Rosales, H.; Luna-García, H.; Magallanes-Quintanar, R.; Soto-Murillo, M.A. Comparison of night, day and 24 h motor activity data for the classification of depressive episodes. Diagnostics 2020, 10, 162. [Google Scholar] [CrossRef] [PubMed]
- Liu, S.; Liu, X.; Yan, D.; Chen, S.; Liu, Y.; Hao, X.; Ou, W.; Huang, Z.; Su, F.; He, F.; et al. Alterations in patients with first-episode depression in the eyes-open and eyes-closed conditions: A resting-state EEG study. IEEE Trans. Neural Syst. Rehabil. Eng. 2022, 30, 1019–1029. [Google Scholar] [CrossRef]
- Movahed, R.A.; Jahromi, G.P.; Shahyad, S.; Meftahi, G.H. A major depressive disorder classification framework based on EEG signals using statistical, spectral, wavelet, functional connectivity, and nonlinear analysis. J. Neurosci. Methods 2021, 358, 109209. [Google Scholar] [CrossRef]
- Rabinovich, M.I.; Muezzinoglu, M. Nonlinear dynamics of the brain: Emotion and cognition. Physics-Uspekhi 2010, 53, 357. [Google Scholar] [CrossRef]
- Nozari, E.; Bertolero, M.A.; Stiso, J.; Caciagli, L.; Cornblath, E.J.; He, X.; Mahadevan, A.S.; Pappas, G.J.; Bassett, D.S. Is the brain macroscopically linear? A system identification of resting state dynamics. arXiv 2020, arXiv:2012.12351. [Google Scholar]
- Ahmadlou, M.; Adeli, H.; Adeli, A. Spatiotemporal analysis of relative convergence of EEGs reveals differences between brain dynamics of depressive women and men. Clin. EEG Neurosci. 2013, 44, 175–181. [Google Scholar] [CrossRef]
- Tement, S.; Pahor, A.; Jaušovec, N. EEG alpha frequency correlates of burnout and depression: The role of gender. Biol. Psychol. 2016, 114, 1–12. [Google Scholar] [CrossRef]
- Stacey, J.E.; Crook-Rumsey, M.; Sumich, A.; Howard, C.J.; Crawford, T.; Livne, K.; Lenzoni, S.; Badham, S. Age differences in resting state EEG and their relation to eye movements and cognitive performance. Neuropsychologia 2021, 157, 107887. [Google Scholar] [CrossRef]
- Liu, Y.; Pu, C.; Xia, S.; Deng, D.; Wang, X.; Li, M. Machine learning approaches for diagnosing depression using EEG: A review. Transl. Neurosci. 2022, 13, 224–235. [Google Scholar] [CrossRef] [PubMed]
- Zhu, J.; Wang, Z.; Gong, T.; Zeng, S.; Li, X.; Hu, B.; Li, J.; Sun, S.; Zhang, L. An improved classification model for depression detection using EEG and eye tracking data. IEEE Trans. Nanobiosci. 2020, 19, 527–537. [Google Scholar] [CrossRef] [PubMed]
- Avots, E.; Jermakovs, K.; Bachmann, M.; Päeske, L.; Ozcinar, C.; Anbarjafari, G. Ensemble approach for detection of depression using EEG features. Entropy 2022, 24, 211. [Google Scholar] [CrossRef] [PubMed]
- Wu, C.T.; Huang, H.C.; Huang, S.; Chen, I.M.; Liao, S.C.; Chen, C.K.; Lin, C.; Lee, S.H.; Chen, M.H.; Tsai, C.F.; et al. Resting-state EEG signal for major depressive disorder detection: A systematic validation on a large and diverse dataset. Biosensors 2021, 11, 499. [Google Scholar] [CrossRef]
- Flint, C.; Cearns, M.; Opel, N.; Redlich, R.; Mehler, D.M.; Emden, D.; Winter, N.R.; Leenings, R.; Eickhoff, S.B.; Kircher, T.; et al. Systematic misestimation of machine learning performance in neuroimaging studies of depression. Neuropsychopharmacology 2021, 46, 1510–1517. [Google Scholar] [CrossRef]
- Niles, A.N.; Dour, H.J.; Stanton, A.L.; Roy-Byrne, P.P.; Stein, M.B.; Sullivan, G.; Sherbourne, C.D.; Rose, R.D.; Craske, M.G. Anxiety and depressive symptoms and medical illness among adults with anxiety disorders. J. Psychosom. Res. 2015, 78, 109–115. [Google Scholar] [CrossRef]
- Bierman, E.; Comijs, H.; Jonker, C.; Beekman, A. Symptoms of anxiety and depression in the course of cognitive decline. Dement. Geriatr. Cogn. Disord. 2007, 24, 213–219. [Google Scholar] [CrossRef]
- Judd, L.L.; Akiskal, H.S. Depressive episodes and symptoms dominate the longitudinal course of bipolar disorder. Curr. Psychiatry Rep. 2003, 5, 417–418. [Google Scholar] [CrossRef]
- Bartels, S.J.; Drake, R.E. Depressive symptoms in schizophrenia: Comprehensive differential diagnosis. Compr. Psychiatry 1988, 29, 467–483. [Google Scholar] [CrossRef]
- Mitchell, A.J.; Vaze, A.; Rao, S. Clinical diagnosis of depression in primary care: A meta-analysis. Lancet 2009, 374, 609–619. [Google Scholar] [CrossRef]
- Lynch, C.J.; Gunning, F.M.; Liston, C. Causes and consequences of diagnostic heterogeneity in depression: Paths to discovering novel biological depression subtypes. Biol. Psychiatry 2020, 88, 83–94. [Google Scholar] [CrossRef] [PubMed]
- Feczko, E.; Miranda-Dominguez, O.; Marr, M.; Graham, A.M.; Nigg, J.T.; Fair, D.A. The heterogeneity problem: Approaches to identify psychiatric subtypes. Trends Cogn. Sci. 2019, 23, 584–601. [Google Scholar] [CrossRef] [PubMed]
- Nguyen, T.D.; Harder, A.; Xiong, Y.; Kowalec, K.; Hägg, S.; Cai, N.; Kuja-Halkola, R.; Dalman, C.; Sullivan, P.F.; Lu, Y. Genetic heterogeneity and subtypes of major depression. Mol. Psychiatry 2022, 27, 1667–1675. [Google Scholar] [CrossRef] [PubMed]
- Drysdale, A.T.; Grosenick, L.; Downar, J.; Dunlop, K.; Mansouri, F.; Meng, Y.; Fetcho, R.N.; Zebley, B.; Oathes, D.J.; Etkin, A.; et al. Resting-state connectivity biomarkers define neurophysiological subtypes of depression. Nat. Med. 2017, 23, 28–38. [Google Scholar] [CrossRef] [PubMed]
- Ma, S.; Kang, L.; Guo, X.; Liu, H.; Yao, L.; Bai, H.; Chen, C.; Hu, M.; Du, L.; Du, H.; et al. Discrepancies between self-rated depression and observed depression severity: The effects of personality and dysfunctional attitudes. Gen. Hosp. Psychiatry 2021, 70, 25–30. [Google Scholar] [CrossRef]
- Acharya, U.R.; Oh, S.L.; Hagiwara, Y.; Tan, J.H.; Adeli, H.; Subha, D.P. Automated EEG-based screening of depression using deep convolutional neural network. Comput. Methods Programs Biomed. 2018, 161, 103–113. [Google Scholar] [CrossRef]
- Li, X.; La, R.; Wang, Y.; Niu, J.; Zeng, S.; Sun, S.; Zhu, J. EEG-based mild depression recognition using convolutional neural network. Med. Biol. Eng. Comput. 2019, 57, 1341–1352. [Google Scholar] [CrossRef]
- Uyulan, C.; Ergüzel, T.T.; Unubol, H.; Cebi, M.; Sayar, G.H.; Nezhad Asad, M.; Tarhan, N. Major depressive disorder classification based on different convolutional neural network models: Deep learning approach. Clin. EEG Neurosci. 2021, 52, 38–51. [Google Scholar] [CrossRef]
- Uyulan, C.; de la Salle, S.; Erguzel, T.T.; Lynn, E.; Blier, P.; Knott, V.; Adamson, M.M.; Zelka, M.; Tarhan, N. Depression diagnosis modeling with advanced computational methods: Frequency-domain eMVAR and deep learning. Clin. EEG Neurosci. 2022, 53, 24–36. [Google Scholar] [CrossRef]
- Rudin, C.; Chen, C.; Chen, Z.; Huang, H.; Semenova, L.; Zhong, C. Interpretable machine learning: Fundamental principles and 10 grand challenges. Stat. Surv. 2022, 16, 1–85. [Google Scholar] [CrossRef]


| Diagnosis | Female | Female Age (Mean ± Std) | Male | Male Age (Mean ± Std) | Total |
|---|---|---|---|---|---|
| Healthy | 32 | 35.88 ± 9.96 | 38 | 36.16 ± 11.35 | 70 |
| MDD | 37 | 36.86 ± 10.22 | 33 | 45.24 ± 12.10 | 70 |
| Model | Tuned Hyperparameters |
|---|---|
| Decision tree | Criterion: gini; maximum depth: 2; minimum samples per leaf: 1; minimum samples per split: 2; splitter: random |
| SVM | Kernel: rbf; regularization parameter (C): 1.0; gamma: scale |
| Random forest | Number of estimators: 50; criterion: gini; minimum samples per split: 10; minimum samples per leaf: 2 |
| KNN | Number of neighbors: 5; leaf size: 30; weights: uniform |
| XGBoost | Learning rate: 0.5; number of estimators: 50; maximum depth: 5; gamma: 3 |
| Model | All Features (570) | Selected Features (100) | ||
|---|---|---|---|---|
| Accuracy | F1-Score | Accuracy | F1-Score | |
| Decision tree | 0.78 | 0.77 | 0.78 | 0.79 |
| SVM | 0.65 | 0.63 | 0.73 | 0.72 |
| Random forest | 0.73 | 0.74 | 0.73 | 0.74 |
| KNN | 0.73 | 0.67 | 0.60 | 0.50 |
| XGBoost | 0.80 | 0.81 | 0.75 | 0.77 |
| Naive Bayes | 0.75 | 0.72 | 0.62 | 0.62 |
| Research | Dataset | Features | ML Methods | Accuracy |
|---|---|---|---|---|
| Mahato, Paul (2020) [24] | 30 MDD, 30 H | wavelet power, theta asymmetry (27 features total) | LR, SVM, NB, DT | SVM, 88.33% |
| Zhu et al. (2020) [67] | 17 MDD, 17 H | max PSD, sumpower, activity, complexity, mobility, variance, mean square, different entropies, correlation dimension, C0-complexity, Lempel-Ziv complexity (304 features total) | BayesNet, LR, RF, NB, SVM, KNN, CBEM | CBEM, 92.65% |
| Wu et al. (2021) [69] | 200 MDD, 200 H | band power, coherence, Higuchi Fractal Dimension, Katz Fractal Dimension (1859 features total, SBS wrapper feature selection) | KNN, LDA, SVM, CK-SVM | CK-SVM, 84.16% |
| Avots et al. (2022) [68] | 10 MDD, 10 H | relative band power, alpha power variability, spectral asymmetry index, Higuchi Fractal Dimension (162 features total, ReliefF feature selection) | SVM, LDA, NB, KNN, DT, ensemble | KNN, 95.00% |
| Our work | 70MDD, 70H | absolute and relative band power, spectral centroid, RWE, WE, Katz Fractal Dimension (570 features total, mutual information feature selection) | DT, SVM, RF, KNN, XGBoost | XGBoost, 80.00% |
Disclaimer/Publisher’s Note: The statements, opinions and data contained in all publications are solely those of the individual author(s) and contributor(s) and not of MDPI and/or the editor(s). MDPI and/or the editor(s) disclaim responsibility for any injury to people or property resulting from any ideas, methods, instructions or products referred to in the content. |
© 2025 by the authors. Licensee MDPI, Basel, Switzerland. This article is an open access article distributed under the terms and conditions of the Creative Commons Attribution (CC BY) license (https://creativecommons.org/licenses/by/4.0/).
Share and Cite
Mulc, D.; Vukojevic, J.; Kalafatic, E.; Cifrek, M.; Vidovic, D.; Jovic, A. Opportunities and Challenges for Clinical Practice in Detecting Depression Using EEG and Machine Learning. Sensors 2025, 25, 409. https://doi.org/10.3390/s25020409
Mulc D, Vukojevic J, Kalafatic E, Cifrek M, Vidovic D, Jovic A. Opportunities and Challenges for Clinical Practice in Detecting Depression Using EEG and Machine Learning. Sensors. 2025; 25(2):409. https://doi.org/10.3390/s25020409
Chicago/Turabian StyleMulc, Damir, Jaksa Vukojevic, Eda Kalafatic, Mario Cifrek, Domagoj Vidovic, and Alan Jovic. 2025. "Opportunities and Challenges for Clinical Practice in Detecting Depression Using EEG and Machine Learning" Sensors 25, no. 2: 409. https://doi.org/10.3390/s25020409
APA StyleMulc, D., Vukojevic, J., Kalafatic, E., Cifrek, M., Vidovic, D., & Jovic, A. (2025). Opportunities and Challenges for Clinical Practice in Detecting Depression Using EEG and Machine Learning. Sensors, 25(2), 409. https://doi.org/10.3390/s25020409