


Optimization of Imaging Reconnaissance Systems Using Super-Resolution: Efficiency Analysis in Interference Conditions


Abstract
1. Introduction
- Deliberate Interference—Intentional disruptions can be introduced through techniques such as masking or signal interference. For example, the use of camouflage [7] can make objects less visible or entirely undetectable to imaging systems. Signal disruptions, particularly in drone-based systems, can destabilize image feeds, cause signal loss, or result in other distortions that hinder the collection of accurate data [8];
- Lossy Compression—Bandwidth limitations in telecommunication channels [9] necessitate lossy compression in reconnaissance systems, which, depending on the compression level, can introduce artifacts leading to detail loss. This significantly reduces detection efficiency, especially for smaller or less distinct objects [10,11];
- Reduced efficiency due to increased response times and delays in critical decision-making [16];
- Greater strain on resources, as inappropriate actions triggered by false alarms divert attention from actual priorities. This can lead to reduced confidence in the technology and a tendency to disregard alerts;
- Loss of informational advantage, providing opportunities for unforeseen events or delays in addressing critical situations, ultimately compromising the effectiveness of operations [17].
- Reviewing and taxonomy of super-resolution models based on neural networks;
- Application of the super-resolution model in the detection of objects and analysis of its impact;
- Conducting a series of experiments with different types of interference under different scenarios;
- Evaluating the impact of SR technology on the selected detection model, identifying its limitations in a given application, and defining directions for further research.
2. Super-Resolution in Imaging Systems
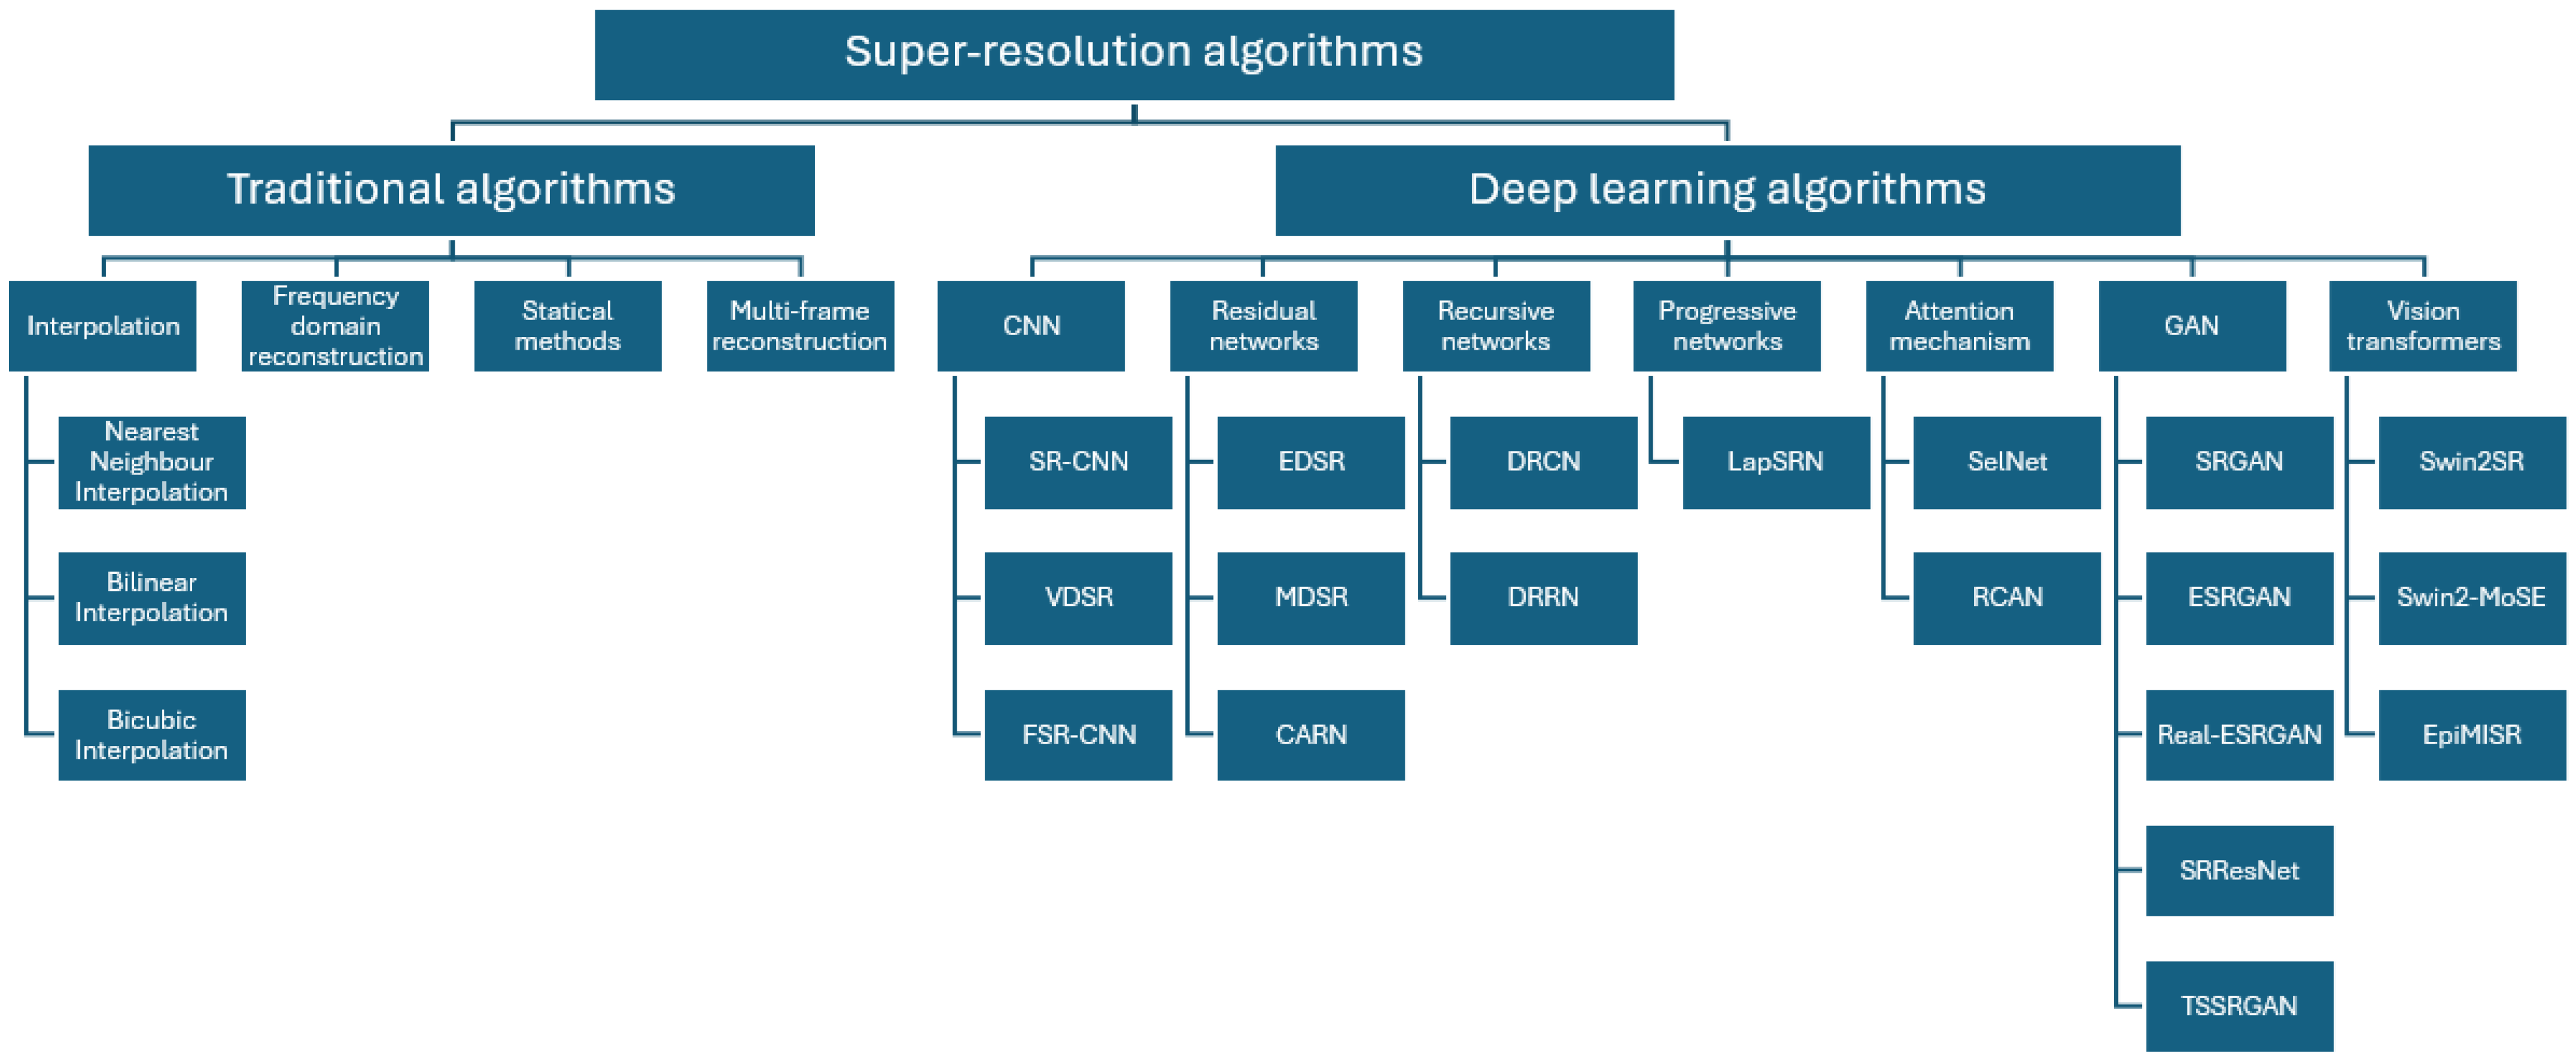
2.1. Overview of Super-Resolution Algorithms
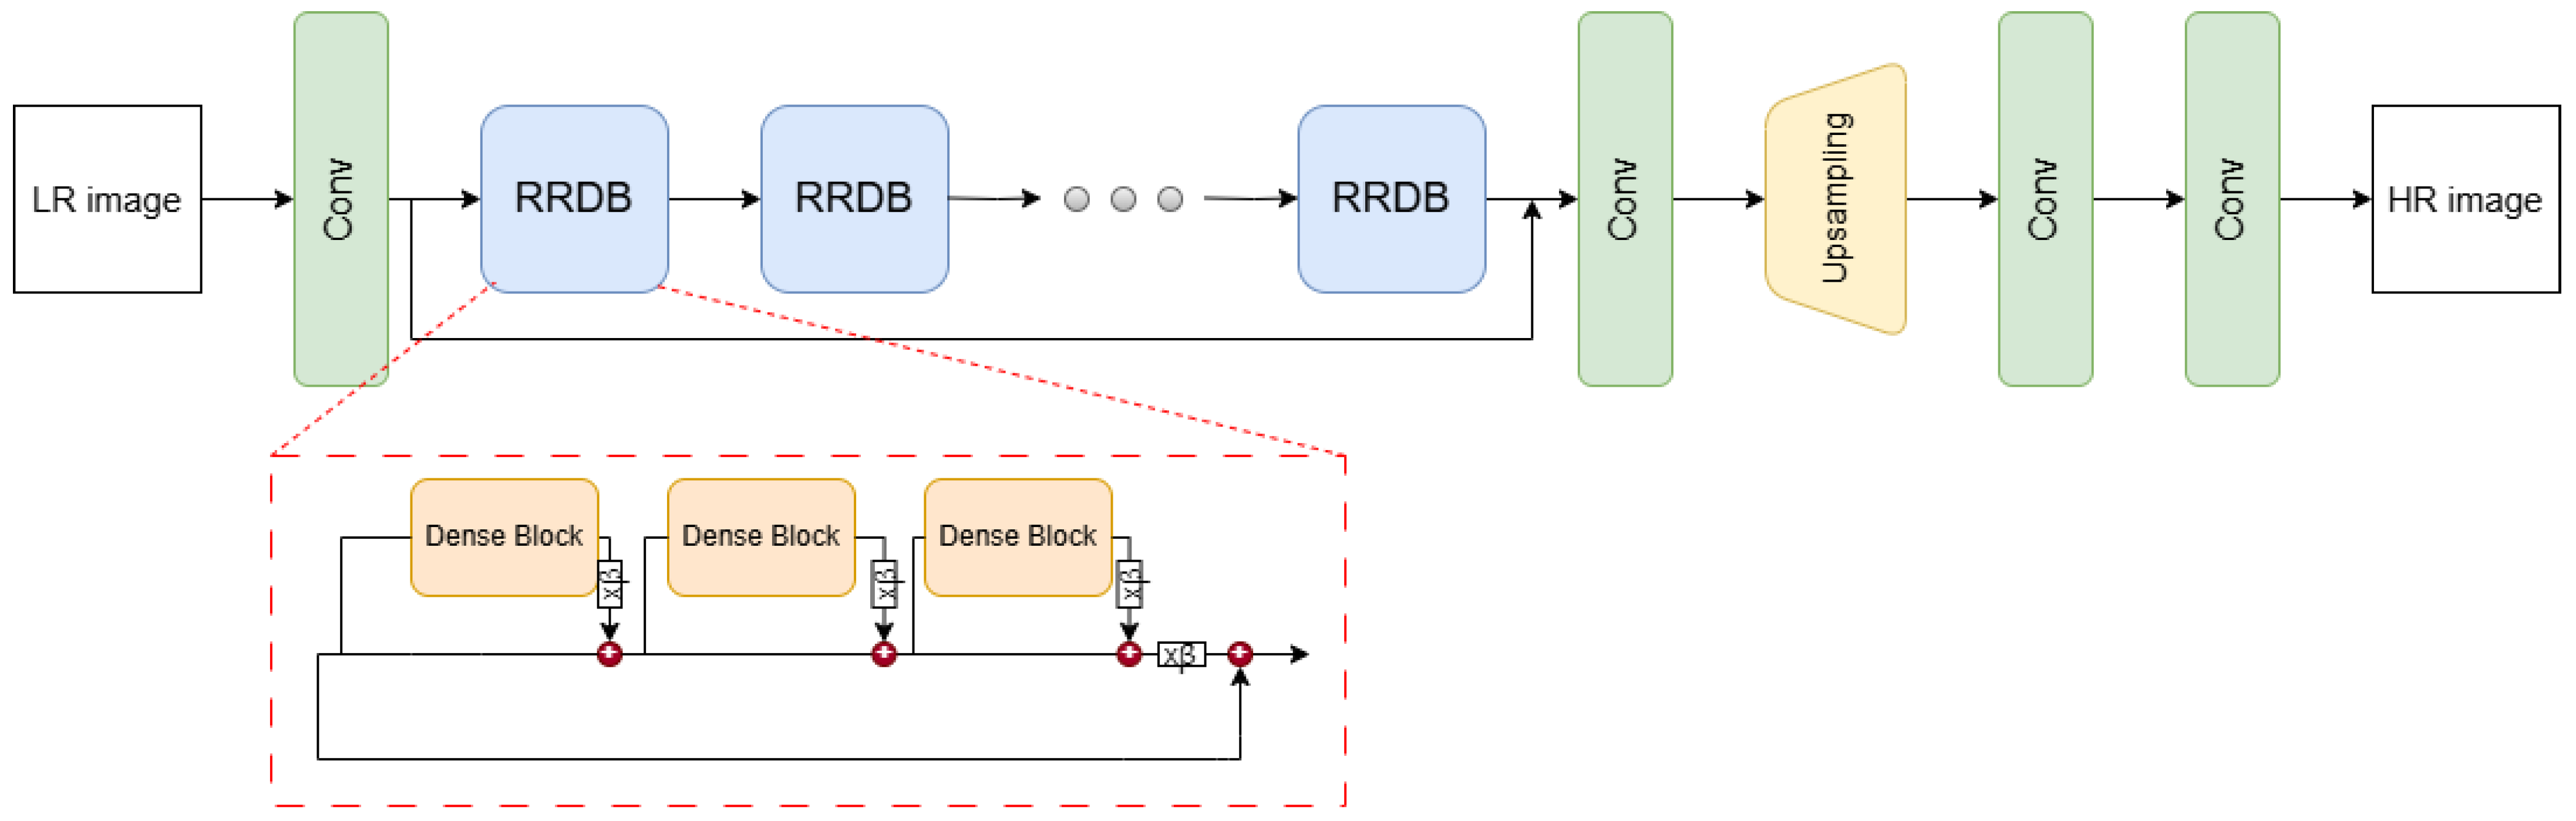
2.2. Real-ESRGAN Model
2.3. Related Works
3. Methodology
3.1. Military Aircraft Recognition Dataset
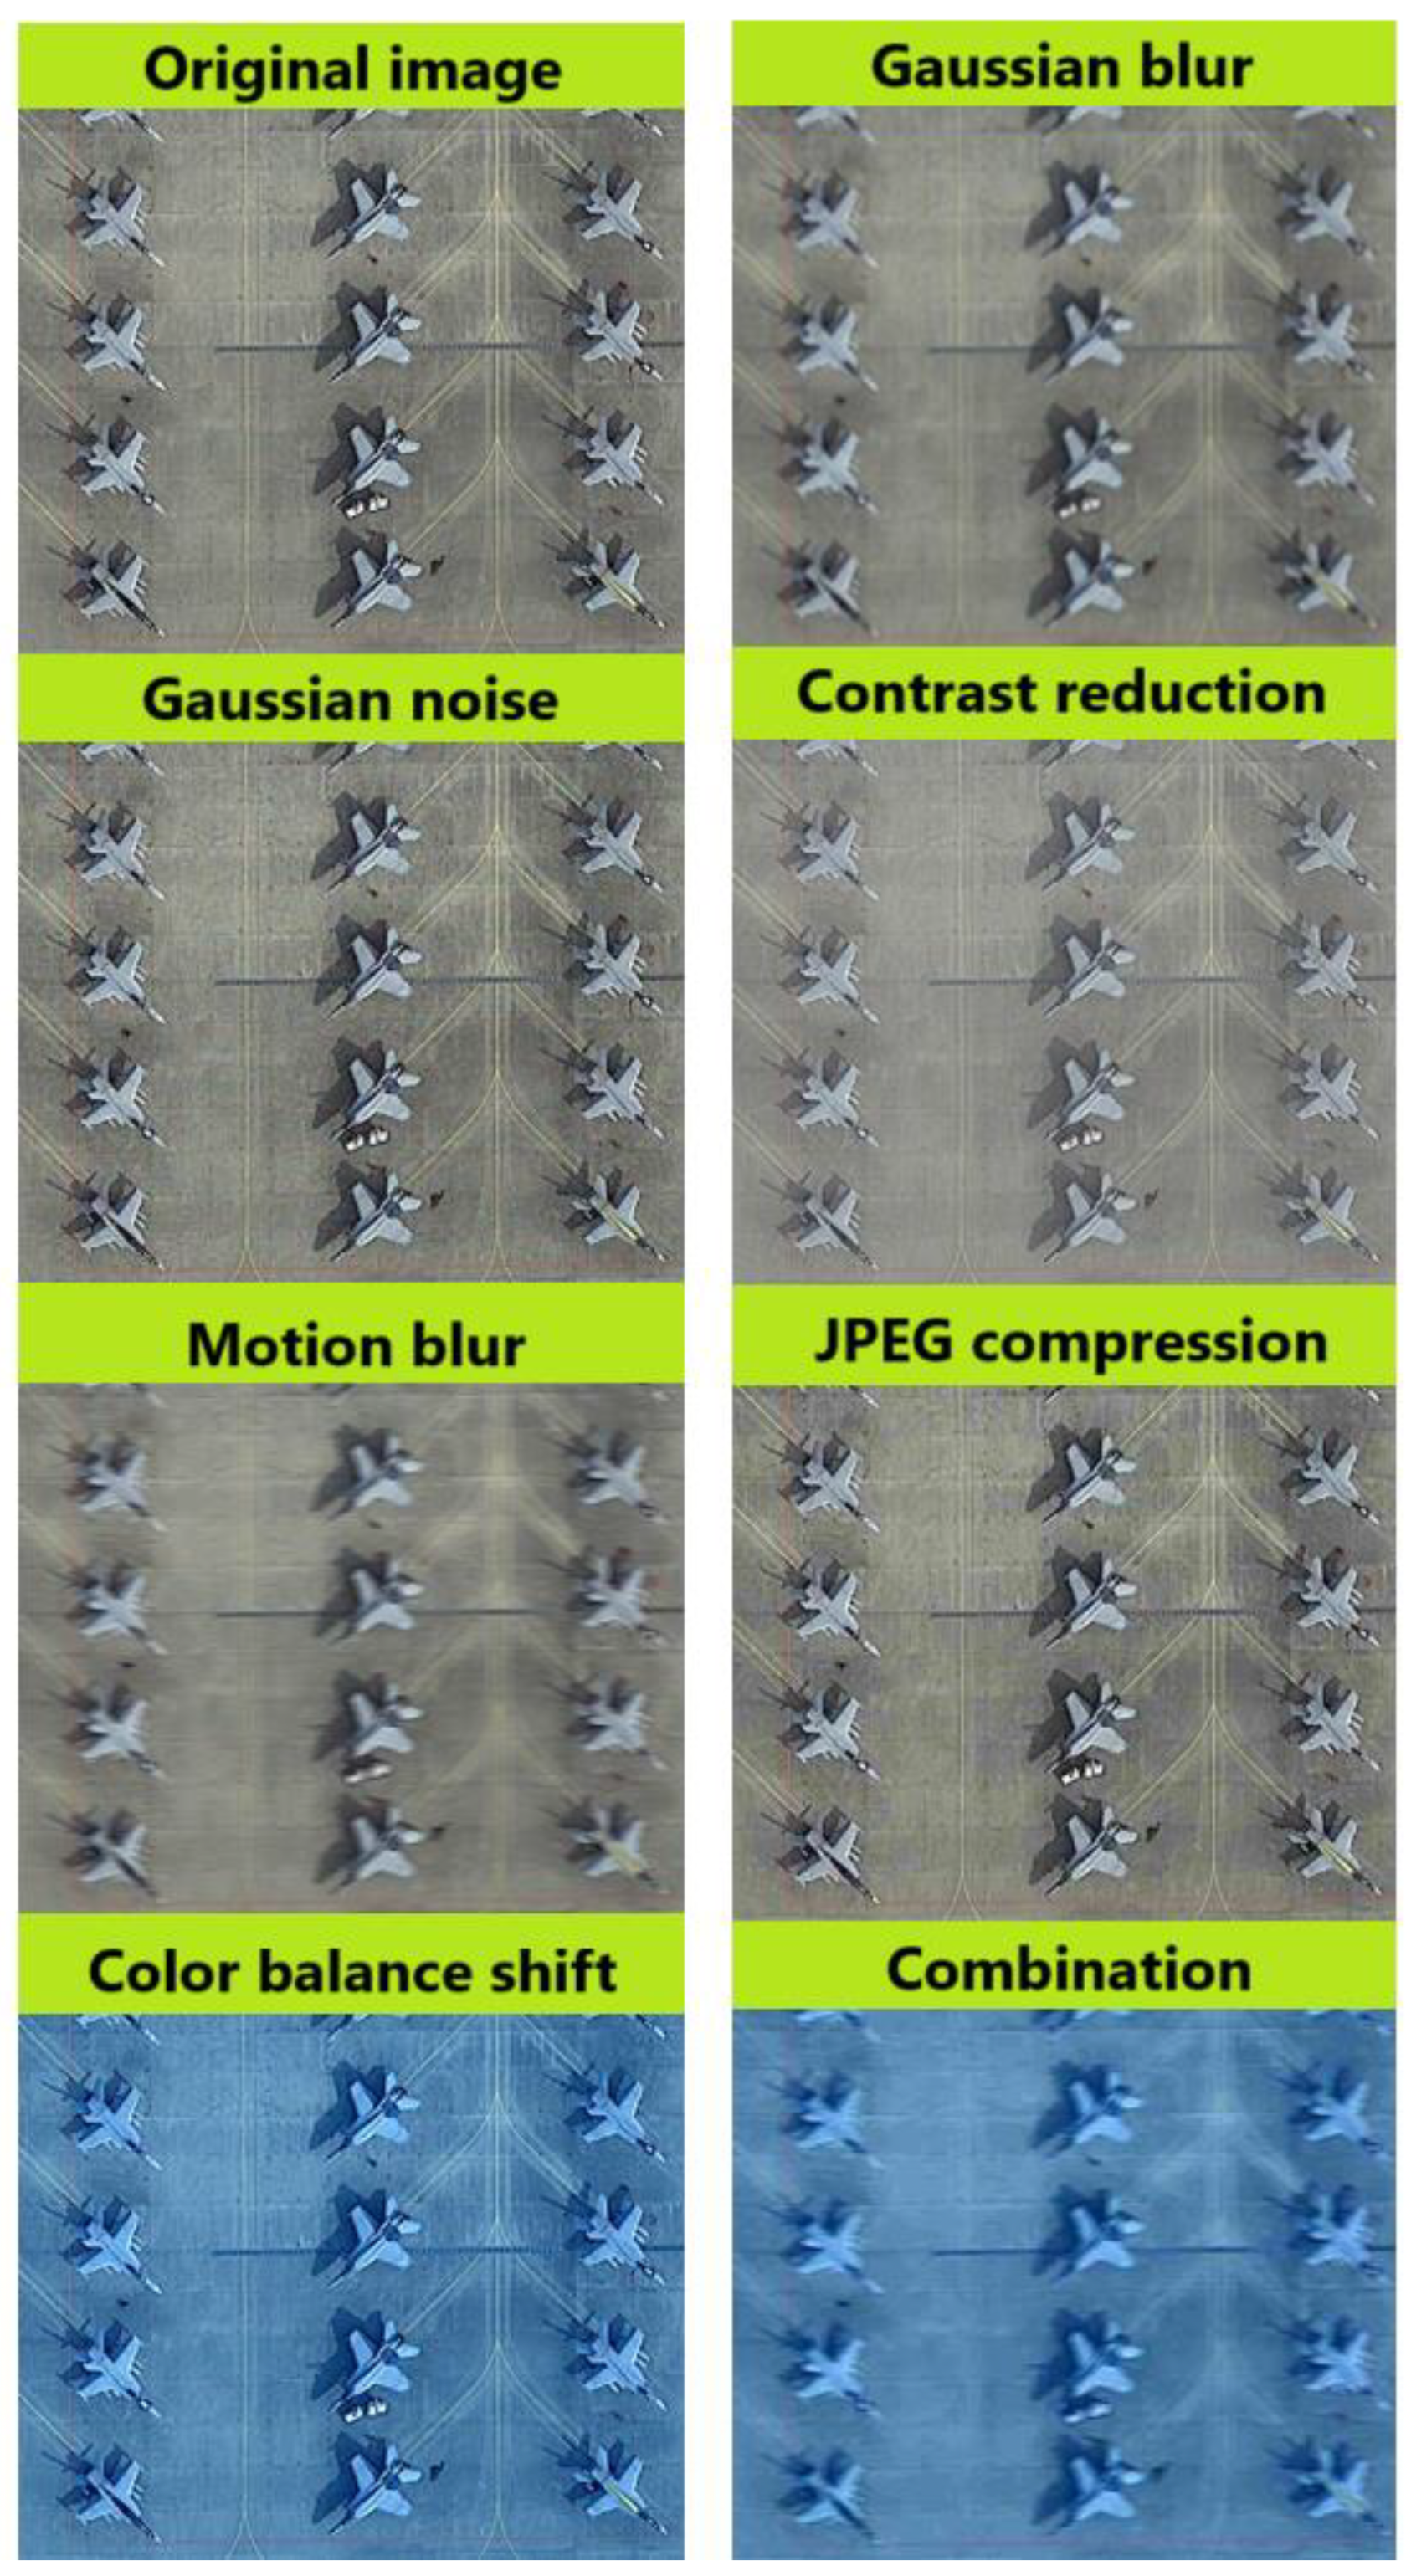
- Gaussian blur allows for the simulation of small camera vibrations or vehicle movements during image acquisition, which typically results in isotropic blurring. This type of blur is applied using a convolution kernel with a two-dimensional Gaussian distribution, where the intensity of the blur decreases symmetrically from the center. As a result, Gaussian blur affects all directions uniformly, preserving structural details to some extent. The kernel size used was (15, 15), which reflected well the level of interference in real conditions;
- Gaussian noise reflects interference from sensors or distortion that occurs during data transmission, which is common in long-distance monitoring systems. The following noise distribution parameters were used: mean = 0 and std = 25 to reflect real interference conditions;
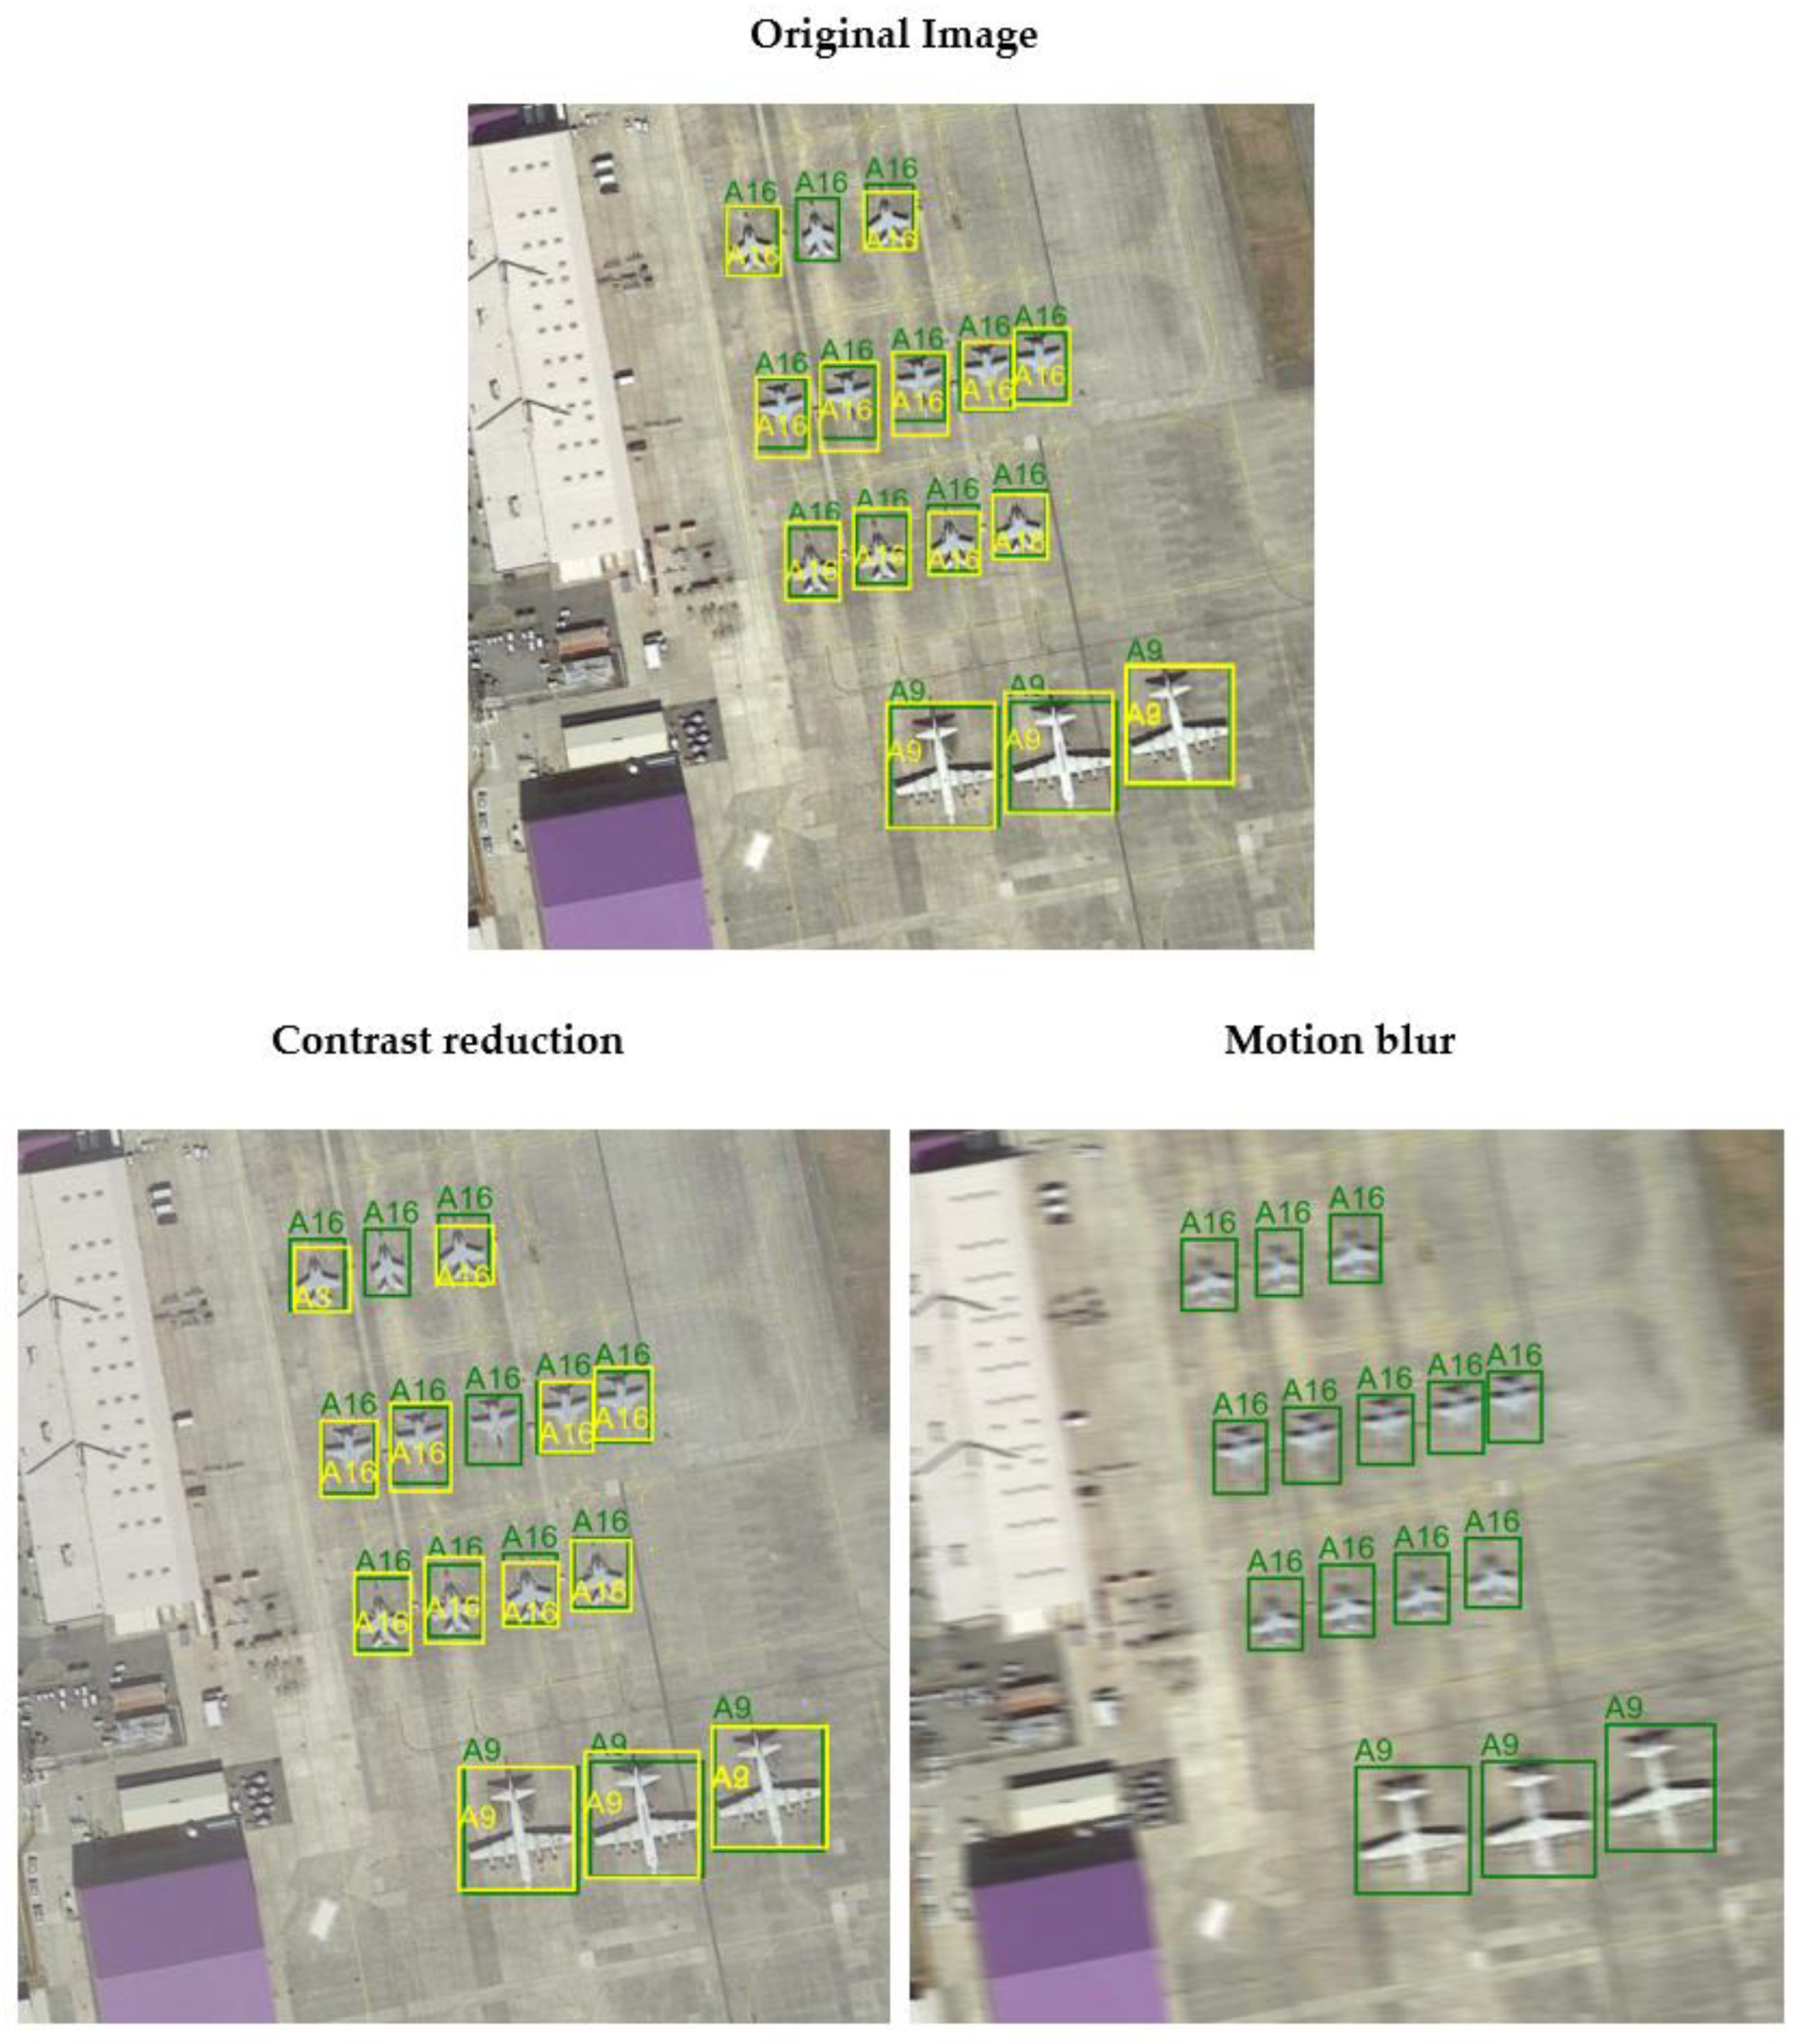
- Contrast reduction was used to simulate low-light conditions or the presence of fog, which affected the visibility of details;
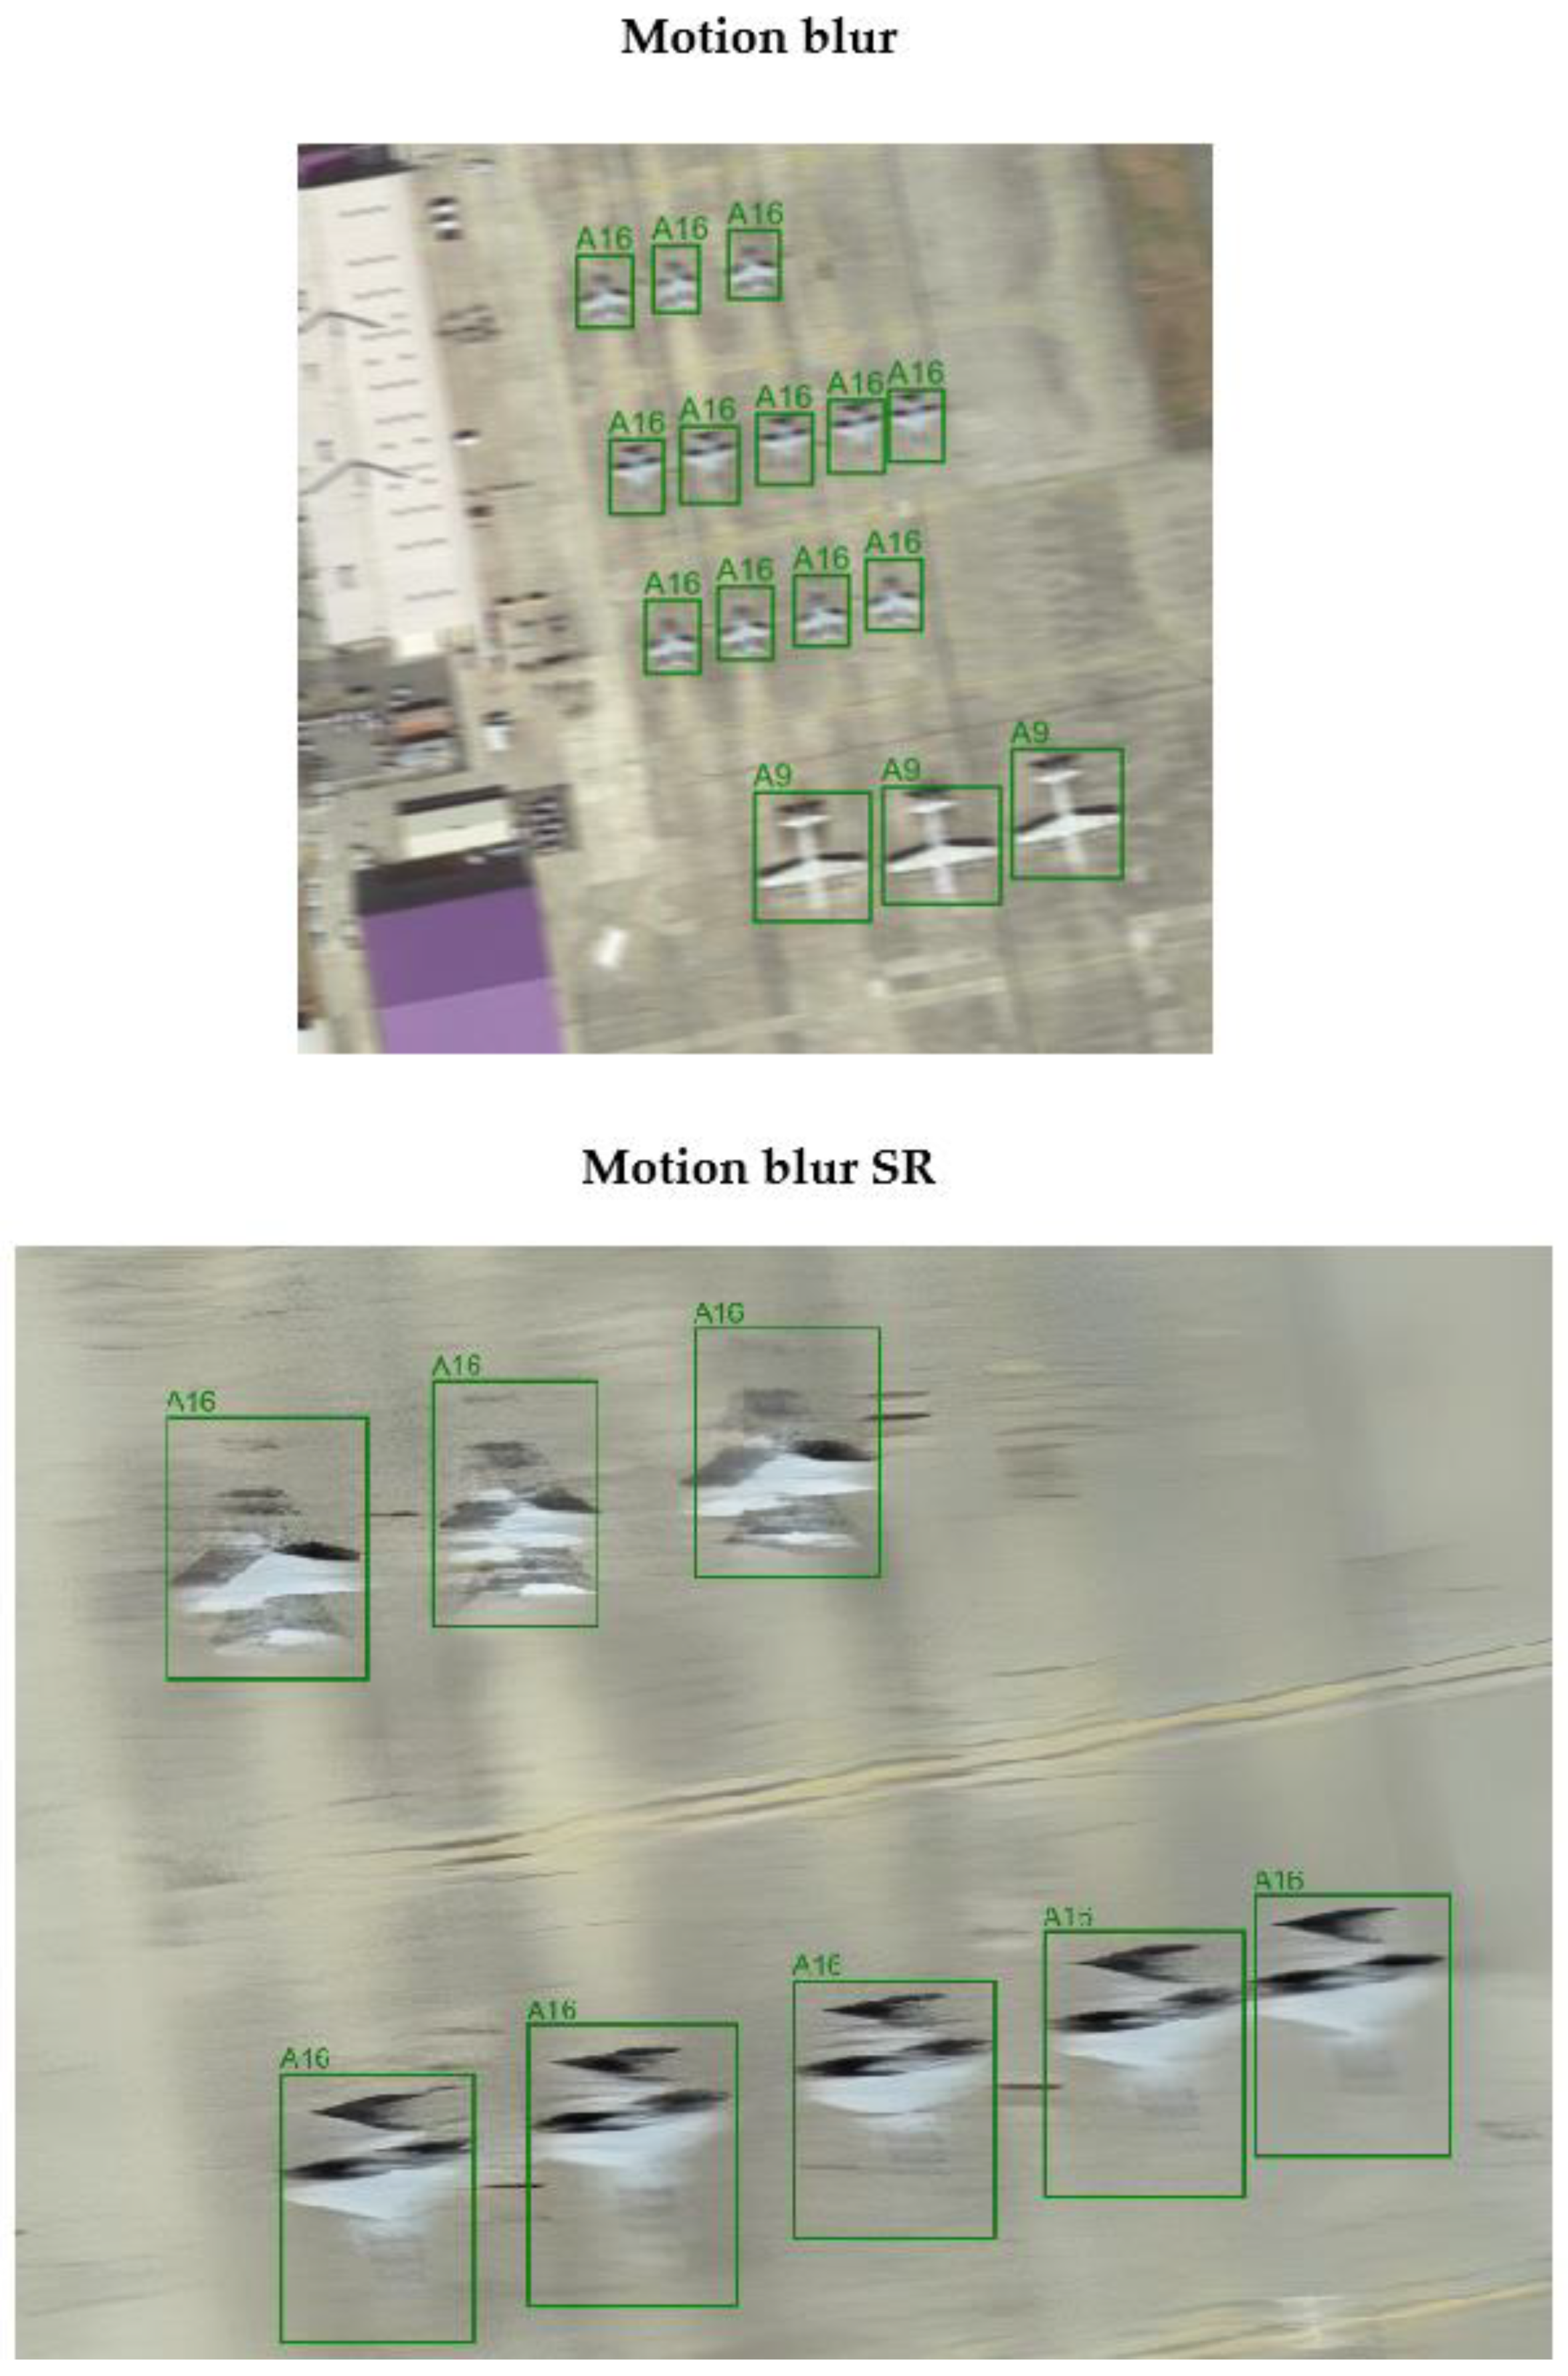
- Motion blur is used to simulate a situation in which a drone or aircraft moves while taking a picture; the camera is in continuous motion, or the captured object is moving rapidly during exposure. Unlike Gaussian blur, motion blur is directional with a linear kernel applied along a specific axis (e.g., horizontal or vertical), creating a smearing effect in one direction. The kernel size used was also (15, 15), but the directional nature of motion blur caused a much more pronounced degradation of image details compared to Gaussian blur. This difference arises because motion blur results in the loss of fine structural features in the direction of motion, making the degradation more challenging for both image restoration and object detection;
- JPEG compression artifact is one of the most widely used image compression processes, but depending on the degree of compression, it can introduce visible artifacts such as pixel blocks or loss of detail, which makes detection especially difficult, especially for small objects;
- Changing the color balance can simulate problems caused by incorrect camera calibration or varying atmospheric conditions, such as different light intensities. Problems with color balance can affect object recognition by causing unnatural coloring or tonality in the image.
3.2. Implementation and Application of SN Models
3.2.1. Detection Model
- Region Proposal Network (RPN)—a convolutional network responsible for generating potential regions of interest in feature maps;
- ROI Pooling (Region of Interest Pooling)—a mechanism that transforms potential regions of interest to a uniform size.
- number of epochs—50;
- optimizer—SGD with lr = 0.005, momentum = 0.9, weight decay = 0.0005;
- batch size—train batch size = 4; validation batch size = 2.
3.2.2. Super-Resolution Model
3.3. Description of Experimental Stages
- Training and evaluation of the detection model on the original training dataset. The detection model was trained and tested on the original data without any additional modifications or distortions. The purpose of this stage was to obtain reference values for detection metrics, which served as a baseline for assessing the impact of subsequent image modifications;
- Implementation of artifacts and distortions in test images and conducting detection. Artifacts were applied to the original test images, as described earlier. Object detection was then performed using the model trained in the first step. The results were compared with the reference results to evaluate how distortions affect the performance of the detection mode;
- Enhancing resolution and improving the quality of distorted images. A super-resolution model was applied to increase the resolution and improve the visual quality of distorted images. After image reconstruction, detection was performed again using the model from the first step. The results were compared with earlier results on images without quality improvement and with the reference values to assess whether the super-resolution technique enhanced the detection model’s performance under challenging conditions;
- Increasing the resolution of the original dataset and retraining the detection model. The original training images were processed using the super-resolution model to enhance their resolution. Subsequently, the Faster R-CNN model underwent fine-tuning, resulting in a new detection model. The results of the newly trained model were compared with those obtained by the baseline model from the first step to determine how higher image resolution impacted detection accuracy during the model training phase;
- Detection of Distorted and Restored Images Using the New Detection Model. In the final experiment, the model trained on high-resolution images (from the fourth step) was tested on distorted test images and on distorted images restored using super-resolution. The goal was to compare detection results for both sets of images—distorted and reconstructed—using the new model. This allowed for evaluating how a model adapted to high-resolution, high-quality images performs in detecting objects under distorted and restored conditions, and the impact of image reconstruction on detection effectiveness.
3.4. Experimental Conditions and Metrics
- Precision—The ratio of correctly detected objects of a given class to all detected objects. A high precision value indicates a low number of false detections, which translates to minimizing false alarms;
- Recall—The ratio of correctly detected objects of a given class to all objects of that class that this model should have detected. A high recall value signifies that this model successfully detects most objects, which is crucial in applications such as security systems;
- mAP (Mean Average Precision)—This metric represents the mean of the Average Precision (AP) values calculated for each class. AP measures the area under the precision–recall curve, computed individually for each class at various levels of the IoU (Intersection over Union) parameter. IoU indicates the extent to which the predicted detection area overlaps with the actual area. This metric accounts for both precision and recall, enabling a holistic assessment of the model’s performance.
4. Results
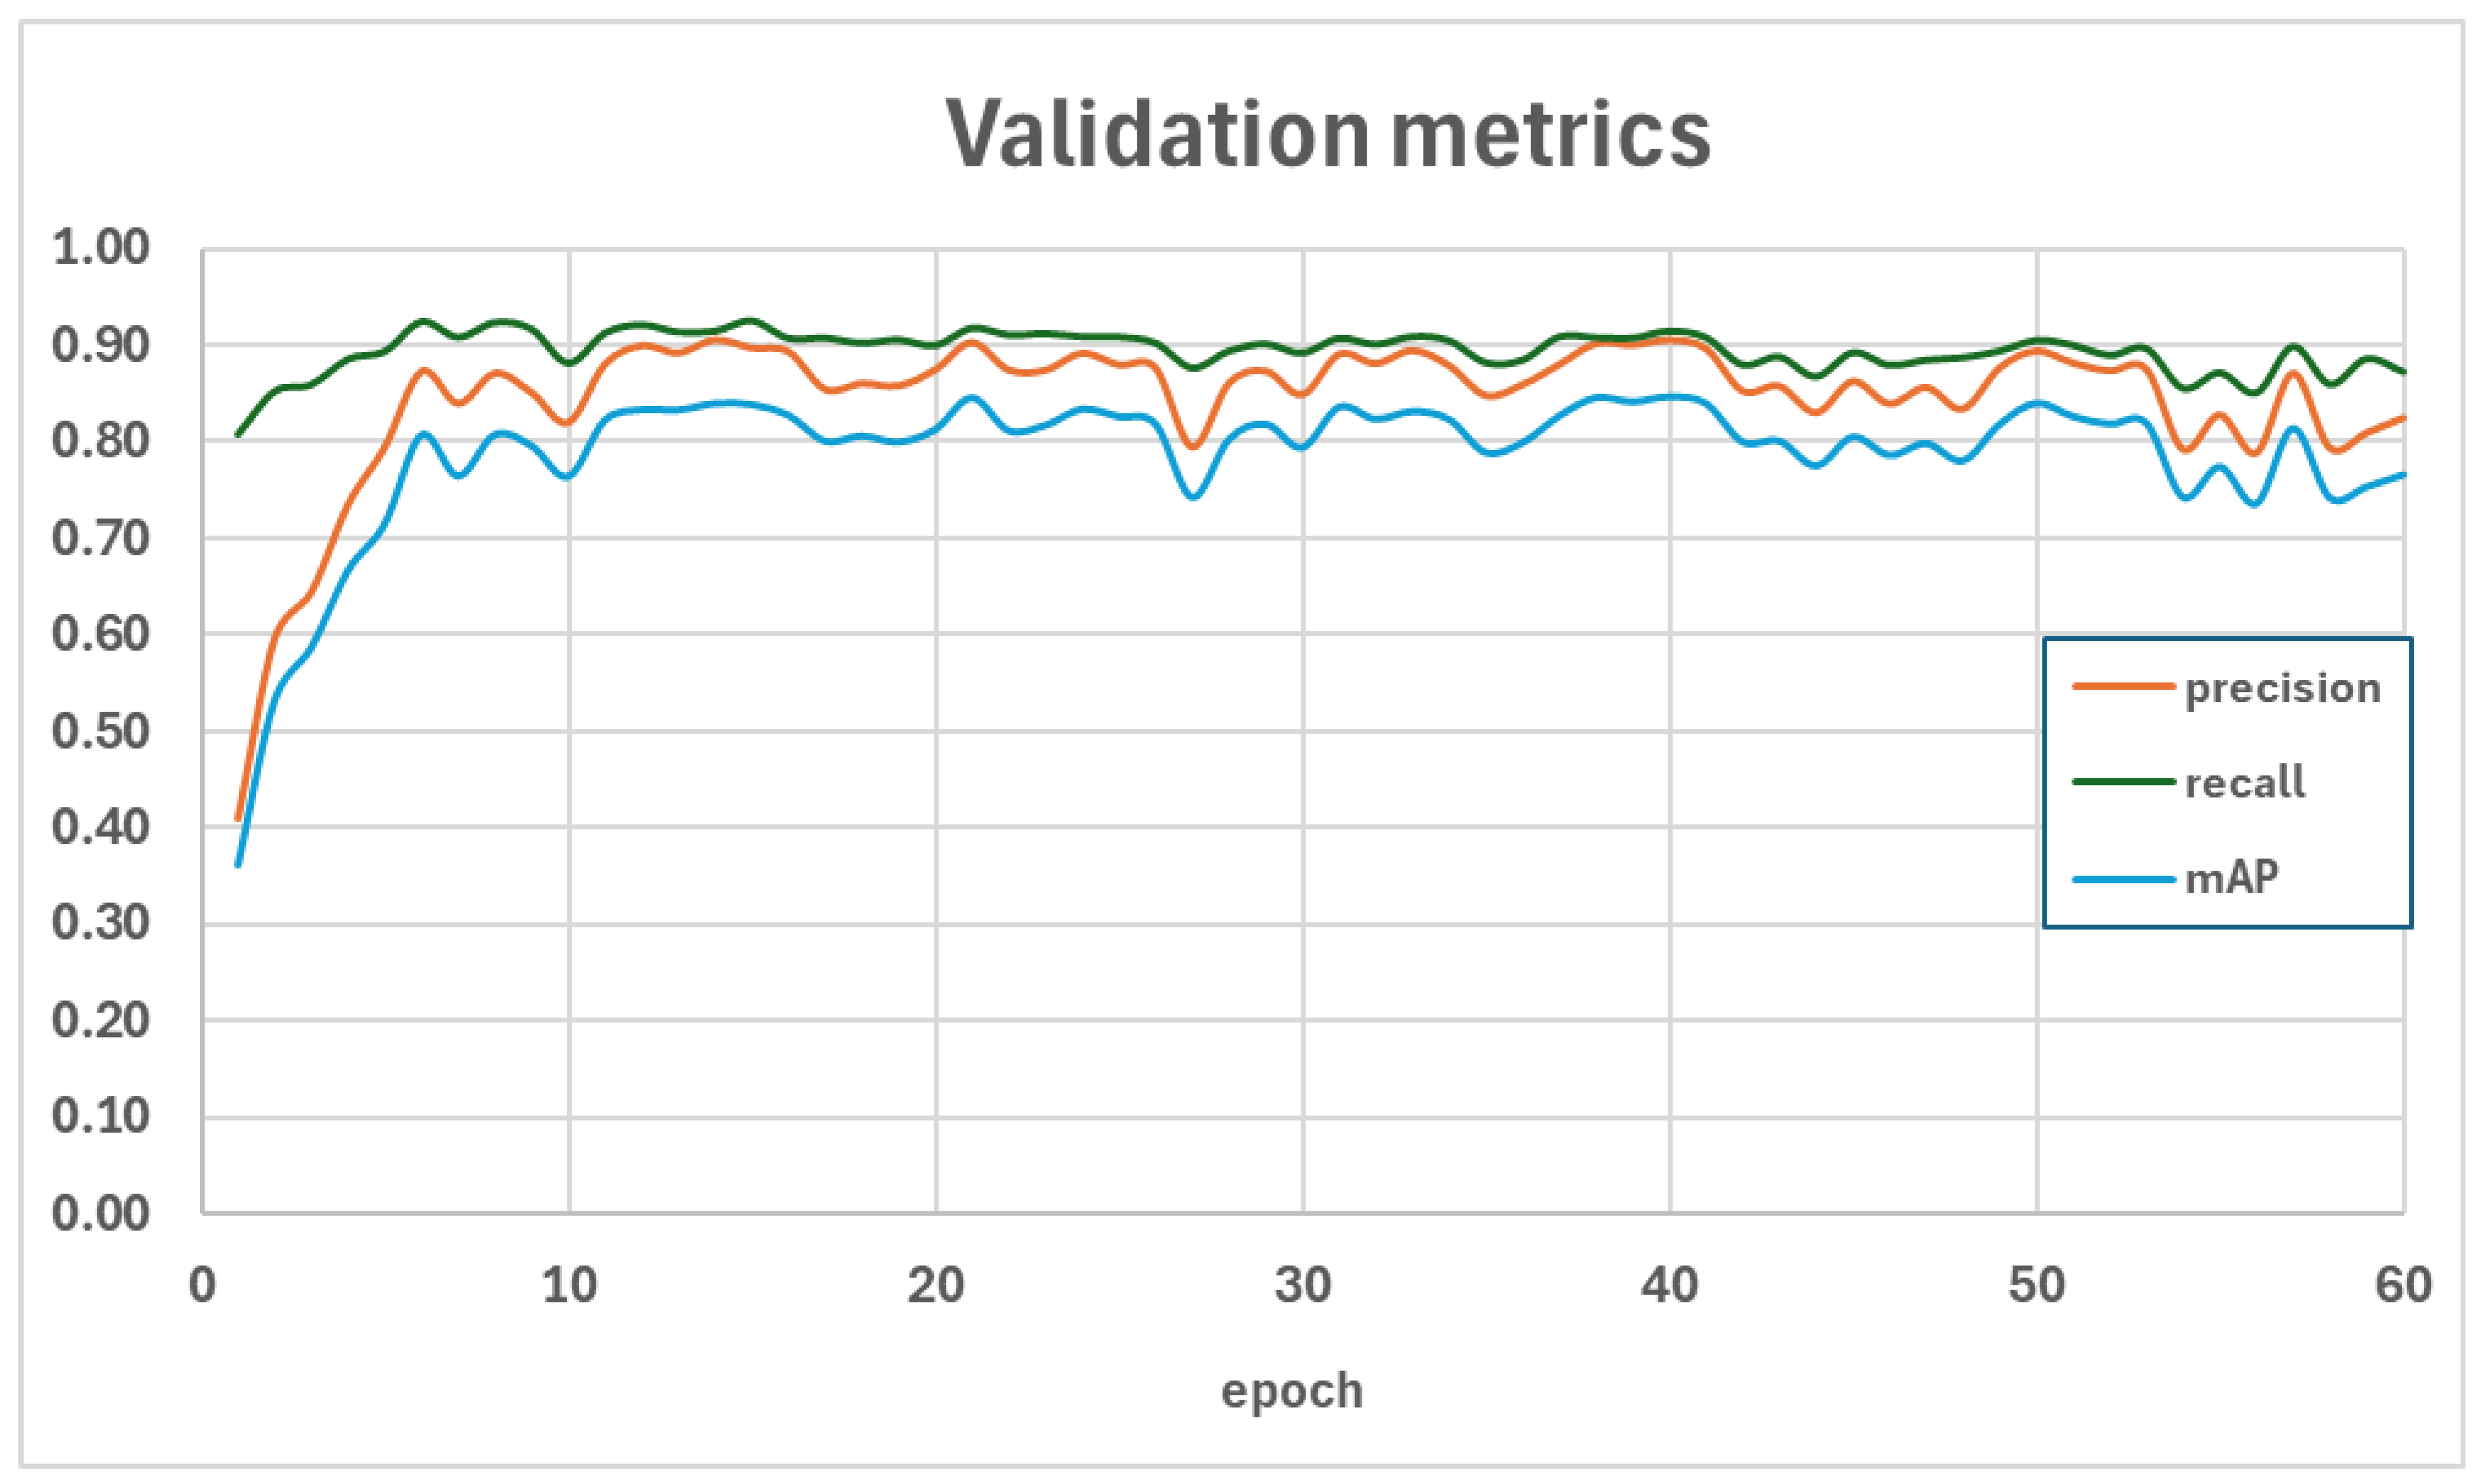
4.1. Training and Evaluation of the Reference Model
4.2. Evaluation of Distorted Images
4.3. Evaluation of Images After Applying Super-Resolution
4.4. Training and Evaluation of This Model Using the Resolution-Improved Data
4.5. Evaluation of Distorted and Restored Images
5. Discussion
5.1. Limitations of This Model
5.2. Super-Resolution Versus Data Augmentation
5.3. Limitations of Super-Resolution Technology
6. Summary
- Further improvement of super-resolution models, particularly in handling extreme distortions such as motion blur, complex combinations of distortions characteristic of real-world conditions, less common types of distortions, such as occlusion or environmental factors, and distortions of varying intensity levels, to provide a more comprehensive analysis;
- Combining super-resolution with other image-processing techniques, such as adaptive filters, to verify whether combining SR methods with traditional image enhancement techniques provides higher detection efficiency for very degrading types of distortions;
- Investigating the integration of super-resolution with advanced detection algorithms, such as models incorporating attention mechanisms such as Transformer-based architectures (e.g., DETR or YOLOv7 with attention layers), and considering tuning SR models to specific research problems;
- Developing lightweight SR models optimized for real-time applications, especially in resource-constrained environments—optimization for computational efficiency and developing SR models specifically tailored for deployment in low-resource environments, such as edge devices, drones, or satellite systems, where power consumption and memory are limited.
Author Contributions
Funding
Institutional Review Board Statement
Informed Consent Statement
Data Availability Statement
Conflicts of Interest
References
- Sutherland, B. Modern Warfare, Intelligence and Deterrence: The Technology That Is Transforming Them; Profile Books: London, UK, 2014. [Google Scholar]
- Butt, M.A.; Voronkov, G.S.; Grakhova, E.P.; Kutluyarov, R.V.; Kazanskiy, N.L.; Khonina, S.N. Environmental Monitoring: A Comprehensive Review on Optical Waveguide and Fiber-Based Sensors. Biosensors 2022, 12, 1038. [Google Scholar] [CrossRef] [PubMed]
- Greenwood, W.W.; Lynch, J.P.; Zekkos, D. Applications of UAVs in Civil Infrastructure. J. Infrastruct. Syst. 2019, 25, 04019002. [Google Scholar] [CrossRef]
- Mitaritonna, A.; Abásolo, M.J. Improving Situational Awareness in Military Operations Using Augmented Reality. In Proceedings of the 23rd International Conference in Central Europe on Computer Graphics, Visualization and Computer Vision, Pilsen, Czech Republic, 8–12 June 2015. [Google Scholar]
- Munir, A.; Siddiqui, A.J.; Anwar, S.; El-Maleh, A.; Khan, A.H.; Rehman, A. Impact of Adverse Weather and Image Distortions on Vision-Based UAV Detection: A Performance Evaluation of Deep Learning Models. Drones 2024, 8, 638. [Google Scholar] [CrossRef]
- Eso, E.; Burton, A.; Hassan, N.B.; Abadi, M.M.; Ghassemlooy, Z.; Zvanovec, S. Experimental Investigation of the Effects of Fog on Optical Camera-Based VLC for a Vehicular Environment. In Proceedings of the 2019 15th International Conference on Telecommunications (ConTEL), Graz, Austria, 3–5 July 2019; pp. 1–5. [Google Scholar] [CrossRef]
- White, A. Camouflage and Concealment. Asian Military Review. Available online: https://www.asianmilitaryreview.com/2024/06/camouflage-and-concealment/ (accessed on 8 November 2024).
- Dobija, K. Countering Unmanned Aerial Systems (UAS) in Military Operations. Saf. Def. 2023, 9, 74–82. [Google Scholar] [CrossRef]
- Kosek-Szott, K.; Natkaniec, M.; Prasnal, L. IEEE 802.11aa Intra-AC Prioritization—A New Method of Increasing the Granularity of Traffic Prioritization in WLANs. In Proceedings of the 2014 IEEE Symposium on Computers and Communications (ISCC), Funchal, Portugal, 23–26 June 2014; IEEE: New York, NY, USA, 2014; pp. 1–6. [Google Scholar] [CrossRef]
- Kong, L.; Dai, R. Object-Detection-Based Video Compression for Wireless Surveillance Systems. IEEE MultiMedia 2017, 24, 76–85. [Google Scholar] [CrossRef]
- O’Byrne, M.; Vibhoothi; Sugrue, M.; Kokaram, A. Impact of Video Compression on the Performance of Object Detection Systems for Surveillance Applications. arXiv 2022. [Google Scholar] [CrossRef]
- Sieberth, T.; Wackrow, R.; Chandler, J.H. Uav Image Blur—Its Influence and Ways to Correct It. Int. Arch. Photogramm. Remote Sens. Spat. Inf. Sci. 2015, XL-1-W4, 33–39. [Google Scholar] [CrossRef]
- Cui, H.-X.; Gui, D.-Z.; Li, Z. Research on Image Motion Blur for Low Altitude Remote Sensing. Inf. Technol. J. 2013, 12, 7096–7100. [Google Scholar] [CrossRef]
- Ratches, J.A. Review of Current Aided/Automatic Target Acquisition Technology for Military Target Acquisition Tasks. OE 2011, 50, 072001. [Google Scholar] [CrossRef]
- Goldschmidt, P. Managing the False Alarms: A Framework for Assurance and Verification of Surveillance Monitoring. Inf. Syst. Front. 2007, 9, 541–556. [Google Scholar] [CrossRef]
- Žigulić, N.; Glučina, M.; Lorencin, I.; Matika, D. Military Decision-Making Process Enhanced by Image Detection. Information 2024, 15, 11. [Google Scholar] [CrossRef]
- Bebber, R.J. Treating Information as a Strategic Resource to Win the “Information War”. Orbis 2017, 61, 394–403. [Google Scholar] [CrossRef]
- Iran Air flight 655|Background, Events, Investigation, & Facts|Britannica. Available online: https://www.britannica.com/event/Iran-Air-flight-655 (accessed on 7 November 2024).
- Bistron, M.; Piotrowski, Z. Artificial Intelligence Applications in Military Systems and Their Influence on Sense of Security of Citizens. Electronics 2021, 10, 871. [Google Scholar] [CrossRef]
- Dong, C.; Loy, C.C.; He, K.; Tang, X. Image Super-Resolution Using Deep Convolutional Networks. IEEE Trans. Pattern Anal. Mach. Intell. 2016, 38, 295–307. [Google Scholar] [CrossRef]
- Greenspan, H. Super-Resolution in Medical Imaging. Comput. J. 2009, 52, 43–63. [Google Scholar] [CrossRef]
- Kumar, R.; Kumbharkar, P.; Vanam, S.; Sharma, S. Medical Images Classification Using Deep Learning: A Survey|Multimedia Tools and Applications. Multimed. Tools Appl. 2024, 83, 19683–19728. [Google Scholar] [CrossRef]
- Ali, M.D.; Saleem, A.; Elahi, H.; Khan, M.A.; Khan, M.I.; Yaqoob, M.M.; Farooq Khattak, U.; Al-Rasheed, A. Breast Cancer Classification through Meta-Learning Ensemble Technique Using Convolution Neural Networks. Diagnostics 2023, 13, 2242. [Google Scholar] [CrossRef] [PubMed]
- Bistroń, M.; Piotrowski, Z. Comparison of Machine Learning Algorithms Used for Skin Cancer Diagnosis. Appl. Sci. 2022, 12, 9960. [Google Scholar] [CrossRef]
- Bechelli, S.; Delhommelle, J. Machine Learning and Deep Learning Algorithms for Skin Cancer Classification from Dermoscopic Images. Bioengineering 2022, 9, 97. [Google Scholar] [CrossRef]
- Chacua, B.; García, I.; Rosero, P.; Suárez, L.; Ramírez, I.; Simbaña, Z.; Pusda, M. People Identification through Facial Recognition Using Deep Learning. In Proceedings of the 2019 IEEE Latin American Conference on Computational Intelligence (LA-CCI), Guayaquil, Ecuador, 11–15 November 2019; IEEE: New York, NY, USA, 2019; pp. 1–6. [Google Scholar] [CrossRef]
- Mavrokapnidis, D.; Mohammadi, N.; Taylor, J. Community Dynamics in Smart City Digital Twins: A Computer Vision-Based Approach for Monitoring and Forecasting Collective Urban Hazard Exposure. In Proceedings of the 54th Hawaii International Conference on System Sciences, Kauai, Hawaii, USA, 5 January 2021. [Google Scholar]
- Tippannavar, S.S.; SD, Y. Real-Time Vehicle Identification for Improving the Traffic Management System-A Review. J. Trends Comput. Sci. Smart Technol. 2023, 5, 323–342. [Google Scholar] [CrossRef]
- Li, K.; Deng, R.; Cheng, Y.; Hu, R.; Shen, K. Research on Vehicle Detection and Recognition Based on Infrared Image and Feature Extraction. Mob. Inf. Syst. 2022, 2022, 6154614. [Google Scholar] [CrossRef]
- Czeczot, G.; Rojek, I.; Mikołajewski, D.; Sangho, B. AI in IIoT Management of Cybersecurity for Industry 4.0 and Industry 5.0 Purposes. Electronics 2023, 12, 3800. [Google Scholar] [CrossRef]
- Lenarczyk, P.; Piotrowski, Z. Parallel Blind Digital Image Watermarking in Spatial and Frequency Domains. Telecommun. Syst. 2013, 54, 287–303. [Google Scholar] [CrossRef]
- Zhong, X.; Das, A.; Alrasheedi, F.; Tanvir, A. A Brief, In-Depth Survey of Deep Learning-Based Image Watermarking. Appl. Sci. 2023, 13, 11852. [Google Scholar] [CrossRef]
- Bistroń, M.; Piotrowski, Z. Efficient Video Watermarking Algorithm Based on Convolutional Neural Networks with Entropy-Based Information Mapper. Entropy 2023, 25, 284. [Google Scholar] [CrossRef] [PubMed]
- Villagran-Vizcarra, D.C.; Luviano-Cruz, D.; Pérez-Domínguez, L.A.; Méndez-González, L.C.; Garcia-Luna, F. Applications Analyses, Challenges and Development of Augmented Reality in Education, Industry, Marketing, Medicine, and Entertainment. Appl. Sci. 2023, 13, 2766. [Google Scholar] [CrossRef]
- Yang, W.; Zhang, X.; Tian, Y.; Wang, W.; Xue, J.-H. Deep Learning for Single Image Super-Resolution: A Brief Review. arXiv 2019. [Google Scholar] [CrossRef]
- Rukundo, O.; Cao, H. Nearest Neighbor Value Interpolation. arXiv 2019. [Google Scholar] [CrossRef]
- Kirkland, E.J. Bilinear Interpolation. In Advanced Computing in Electron Microscopy; Kirkland, E.J., Ed.; Springer: Boston, MA, USA, 2010; pp. 261–263. [Google Scholar] [CrossRef]
- Zhu, Y.; Dai, Y.; Han, K.; Wang, J.; Hu, J. An Efficient Bicubic Interpolation Implementation for Real-Time Image Processing Using Hybrid Computing. J. Real-Time Image Process. 2022, 19, 1211–1223. [Google Scholar] [CrossRef]
- Jiang, H.; Paulsen, K.D.; Osterberg, U.L.; Pogue, B.W.; Patterson, M.S. Optical Image Reconstruction Using Frequency-Domain Data: Simulations and Experiments. J. Opt. Soc. Am. A JOSAA 1996, 13, 253–266. [Google Scholar] [CrossRef]
- Yavuz, M.; Fessler, J.A. Statistical Image Reconstruction Methods for Randoms-Precorrected PET Scans. Med. Image Anal. 1998, 2, 369–378. [Google Scholar] [CrossRef] [PubMed]
- Simoncelli, E.P. Statistical Models for Images: Compression, Restoration and Synthesis; IEEE Computer Society: Washington, DC, USA, 1997; pp. 673–678. [Google Scholar] [CrossRef]
- Li, X.; Hu, Y.; Gao, X.; Tao, D.; Ning, B. A Multi-Frame Image Super-Resolution Method. Signal Process. 2010, 90, 405–414. [Google Scholar] [CrossRef]
- Kim, J.; Lee, J.K.; Lee, K.M. Accurate Image Super-Resolution Using Very Deep Convolutional Networks. arXiv 2016. [Google Scholar] [CrossRef]
- Dong, C.; Loy, C.C.; Tang, X. Accelerating the Super-Resolution Convolutional Neural Network. arXiv 2016. [Google Scholar] [CrossRef]
- Lim, B.; Son, S.; Kim, H.; Nah, S.; Lee, K.M. Enhanced Deep Residual Networks for Single Image Super-Resolution. In Proceedings of the 2017 IEEE Conference on Computer Vision and Pattern Recognition Workshops (CVPRW), Honolulu, HI, USA, 21–26 July 2017; IEEE: Honolulu, HI, USA, 2017; pp. 1132–1140. [Google Scholar] [CrossRef]
- Ahn, N.; Kang, B.; Sohn, K.-A. Fast, Accurate, and Lightweight Super-Resolution with Cascading Residual Network. arXiv 2018. [Google Scholar] [CrossRef]
- Kim, J.; Lee, J.K.; Lee, K.M. Deeply-Recursive Convolutional Network for Image Super-Resolution. arXiv 2016. [Google Scholar] [CrossRef]
- Tai, Y.; Yang, J.; Liu, X. Image Super-Resolution via Deep Recursive Residual Network. In Proceedings of the 2017 IEEE Conference on Computer Vision and Pattern Recognition (CVPR), Honolulu, HI, USA, 21–26 July 2017; IEEE: Honolulu, HI, USA, 2017; pp. 2790–2798. [Google Scholar] [CrossRef]
- Lai, W.-S.; Huang, J.-B.; Ahuja, N.; Yang, M.-H. Fast and Accurate Image Super-Resolution with Deep Laplacian Pyramid Networks. arXiv 2018. [Google Scholar] [CrossRef] [PubMed]
- Wang, C.; Li, Z.; Shi, J. Lightweight Image Super-Resolution with Adaptive Weighted Learning Network. arXiv 2019. [Google Scholar] [CrossRef]
- Zhang, Y.; Li, K.; Li, K.; Wang, L.; Zhong, B.; Fu, Y. Image Super-Resolution Using Very Deep Residual Channel Attention Networks. arXiv 2018. [Google Scholar] [CrossRef]
- Zhang, H.; Xie, L.; Qi, K. Implement Music Generation with GAN: A Systematic Review. In Proceedings of the 2021 International Conference on Computer Engineering and Application (ICCEA), Kunming, China, 25–27 June 2021; IEEE: New York, NY, USA, 2021; pp. 352–355. [Google Scholar] [CrossRef]
- Walczyna, T.; Piotrowski, Z. Overview of Voice Conversion Methods Based on Deep Learning. Appl. Sci. 2023, 13, 3100. [Google Scholar] [CrossRef]
- Liao, S.; Lan, S.; Zachariah, A.G. EVA-GAN: Enhanced Various Audio Generation via Scalable Generative Adversarial Networks. arXiv 2024. [Google Scholar] [CrossRef]
- Ledig, C.; Theis, L.; Huszar, F.; Caballero, J.; Cunningham, A.; Acosta, A.; Aitken, A.; Tejani, A.; Totz, J.; Wang, Z.; et al. Photo-Realistic Single Image Super-Resolution Using a Generative Adversarial Network. arXiv 2017. [Google Scholar] [CrossRef]
- Wang, X.; Yu, K.; Wu, S.; Gu, J.; Liu, Y.; Dong, C.; Loy, C.C.; Qiao, Y.; Tang, X. ESRGAN: Enhanced Super-Resolution Generative Adversarial Networks. arXiv 2018. [Google Scholar] [CrossRef]
- Wang, X.; Xie, L.; Dong, C.; Shan, Y. Real-ESRGAN: Training Real-World Blind Super-Resolution with Pure Synthetic Data. arXiv 2021. [Google Scholar] [CrossRef]
- Ullah, S.; Song, S.-H. SRResNet Performance Enhancement Using Patch Inputs and Partial Convolution-Based Padding. Comput. Mater. Contin. 2022, 74, 2999–3014. [Google Scholar] [CrossRef]
- Andreini, P.; Bonechi, S.; Bianchini, M.; Mecocci, A.; Scarselli, F.; Sodi, A. A Two Stage GAN for High Resolution Retinal Image Generation and Segmentation. arXiv 2019. [Google Scholar] [CrossRef]
- Chen, H.; Wang, Y.; Guo, T.; Xu, C.; Deng, Y.; Liu, Z.; Ma, S.; Xu, C.; Xu, C.; Gao, W. Pre-Trained Image Processing Transformer. arXiv 2021. [Google Scholar] [CrossRef]
- Conde, M.V.; Choi, U.-J.; Burchi, M.; Timofte, R. Swin2SR: SwinV2 Transformer for Compressed Image Super-Resolution and Restoration. arXiv 2022. [Google Scholar] [CrossRef]
- Rossi, L.; Bernuzzi, V.; Fontanini, T.; Bertozzi, M.; Prati, A. Swin2-MoSE: A New Single Image Super-Resolution Model for Remote Sensing. arXiv 2024. [Google Scholar] [CrossRef]
- Aira, L.S.; Valsesia, D.; Molini, A.B.; Fracastoro, G.; Magli, E.; Mirabile, A. Deep 3D World Models for Multi-Image Super-Resolution Beyond Optical Flow. arXiv 2024. [Google Scholar] [CrossRef]
- Çetin, Ş.B. Real-ESRGAN: A Deep Learning Approach for General Image Restoration and Its Application to Aerial Images. Adv. Remote Sens. 2023, 3, 90–99. [Google Scholar]
- Tao, Y.; Muller, J.-P. Super-Resolution Restoration of MISR Images Using the UCL MAGiGAN System. Remote Sens. 2019, 11, 52. [Google Scholar] [CrossRef]
- Hu, W.; Ju, L.; Du, Y.; Li, Y. A Super-Resolution Reconstruction Model for Remote Sensing Image Based on Generative Adversarial Networks. Remote Sens. 2024, 16, 1460. [Google Scholar] [CrossRef]
- Xu, Y.; Guo, T.; Wang, C. A Remote Sensing Image Super-Resolution Reconstruction Model Combining Multiple Attention Mechanisms. Sensors 2024, 24, 4492. [Google Scholar] [CrossRef] [PubMed]
- Xin, L.; Li, Z.; Wang, S. Super-Resolution Research on Remote Sensing Images in The Megacity Based on Improved Srgan. ISPRS Ann. Photogramm. Remote Sens. Spat. Inf. Sci. 2022, V-3–2022, 603–609. [Google Scholar] [CrossRef]
- Xu, W.; XU, G.; Wang, Y.; Sun, X.; Lin, D.; WU, Y. High Quality Remote Sensing Image Super-Resolution Using Deep Memory Connected Network. In Proceedings of the IGARSS 2018—2018 IEEE International Geoscience and Remote Sensing Symposium, Valencia, Spain, 22–27 July 2018; IEEE: New York, NY, USA, 2018; pp. 8889–8892. [Google Scholar] [CrossRef]
- Chen, K.; Li, W.; Lei, S.; Chen, J.; Jiang, X.; Zou, Z.; Shi, Z. Continuous Remote Sensing Image Super-Resolution Based on Context Interaction in Implicit Function Space. arXiv 2023. [Google Scholar] [CrossRef]
- Schuessler, C.; Hoffmann, M.; Vossiek, M. Super-Resolution Radar Imaging with Sparse Arrays Using a Deep Neural Network Trained with Enhanced Virtual Data. arXiv 2023. [Google Scholar] [CrossRef]
- Shi, Z.; Geng, H.; Wu, F.; Geng, L.; Zhuang, X. Radar-SR3: A Weather Radar Image Super-Resolution Generation Model Based on SR3. Atmosphere 2024, 15, 40. [Google Scholar] [CrossRef]
- Lee, H.; Chun, J.; Song, S. Forward-Looking Super-Resolution Radar Imaging via Reweighted L1-Minimization. In Proceedings of the 2018 IEEE Radar Conference (RadarConf18), Oklahoma City, OK, USA, 23–27 April 2018; IEEE: New York, NY, USA, 2018; pp. 0453–0457. [Google Scholar] [CrossRef]
- Huo, W.; Zhang, Q.; Zhang, Y.; Zhang, Y.; Huang, Y.; Yang, J. A Superfast Super-Resolution Method for Radar Forward-Looking Imaging. Sensors 2021, 21, 817. [Google Scholar] [CrossRef]
- Zheng, R.; Sun, S.; Caesar, H.; Chen, H.; Li, J. Redefining Automotive Radar Imaging: A Domain-Informed 1D Deep Learning Approach for High-Resolution and Efficient Performance. arXiv 2024. [Google Scholar] [CrossRef]
- Wu, Y.; He, Y.; Li, N.; Wang, G.; Zhang, L.; Zhang, F.; Zhu, Y. A Review of Intelligent Vision Enhancement Technology for Battlefield. Wirel. Commun. Mob. Comput. 2023, 2023, 6733262. [Google Scholar] [CrossRef]
- Wang, L.; Lin, Z.; Deng, X.; An, W. Point Target Detection Utilizing Super-Resolution Strategy for Infrared Scanning Oversampling System. Infrared Phys. Technol. 2017, 86, 165–175. [Google Scholar] [CrossRef]
- Hao, X.; Luo, S.; Chen, M.; He, C.; Wang, T.; Wu, H. Infrared Small Target Detection with Super-Resolution and YOLO. Opt. Laser Technol. 2024, 177, 111221. [Google Scholar] [CrossRef]
- Wang, Z.; Wang, C.; Chen, Y.; Li, J. Target Detection Algorithm Based on Super- Resolution Color Remote Sensing Image Reconstruction. J. Meas. Eng. 2024, 12, 83–98. [Google Scholar] [CrossRef]
- Özdaş, M.B.; Uysal, F.; Hardalaç, F. Super Resolution Image Acquisition for Object Detection in the Military Industry. In Proceedings of the 2023 5th International Congress on Human-Computer Interaction, Optimization and Robotic Applications (HORA), İstanbul, Türkiye, 8–10 June 2023; pp. 1–6. [Google Scholar] [CrossRef]
- Meng, F.; Li, Y.; Shao, F.; Yuan, G.; Dai, J. Visual-Simulation Region Proposal and Generative Adversarial Network Based Ground Military Target Recognition. Def. Technol. 2022, 18, 2083–2096. [Google Scholar] [CrossRef]
- Military Aircraft Recognition Dataset. Available online: https://www.kaggle.com/datasets/khlaifiabilel/military-aircraft-recognition-dataset (accessed on 12 November 2024).
- Everingham, M.; Van Gool, L.; Williams, C.K.I.; Winn, J.; Zisserman, A. The Pascal Visual Object Classes (VOC) Challenge. Int. J. Comput. Vis. 2010, 88, 303–338. [Google Scholar] [CrossRef]
- Lin, T.-Y.; Maire, M.; Belongie, S.; Hays, J.; Perona, P.; Ramanan, D.; Dollár, P.; Zitnick, C.L. Microsoft COCO: Common Objects in Context. In Computer Vision—ECCV 2014; Fleet, D., Pajdla, T., Schiele, B., Tuytelaars, T., Eds.; Springer International Publishing: Cham, Switzerland, 2014; pp. 740–755. [Google Scholar] [CrossRef]
- Ren, S.; He, K.; Girshick, R.; Sun, J. Faster R-CNN: Towards Real-Time Object Detection with Region Proposal Networks. arXiv 2016. [Google Scholar] [CrossRef] [PubMed]
- Girshick, R.; Donahue, J.; Darrell, T.; Malik, J. Rich Feature Hierarchies for Accurate Object Detection and Semantic Segmentation. arXiv 2014. [Google Scholar] [CrossRef]
- Girshick, R. Fast R-CNN. arXiv 2015. [Google Scholar] [CrossRef]
- Thakur, V.K. Faster R-CNN: Object Detection. The Deep Hub. Available online: https://medium.com/thedeephub/faster-r-cnn-object-detection-5dfe77104e31 (accessed on 13 November 2024).
- Ananth, S. Faster R-CNN for Object Detection. Medium. Available online: https://towardsdatascience.com/faster-r-cnn-for-object-detection-a-technical-summary-474c5b857b46 (accessed on 13 November 2024).
- He, K.; Zhang, X.; Ren, S.; Sun, J. Deep Residual Learning for Image Recognition. arXiv 2015. [Google Scholar] [CrossRef]


| Test Recall | Test Precision | Test mAP |
|---|---|---|
| 0.847 | 0.630 | 0.596 |
| IoU | Objects Size | Max Detection Number | Value | |
|---|---|---|---|---|
| Average Precision | 0.50:0.95 | all | 100 | 0.596 |
| Average Precision | 0.50 | all | 100 | 0.630 |
| Average Precision | 0.75 | all | 100 | 0.630 |
| Average Precision | 0.50:0.95 | small | 100 | −1.000 |
| Average Precision | 0.50:0.95 | medium | 100 | 0.755 |
| Average Precision | 0.50:0.95 | large | 100 | 0.568 |
| Average Recall | 0.50:0.95 | all | 1 | 0.341 |
| Average Recall | 0.50:0.95 | all | 10 | 0.820 |
| Average Recall | 0.50:0.95 | all | 100 | 0.847 |
| Average Recall | 0.50:0.95 | small | 100 | −1.000 |
| Average Recall | 0.50:0.95 | medium | 100 | 0.778 |
| Average Recall | 0.50:0.95 | large | 100 | 0.904 |
| Test Recall | Test Precision | Test mAP | |
|---|---|---|---|
| Reference results | 0.847 | 0.630 | 0.596 |
| Gaussian blur | 0.794 | 0.546 | 0.509 |
| Gaussian noise | 0.798 | 0.532 | 0.496 |
| Contrast reduction | 0.830 | 0.616 | 0.583 |
| Motion blur | 0.494 | 0.256 | 0.236 |
| JPEG compression | 0.812 | 0.555 | 0.519 |
| Color balance shift | 0.778 | 0.525 | 0.489 |
| Combination | 0.285 | 0.131 | 0.118 |
| IoU | Objects Size | Max Detection Number | Value | |
|---|---|---|---|---|
| Average Precision | 0.50:0.95 | all | 100 | 0.583 |
| Average Precision | 0.50 | all | 100 | 0.616 |
| Average Precision | 0.75 | all | 100 | 0.616 |
| Average Precision | 0.50:0.95 | small | 100 | −1.000 |
| Average Precision | 0.50:0.95 | medium | 100 | 0.746 |
| Average Precision | 0.50:0.95 | large | 100 | 0.566 |
| Average Recall | 0.50:0.95 | all | 1 | 0.333 |
| Average Recall | 0.50:0.95 | all | 10 | 0.804 |
| Average Recall | 0.50:0.95 | all | 100 | 0.830 |
| Average Recall | 0.50:0.95 | small | 100 | −1.000 |
| Average Recall | 0.50:0.95 | medium | 100 | 0.749 |
| Average Recall | 0.50:0.95 | large | 100 | 0.912 |
| IoU | Objects Size | Max Detection Number | Value | |
|---|---|---|---|---|
| Average Precision | 0.50:0.95 | all | 100 | 0.236 |
| Average Precision | 0.50 | all | 100 | 0.256 |
| Average Precision | 0.75 | all | 100 | 0.255 |
| Average Precision | 0.50:0.95 | small | 100 | −1.000 |
| Average Precision | 0.50:0.95 | medium | 100 | 0.413 |
| Average Precision | 0.50:0.95 | large | 100 | 0.339 |
| Average Recall | 0.50:0.95 | all | 1 | 0.208 |
| Average Recall | 0.50:0.95 | all | 10 | 0.492 |
| Average Recall | 0.50:0.95 | all | 100 | 0.494 |
| Average Recall | 0.50:0.95 | small | 100 | −1.000 |
| Average Recall | 0.50:0.95 | medium | 100 | 0.411 |
| Average Recall | 0.50:0.95 | large | 100 | 0.671 |
| Average PSNR [dB] (HR vs. LR) | Average PSNR [dB] (HR vs. SR) | Average PSNR [dB] (LR vs. SR) | |
|---|---|---|---|
| Gaussian blur | 34.37 | 32.78 | 35.19 |
| Gaussian noise | 28.93 | 32.96 | 28.84 |
| Contrast reduction | 30.42 | 29.63 | 34.68 |
| Motion blur | 33.90 | 32.28 | 35.04 |
| JPEG compression | 33.50 | 32.34 | 32.74 |
| Color balance shift | 29.19 | 28.57 | 33.91 |
| Combination | 28.42 | 28.48 | 34.27 |
| Test Recall | Test Precision | Test mAP | |
|---|---|---|---|
| Reference results | 0.847 | 0.630 | 0.596 |
| Gaussian blur | 0.794 | 0.546 | 0.509 |
| Gaussian blur SR | 0.825 | 0.560 | 0.521 |
| Gaussian noise | 0.798 | 0.532 | 0.496 |
| Gaussian noise SR | 0.831 | 0.590 | 0.553 |
| Contrast reduction | 0.830 | 0.616 | 0.583 |
| Contrast reduction SR | 0.854 | 0.591 | 0.555 |
| Motion blur | 0.494 | 0.256 | 0.236 |
| Motion blur SR | 0.416 | 0.193 | 0.172 |
| JPEG compression | 0.812 | 0.555 | 0.519 |
| JPEG compression SR | 0.838 | 0.575 | 0.534 |
| Color balance shift | 0.778 | 0.525 | 0.489 |
| Color balance shift SR | 0.801 | 0.530 | 0.496 |
| Combination | 0.285 | 0.131 | 0.118 |
| Combination SR | 0.256 | 0.115 | 0.101 |
| Test Recall | Test Precision | Test mAP | |
|---|---|---|---|
| Original model | 0.847 | 0.630 | 0.596 |
| SR model | 0.840 | 0.744 | 0.701 |
| IoU | Objects Size | Max Detection Number | Value | |
|---|---|---|---|---|
| Average Precision | 0.50:0.95 | all | 100 | 0.701 |
| Average Precision | 0.50 | all | 100 | 0.744 |
| Average Precision | 0.75 | all | 100 | 0.743 |
| Average Precision | 0.50:0.95 | small | 100 | −1.000 |
| Average Precision | 0.50:0.95 | medium | 100 | −1.000 |
| Average Precision | 0.50:0.95 | large | 100 | 0.701 |
| Average Recall | 0.50:0.95 | all | 1 | 0.333 |
| Average Recall | 0.50:0.95 | all | 10 | 0.820 |
| Average Recall | 0.50:0.95 | all | 100 | 0.840 |
| Average Recall | 0.50:0.95 | small | 100 | −1.000 |
| Average Recall | 0.50:0.95 | medium | 100 | −1.000 |
| Average Recall | 0.50:0.95 | large | 100 | 0.840 |
| Test Recall | Test Precision | Test mAP | |
|---|---|---|---|
| SR model | 0.840 | 0.744 | 0.701 |
| Gaussian blur | 0.728 | 0.509 | 0.469 |
| Gaussian blur SR | 0.811 | 0.641 | 0.595 |
| Gaussian noise | 0.755 | 0.574 | 0.532 |
| Gaussian noise SR | 0.820 | 0.694 | 0.656 |
| Contrast reduction | 0.807 | 0.662 | 0.625 |
| Contrast reduction SR | 0.816 | 0.688 | 0.649 |
| Motion blur | 0.403 | 0.224 | 0.207 |
| Motion blur SR | 0.269 | 0.127 | 0.114 |
| JPEG compression | 0.777 | 0.602 | 0.560 |
| JPEG compression SR | 0.829 | 0.679 | 0.637 |
| Color balance shift | 0.809 | 0.650 | 0.612 |
| Color balance shift SR | 0.821 | 0.697 | 0.656 |
| Combination | 0.365 | 0.180 | 0.162 |
| Combination SR | 0.327 | 0.150 | 0.134 |
Disclaimer/Publisher’s Note: The statements, opinions and data contained in all publications are solely those of the individual author(s) and contributor(s) and not of MDPI and/or the editor(s). MDPI and/or the editor(s) disclaim responsibility for any injury to people or property resulting from any ideas, methods, instructions or products referred to in the content. |
© 2024 by the authors. Licensee MDPI, Basel, Switzerland. This article is an open access article distributed under the terms and conditions of the Creative Commons Attribution (CC BY) license (https://creativecommons.org/licenses/by/4.0/).
Share and Cite
Bistroń, M.; Piotrowski, Z. Optimization of Imaging Reconnaissance Systems Using Super-Resolution: Efficiency Analysis in Interference Conditions. Sensors 2024, 24, 7977. https://doi.org/10.3390/s24247977
Bistroń M, Piotrowski Z. Optimization of Imaging Reconnaissance Systems Using Super-Resolution: Efficiency Analysis in Interference Conditions. Sensors. 2024; 24(24):7977. https://doi.org/10.3390/s24247977
Chicago/Turabian StyleBistroń, Marta, and Zbigniew Piotrowski. 2024. "Optimization of Imaging Reconnaissance Systems Using Super-Resolution: Efficiency Analysis in Interference Conditions" Sensors 24, no. 24: 7977. https://doi.org/10.3390/s24247977
APA StyleBistroń, M., & Piotrowski, Z. (2024). Optimization of Imaging Reconnaissance Systems Using Super-Resolution: Efficiency Analysis in Interference Conditions. Sensors, 24(24), 7977. https://doi.org/10.3390/s24247977