Figure 1.
Multi-Agent CIRS framework, wherein different agents are responsible for specific tasks, ensuring a structured and flexible workflow.
Figure 1.
Multi-Agent CIRS framework, wherein different agents are responsible for specific tasks, ensuring a structured and flexible workflow.
Figure 2.
The Multi-Agent CIRS framework enables real-time, decentralized accident detection through video-based intelligence. By facilitating efficient collaboration among intelligent agents, it ensures rapid and accurate detection, classification, and response, enhancing overall road safety.
Figure 2.
The Multi-Agent CIRS framework enables real-time, decentralized accident detection through video-based intelligence. By facilitating efficient collaboration among intelligent agents, it ensures rapid and accurate detection, classification, and response, enhancing overall road safety.
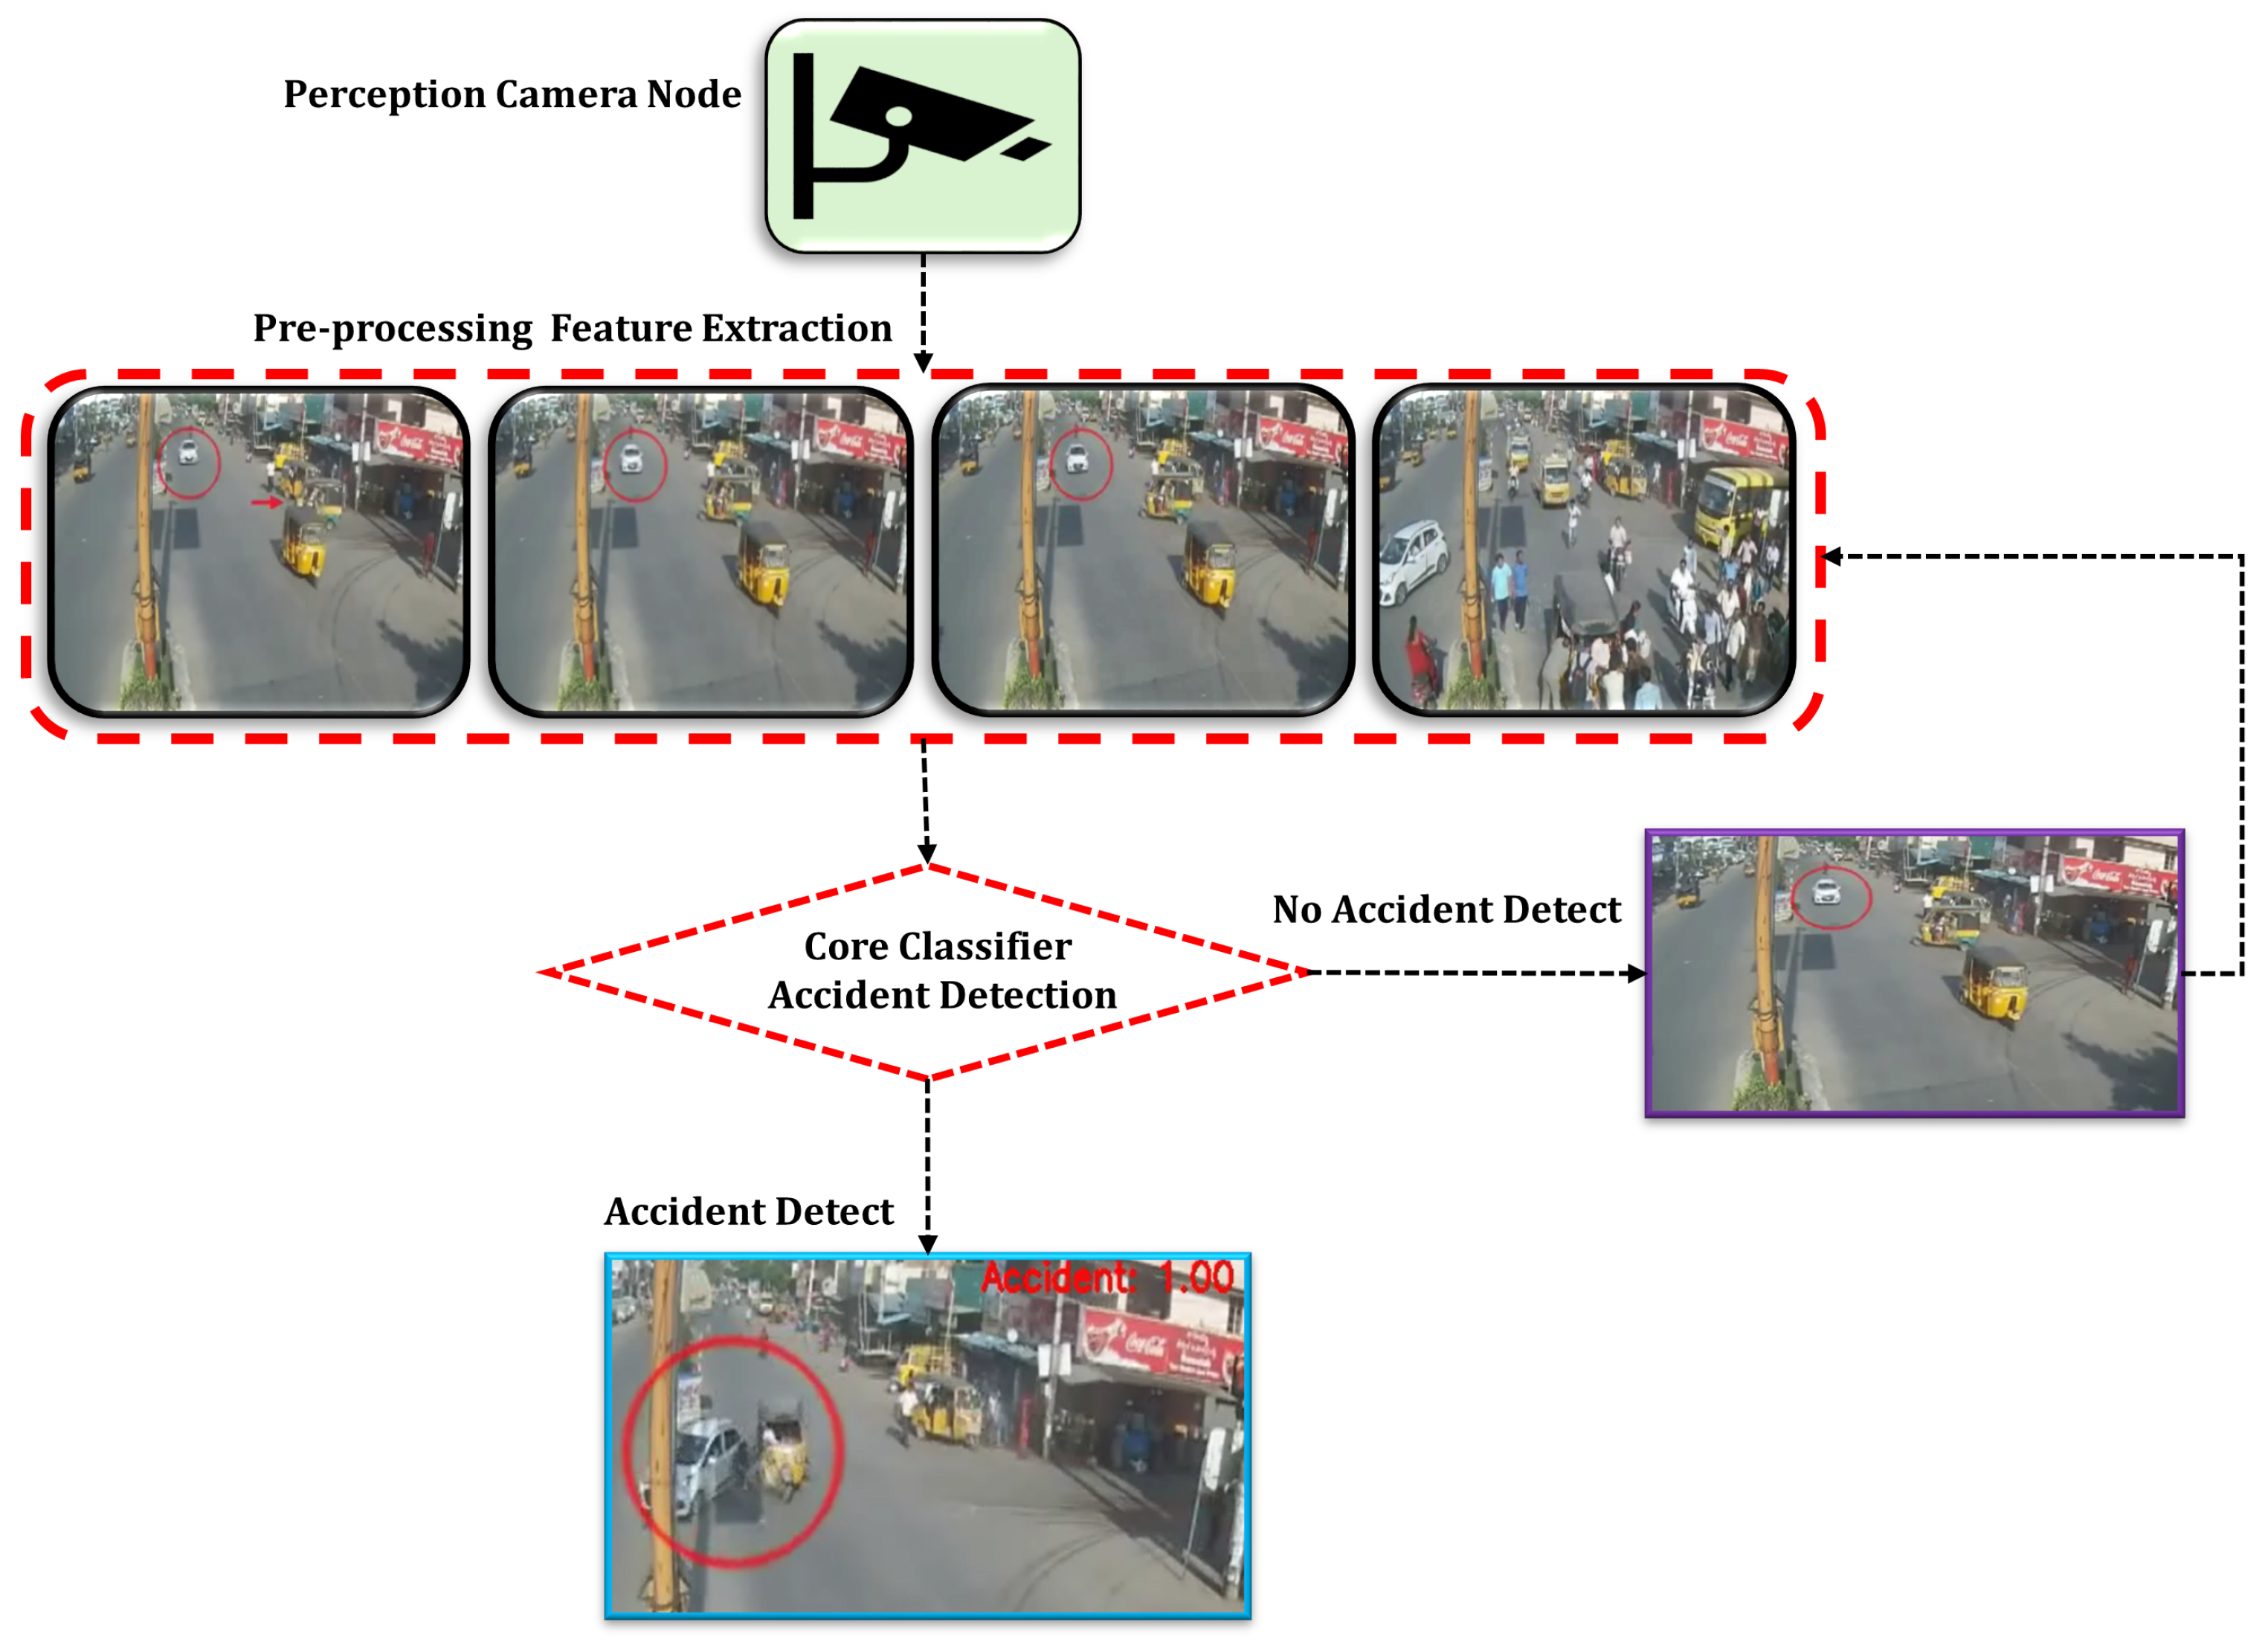
Figure 3.
The accident detection agents are responsible for classifying each frame as either ‘Accident’ or ‘No Accident,’ thereby ensuring accurate identification of traffic incidents in real time.The red circle represents the accident in the frame.
Figure 3.
The accident detection agents are responsible for classifying each frame as either ‘Accident’ or ‘No Accident,’ thereby ensuring accurate identification of traffic incidents in real time.The red circle represents the accident in the frame.
Figure 4.
Visual representation of the dataset distribution, illustrating the classification of frames into “Accident” and “No Accident” categories for supervised model training.
Figure 4.
Visual representation of the dataset distribution, illustrating the classification of frames into “Accident” and “No Accident” categories for supervised model training.
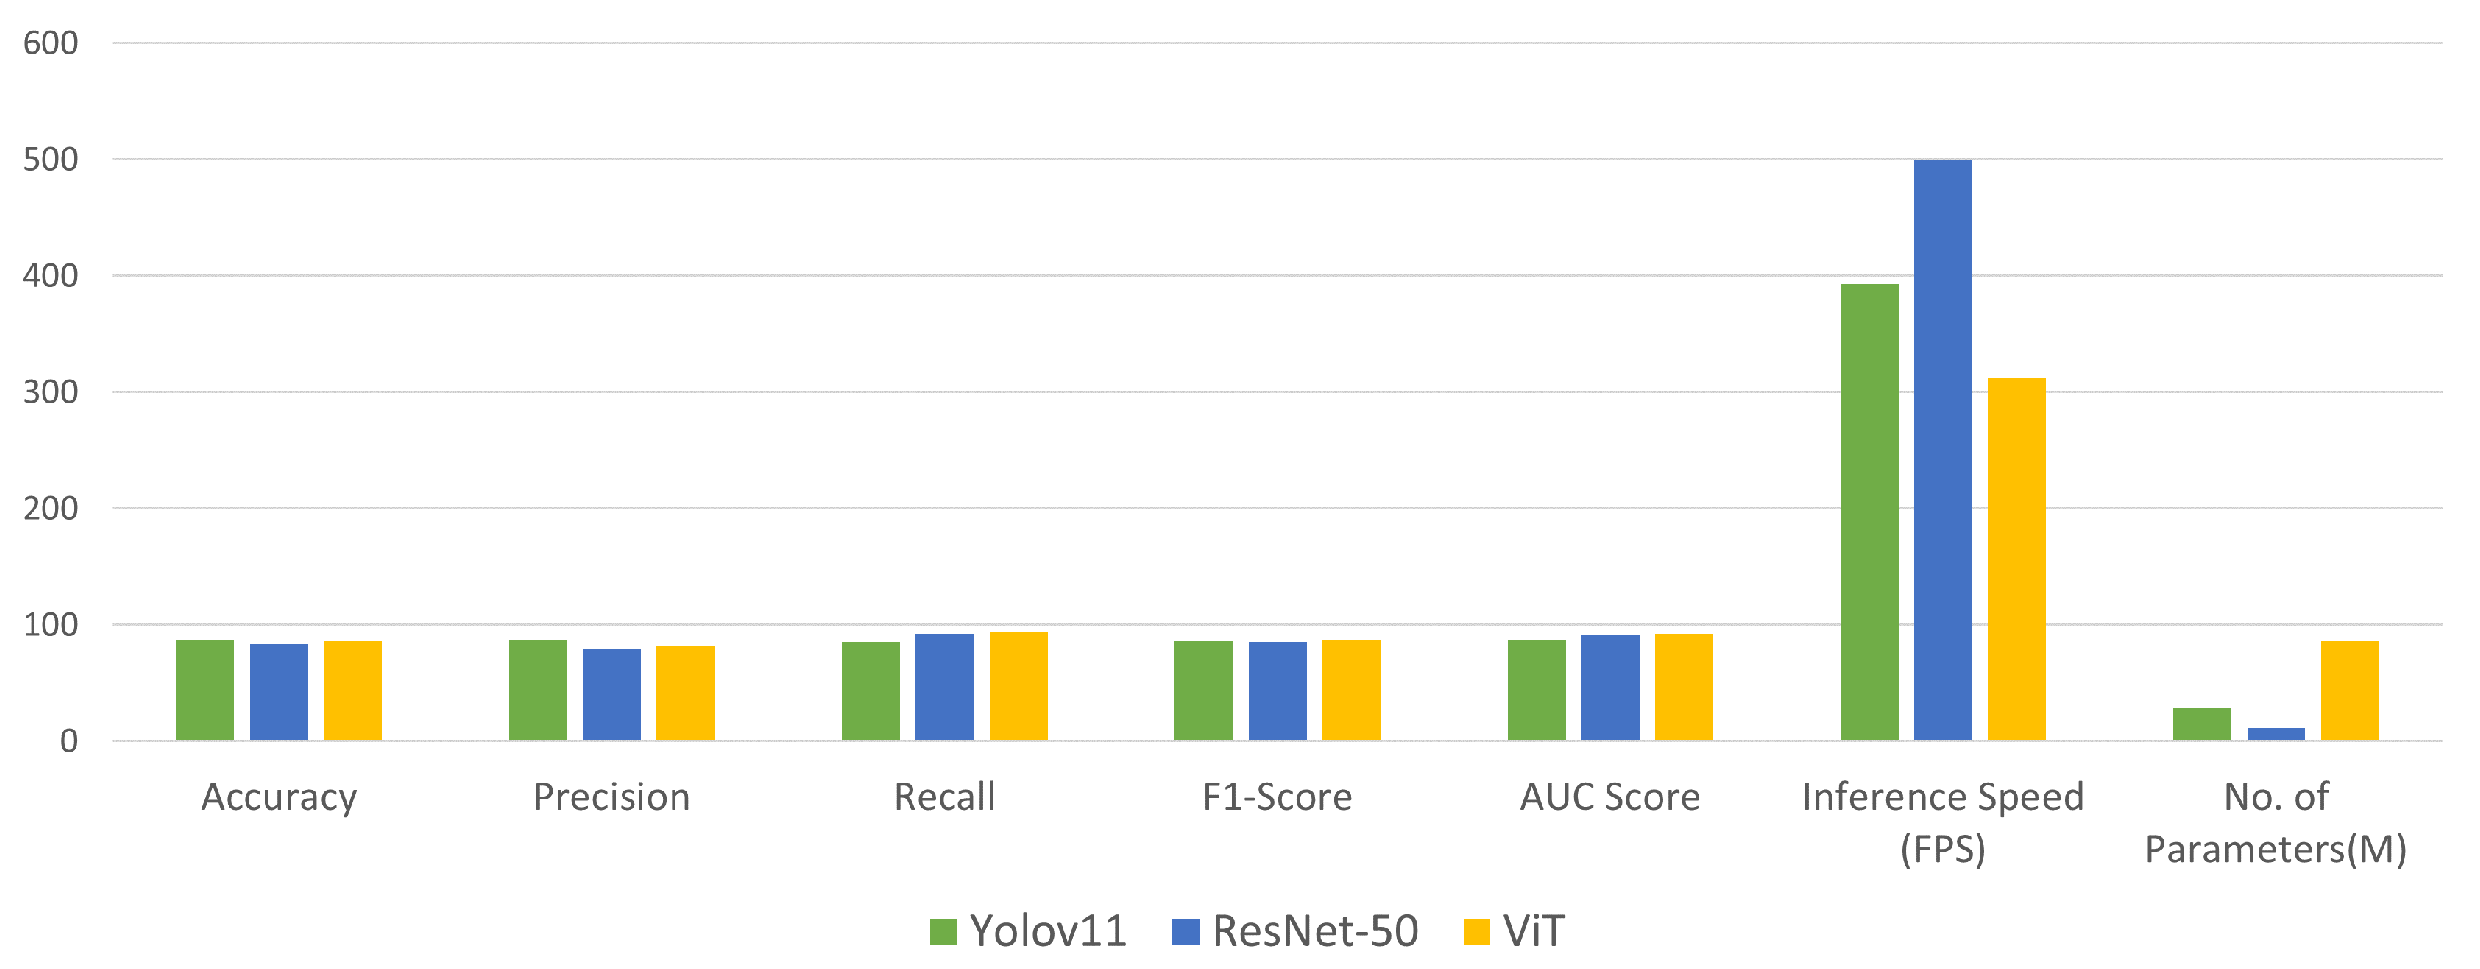
Figure 5.
Bar plot illustrating key performance metrics of the YOLOv11 model, including the number of parameters, accuracy, precision, recall, F1-score, AUC score, and inference speed. This visualization provides a comparative overview of the model’s classification effectiveness, computational efficiency, and real-time applicability.
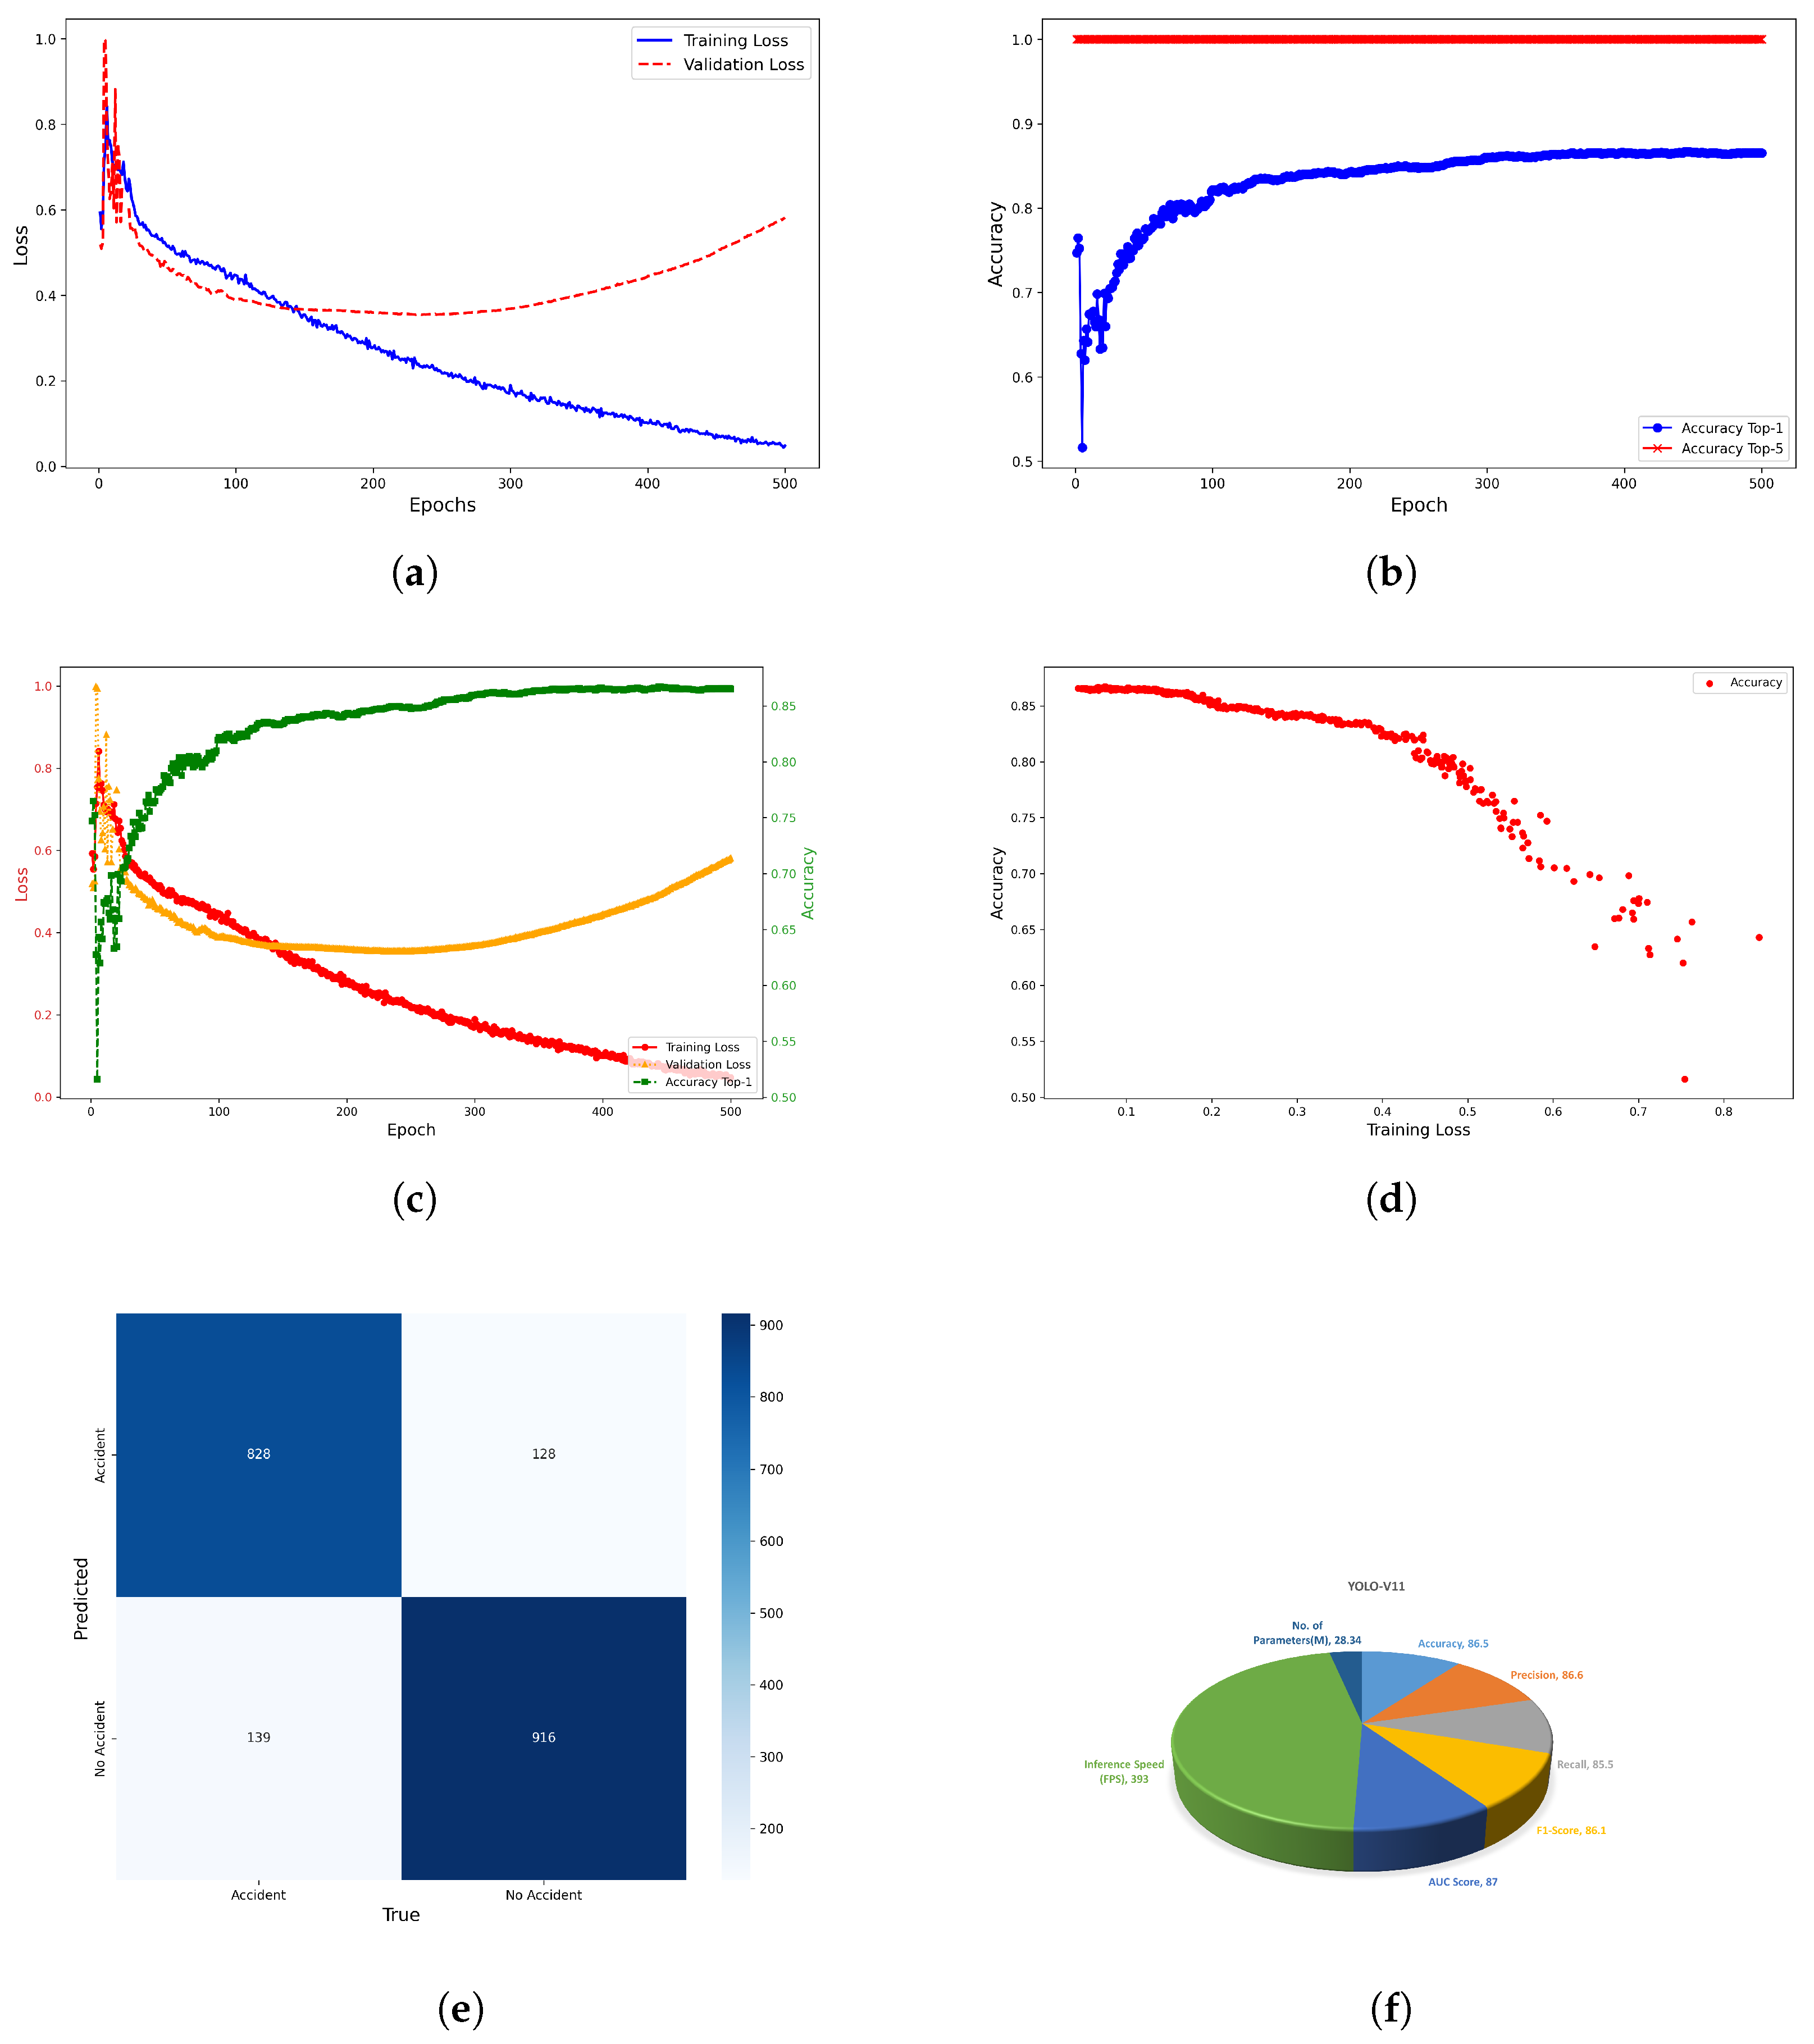
Figure 6.
Classifier agent performance evaluation of YOLOv11 across different metrics: loss, accuracy, convergence behavior, classification outcomes, and overall efficiency metrics. (a) Training and validation loss curves showing YOLOv11 model convergence over epochs. (b) Top-1 and top-5 accuracy trends over 500 epochs for binary accident detection. (c) Epoch-wise training/validation loss and accuracy curves highlighting learning progression. (d) Scatter plot of training loss vs accuracy indicating model generalization. (e) Confusion matrix presenting YOLOv11’s classification performance on the validation dataset. The matrix shows the number of true positives (TPs), true negatives (TNs), false positives (FPs), and false negatives (FNs), reflecting the model’s ability to distinguish between accident and non-accident frames. (f) Pie chart summarizing key performance indicators such as the number of parameters, accuracy, precision, recall, F1-score, AUC score, and inference speed, offering a comprehensive visual representation of the model’s efficiency and effectiveness in real-time accident detection.
![Sensors 25 05845 g006 Sensors 25 05845 g006]()
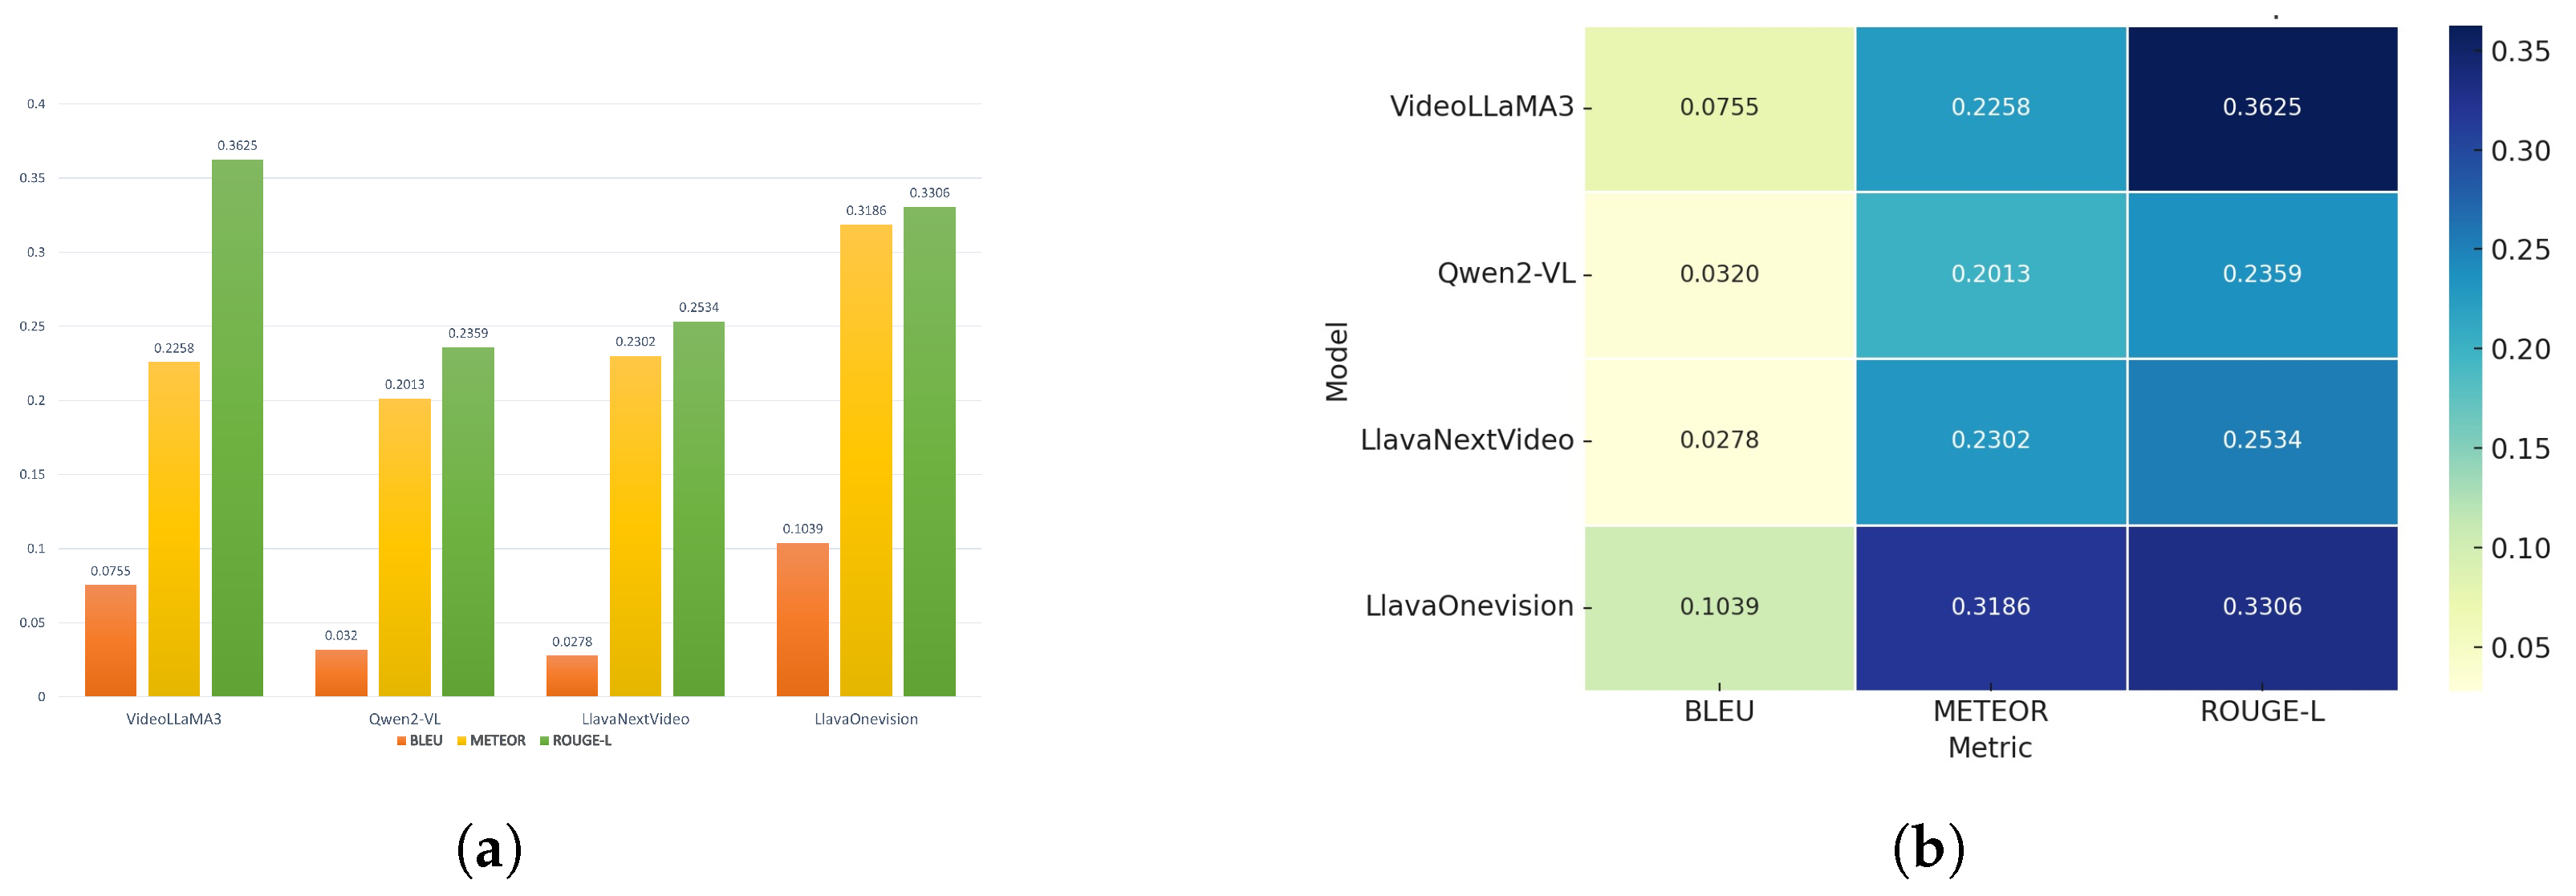
Figure 7.
Visual comparison of vision-language model (VLM) performance. (a) A bar chart summarizing BLEU, METEOR, and ROUGE-L scores, while (b) displays a heatmap of evaluation metrics. (a) Quantitative comparison of various vision-language models (VLMs) based on standard natural language generation metrics: BLEU, METEOR, and ROUGE-L. (b) Heatmap showing evaluation metrics.
Figure 8.
Qualitative results of VideoLLaMA3 demonstrate its capabilities in video frame captioning and visual scene understanding.
Figure 8.
Qualitative results of VideoLLaMA3 demonstrate its capabilities in video frame captioning and visual scene understanding.
Table 2.
Summary of the dataset characteristics extracted from real-world traffic videos.
Table 2.
Summary of the dataset characteristics extracted from real-world traffic videos.
| Attribute | Value |
|---|
| Total Videos | 157 |
| Total Size | 4.28 GB |
| Frame Extraction Rate | 0.5 FPS |
| Total Frames | ∼10,000 |
| “Accident” Frames | ∼5200 |
| “No Accident” Frames | ∼4800 |
| Annotation Tool | CVAT |
| Annotation Hours | 215 h |
| Format for Training | YOLOv11-compatible |
Table 3.
Dataset splitting distribution for experimental evaluation.
Table 3.
Dataset splitting distribution for experimental evaluation.
| Class | Training (80%) | Validation (20%) |
|---|
| Accident | 4160 | 1040 |
| No Accident | 3840 | 960 |
| Total | 8000 | 2000 |
Table 4.
Hardware specifications for experimental evaluation.
Table 4.
Hardware specifications for experimental evaluation.
| Component | Specification |
|---|
| Processor | Intel® Core™ i9-13900 (13th Gen) |
| Memory | 64 GB DDR5 |
| GPU | Zotac® GeForce RTX 4090 Trinity, 24 GB GDDR6X |
| Storage | 1 TB NVMe PCIe Gen4 SSD |
Table 5.
Core classifier training configuration details.
Table 5.
Core classifier training configuration details.
| Parameter | Specification |
|---|
| Model Architecture | Pre-trained YOLOv11 |
| Total Epochs | 500 |
| Batch Size | 32 or 64 (adaptive to GPU memory) |
| Optimizer Used | SGD |
| Initial Learning Rate | 0.003 |
| LR Scheduler | Linear Warm-up + Cosine Annealing |
| Framework | Ultralytics YOLOv11 |
| Processing Hardware | CUDA-enabled GPU |
| Classification Task | Binary (Accident/No Accident) |
| Input Format | Annotated Images (YOLO format) |
Table 6.
Summary of evaluation metrics and corresponding formulas for classification performance, computational efficiency, and descriptive model characteristics.
Table 6.
Summary of evaluation metrics and corresponding formulas for classification performance, computational efficiency, and descriptive model characteristics.
| No. | Formula | Description |
|---|
| Classification Metrics |
| 1 | | Overall percentage of correct predictions. |
| 2 | | Proportion of predicted accidents that are correct. |
| 3 | | Proportion of actual accidents correctly identified. |
| 4 | | Balance between Precision and Recall. |
| 5 | | True Positive Rate (sensitivity) for ROC analysis. |
| 6 | | False Positive Rate for ROC analysis. |
| 7 | | Area under the ROC curve. |
| Computational Metrics |
| 8 | | Number of frames processed per second during inference. |
| 9 | | Total model parameters measured in millions. |
| Descriptive Model Evaluation Metrics |
| 10 | | N-gram precision metric with brevity penalty. |
| 11 | | Precision–recall based metric with fragmentation penalty. |
| 12 | | Longest common subsequence-based text similarity metric. |
Table 7.
Comprehensive classification and computation performance comparison of YOLOv11, ResNet-50, and ViT on custom dataset.
Table 7.
Comprehensive classification and computation performance comparison of YOLOv11, ResNet-50, and ViT on custom dataset.
| Metric | YOLOv11 | ResNet-50 | ViT |
|---|
| Classification Performance |
| Accuracy (%) | 86.5 | 83.29 | 85.83 |
| Precision (%) | 86.6 | 78.97 | 81.65 |
| Recall (%) | 85.5 | 92.43 | 93.77 |
| F1-Score (%) | 86.1 | 85.17 | 87.29 |
| Computational Performance |
| Inference Speed (FPS) | 393 | 500 | 312.5 |
| Number of Parameters (M) | 28.34 | 11.18 | 85.80 |
| Best Use Case | Best Precision | Fastest Inference | Highest Recall |
Table 8.
Training performance of YOLOv11, showing the evolution of learning rate, training/validation losses, and classification accuracy over epochs.
Table 8.
Training performance of YOLOv11, showing the evolution of learning rate, training/validation losses, and classification accuracy over epochs.
| Epoch | | Train Loss | Accuracy (%) | Val Loss |
|---|
| 498 | | 0.048 | 86.57 | 1.00 |
| 499 | | 0.043 | 86.57 | 1.00 |
| 500 | | 0.048 | 86.52 | 1.00 |
Table 9.
Confusion matrix summarizing YOLOv11’s classification results on the validation set.
Table 9.
Confusion matrix summarizing YOLOv11’s classification results on the validation set.
| | Predicted: Accident | Predicted: No Accident |
|---|
| Actual: Accident | TP = 828 | FN = 139 |
| Actual: No Accident | FP = 128 | TN = 916 |
| Missed Accidents | 14% (139/967) |
| False Alarms | 12% (128/1044) |
Table 10.
Comparison of different models using BLEU, METEOR, and ROUGE-L metrics.
Table 10.
Comparison of different models using BLEU, METEOR, and ROUGE-L metrics.
| Model | BLEU | METEOR | ROUGE-L |
|---|
| VideoLLaMA3 | 0.0755 | 0.2258 | 0.3625 |
| Qwen2-VL | 0.0320 | 0.2013 | 0.2359 |
| LlavaNextVideo | 0.0278 | 0.2302 | 0.2534 |
| LlavaOnevision | 0.1039 | 0.3186 | 0.3306 |
Table 11.
Overall CIRS framework performance for emergency responses.
Table 11.
Overall CIRS framework performance for emergency responses.
| | YOLOv11 | VLM | Overall |
|---|
| Speed (second) | 3–7 ms/frame | 2–4 s/video | 3–5 s |


