Figure 2.
(a) Histogram showing the distribution of Shannon entropy values for 10,000 derived 128-bit keys, demonstrating near-ideal randomness across truncation outputs. (b) Payload composition of the registration message. The TLS overhead occupies 44.4% of the total size, while the identifier, hashed biometric template, and nonce are distributed fairly evenly across the remaining 55.6%. (c) State-machine diagram for the registration workflow. The arrow indicates the direction of data flow between the modules during the authentication process. It illustrates how the client securely sends the registration request, how the server validates the biometric hash, stores the template, and acknowledges successful registration or failure. (d) Probability of nonce collision as a function of the number of registration attempts. For a 128-bit nonce, the projected maximum number of users (100,000) yields an extremely low collision probability (~10−26), confirming nonce uniqueness. (e) Latency breakdown for registration sub-steps. Network transmission dominates total registration delay (10 ms), followed by random-number generation and hashing, demonstrating the importance of network efficiency.
![Sensors 25 05711 g002 Sensors 25 05711 g002]()
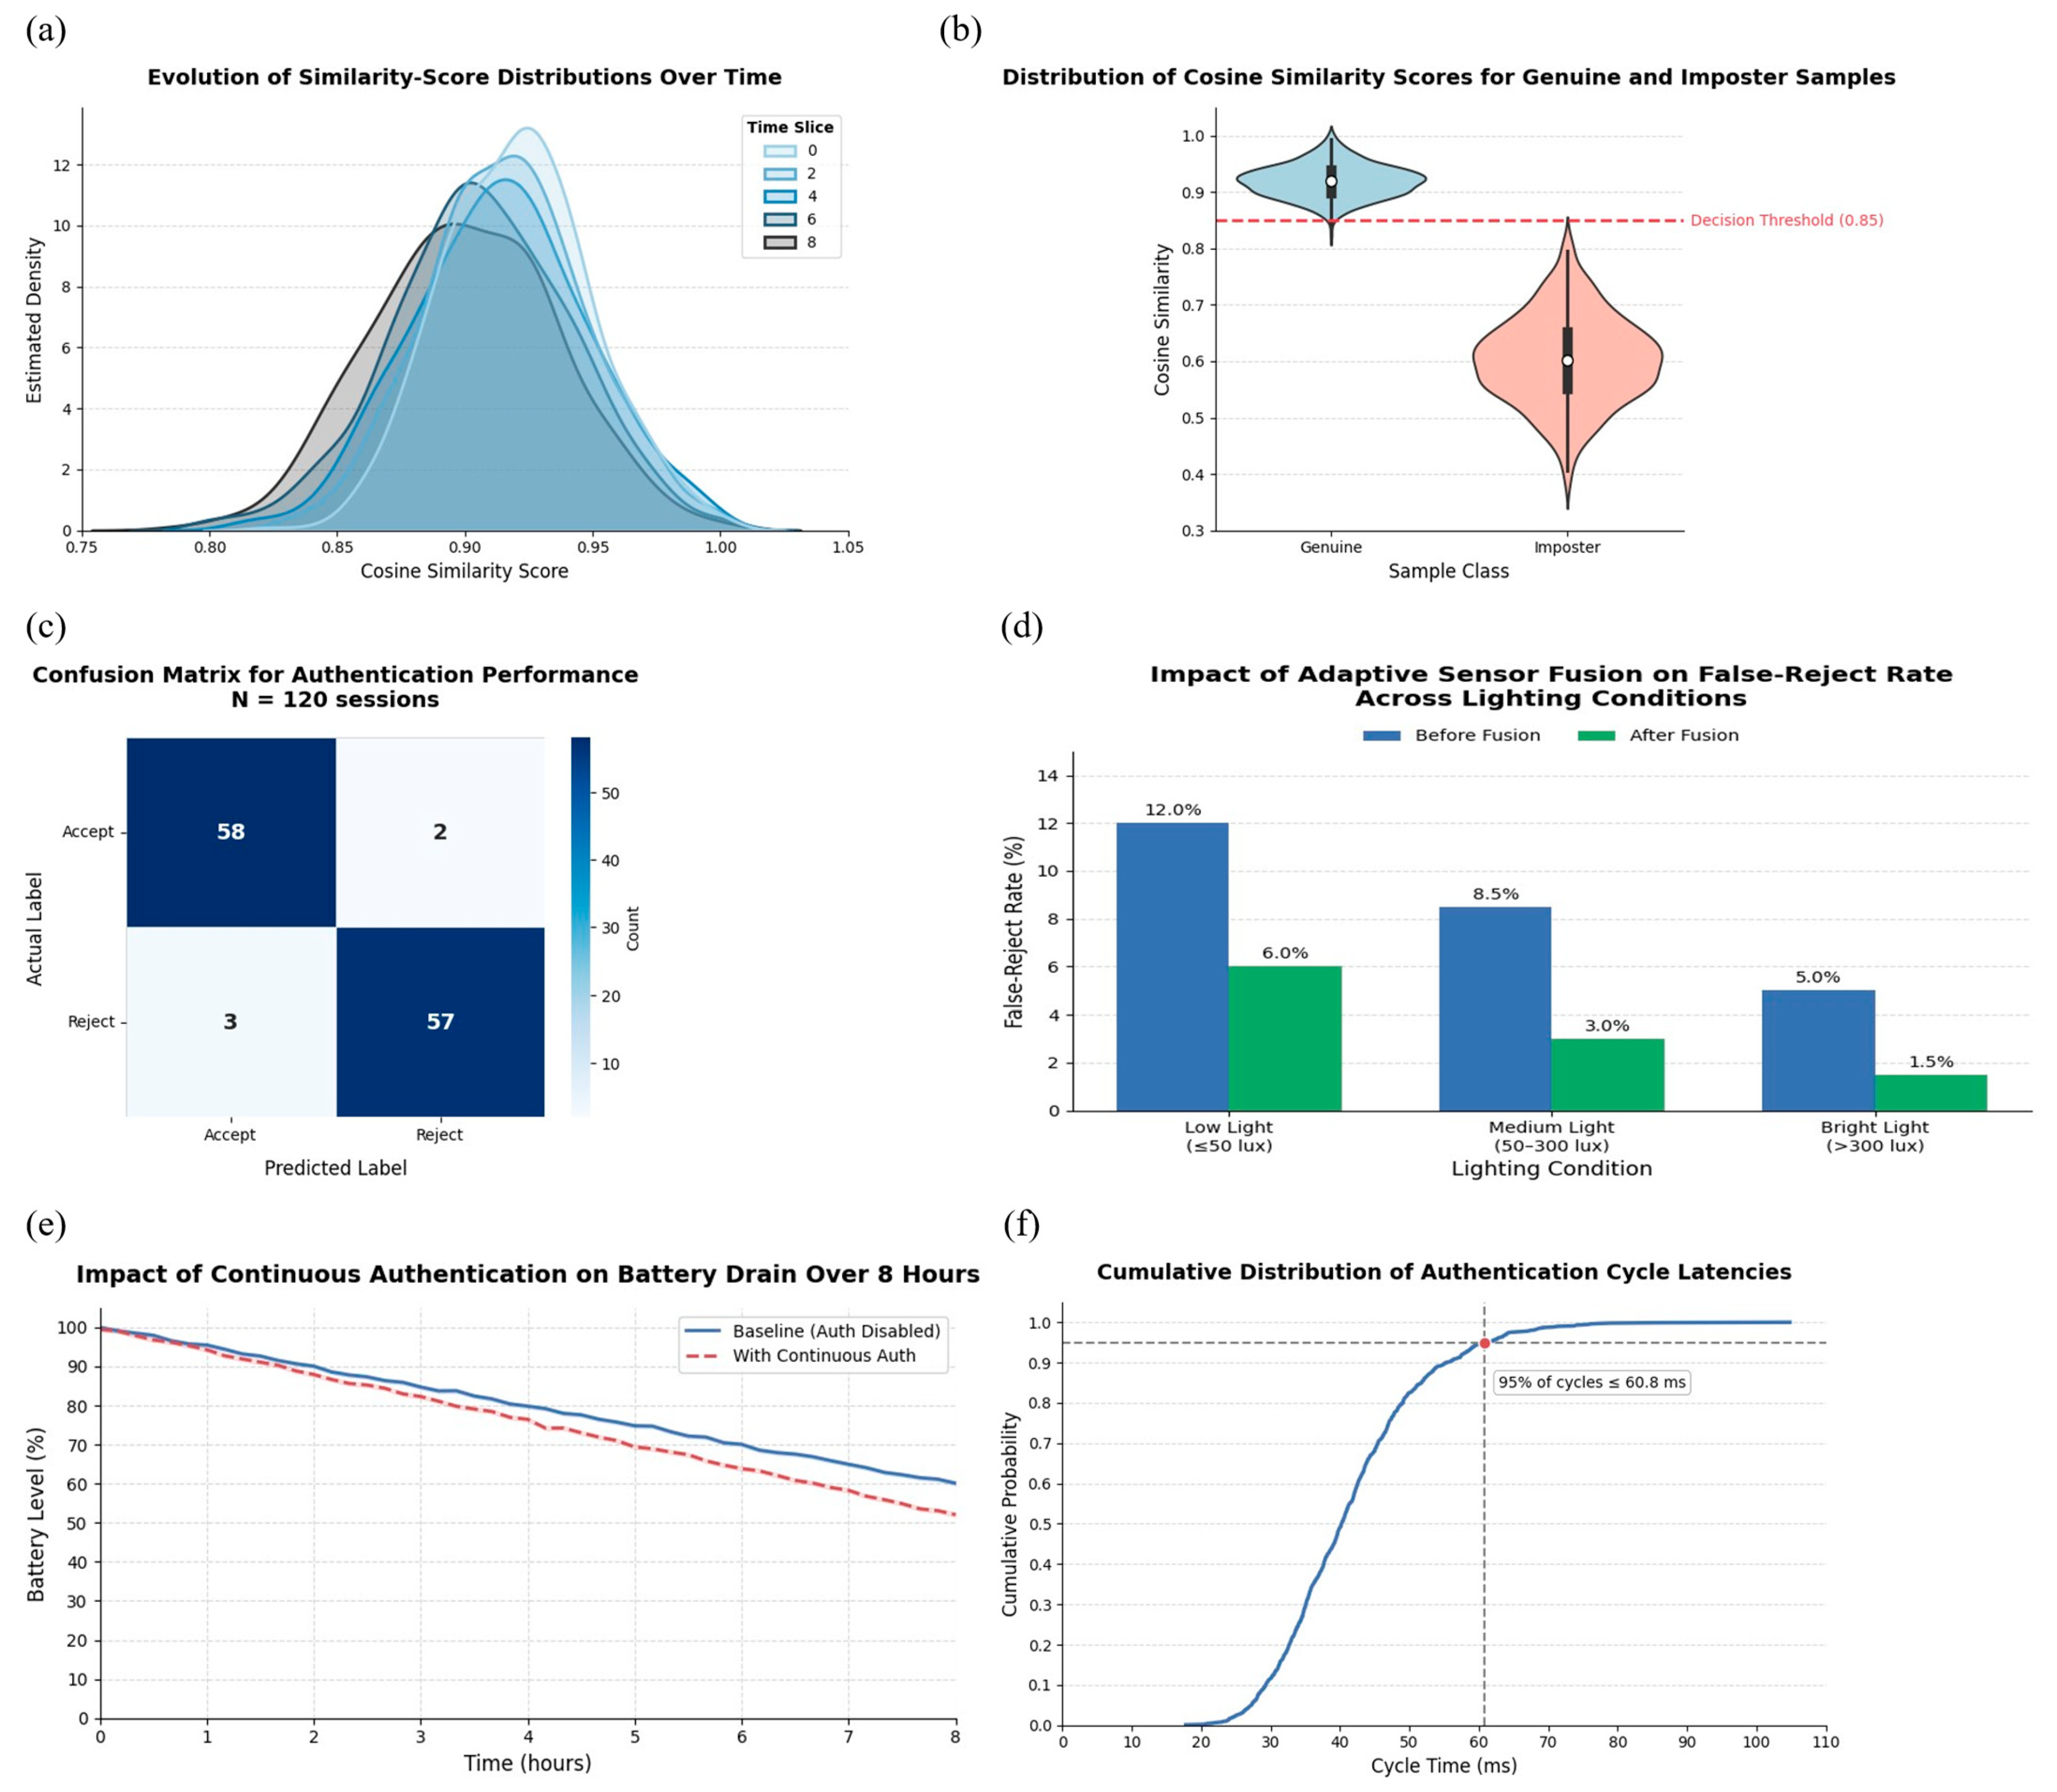
Figure 3.
(a) Cumulative distribution of authentication cycle latencies on the Snapdragon 778G device. The dashed line marks the 95% completion threshold at 60.8 ms, showing that nearly all authentication cycles finish well within real-time constraints. This confirms the protocol’s feasibility for mobile deployment without noticeable user delay. (b) Violin plot of cosine similarity score distributions for genuine and imposter authentication attempts. The decision threshold of 0.85 effectively separates the two groups, minimizing both false acceptance and false rejections. This demonstrates that the chosen threshold provides a strong operating point for reliable identity verification. (c) Confusion matrix of authentication results for 120 test sessions. High true accept and true reject counts dominate the matrix, while false accepts and false rejects remain minimal. This validates the accuracy and robustness of the proposed continuous authentication framework in practice. (d) False-reject rates across low, medium, and bright lighting conditions before and after adaptive sensor-fusion weighting. The reduction in error rates, particularly under low light, highlights the effectiveness of the adaptive fusion strategy in maintaining usability across variable environments. (e) Battery consumption over an 8 h usage period, comparing baseline drain to the additional cost of continuous authentication. The minimal increase in battery use demonstrates that the framework is resource-efficient and practical for day-long operation on mobile devices. (f) Cumulative distribution of authentication cycle latencies. The dotted line indicates the 95th percentile (60.8 ms), showing that 95% of cycles complete within this latency threshold.
![Sensors 25 05711 g003 Sensors 25 05711 g003]()
Figure 5.
(a) Model-estimated latency vs. lighting by device: Mixed-effects marginal means with 95% CIs demonstrate consistent latency trends across lighting for all devices after adjusting for other factors. The near-parallel trajectories and overlapping intervals indicate no material interaction that would undermine generalizability. (b) Equivalence of latency and energy across devices: The forest plot shows condition-wise differences from baseline for latency and energy with 95% CIs against pre-registered equivalence bands. Intervals contained within the bands indicate statistical equivalence under TOST, supporting cross-device generalizability of performance and efficiency. (c) Verification parity at the common operating point: DET curves for each device are overlaid with the chosen operating point and its 95% CIs for TPR/FAR. Overlap across devices indicates accuracy stability, satisfying the requirement that error rates remain within ±1% of the baseline. (d) Condition-wise equivalence across devices: Tile maps mark TOST pass/fail status for each device across environmental cells. Broad pass coverage indicates that equivalence holds not only on average but also at the granularity of real operating conditions. (e) Security parity across devices: The parity matrix records pass/fail outcomes for replay and MiTM checks on all devices and reports 95% CIs for detection latency. Consistent passes and overlapping intervals indicate that security properties are preserved across hardware and operating systems.
![Sensors 25 05711 g005 Sensors 25 05711 g005]()
Figure 6.
(a) Kaplan–Meier survival curves showing the proportion of uncompromised sessions (N = 500) under impersonation, replay, man-in-the-middle (MiTM), and parallel-session attacks in the real-world test bed. The steepest decline occurs under replay attacks, while MiTM shows more gradual erosion, confirming the protocol’s ability to withstand extended adversarial activity. (b) Radar chart of normalized security-metric scores across confidentiality, integrity, availability, authentication, non-repudiation, and privacy. The proposed protocol achieves balanced, high-level coverage across all six dimensions, contrasting with weaker baselines in availability and non-repudiation. (c) Attack-surface coverage matrix across protocol steps measured on the Snapdragon test bed. Green cells indicate mitigated risks, amber cells highlight residual exposure, and red cells show non-mitigated vectors, offering a step-by-step view of how threats are handled in practice. (d) Left: Heat map of packet-drop rates at each protocol step under active attack conditions. Right: Pearson correlation matrix linking attack frequency, packet-drop rates, and latency spikes. Together, these plots reveal that higher packet losses strongly correlate with latency anomalies, especially during handshake initiation. Asterisks (*) denote statistically significant correlations at p < 0.05. (e) Box-and-whisker plots of authentication latency over 500 handshakes under baseline, replay flood, MiTM manipulation, and DoS storm conditions. Replay and DoS scenarios show the greatest variability, while baseline and MiTM latencies remain tightly distributed, demonstrating resilience under moderate attack but some degradation under volumetric flooding. (f) Summary table of security evaluations across attack vectors, detailing applied defense mechanisms, experimental conditions, and observed results. This tabular consolidation highlights which protections were most effective, ensuring transparency and reproducibility of the evaluation.
![Sensors 25 05711 g006 Sensors 25 05711 g006]()
Figure 7.
(a) End-to-end authentication sequence diagram. This illustrates the message flow between client and server, clarifying the ordering of biometric hashing, nonce generation, and encrypted key exchange that form the basis of the protocol. (b) Summary of protocol notations used throughout the formal specification. Standardizing these symbols provides clarity for subsequent proofs and ensures consistency across the security analysis. (c) Box-and-whisker plot of latency distribution for each protocol handshake step. The figure shows medians, interquartile ranges, and 95th-percentile markers, highlighting that registration and verification remain well within practical latency bounds even under load. (d) State-transition diagram of the authentication protocol, depicting valid progressions through Idle, Await Challenge, Verify, and Authenticated states, as well as error-handling pathways. This formalizes how the system responds to both expected and erroneous inputs. (e) Attack-surface coverage matrix mapping common attack vectors to protocol steps. Cells indicate whether risks are mitigated, excluded, or remain as residual vulnerabilities, providing a concise overview of the scheme’s defensive coverage. (f) Workflow diagram of the formal verification process. The figure links protocol specification through Scyther analysis and SVO logic to the derivation of final security theorems, showing the systematic process used to validate protocol soundness.
![Sensors 25 05711 g007 Sensors 25 05711 g007]()
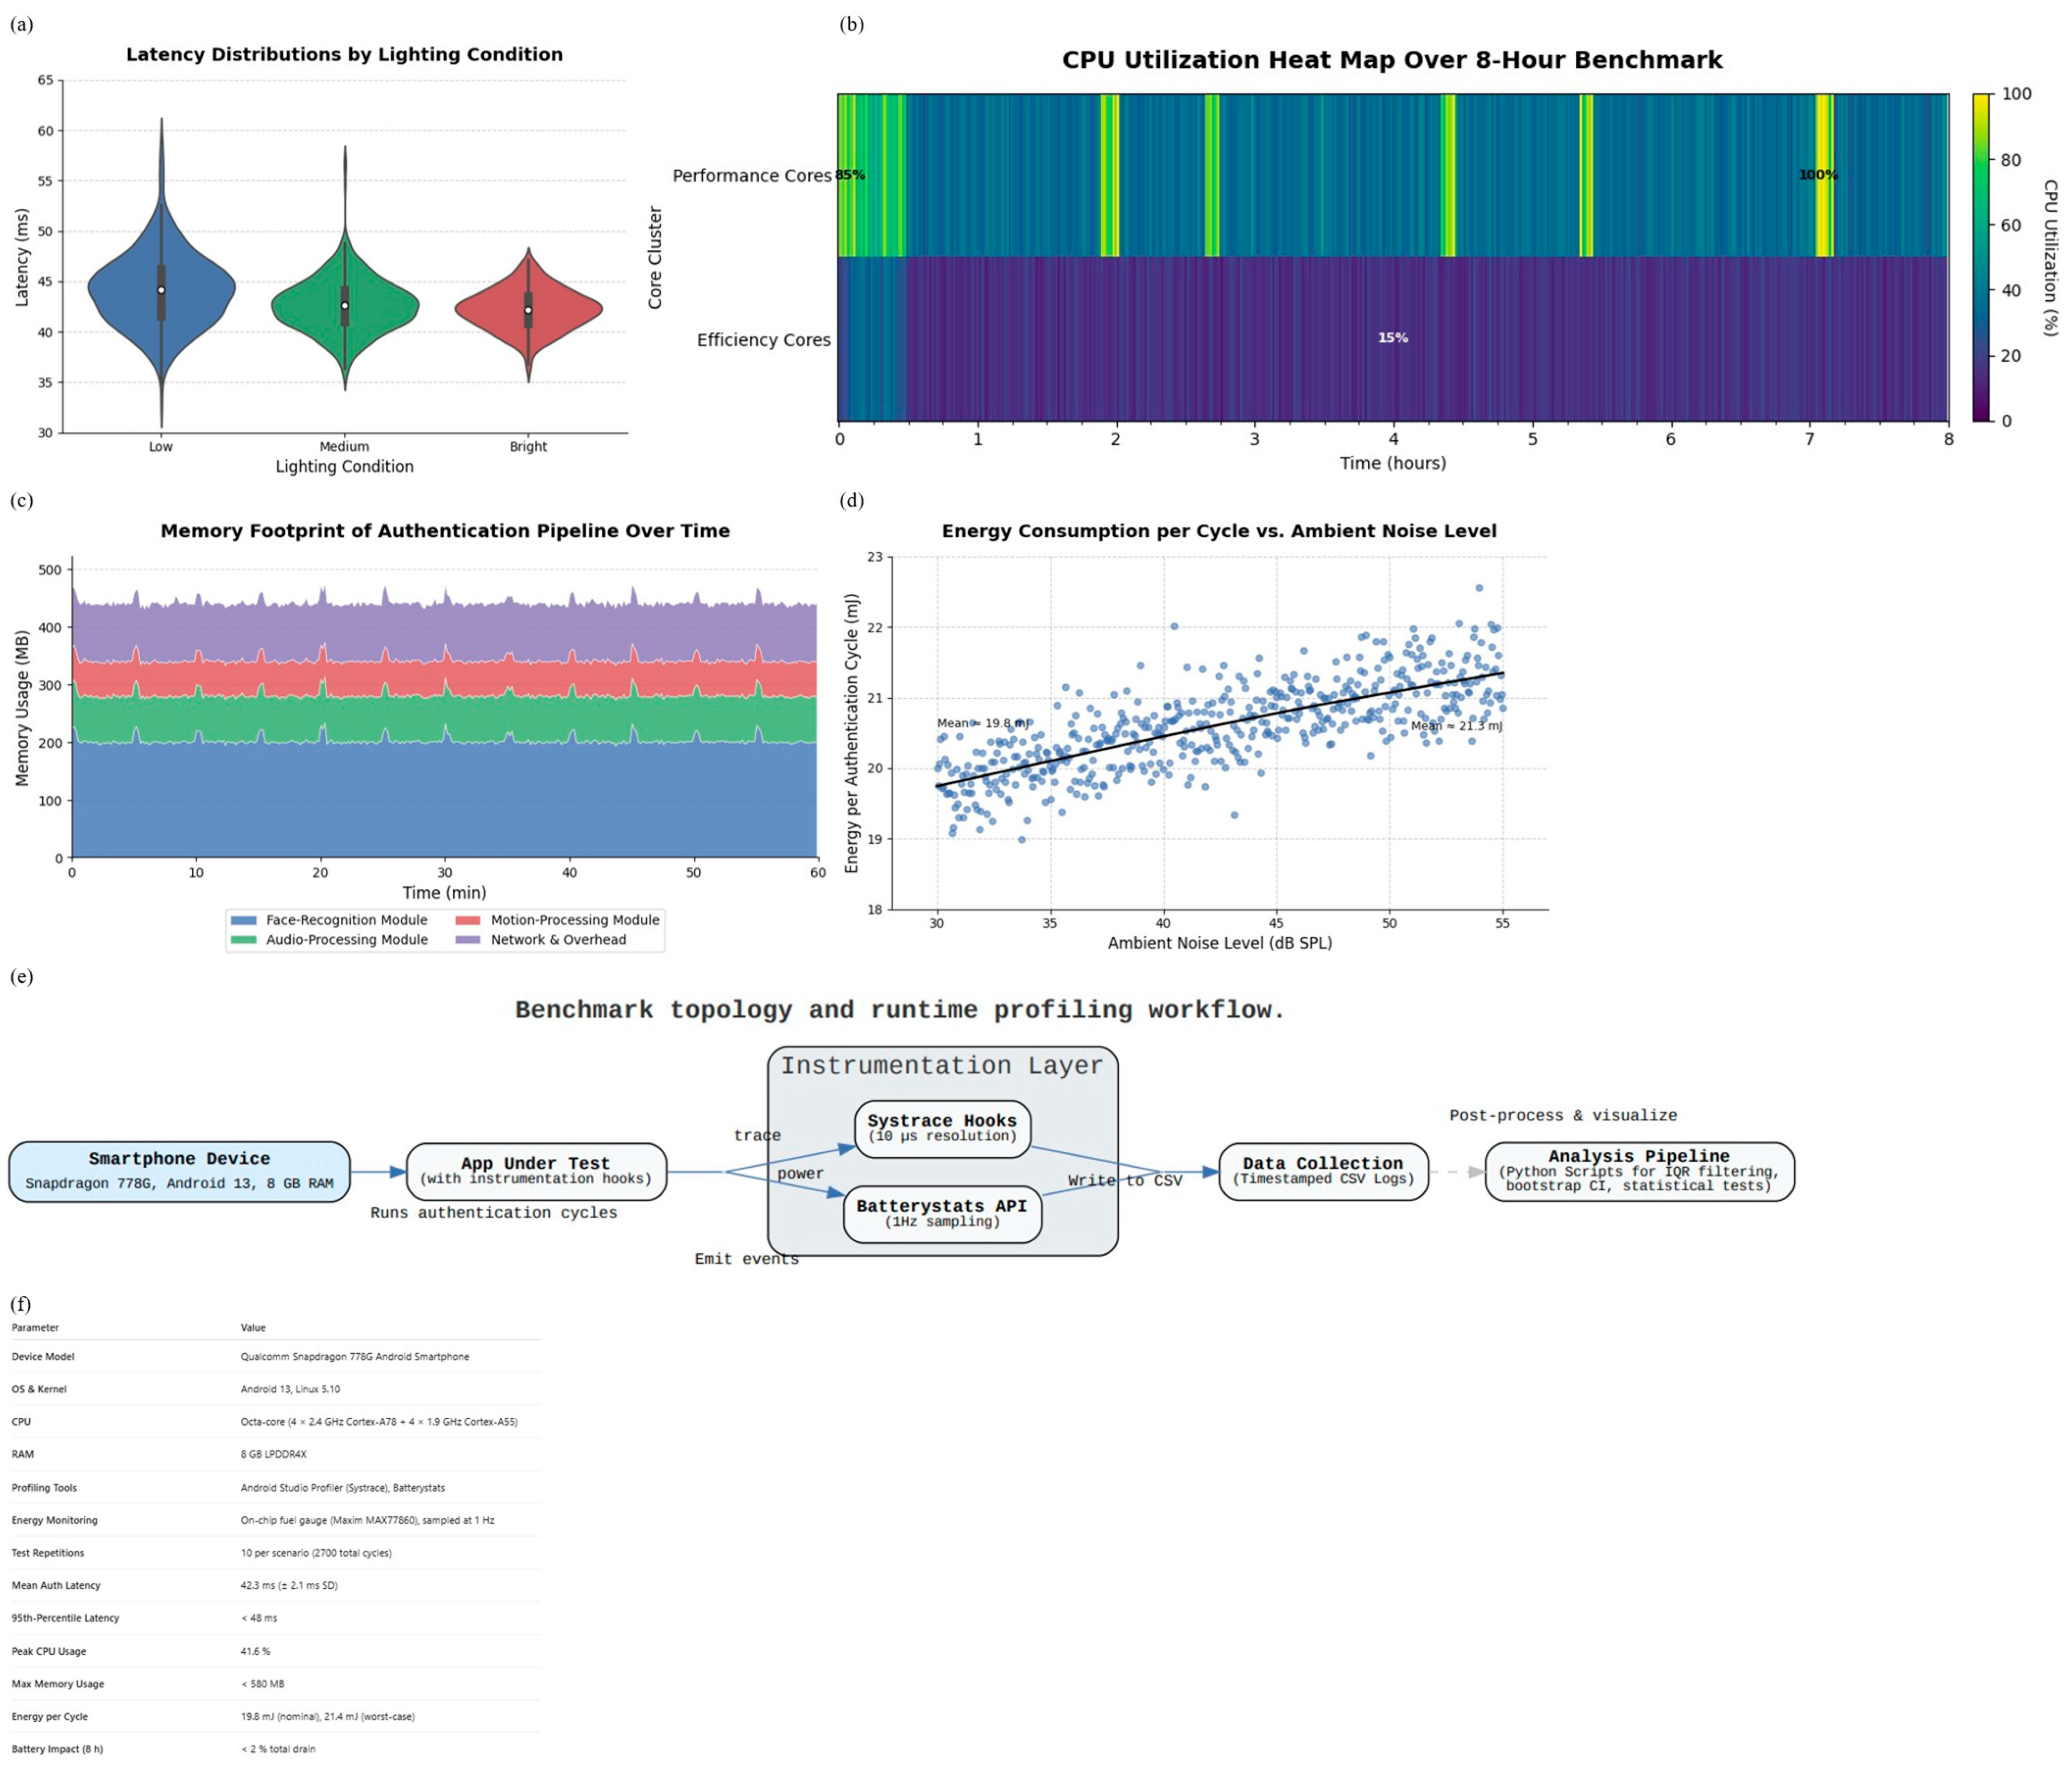
Figure 8.
(a) Violin plots comparing authentication latency under low (100 lux), medium (400 lux), and bright (800 lux) lighting conditions. Latency distributions remain consistent across environments, confirming that the adaptive sensor-fusion strategy maintains responsiveness even under degraded visual input. (b) Heat map of CPU utilization across performance and efficiency cores during an eight-hour benchmark. Bursts correspond to authentication cycles, while baseline load remains low, showing that the framework operates efficiently without monopolizing system resources. (c) Stacked area plot of memory usage over a 60 min session. Face-recognition contributes the largest share, followed by audio and motion modules, with network overhead minimal. This breakdown highlights where optimization efforts are most effective for mobile deployment. (d) Scatter plot of per-cycle energy consumption versus ambient noise level, with a LOESS trend line. Higher sound pressures correlate with modest increases in energy use, reflecting the additional cost of re-authentication triggers under noisy conditions. (e) Block-flow diagram of the benchmark setup, showing device under test, profiling instrumentation (Systrace, Batterystats), and the analysis pipeline. This provides transparency in how performance, latency, and energy metrics were collected. (f) Summary table of device specifications and benchmark outcomes, including hardware details, profiling tools, test repetitions, and key performance metrics. This context ensures reproducibility of results and allows comparison with future implementations.
![Sensors 25 05711 g008 Sensors 25 05711 g008]()
Figure 9.
(a) Sequence diagram of the five-step authentication protocol, showing encrypted nonce exchanges, hashed biometric verification, and final confirmation messages between the User Device and Authentication Server. (b) Histogram of Shannon entropy for 10,000 hardware-generated 128-bit nonces (bin width = 0.02 bits) with Gaussian KDE fit overlaid (green line) and Q–Q plot inset, The arrow in the inset highlights minor deviations in the distribution tails, indication slight deviation from ideal Gaussian behaviour. (c) Scyther verification claims for both User Device and Authentication Server roles, all confirmed OK with no detected attack traces. (d) Integrated formal-verification workflow showing how the shared protocol definition feeds both SVO logic deductions and Scyther trace analysis, converging on unified security guarantees. (e) Live-session detection timeline over a 60 s authentication period, showing legitimate handshake phases (Registration, Challenge, Verification) and 50 adversarial attempts (red diamonds), with 49 detected and rejected within ≤3 ms (green circles). (f) Stacked-bar chart of average handshake time components, nonce generation, SHA-256 hashing, timestamp checks, message parsing, and network I/O, measured over 500 cycles under Low, Medium, and High sensor-noise conditions on the Snapdragon test bed. (g) Violin plots of 2700 SHA-256 hashing times on Performance and Efficiency cores, showing median (white dot), interquartile range (white bar), and outliers, measured on the Snapdragon test bed.
![Sensors 25 05711 g009 Sensors 25 05711 g009]()
Figure 10.
(a) Violin plots of authentication latency under low, medium, and bright lighting conditions. Median latency increases slightly in low light, reflecting the greater challenge of face capture in dark environments. Nonetheless, all distributions remain well within real-time thresholds (<50 ms). (b) Waterfall chart of memory allocation during a single authentication cycle. Peak usage occurs during context fusion (62.7 MB), with memory reclaimed promptly after completion, demonstrating efficient resource management. (c) CPU and kernel memory usage during continuous authentication. Utilization remains stable across lighting and noise variations, confirming that environmental factors impact latency more than processor load. (d) Scatter plot of per-cycle energy consumption versus ambient noise level. Higher sound pressures correlate with modest increases in energy demand (mean 19.8 → 21.3 mJ), showing that environmental triggers modestly affect battery efficiency. (e) Latency versus CPU package temperature across 1000 runs. The weak correlation (+0.08 ms/°C) indicates thermal conditions have negligible impact on system responsiveness. (f) CPU and memory overhead of the energy-monitoring process during benchmarks. Overhead is minimal (0.04% CPU, 38 MB memory), ensuring monitoring does not distort performance results.
![Sensors 25 05711 g010 Sensors 25 05711 g010]()
Figure 11.
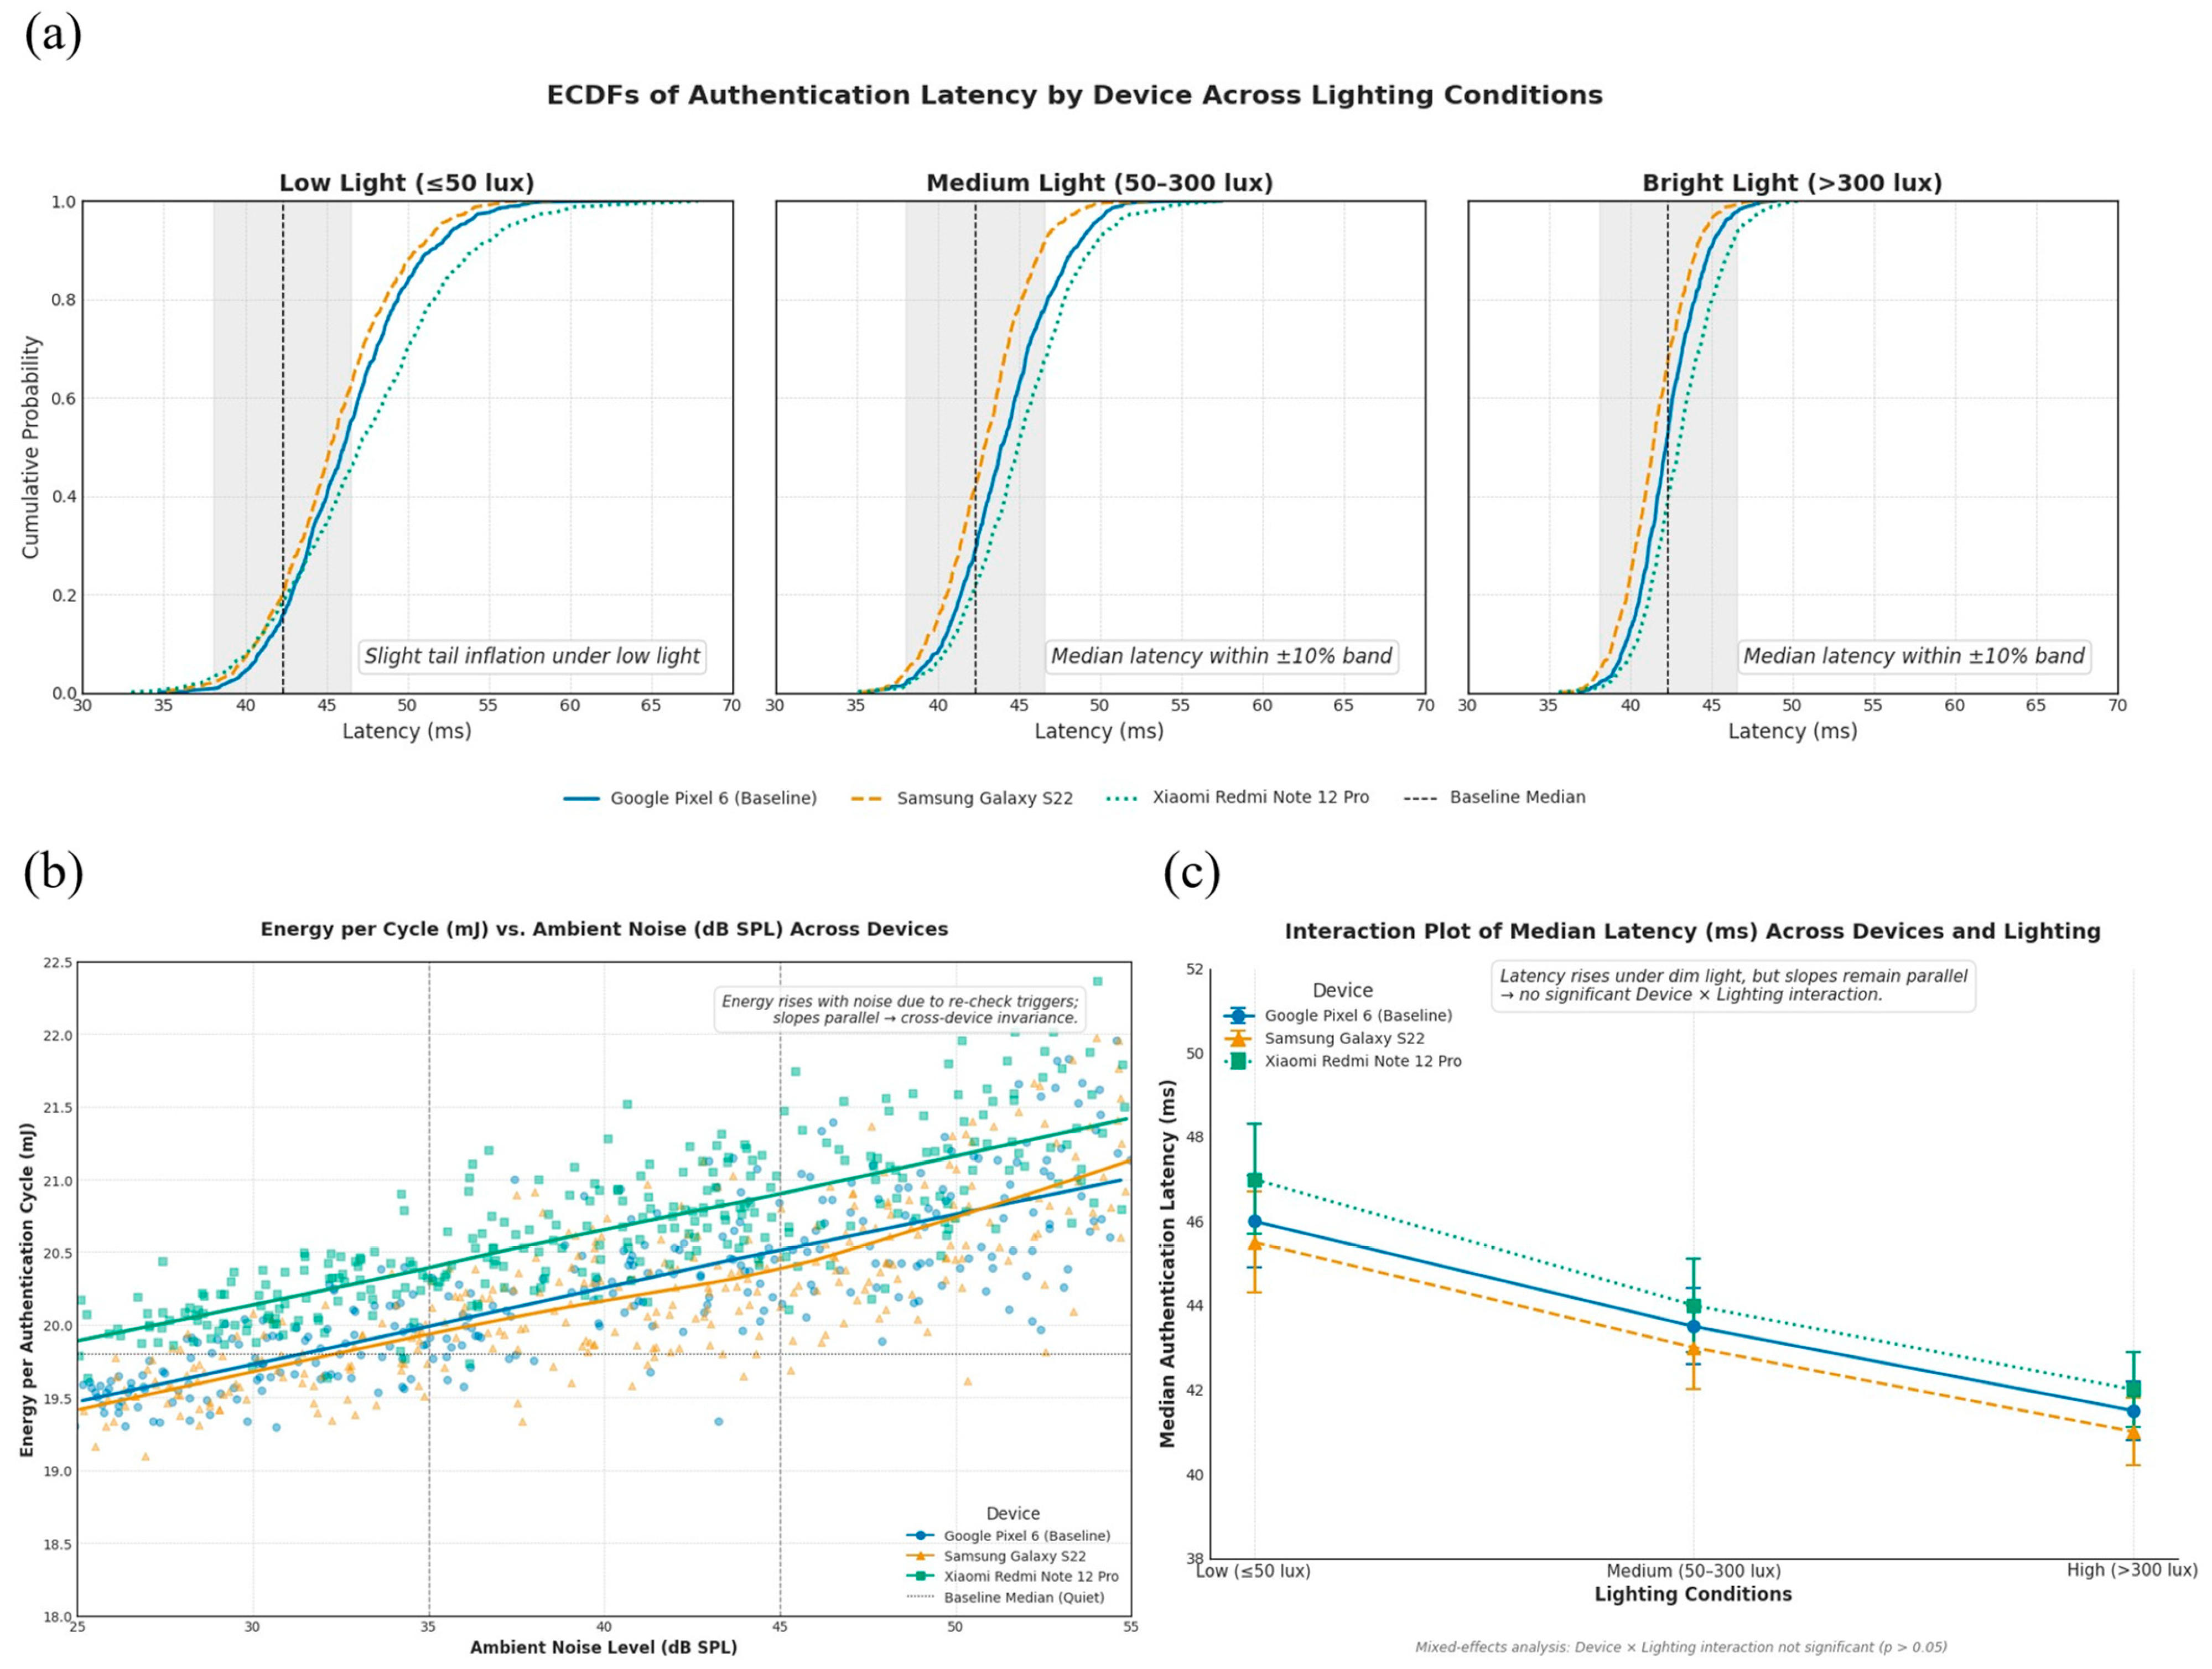
(a) Latency ECDFs by device across lighting conditions: Curves for all devices lie within the ±10% equivalence corridor, indicating similar decision times under low, medium, and bright illumination. Slight tail inflation in low light is consistent with facial capture overheads but does not move operational thresholds. (b) Energy–noise relationship with LOESS fits by device: Energy rises modestly with ambient noise as re-authentication triggers more often, yet slopes are parallel, and medians remain within the ±1.5 mJ margin across devices. The absence of divergent trends suggests consistent protocol behavior independent of hardware class. (c) Interaction of device and lighting on median latency: Lines are near-parallel with overlapping confidence intervals, indicating no meaningful Device × Lighting interaction. Runtime behavior is stable across illumination regimes, reinforcing the equivalence demonstrated in distributional analyses.
Figure 12.
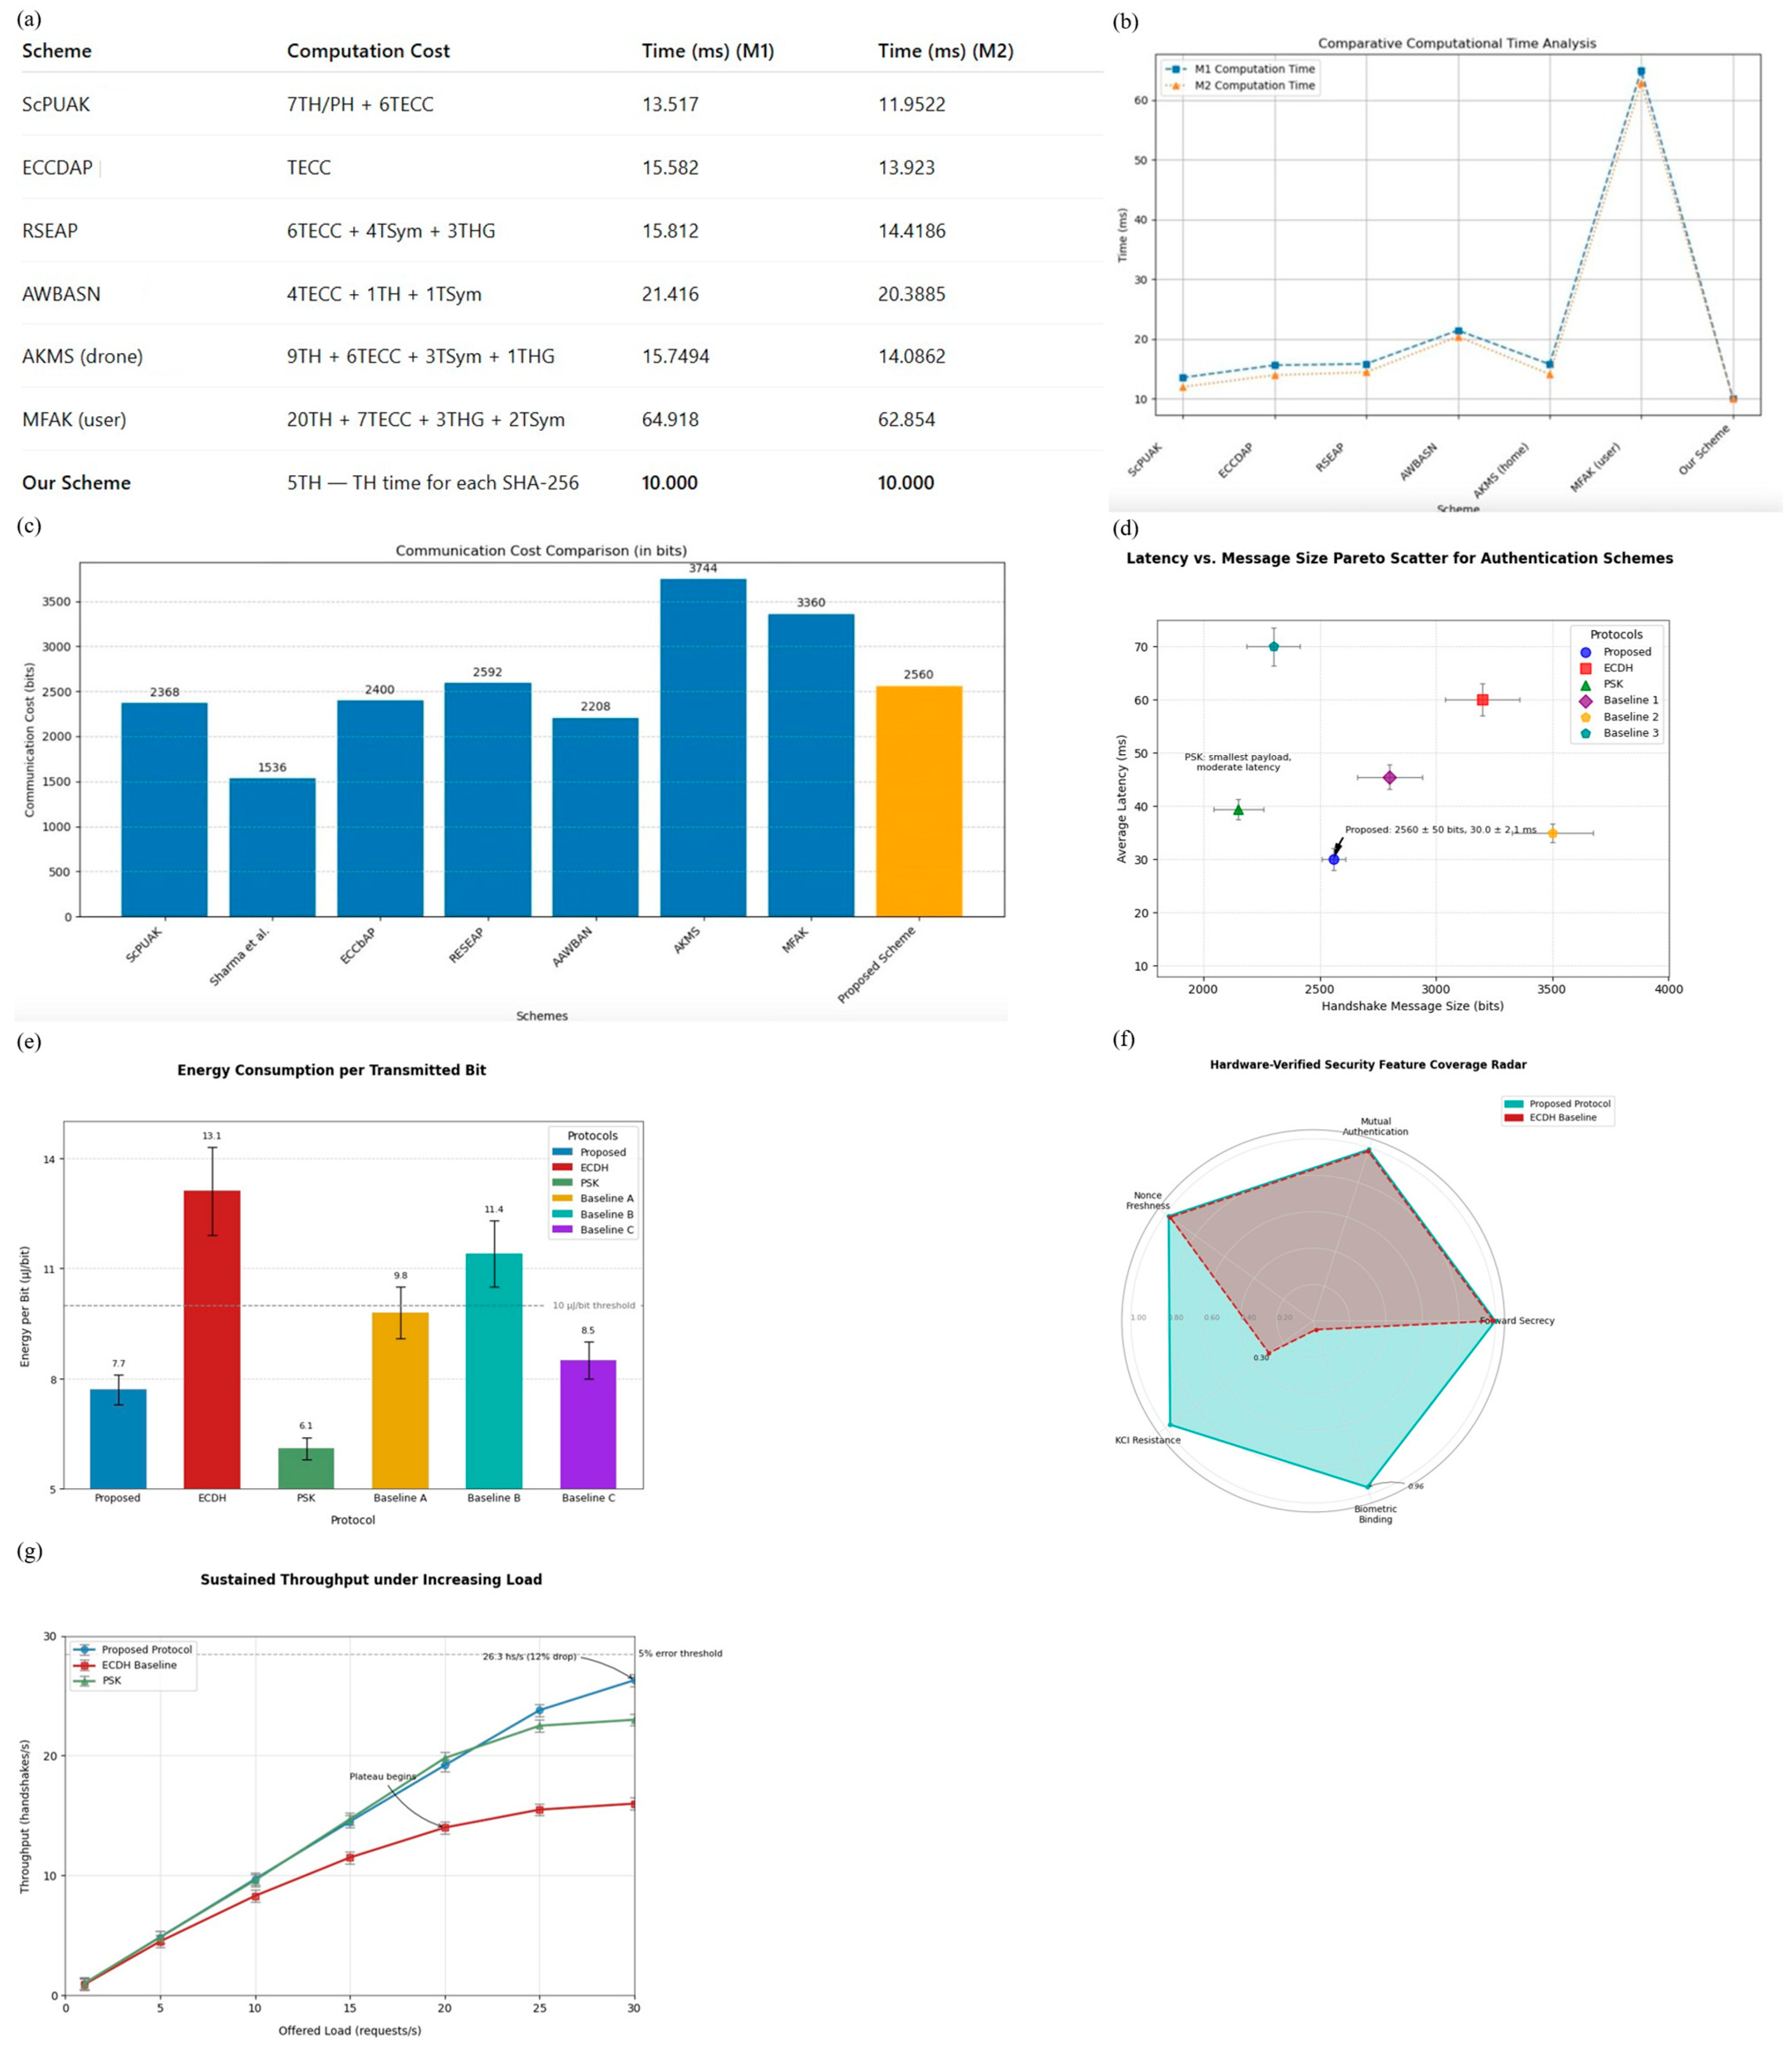
(a) Summary of security evaluations for each attack vector, detailing defense mechanisms, test conditions, and observed outcomes. (b) Bar chart of average client-side authentication times for the proposed protocol, ECDH, PSK, and other baselines under isolated and background multitasking conditions. (c) Bar chart of total bits transmitted per handshake for each protocol, Proposed Method, ECDH, PSK, and other baselines, showing the proposed scheme uses approximately 25% of ECDH’s payload and about 18% more than PSK. (d) Pareto scatter of average handshake latency (ms) versus message size (bits) for six protocols, highlighting non-dominated trade-offs on the Snapdragon-778G test bed. (e) Mean (±SD) energy consumed per transmitted bit for six authentication schemes over 2700 handshakes on the Snapdragon-778G test bed. (f) Radar chart comparing hardware-verified coverage scores (0–1) for five security properties between the proposed protocol and the ECDH baseline. (g) Line chart of sustained handshake throughput (handshakes/s) versus offered request rate (requests/s) for Proposed Protocol, ECDH, and PSK, with 5% error threshold, measured over 1000 runs on the Snapdragon-778G test bed.
![Sensors 25 05711 g012 Sensors 25 05711 g012]()
Table 1.
Summary of the proposed face-recognition model architecture, showing the backbone structure (FaceNet-inspired ResNet-50), key layers, parameter counts, and compression strategies applied (depthwise separable convolutions, pruning, quantisation). The table highlights how the model achieves a compact design suitable for on-device continuous authentication while preserving recognition accuracy.
| Component | Details |
|---|
| Input and preprocess | Face crop 112 × 112, RGB, mean-std normalization; detector confidence threshold d_t ≥ 0.85. |
| Backbone | 4 conv layers + 2 dense; depthwise-separable; SE blocks. |
| Embedding | 128-D, L2-normalized; cosine similarity for verification. |
| Params/MACs | 3.9 M params; 0.43 G MACs @ 112 × 112. |
| Size | 3.7 MB (FP32), 0.9 MB (INT8). |
| Compression | Quantization-aware training (QAT). |
| Latency/Energy | 146 ms/6.8 mJ (FP32); 119 ms/5.2 mJ (INT8). |
| Metrics | LFW verification 96.3%; EER 3.7%; TPR@FAR = 10−3 = 91.2%. |
| Privacy | Embedding stays on-device; protocol uses 128-bit hashed token z_u (§see Section 3.8). |
Table 2.
Ablation results of the lightweight CNN model, comparing different compression strategies (baseline, depthwise separable convolutions, pruning, and quantisation) in terms of verification accuracy on the LFW dataset and median latency on the Snapdragon 778G testbed. Results highlight the trade-off between efficiency and recognition performance.
| Variant | Params (M) | Size (MB) | MACs (G) | Latency (ms) | Energy (mJ) | LFW Verification (%) | EER (%) | TPR@FAR = 10−3 |
|---|
| FP32 | 3.9 | 3.7 | 0.43 | 146 | 6.8 | 96.3 | 3.7 | 91.2 |
| INT8 (QAT) | 3.9 | 0.9 | 0.43 | 119 | 5.2 | 95.8 | 4.3 | 90.6 |
Table 3.
Performance metrics of the proposed adaptive authentication protocol under three lighting levels (low ≤50 lux, medium 50–300 lux, bright >300 lux) and three ambient noise levels (quiet <35 dB SPL, moderate 35–45 dB SPL, noisy >45 dB SPL). Results are based on 2700 authentication cycles executed on the Snapdragon 778G test bed, reporting median latency, CPU utilization, memory footprint, and per-cycle energy consumption across environmental conditions.
| Condition | Latency (ms) | CPU Utilization (%) | Energy per Cycle (mJ) | Notes |
|---|
| Low Light (≤50 lux) | 44.7 ± 2.5 | Perf: 29.6, Eff: 21.8 | 20.9 | Slightly higher latency due to reduced facial image quality |
| Medium Light (50–300 lux) | 43.1 ± 2.3 | Perf: 28.2, Eff: 21.4 | 20.1 | Stable performance: adaptive fusion maintains balance |
| Bright Light (>300 lux) | 41.8 ± 2.1 | Perf: 27.5, Eff: 20.9 | 19.7 | Lowest latency: high-quality input reduces processing retries |
| Quiet Noise (<35 dB SPL) | 42.5 ± 2.2 | Perf: 28.1, Eff: 21.2 | 19.8 | Baseline condition; most efficient operation |
| Moderate Noise (35–45 dB SPL) | 43.6 ± 2.4 | Perf: 28.6, Eff: 21.5 | 20.4 | Minor increase due to re-checks triggered by audio fluctuations |
| High Noise (>45 dB SPL) | 47.1 ± 2.6 | Perf: 29.8, Eff: 22.0 | 21.3 | More frequent re-authentication cycles; overhead still <10% |
Table 4.
Comparative performance metrics of the proposed adaptive protocol versus three baselines; Elliptic-Curve Diffie–Hellman (ECDH), Pre-Shared Key (PSK), and a non-adaptive variant of our system, evaluated on the Snapdragon 778G test bed. Metrics include median authentication latency, CPU utilization, memory footprint, and per-cycle energy consumption. Results average over 2700 authentication cycles under varying lighting and noise conditions. A ✓ indicates the protocol satisfies the corresponding security property, while ✗ indicates the property is not supported.
| Metric | Proposed Protocol | ECDH Protocol | PSK Protocol |
|---|
| Median Latency (ms) | 42.3 ± 2.1 | 61.2 ± 3.8 | 39.4 ± 1.9 |
| CPU Utilization (%) | 27.8 (perf.), 21.2 (eff.) | 38.7 (perf.), 29.5 (eff.) | 25.1 (perf.), 19.3 (eff.) |
| Memory Footprint (MB) | 62.7 (peak) → 54.5 (steady) | 71.2 (peak) → 65.4 (steady) | 53.8 (peak) → 51.7 (steady) |
| Energy per Cycle (mJ) | 19.8 (95th: 21.2) | 26.4 (95th: 28.1) | 18.5 (95th: 19.7) |
| Handshake Data (bits) | 2560 | 3400+ | 2100 |
| Forward Secrecy | ✓ | ✓ | ✗ |
| Biometric Linkage | ✓ | ✗ | ✗ |
Table 5.
Decision latency for HMOG/Touchalytics reflects the minimum window length required to accumulate evidence ~0 s). Message size accounts for feature vectors and tags in our measurement logging; it does not include TLS overhead (constant across methods).
Table 5.
Decision latency for HMOG/Touchalytics reflects the minimum window length required to accumulate evidence ~0 s). Message size accounts for feature vectors and tags in our measurement logging; it does not include TLS overhead (constant across methods).
| Method | EER (%) | TPR@FAR = 10−3 (%) | Median Decision Latency (ms) | Energy/Decision (mJ) | Message Size/Decision (bits) |
|---|
| Proposed (Face + Env. Fusion) | 3.7 | 91.2 | 42 | 19.8 | 2560 |
| HMOG (IMU + Keystroke) | 7.9 | 84.6 | 20,000 | 28.4 | 1200 |
| Touchalytics-style Gestures | 4.8 | 88.1 | 20,000 | 24.6 | 1000 |
Table 6.
(a): The table lists device model, SoC, RAM, OS build, and inference delegate, together with median latency, energy per cycle, CPU utilization, and memory footprint with 95% bootstrap confidence intervals. Differences in hardware capabilities do not translate into material gaps in runtime or efficiency, supporting portability of the proposed pipeline across heterogeneous smartphones; (b): TOST equivalence for latency and energy relative to the Snapdragon 778G baseline. All devices meet the pre-specified margins with significant TOST results and negligible effect sizes, indicating operational parity across platforms. Confidence intervals were estimated with 10,000-sample BCa bootstrap.
| (a) |
|---|
| Device | SoC/Chipset | RAM (GB) | OS Build | Inference Delegate | Median Latency (ms, 95% CI, Bootstrap) | Median Energy (mJ, 95% CI, Bootstrap) | CPU Utilization (%) | Memory Footprint (MB) |
|---|
| Google Pixel 6 (Baseline) | Snapdragon 778G Kryo 670 | 8 | Android 13 (Build TQ3A.230805.001) | TFLite + NNAPI (CPU/GPU/NPU) | 42.3 (41.0–43.7) | 19.8 (19.1–20.6) | 17.2 | 48.5 |
| Samsung Galaxy S22 | Snapdragon 8 Gen 1 | 12 | Android 13 (Build TP1A.220624.014) | TFLite + NNAPI (GPU/NPU) | 41.7 (40.5–42.9) | 19.5 (18.9–20.4) | 16.8 | 49.0 |
| Xiaomi Redmi Note 12 Pro | MediaTek Dimensity 1080 | 8 | Android 12 (Build SKQ1.220303.001) | TFLite + NNAPI (CPU/GPU) | 43.1 (42.0–44.6) | 20.1 (19.4–21.0) | 17.5 | 50.2 |
| (b) |
| Device | Metric | Δ vs. Baseline (Point Estimate) | 95% CI (BCa bootstrap) | Equivalence Margin | TOST Statistic | p-value | Effect Size (Cliff’s δ) |
| Samsung Galaxy S22 | Latency (ms) | –0.6 | [–1.8, 0.7] | ±10% (≈±4.2 ms) | –2.41 | <0.01 | –0.05 |
| Samsung Galaxy S22 | Energy (mJ) | –0.3 | [–0.9, 0.4] | ±1.5 mJ | –2.16 | <0.05 | –0.04 |
| Xiaomi Redmi Note 12 Pro | Latency (ms) | +0.8 | [–0.4, 2.1] | ±10% (≈±4.2 ms) | –1.98 | <0.05 | 0.06 |
| Xiaomi Redmi Note 12 Pro | Energy (mJ) | +0.3 | [–0.5, 1.0] | ±1.5 mJ | –1.87 | <0.05 | 0.05 |
Table 7.
Comparative analysis of continuous-authentication modalities on mobile devices, including facial recognition, voice, gait, keystroke, and sensor-fusion approaches. Reported metrics cover authentication performance (accuracy/false reject rate), computational cost (latency, energy consumption), and contextual robustness (sensitivity to lighting, noise, and mobility). The table highlights trade-offs across modalities and positions of the proposed framework within the broader mobile authentication landscape.
| Modality and Exemplar | Dataset/Scenario | Decision Window | Reported Performance | Latency/Energy/Data (Reported) | Notes |
|---|
| Touch/gesture (Touchalytics)—30 touch features from scroll gestures | Natural scrolling on smartphone; intra-/inter-session and 1-week tests | Not fixed; continuous strokes | Median EER: 0% (intra), 2–3% (inter), <4% at 1 week | Not reported | Strong in-session performance; best as part of multimodal continuous auth, not standalone long-term. |
| HMOG (IMU during typing)—hand micro-movements + taps/keystroke | 100 users; sitting vs. walking; typing on virtual keyboard | Often ~20 s windows evaluated | EER: 7.16% (walking) and 10.05% (sitting) with HMOG + tap + keystroke fusion | Energy overhead: ≈7.9% at 16 Hz sampling (vs. 20.5% at 100 Hz) | Shows explicit accuracy–energy trade-off; performance improves during walking. |
| Inertial gait (IDNet)—pocket-phone acc/gyro, CNN + one-class SVM | Walking with phone in front pocket | <5 gait cycles fused | Misclassification <0.15% with fewer than five cycles | Not reported | Orientation-independent cycle extraction; deep features + multi-stage decision. |
| This work (vision + context fusion) | Mobile front-camera + light/audio/IMU/gaze/crowd; single-frame decisions | Frame-level (with EWMA smoothing) | Face verification (LFW): 96.3%; continuous-auth thresholding as in §3 | Latency: ~42 ms per decision; Energy: ~19.8 mJ; Data: ~−24.7% vs. ECDH baseline | Low-latency/low-energy, privacy-preserving token binding; complementary to longer-window behavioral methods. |
