Figure 1.
Hardware architecture and hardware implementation: (a) Architecture of the instrumental smart meter with embedded NILM including device under test (DUT), analog voltage, current measurement, and embedded boards. (b) Hardware implementation of the proposed smart meter. (1) Voltage measurement, (2) current measurement, (3) over-voltage protection, (4) low-pass filtering, (5) output decoupling, (6) embedded board.
Figure 2.
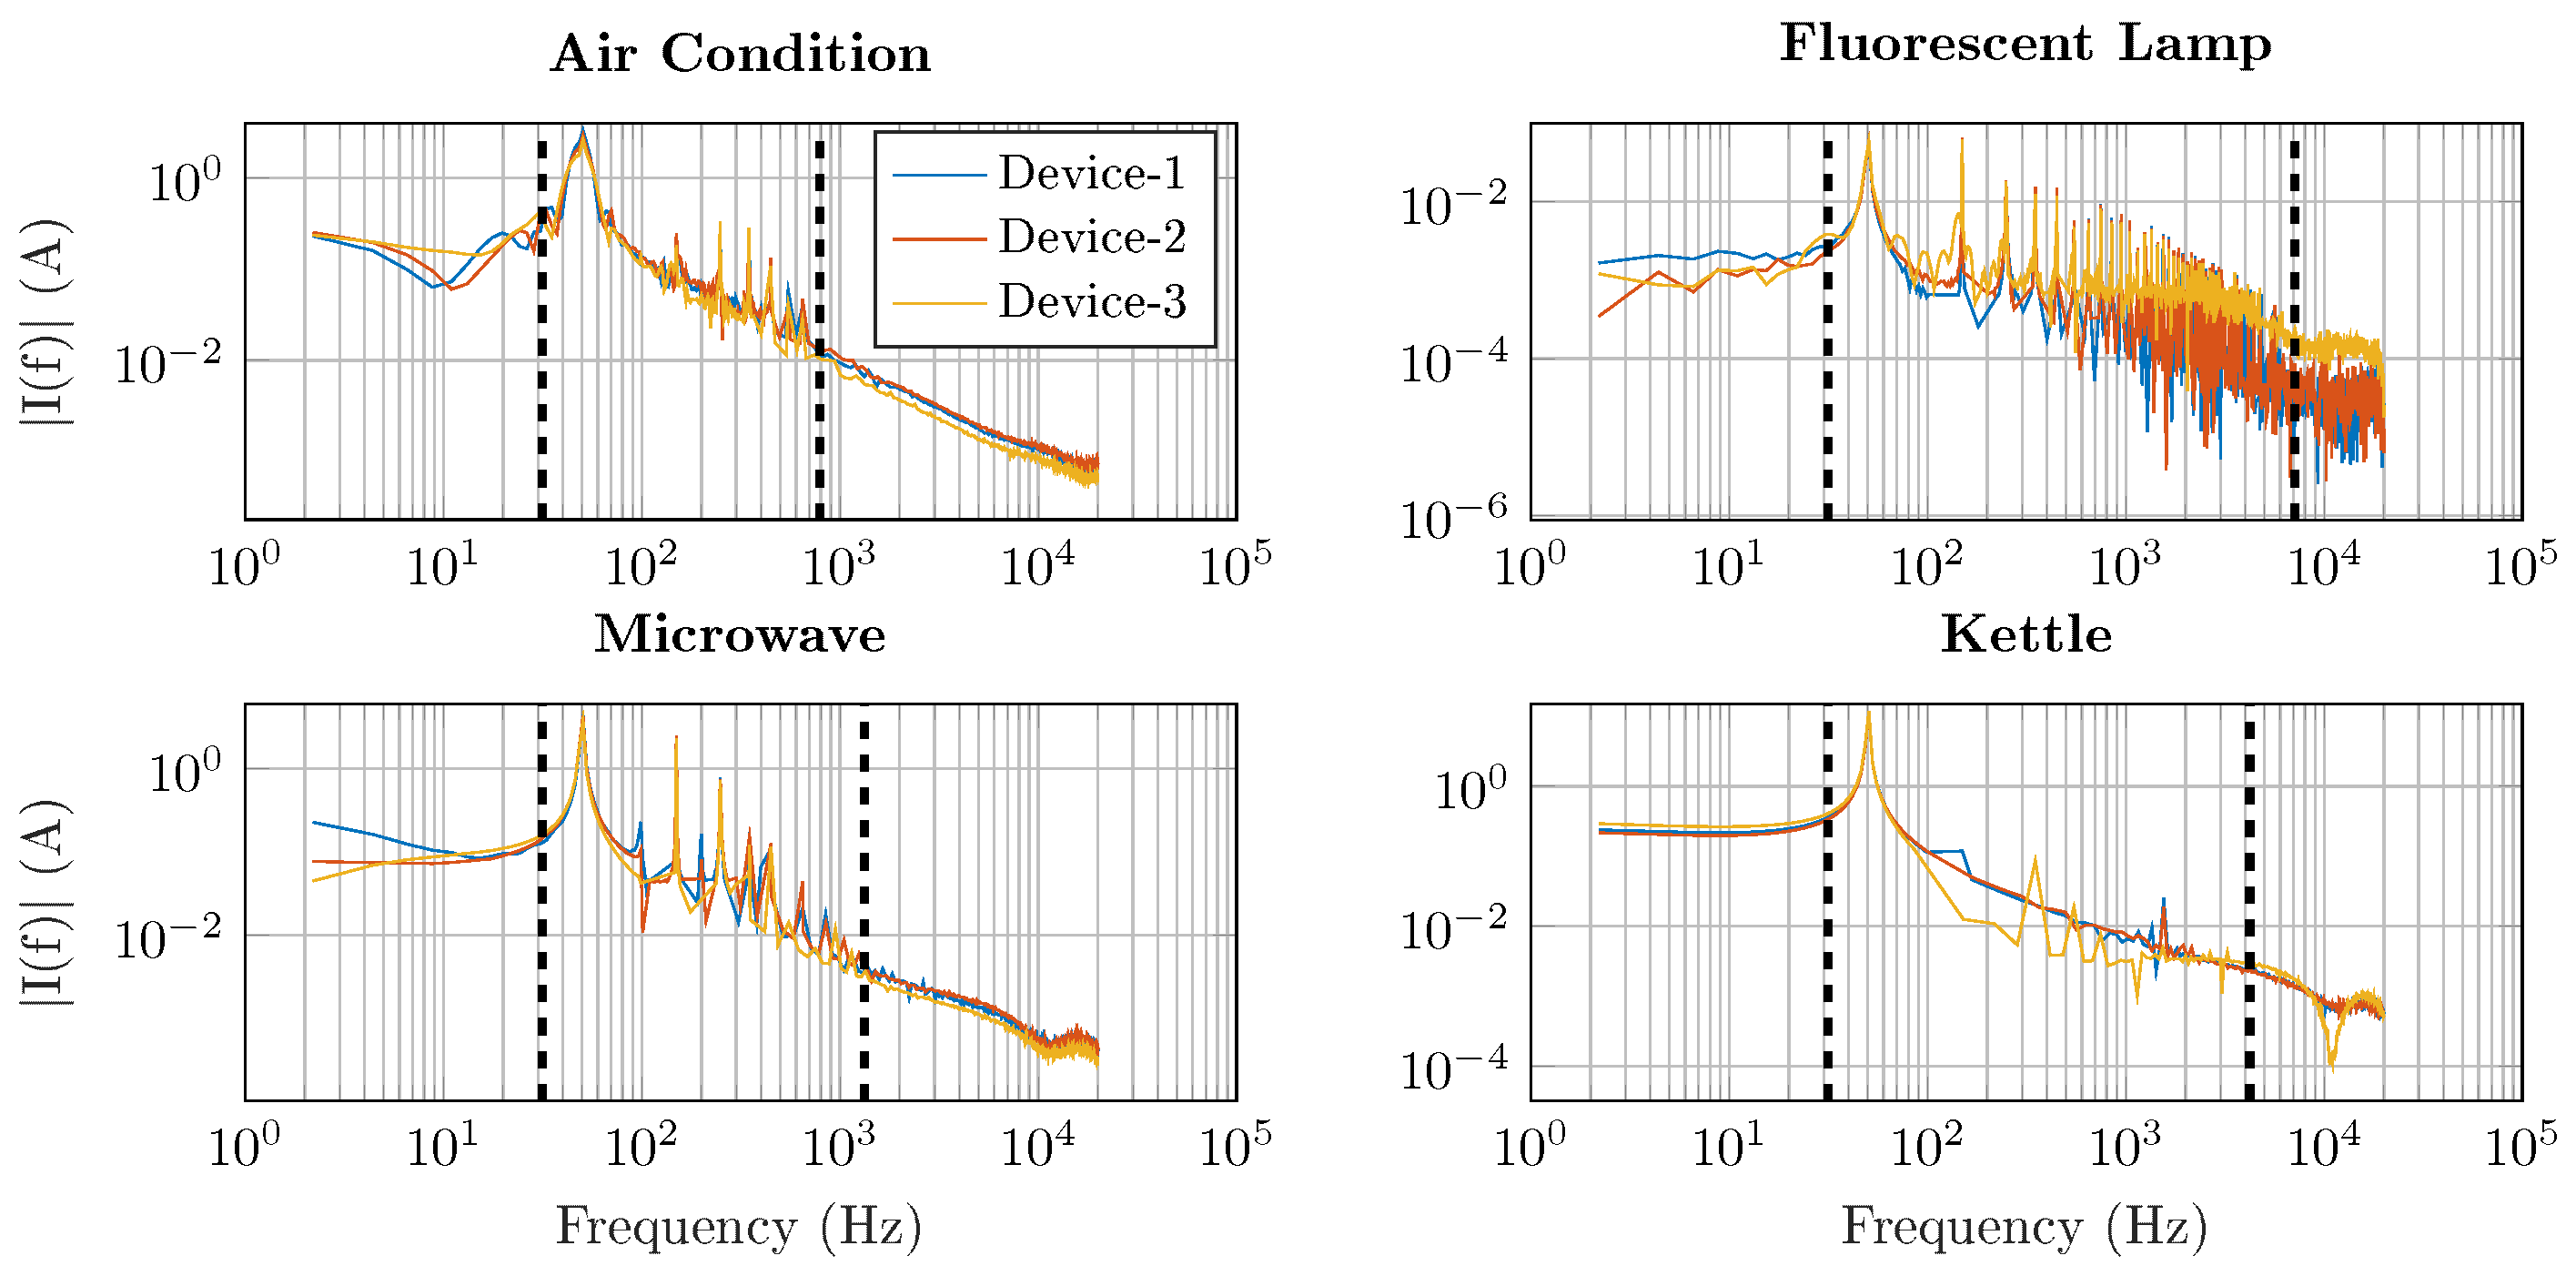
Current spectrum of four different devices from three manufacturers, each recorded at 44 kHz. Black dashed lines denote the relevant frequency content of each appliance.
Figure 2.
Current spectrum of four different devices from three manufacturers, each recorded at 44 kHz. Black dashed lines denote the relevant frequency content of each appliance.
Figure 3.
Software architecture including framing, feature extraction, pre-processing, and CNN regression.
Figure 3.
Software architecture including framing, feature extraction, pre-processing, and CNN regression.
Figure 4.
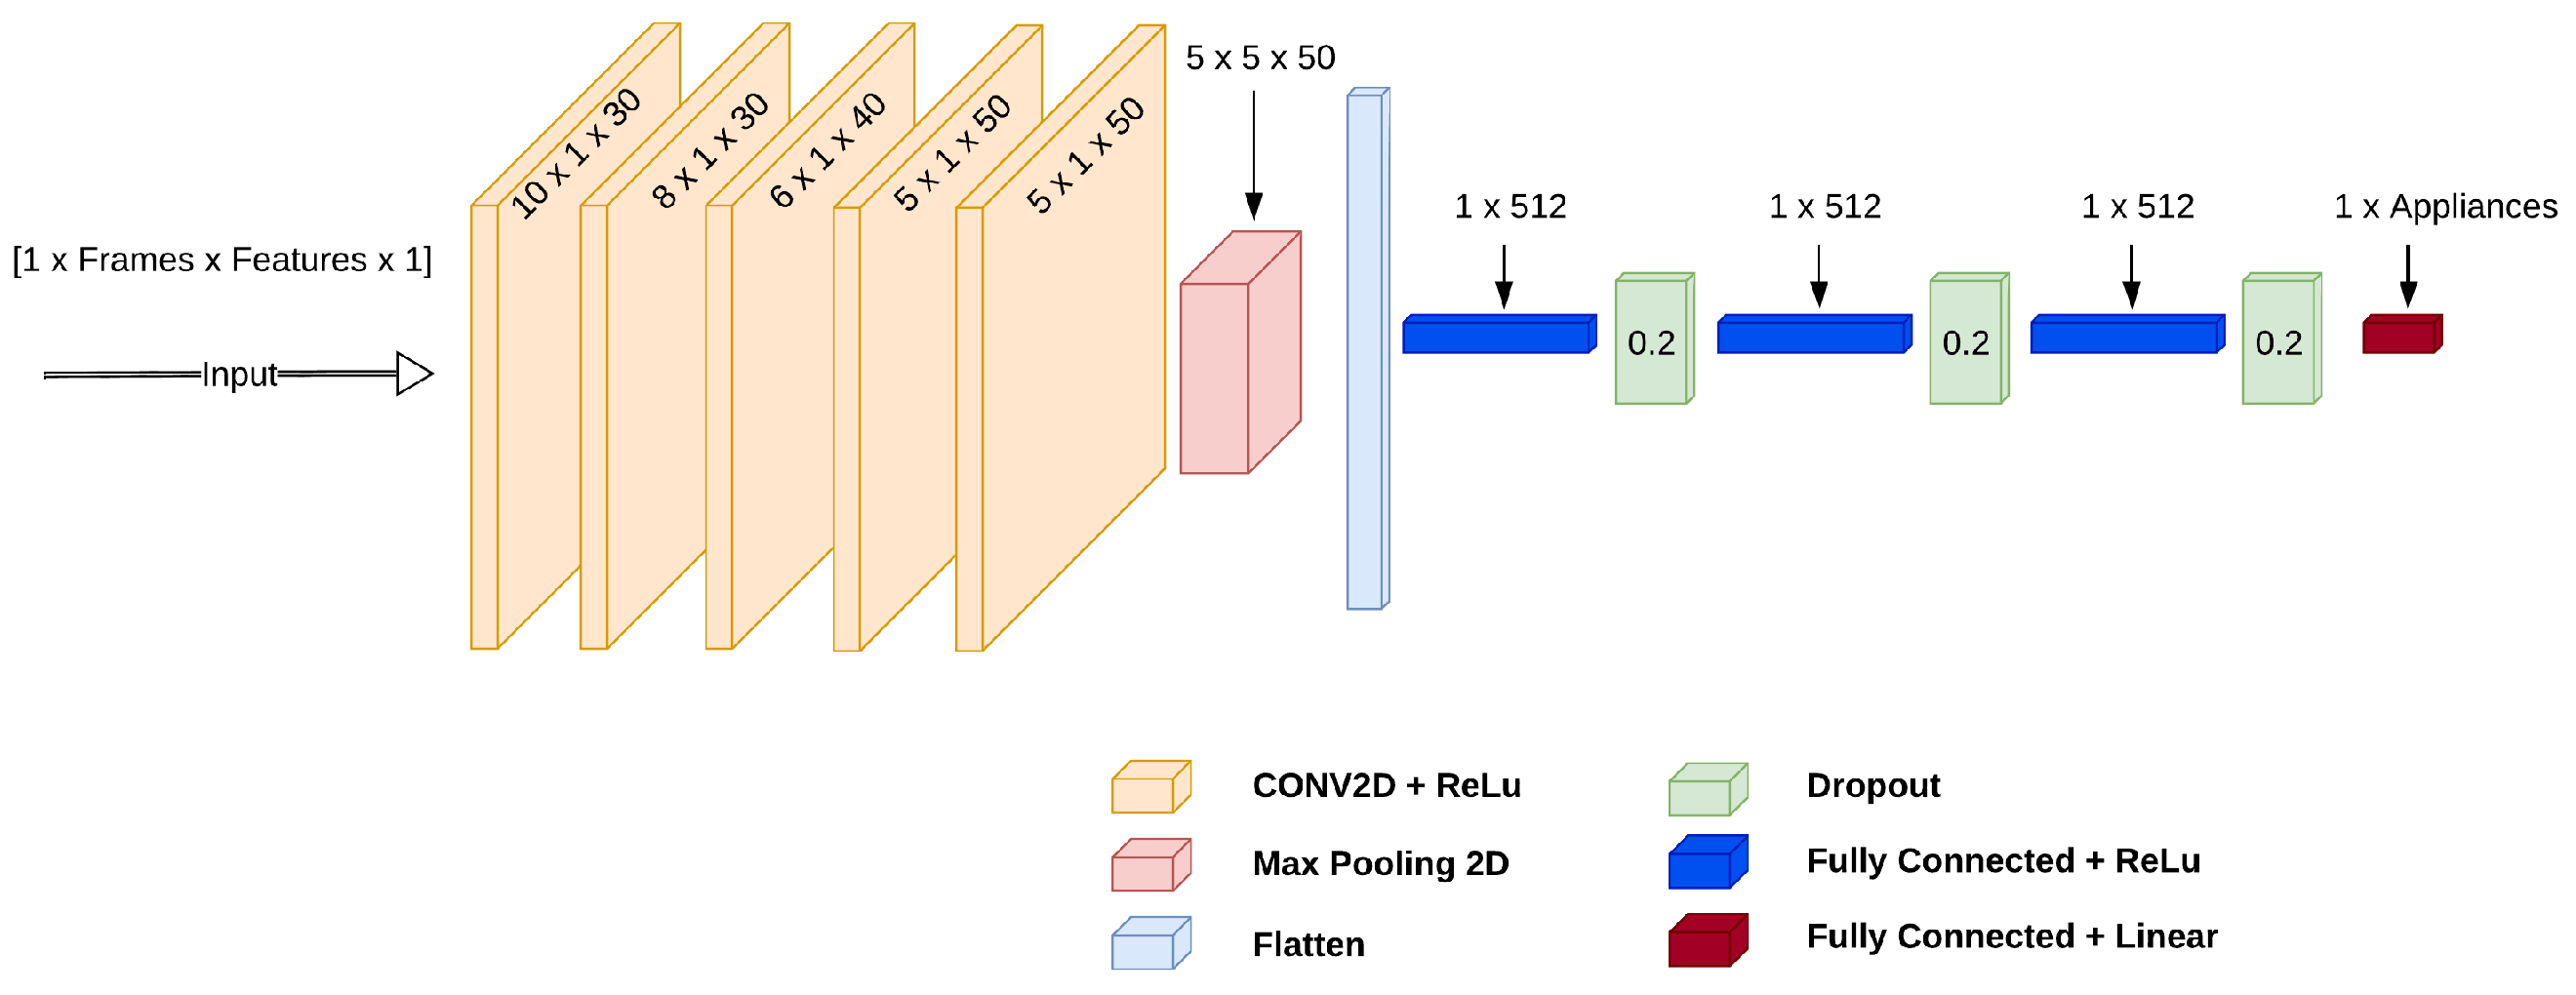
CNN architecture including five CNN and three DNN layers. The CNN layers are written in the format ‘conv(x,y)’ where x is the kernel size and y is the number of filters.
Figure 4.
CNN architecture including five CNN and three DNN layers. The CNN layers are written in the format ‘conv(x,y)’ where x is the kernel size and y is the number of filters.
Figure 5.
Comparison of waveforms of current and voltage measurements of one fundamental cycle for (a) DUT-1 (resistor kettle) and (b) DUT-2 (nonlinear fluorescent lamp) including error distribution for current and voltage waveforms as well as their harmonics.
Figure 5.
Comparison of waveforms of current and voltage measurements of one fundamental cycle for (a) DUT-1 (resistor kettle) and (b) DUT-2 (nonlinear fluorescent lamp) including error distribution for current and voltage waveforms as well as their harmonics.
Figure 6.
Average power consumption (standby, runtime, and peak operation) for different boards. RP4 utilizes one thread (RP4:1) and four threads (RP4:4).
Figure 6.
Average power consumption (standby, runtime, and peak operation) for different boards. RP4 utilizes one thread (RP4:1) and four threads (RP4:4).
Figure 7.
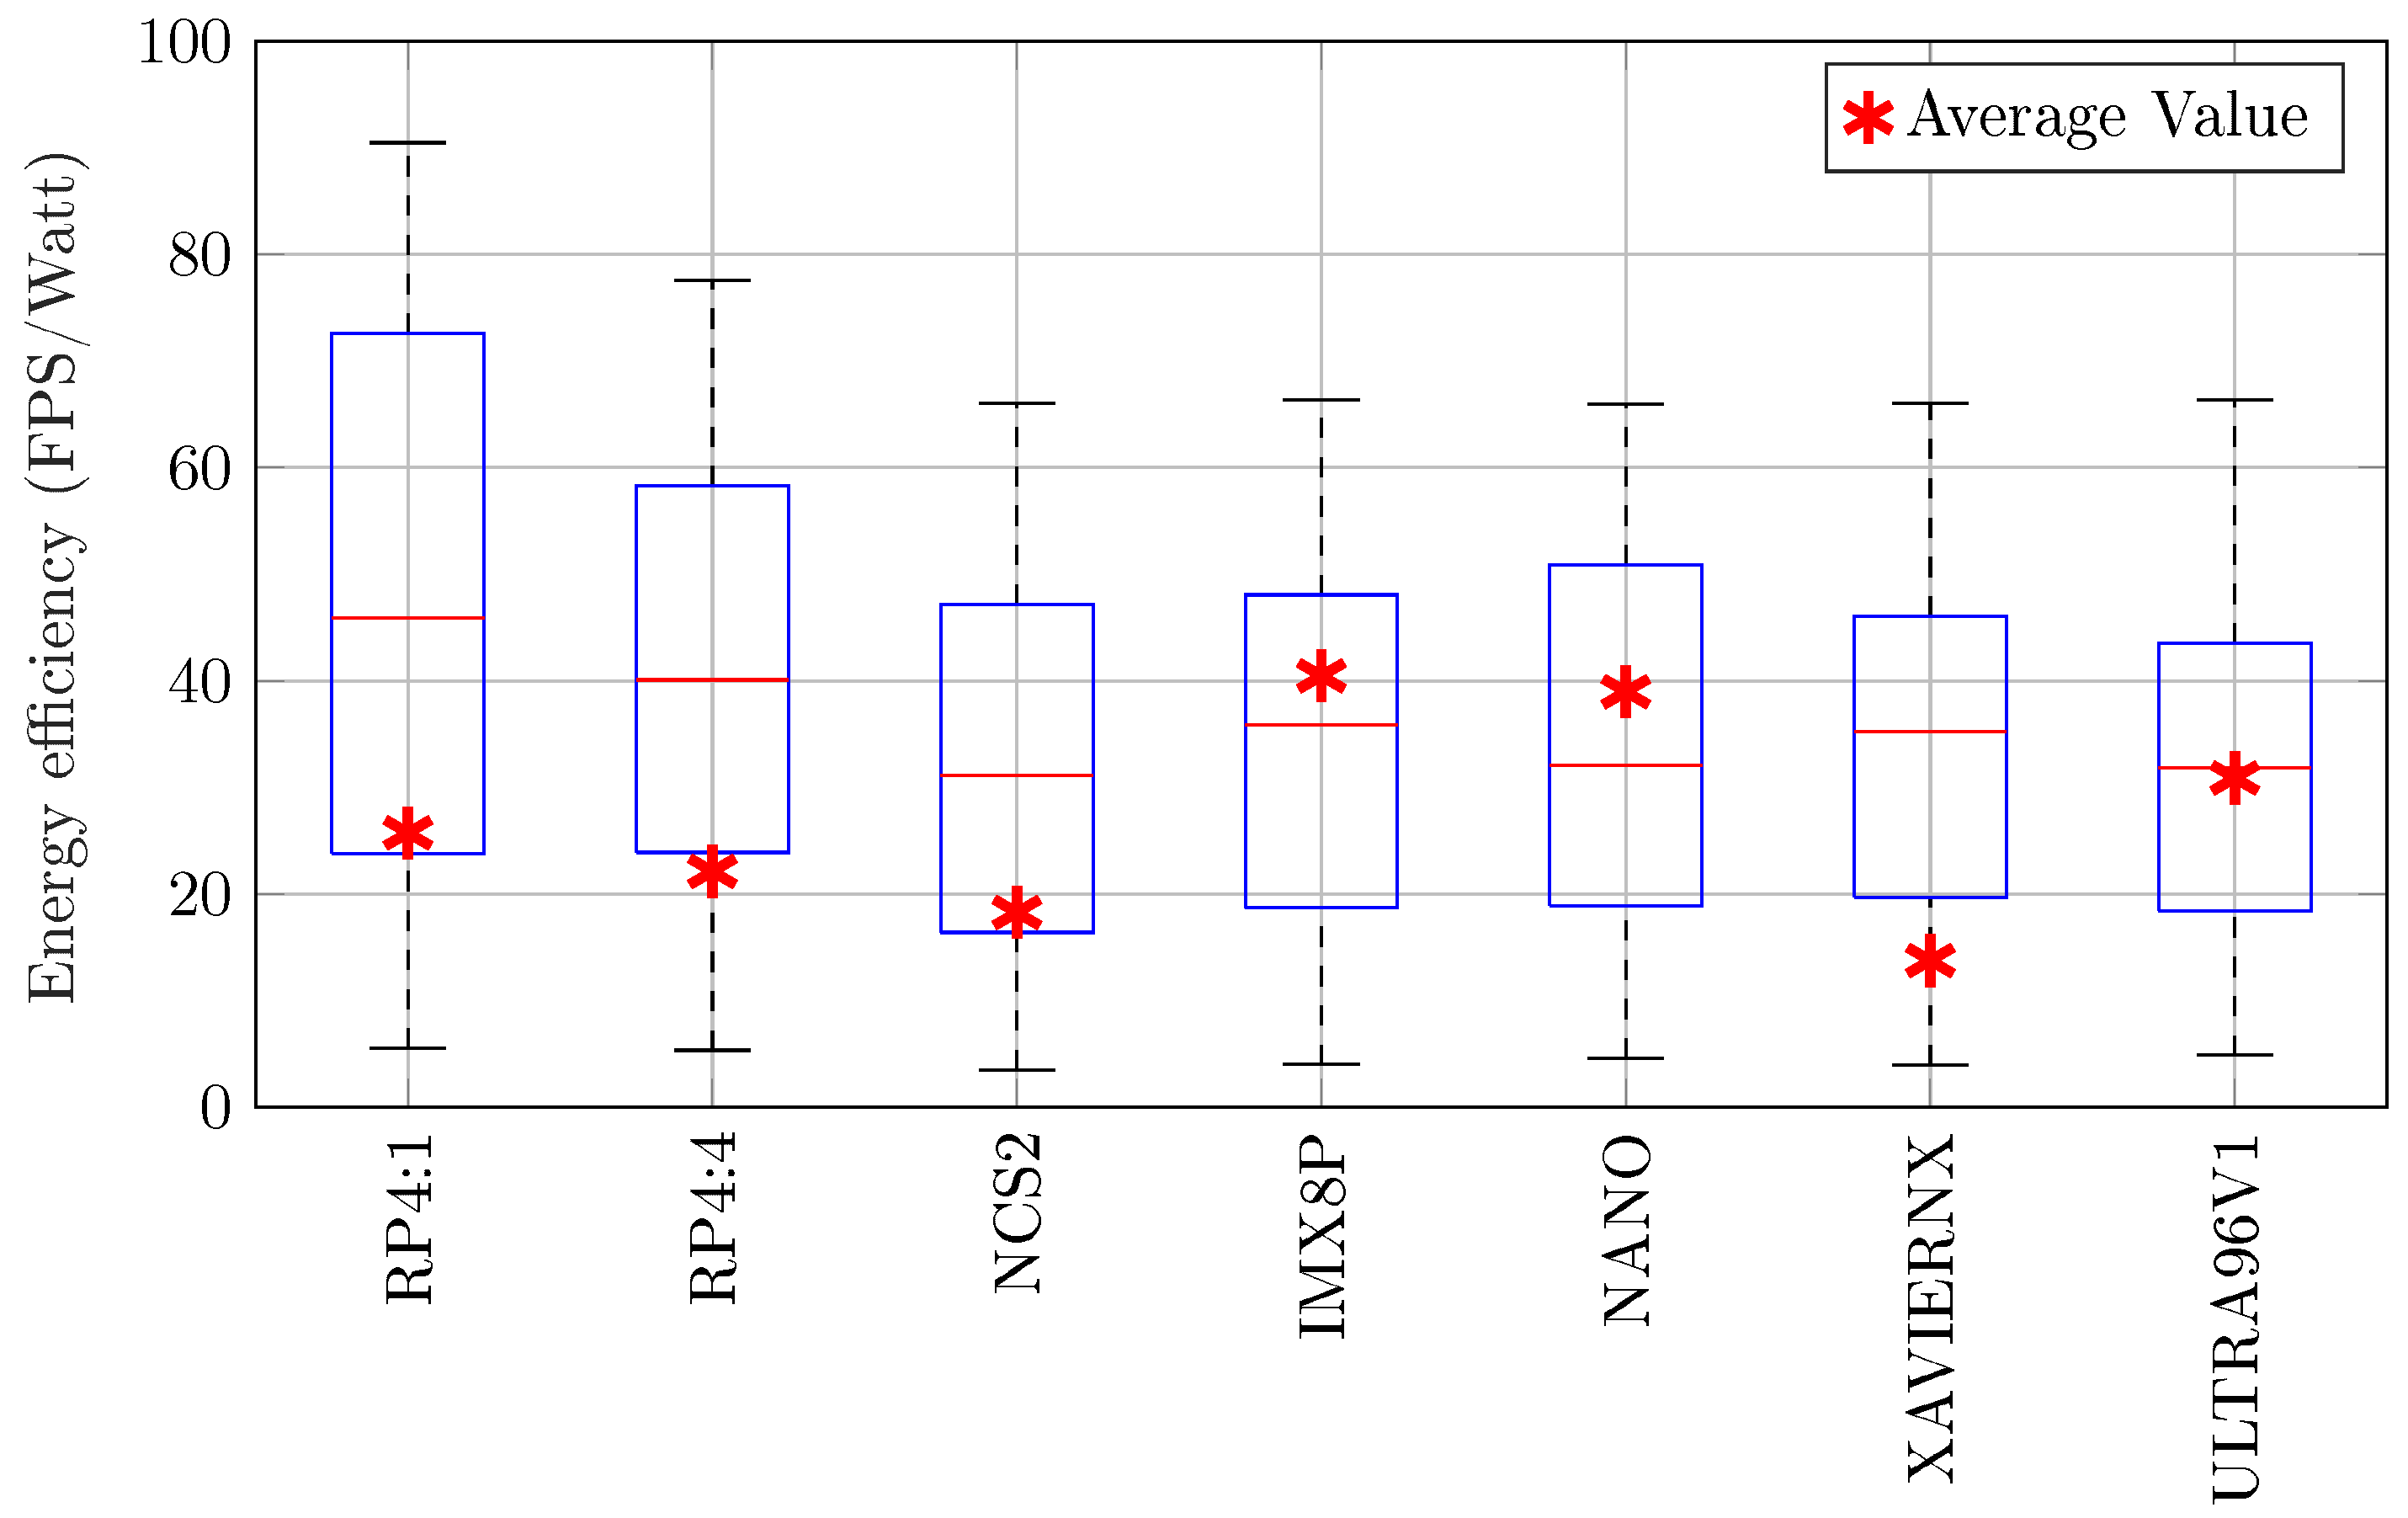
Energy efficiency (FPS/watt) of the boards, including minimum, maximum, median, and average values.
Figure 7.
Energy efficiency (FPS/watt) of the boards, including minimum, maximum, median, and average values.
Figure 8.
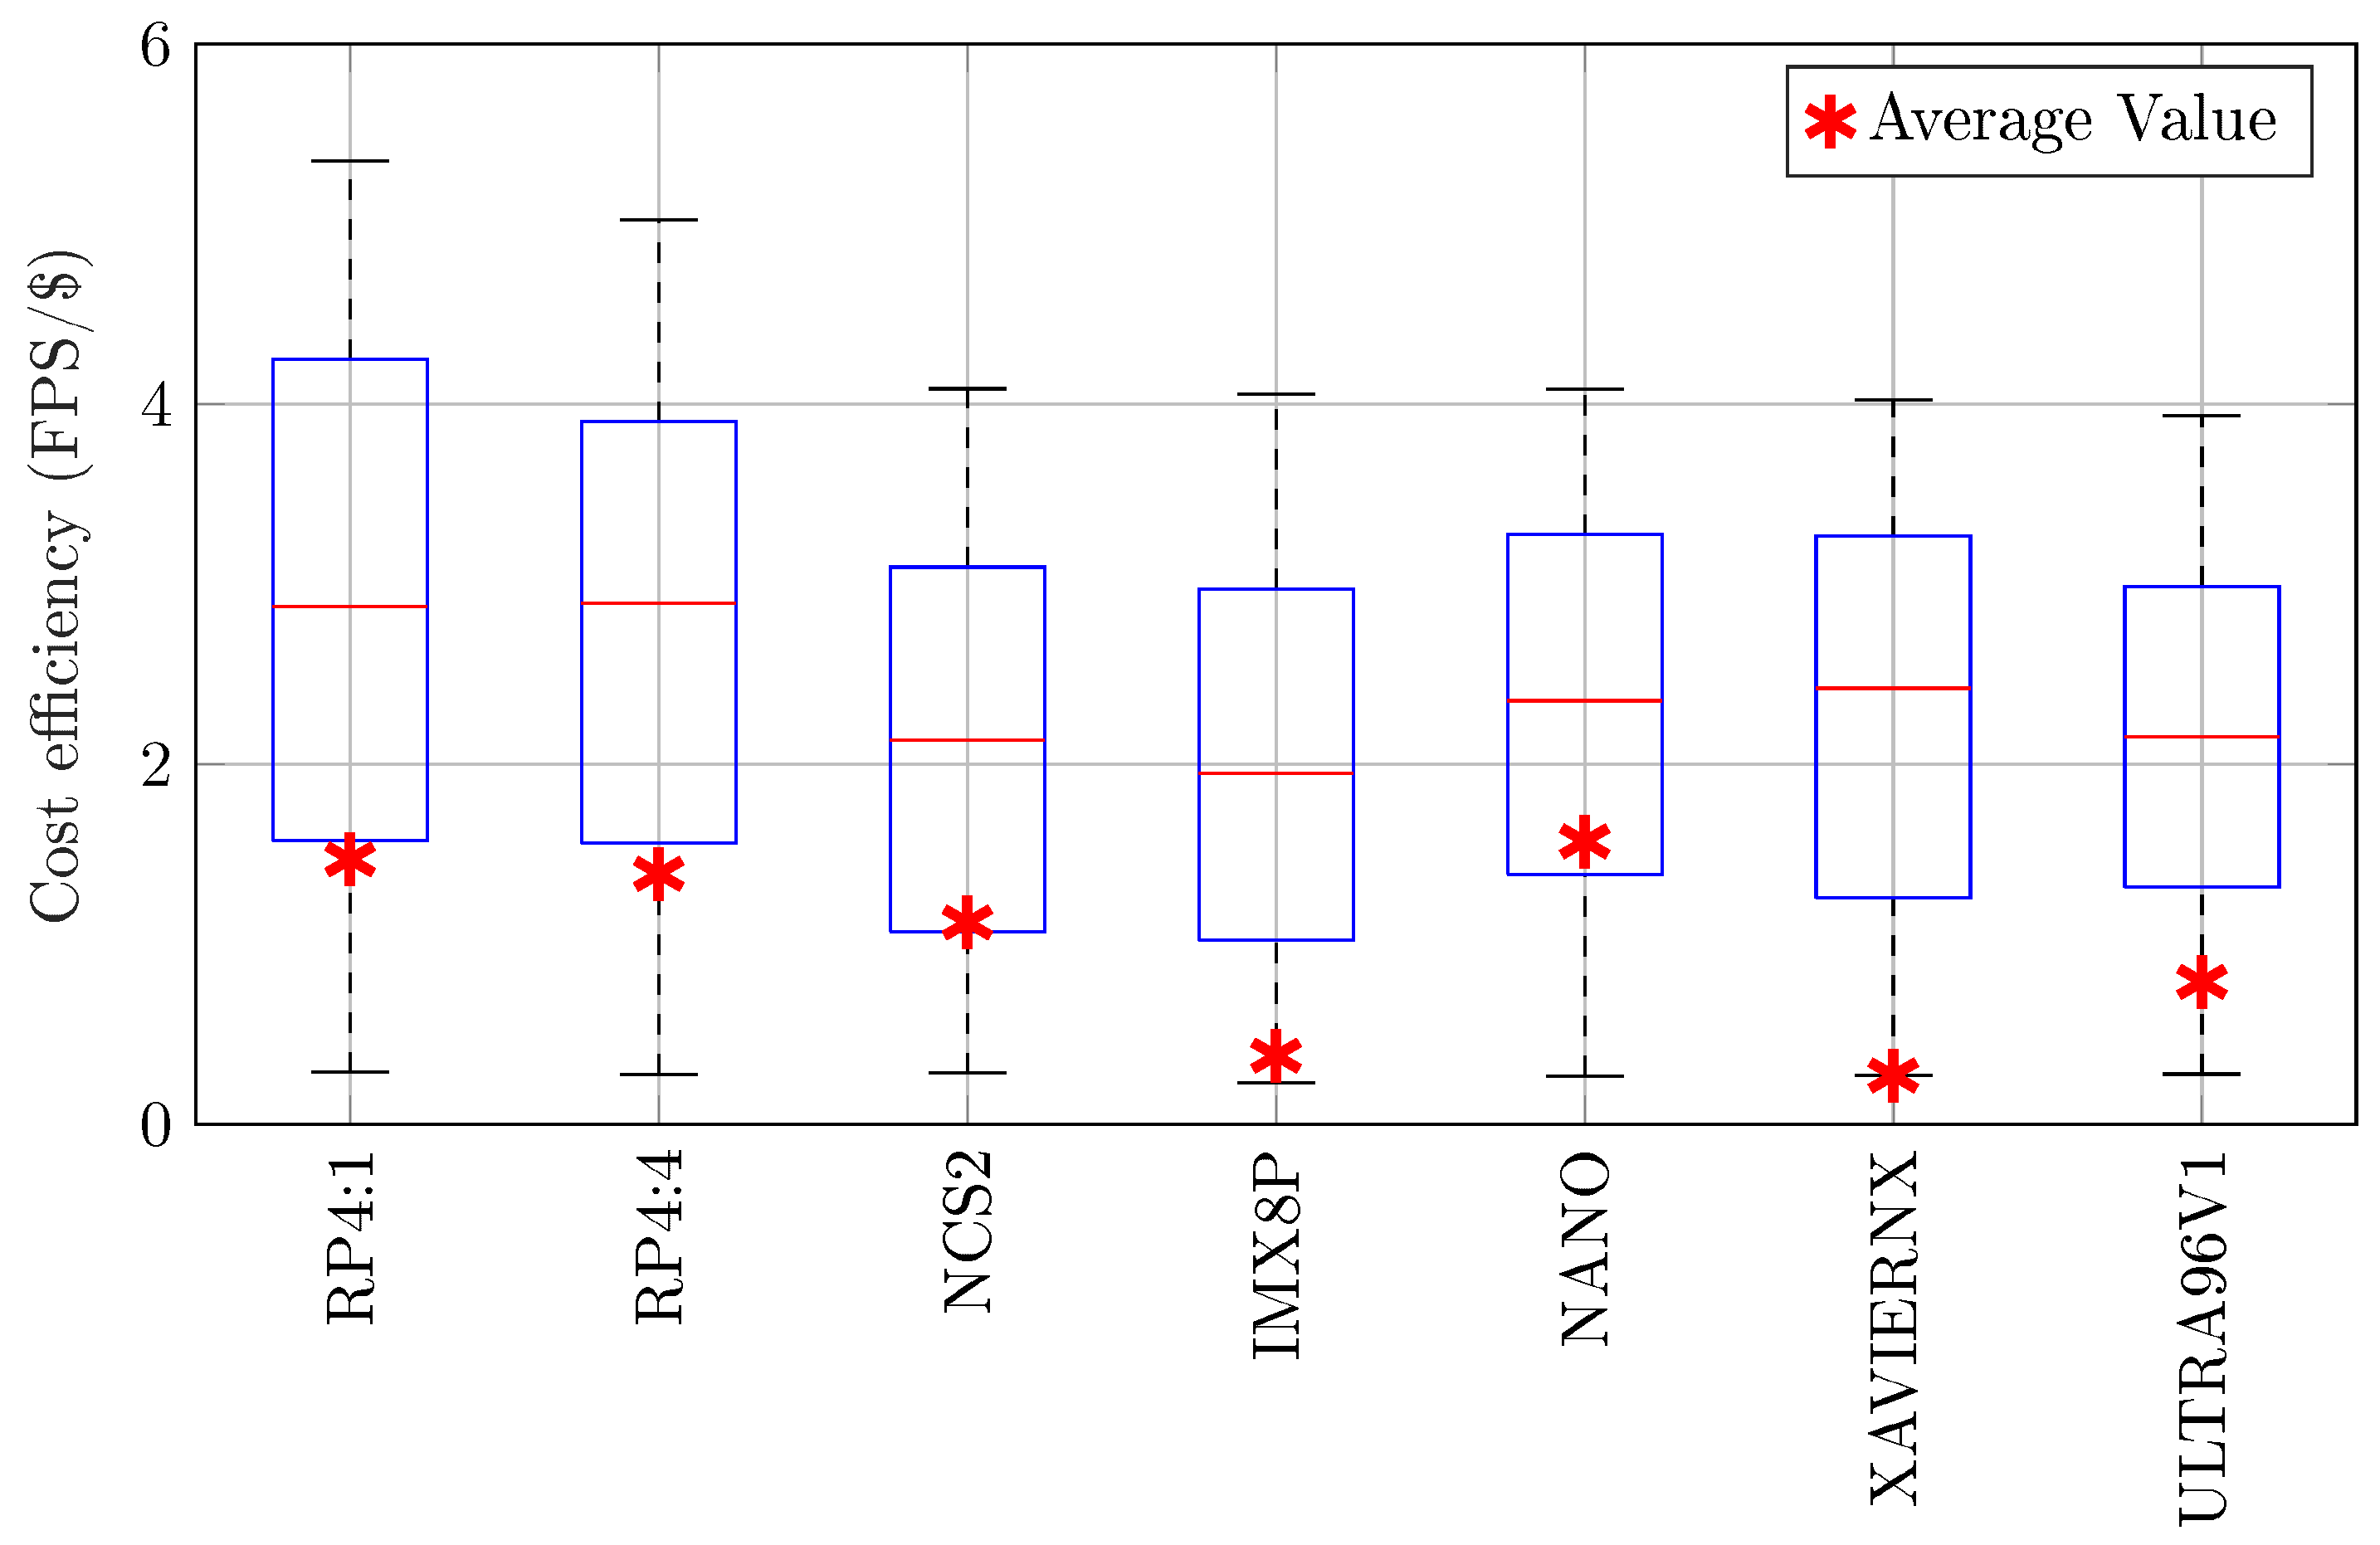
Cost efficiency (FPS/$) of the evaluated boards, including minimum, maximum, median, and average values.
Figure 8.
Cost efficiency (FPS/$) of the evaluated boards, including minimum, maximum, median, and average values.
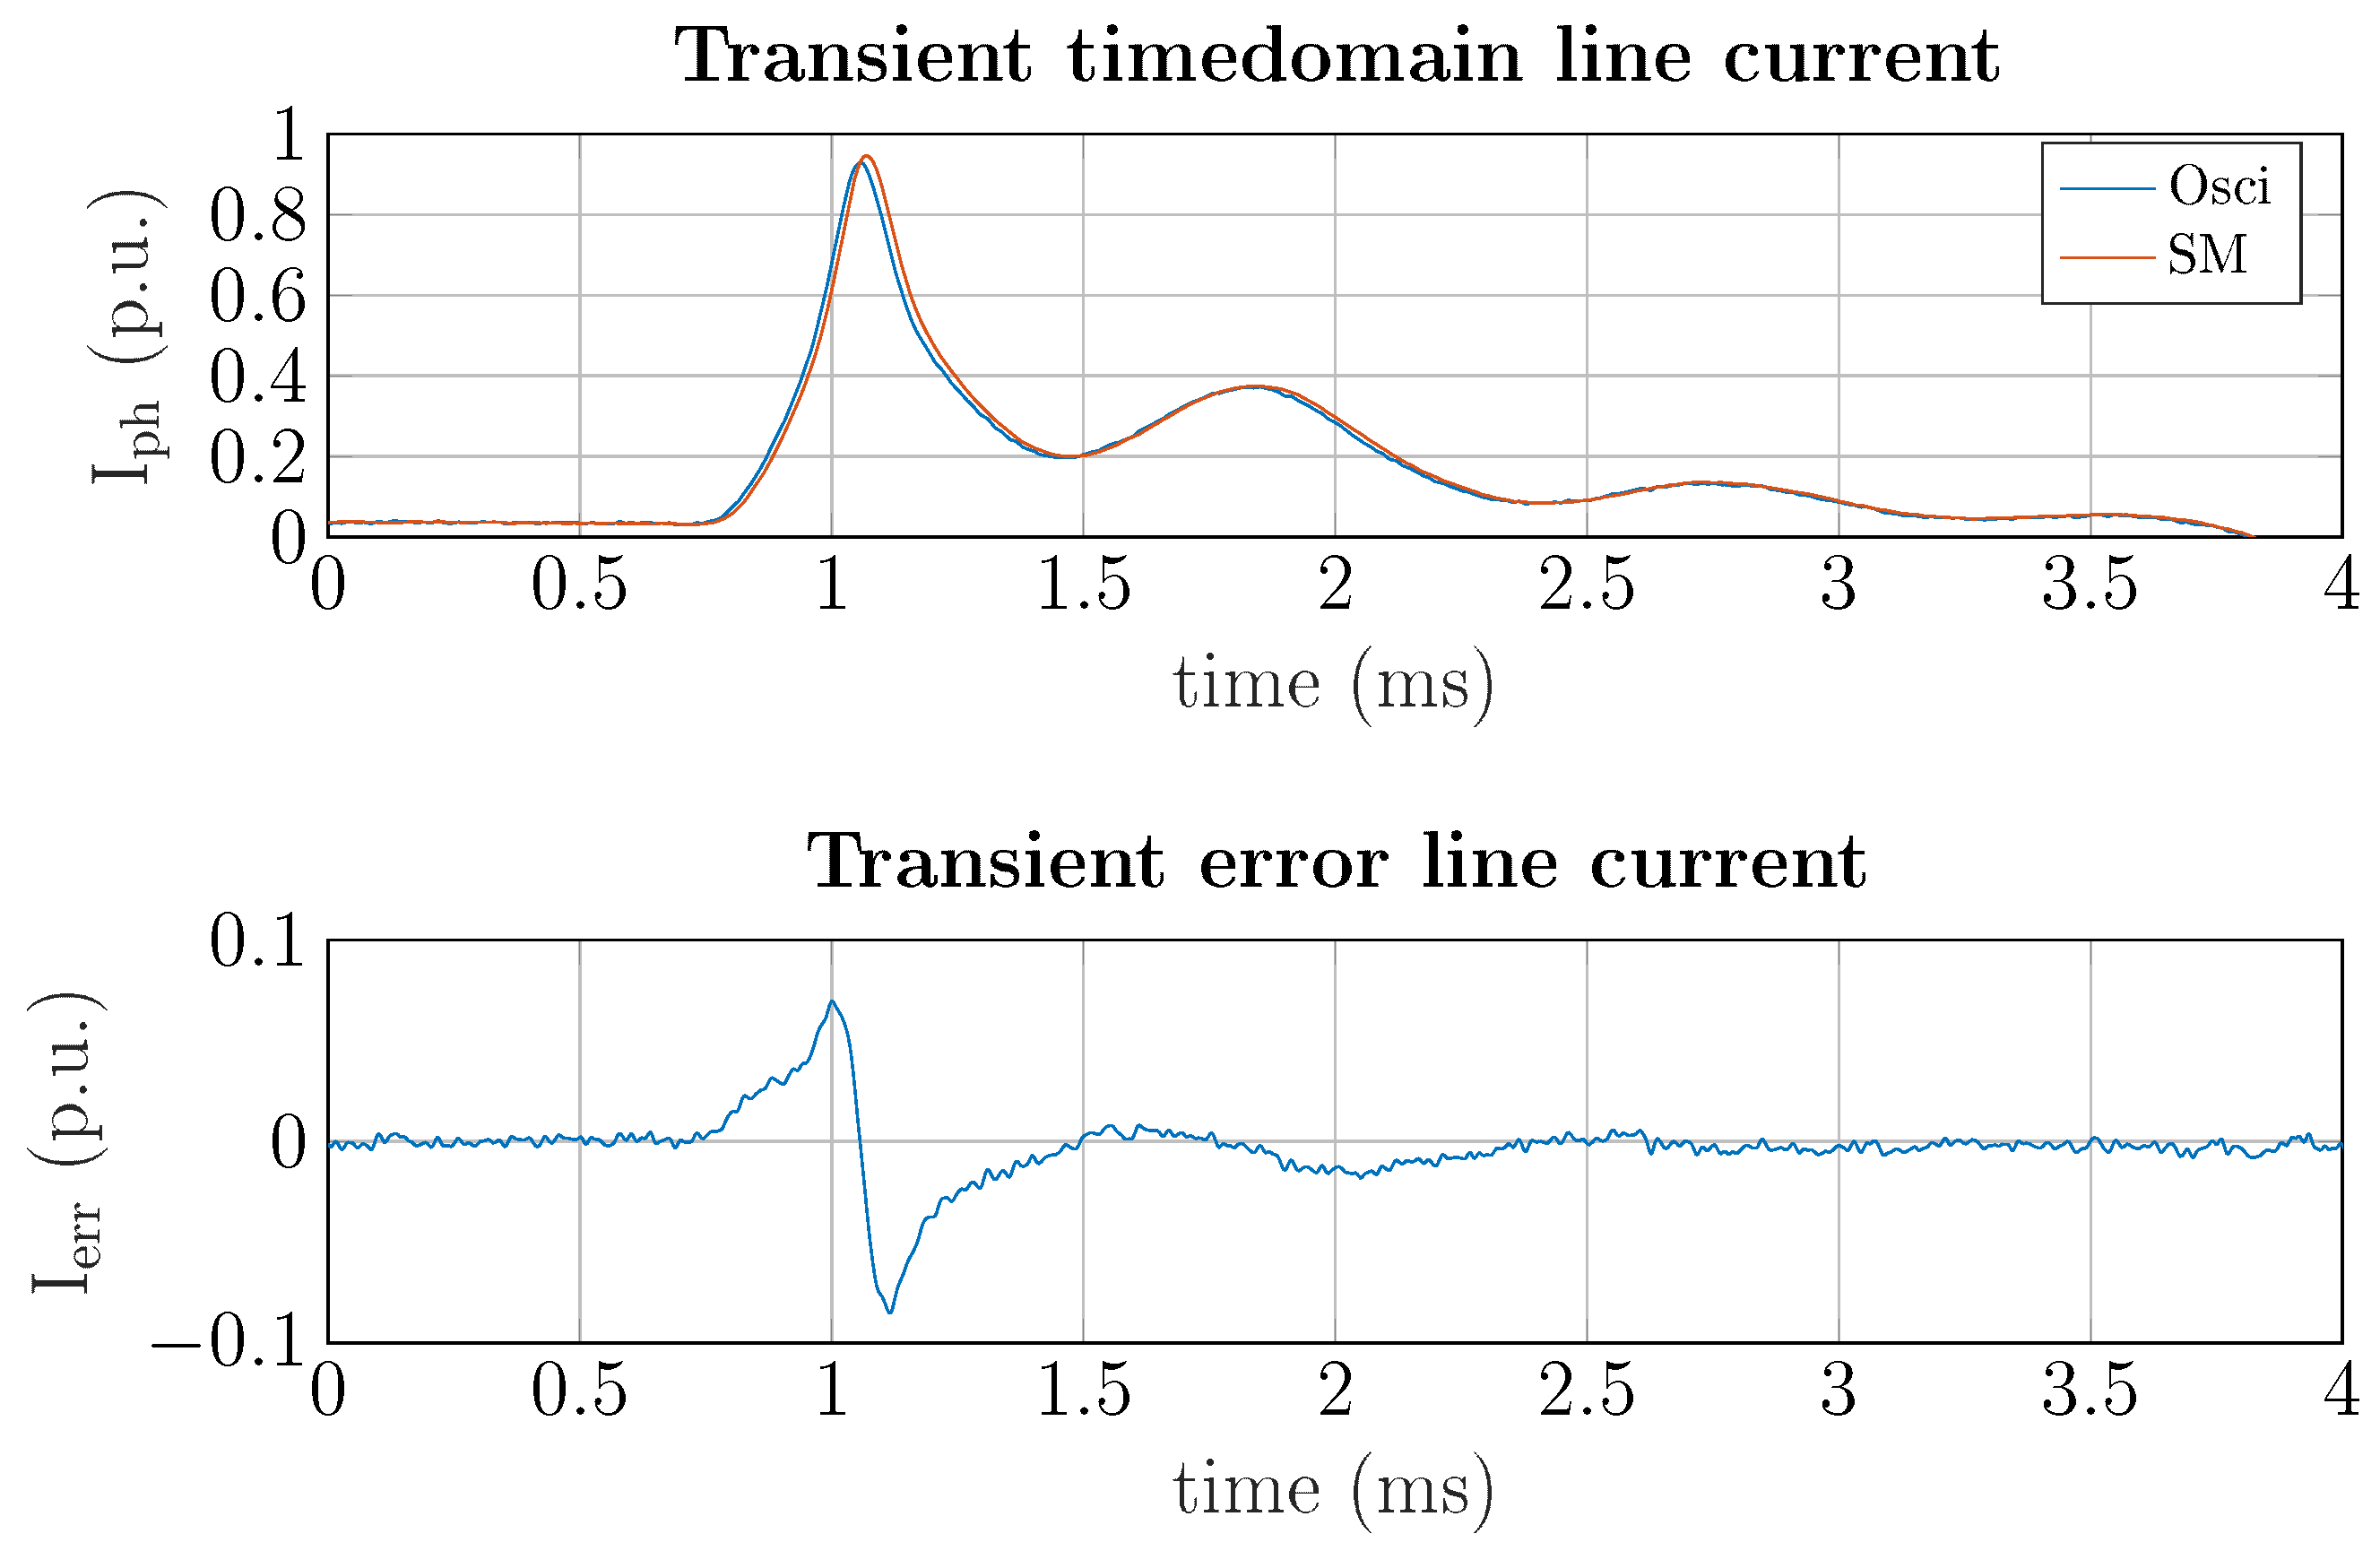
Figure 9.
Transient current waveform of DUT-2 (fluorescent lamp) for an on/off switching event.
Figure 9.
Transient current waveform of DUT-2 (fluorescent lamp) for an on/off switching event.
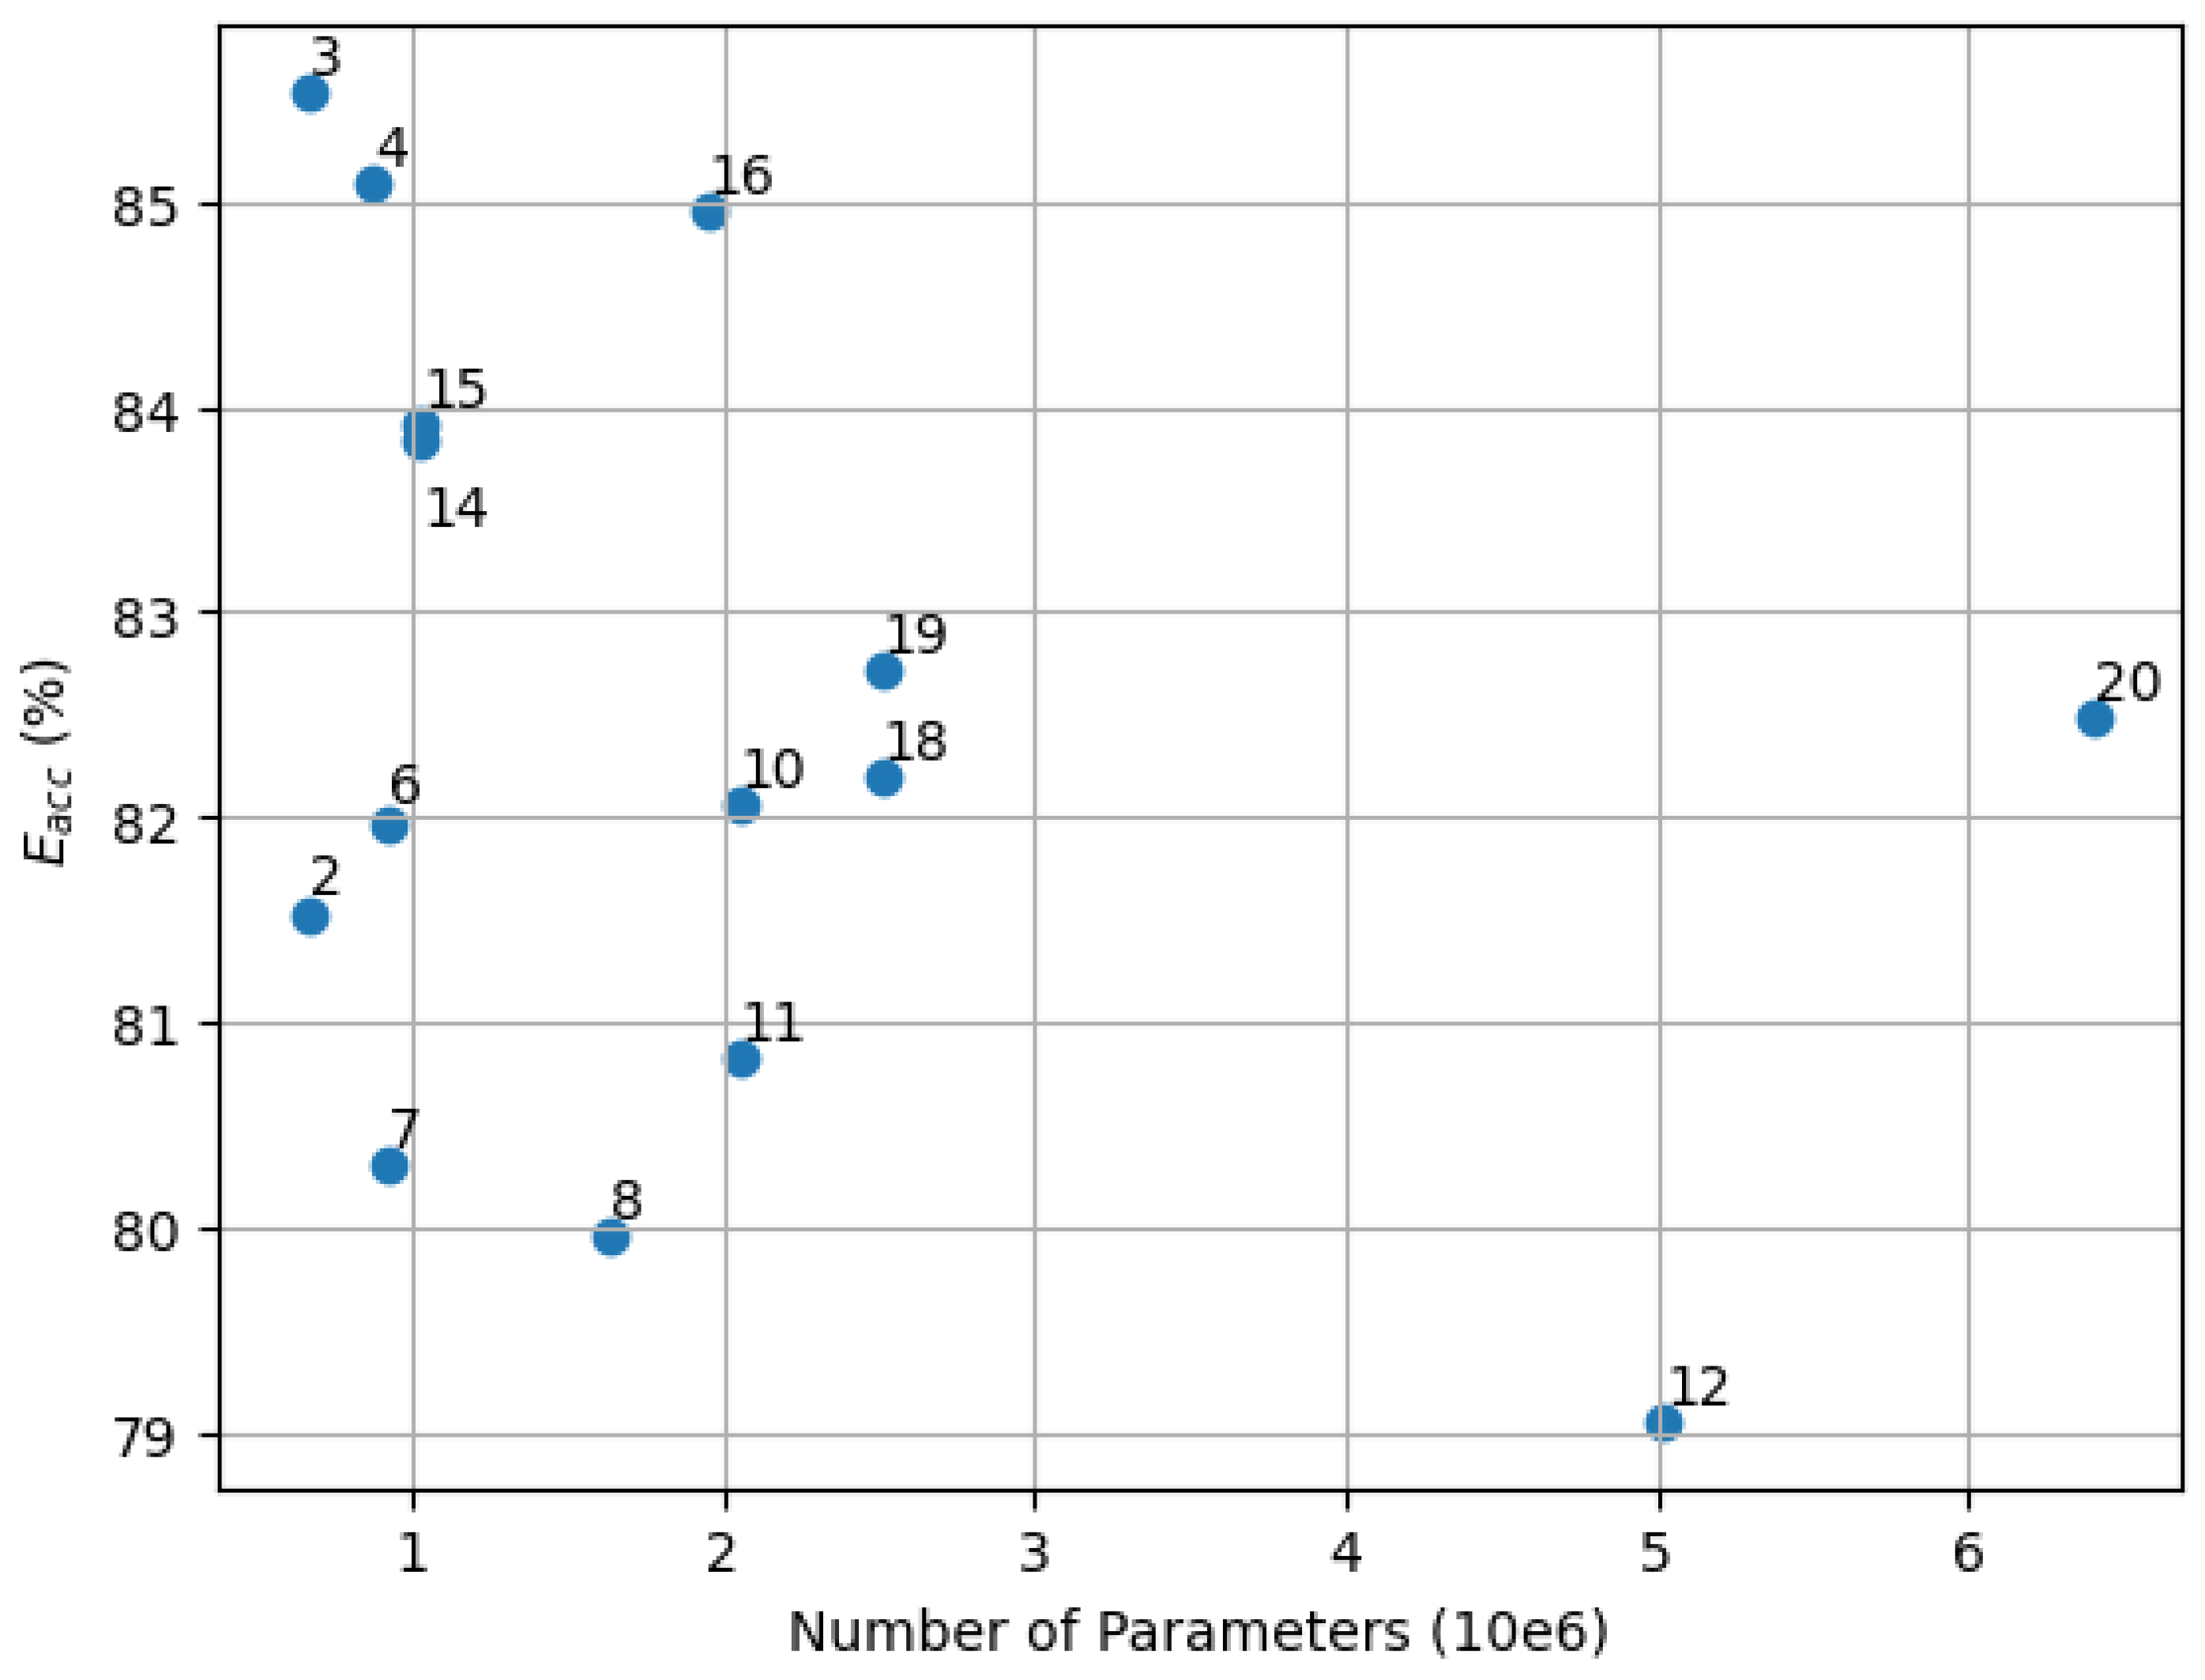
Figure 10.
Relation of the NILM model size to the NILM accuracy for different feature and domain setups. Each dot represents a setup as defined in
Table 6.
Figure 10.
Relation of the NILM model size to the NILM accuracy for different feature and domain setups. Each dot represents a setup as defined in
Table 6.
Table 1.
Normalization methods (Norm) for input features.
Table 1.
Normalization methods (Norm) for input features.
| Norm | Amplitude Range | Equation |
|---|
| A | Without Normalization | |
| B | [0, 1] | |
| C | Z-Score | |
| D | [−128, 127] | |
| E | [0, 255] | |
Table 2.
Time and frequency domain features.
Table 2.
Time and frequency domain features.
| Time ID | Time Name | Freq. ID | Freq. Name |
|---|
| T-1 | Minimum | F-1 | Spectral Amplitude |
| T-2 | Maximum | F-2 | Spectral Centroid |
| T-3 | Variance | F-3 | Spectral Spread |
| T-4 | Standard Deviation | F-4 | Spectral Skewness |
| T-5 | 25% Percentile | F-5 | Spectral Kurtosis |
| T-6 | 50% Percentile | F-6 | Spectral Entropy |
| T-7 | 75% Percentile | F-7 | Spectral Flatness |
| T-8 | Kurtosis | F-8 | Spectral Crest |
| T-9 | Skewness | F-9 | Spectral Slope |
Table 3.
Abbreviations for different experimental protocols, including feature domain, measurement, and normalization.
Table 3.
Abbreviations for different experimental protocols, including feature domain, measurement, and normalization.
| Abv. Feature | Name Feature | Abv. Meas. | Name Meas. | Abv. Norm. | Name Norm. |
|---|
| T | Time | V | Voltage | A | None |
| F | Frequency | I | Current | B | [0, 1] |
| HF | High Frequency | P | Power | C | Z-Score |
| TF | Time + F | VIP | All | D | [−128, 127] |
| TFHF | Time + F + HF | - | - | E | [0, 255] |
Table 4.
Averaged measurement errors (in percentages) of voltage and current waveforms for DUT-1 (resistor kettle) and DUT-2 (nonlinear fluorescence lamp).
Table 4.
Averaged measurement errors (in percentages) of voltage and current waveforms for DUT-1 (resistor kettle) and DUT-2 (nonlinear fluorescence lamp).
| DUT | Current Waveform | Voltage Waveform |
|---|
| MAE | RMSE | MAE | RMSE |
|---|
| 1 | 0.71% | 0.85% | 0.43% | 0.53% |
| 2 | 0.49% | 1.17% | 0.34% | 0.39% |
Table 5.
Overview of the REDD dataset.
Table 5.
Overview of the REDD dataset.
| Houses | Year | Country | Devices | Feature | Sampling |
|---|
| 1 | 2011 | US | 15 | P | 1/3 Hz |
| 2 | 9 | P | 1/3 Hz |
| 3 | 19 | V, I, P | 15 kHz |
| 4 | 17 | P | 1/3 Hz |
| 5 | 22 | P | 1/3 Hz |
| 6 | 14 | V, I, P | 15 kHz |
Table 6.
NILM accuracy () for different feature setups and normalization approaches (A–E).
Table 6.
NILM accuracy () for different feature setups and normalization approaches (A–E).
| Setup | Features | A | B | C | D | E |
|---|
| 1 | T-V | 64.84% | 64.79% | 57.03% | 64.84% | 64.79% |
| 2 | T-I | 82.81% | 64.80% | 81.53% | 79.91% | 82.69% |
| 3 | T-P | 84.23% | 64.79% | 85.54% | 65.22% | 82.61% |
| 4 | T-VIP | 85.65% | 80.59% | 85.09% | 68.07% | 82.60% |
| 5 | F-V | 64.75% | 64.78% | 63.15% | 64.80% | 64.77% |
| 6 | F-I | 82.08% | 77.46% | 81.97% | 78.93% | 81.81% |
| 7 | F-P | 81.85% | 77.51% | 80.30% | 76.47% | 80.41% |
| 8 | F-VIP | 81.84% | 78.24% | 79.96% | 80.93% | 81.87% |
| 9 | HF-V | 64.78% | 64.79% | 61.95% | 64.80% | 64.80% |
| 10 | HF-I | 82.67% | 81.64% | 82.06% | 79.23% | 81.54% |
| 11 | HF-P | 80.22% | 81.11% | 80.82% | 78.72% | 78.37% |
| 12 | HF-VIP | 81.60% | 77.77% | 79.05% | 82.53% | 77.30% |
| 13 | TF-V | 64.79% | 64.84% | 61.21% | 64.80% | 64.80% |
| 14 | TF-I | 80.50% | 81.91% | 83.83% | 83.06% | 84.58% |
| 15 | TF-P | 83.03% | 79.40% | 83.91% | 78.19% | 82.95% |
| 16 | TF-VIP | 85.94% | 81.47% | 84.96% | 72.32% | 82.79% |
| 17 | TFHF-V | 64.80% | 59.06 | 60.60% | 64.84% | 56.12% |
| 18 | TFHF-I | 83.00% | 64.82 | 82.19% | 77.89% | 82.65% |
| 19 | TFHF-P | 83.30% | 81.69 | 82.72% | 80.44% | 82.14% |
| 20 | TFHF-VIP | 83.93% | 83.59 | 82.48% | 65.06% | 83.77% |
Table 7.
Accuracy of optimized NILM models for different hardware acceleration frameworks and data types.
Table 7.
Accuracy of optimized NILM models for different hardware acceleration frameworks and data types.
| | | T-P (#3) | Average |
|---|
|
Framework
|
Data Type
| |
Delta
| |
Delta
|
|---|
| TensorFlow | FP32 | 85.54% | - | 82.43% | - |
| TF-Lite | FP16 | 85.54% | 0.00% | 82.42% | 0.01% |
| DINT8 | 85.76% | −0.22% | 82.63% | −0.20% |
| PTQ INT8 | 77.83% | 7.71% | 70.55% | 11.88% |
| QAT INT8 | 84.12% | 1.42% | 80.43% | 2.00% |
| eIQ | FP16 | 85.54% | 0.00% | 82.42% | 0.01% |
| PTQ INT8 | 38.06% | 47.48% | 55.54% | 26.88% |
| OpenVINO | FP16 | 85.54% | 0.00% | 82.42% | 0.01% |
| TensorRT | FP16 | 85.54% | 0.00% | 82.42% | 0.01% |
| INT8 | 83.85% | 1.69% | 80.59% | 1.84% |
| Vitis-AI | PTQ INT8 | 76.26% | 9.28% | 76.42% | 6.00% |
| QAT INT8 | 80.76% | 4.78 % | 77.85% | 4.57% |
Table 8.
Hardware boards evaluated and their core features. TDP stands for thermal design power (in watts).
Table 8.
Hardware boards evaluated and their core features. TDP stands for thermal design power (in watts).
| HW Board | CPU | Memory | Accelerator | TDP (W) | Cost ($) |
|---|
| RP4 | Cortex-A72 | 8 GB | - | 9 | 75 |
| NCS2 (+RP4) | N/A | 500 MB | VPU | 2.5 (9) | 99 (75) |
| IMX8P | Cortex-A53 | 6 GB | NPU | 15 | 449 |
| NANO | Cortex-A57 | 4 GB | 128 CUDA | 10 | 99 |
| XAVIERNX | Carmel v8.2 | 8 GB | 384 CUDA | 20 | 399 |
| ULTRA96V1 | Cortex-A53 | 2 GB | B2304 DPU | 24 | 249 |
Table 9.
Feature extraction latency (ms) for different hardware platforms in the time- and frequency-domain.
Table 9.
Feature extraction latency (ms) for different hardware platforms in the time- and frequency-domain.
| Hardware | Time | Low-Frequency | High-Frequency |
|---|
| RP4_64bit | 0.074 | 0.831 | 3.092 |
| RP4_32bit | 0.087 | 0.990 | 3.682 |
| IMX8P | 0.182 | 1.530 | 5.740 |
| NANO | 0.127 | 1.456 | 5.406 |
| XAVIERNX | 0.098 | 0.839 | 2.949 |
| ULTRA96V1 | 0.186 | 1.780 | 6.644 |
Table 10.
NILM model execution time (ms) for different hardware boards and features.
Table 10.
NILM model execution time (ms) for different hardware boards and features.
| Setup | Parameters | Features | RP4:1 | RP4:4 | NCS2 | IMX8P | NANO | XAVIERNX | ULTRA96V1 |
|---|
| 2 | 671 k | T-I | 1.19 | 0.74 | 2.51 | 0.50 | 0.98 | 0.62 | 1.05 |
| 3 | 671 k | T-P | 1.19 | 0.75 | 2.47 | 0.49 | 1.00 | 0.63 | 1.05 |
| 4 | 876 k | T-VIP | 2.55 | 1.19 | 2.57 | 0.55 | 0.99 | 0.65 | 1.20 |
| 6 | 927 k | F-I | 3.01 | 2.81 | 2.56 | 0.56 | 1.14 | 0.64 | 1.23 |
| 7 | 927 k | F-P | 3.00 | 2.91 | 2.61 | 0.55 | 1.05 | 0.62 | 1.23 |
| 8 | 1.6 m | F-VIP | 7.80 | 3.07 | 3.29 | 0.80 | 1.31 | 0.67 | 1.80 |
| 10 | 2.0 m | HF-I | 10.58 | 4.39 | 3.60 | 0.89 | 1.50 | 0.63 | 2.15 |
| 11 | 2.0 m | HF-P | 10.54 | 4.09 | 3.47 | 0.92 | 1.51 | 0.63 | 2.15 |
| 12 | 5.0 m | HF-VIP | 35.09 | 13.43 | 7.48 | 2.32 | 2.93 | 0.81 | 4.84 |
| 14 | 1.0 m | TF-I | 3.68 | 1.76 | 2.64 | 0.61 | 0.98 | 0.57 | 1.34 |
| 15 | 1.0 m | TF-P | 3.66 | 1.60 | 2.62 | 0.62 | 0.99 | 0.58 | 1.33 |
| 16 | 1.9 m | TF-VIP | 9.71 | 3.81 | 3.41 | 0.86 | 1.45 | 0.64 | 2.05 |
| 18 | 2.5 m | TFHF-I | 13.97 | 5.54 | 4.03 | 1.02 | 1.69 | 0.68 | 2.48 |
| 19 | 2.5 m | TFHF-P | 13.93 | 5.70 | 4.06 | 1.05 | 1.69 | 0.71 | 2.49 |
| 20 | 6.4 m | TFHF-VIP | 45.37 | 18.92 | 8.76 | 2.82 | 3.63 | 0.91 | 6.14 |
Table 11.
Relative (%) and absolute error for statistical features during a transient event for a non-linear load. ‘Max’, ‘Min’, ‘Avg’, ‘Rms’, ‘Std’, and ‘En’ denote the signal’s maximum, minimum, average, root-mean-square, standard deviation, and energy value.
Table 11.
Relative (%) and absolute error for statistical features during a transient event for a non-linear load. ‘Max’, ‘Min’, ‘Avg’, ‘Rms’, ‘Std’, and ‘En’ denote the signal’s maximum, minimum, average, root-mean-square, standard deviation, and energy value.
| Error | Max | Min | Avg | Rms | Std | En |
|---|
| Relative (%) | 1.91 | 0.56 | 1.87 | 1.76 | 1.71 | 1.38 |
| Absolute | 1.78 | 0.26 | 0.23 | 0.38 | 0.30 | 1.03 |
Table 12.
Proposed NILM-on-Hardware performance for the different evaluated boards using the best-performing feature setup T-P (#3).
Table 12.
Proposed NILM-on-Hardware performance for the different evaluated boards using the best-performing feature setup T-P (#3).
| Board | | | |
|---|
| RP4:1 | 18.7 | 1.07 | 1.39 |
| RP4:4 | 17.1 | 1.07 | 1.44 |
| NCS2 | 12.7 | 0.78 | 1.30 |
| IMX8P | 16.8 | 0.16 | 0.86 |
| NANO | 20.1 | 0.83 | 1.01 |
| XAVIERNX | 10.5 | 0.20 | 1.46 |
| ULTRA96V1 | 12.6 | 0.32 | 0.79 |

