Abstract
This paper is a result of the search for design assumptions for a sensor to detect oil dispersed in the sea waters (oil-in-water emulsions). Our approach is based on analyzing changes in the underwater solar radiance (L) field caused by the presence of oil droplets in the water column. This method would enable the sensor to respond to the presence of oil contaminants dispersed in the surrounding environment, even if they are not located directly at the measurement point. This study draws on both literature sources and the results of current numerical modeling of the spread of solar light in the water column to account for both downward and upward irradiance (Es). The core principle of the analysis involves simulating the paths of a large number of virtual solar photons in a seawater model defined by spatially distributed Inherent Optical Properties (IOPs). The IOPs data were taken from the literature and pertain to the waters of the southern Baltic Sea. The optical properties of the oil used in the model correspond to crude oil extracted from the Baltic shelf. The obtained results were compared with previously published spectral analyses of an analogous polluted sea model, considering vertical downward radiance, vertical upward radiance, and downward and upward irradiance. It was found that the optimal wavelength ratio of 555/412, identified for these quantities, is also applicable to scalar irradiance. The findings indicate that the most effective way to determine this index is by measuring it using a sensor with its window oriented in the direction of upward-traveling light.
1. Introduction
Traditional human activity in maritime areas, i.e., transport techniques (navigation), fishing, military, coastal development (ports, coastal protection, tourist facilities), and offshore development (bridges, dams, tunnels), is increasingly supplemented by various large-scale technical marine structures—industrial constructions. Additionally, developing marine oil and gas resources requires a wide range of technical infrastructure [1]. High-power electricity transmission systems, oil and natural gas pipelines, oil industry exploration, production and technological platforms, electricity generators (conversion of wave energy, sea currents, and wind), and offshore trans-shipment ports are examples of technical structures permanently located at sea. Currently, there are more than 10,000 offshore oil and gas platforms around the world, with many in operation for over 15 years [2]. Between 1970 and 2023, there were 471 major oil spill incidents, each involving a spill of more than 700 tonnes [3]. Moreover, offshore oil extraction contributes to roughly 25% of the world’s total oil production [4]. Therefore, there is an urgent need for a complete optical profile for oil detection and tracking in marine areas [5].
Industrial installations emit pollutants in the form of admixtures of chemical compounds (e.g., hydrocarbons) and energies foreign to the marine environment (static electric and magnetic fields, electromagnetic fields, acoustic noise). Some of these structures are potential emitters of harmful substances that enter the sea in dispersed form. These are mainly hydrocarbons, as residues of crude oil, lubricating oils, and fuels. Such substances pass into suspension due to the action of surface waves and due to the use of special substances (dispersants) that aid dispersion. The tracking and monitoring of oil-in-water emulsions in seawater are crucial for mitigating the negative environmental and economic impacts of oil spills. In the case of removal of effects of oil spills, different methods are used (i.e., anti-spill floating booms combined with skimmers, chemical dispersants, or even in situ burning) [6,7,8,9,10]. However, once oil builds up in marine environments, it becomes challenging to eliminate and may require decades for the coastal ecosystem to fully recover [11,12,13].
In this paper an interdisciplinary approach is proposed, using both modeling and empirically measured values, to create tools for tracking anthropogenic impact (oil pollution in this case) on the marine environment. Designing remote measuring systems that respond to changes in solar radiance caused by anthropogenic pollution, while also capturing these changes at the greatest possible depth, is currently one of the challenges [14,15].
In this study, we focus on digitally modeling an underwater optical sensor designed specifically to measure the presence and concentration of oil pollutants throughout the water column, not just at the surface. Our goal is to support the development of a monitoring system capable of detecting dispersed oil at different depths of the sea.
In areas of the sea exposed to the presence of oil, a key element of the underwater remote monitoring system would be a meter that generates a signal informing about changes in the water caused by the presence of oil substances. It is a valid assumption that the presence of a cloud of oil droplets (oil-in-water) causes a modification of the radiance field. It can be expected that such an optical trace of oil also occurs up to a certain distance outside the cloud of oil droplets. Radiance in the water column is a function of several variables, primarily the spectral and angular distribution of solar light falling on the sea surface, the state of the sea surface, depth, and the Inherent Optical Properties (IOPs) of seawater, which consist of the optical properties of solid and dissolved components in water. Changes in the radiance field in the sea can be caused not only by oil emulsion but also by other factors, such as bubbles, resuspended bottom sediment, and planktonic blooms. The possibility of detecting oil in seawater results from its characteristic spectral optical properties, which differ from the optical properties of seawater. The spectral dependencies of the absorption coefficient, scattering coefficient, and angular scattering function are important here. The extent to which the indices change, representing the ratio of radiance at a specific wavelength to radiance at other wavelengths, was analyzed. It was shown that for the vertical direction of radiance, the index 555/412 is optimal, both for the radiance meter directed upwards [16] and downwards [17].
The negative feature of the radiance meter is that due to the narrow solid angle from which the light is received, it is required to work in good lighting conditions. In connection with this, the possibility of using a vector irradiance meter, which collects light from the entire hemisphere (upper or lower), was investigated [18].
Vector irradiance is defined by the angular distribution of radiance L (. In the case of downward vector irradiance, its definition [19] is given by the expression
where θ and φ are angular coordinates called directional angles, specifically, zenith and azimuth, while in the case of upward vector irradiance, its definition [19] is given by the expression
Vector irradiance takes into account vertical radiation to a greater extent than radiation incident from the side. Scalar irradiance, on the other hand, takes into account radiance from all directions equally, so a scalar irradiance meter receives more light than a vector irradiance meter. Scalar irradiance, similar to vector irradiance, is defined by the angular distribution of radiance. In the case of downward scalar irradiance, its definition [19] is given by the expression
while in the case of upward scalar irradiance, its definition [19] is given by the expression
In this work, it was checked whether in the case of downward and upward scalar irradiance the index 555/412 is also the most favorable index, as in the case of downward and upward radiance as well as in the case of downward and upward vector irradiance. Furthermore, it was identified which of these six cases would be the most favorable in terms of design principles of a possible remote sensing system for underwater oil emulsion clouds.
2. Materials and Methods
The trace of a large number of virtual solar photons—the Monte Carlo method (MC)—was used to model the upward and downward scalar irradiance. Figure 1 presents a block diagram explaining the steps involved in obtaining scalar irradiance below the sea surface. The virtual model of the sea area was based on a few assumptions: the water surface was virtually wavy as a result of a wind speed of 5 m/s (based on Cox and Munk [20]); there was a cloudless sky; and the angle of incidence of rays directly from the sun was 30°. The computational algorithm counted virtual photons in seawater polluted with both oil-in-water emulsion and oil-free seawater. The model studies were based on in situ measurements of scattering and absorption coefficients (after Sagan [21], Table 1) for the southern Baltic Sea and on Petrobaltic-type crude oil extracted from this area (Table 2). The virtual receivers were placed at various depths. In the optical model of an oil-polluted water layer of 30 m, an oil droplet concentration of 10 ppm was assumed. As a result, eight wavelengths spanning almost the entire spectral range were chosen for this study, from 412 nm to 676 nm. Most of the ocean color algorithms are based on the parameterization of Apparent Optical Properties (AOPs) (e.g., the diffuse attenuation coefficients for downward irradiance or remote sensing reflectance) as functions of IOPs and water constituents [22]. IOPs play a significant role in determining the light field in seawater. In recent decades, numerous hydrologic optical instruments (e.g., AC9 or ACS from WET Labs Inc) have been employed in the field to obtain in situ values of IOPs [23,24,25]. Therefore, in this study, wavelengths were selected according to the measurement capabilities of AC9.
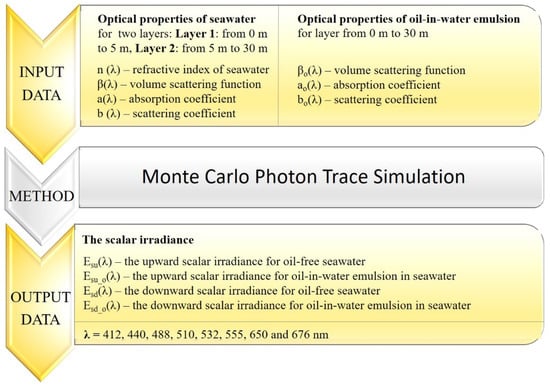
Figure 1.
Block diagram of the model of the upward and downward scalar irradiance below the sea surface.

Table 1.
The values of absorption (a (λ)) (sum of absorption by dissolved substances, suspended particles, and water molecules) and scattering (b (λ)) (sum of scattering by suspended particles and water molecules) coefficients for southern Baltic Sea waters for the eight wavelengths, based on [21].
Table 2.
The values of absorption and scattering coefficients of oil-in-water emulsions (ao (λ) and bo (λ)) with a concentration of 10 ppm for the eight wavelengths [18].
3. Results
Figure 2 presents the results of the staged simulations, specifically the angular distributions of downward and upward radiance for both oil-free and oil-contaminated seawater at a selected wavelength (555 nm) and depths (1 m and 5 m). The radiance distributions were obtained by simulating the trajectories of a large number of virtual photons (one hundred million) within both clean and oil-polluted marine environments. Significant differences are observed between the two cases. Based on these distributions, both scalar and vector irradiance values were calculated.
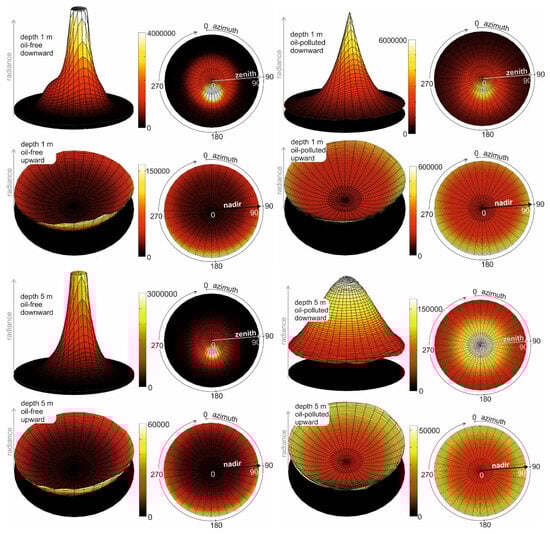
Figure 2.
Directional distribution (as 3D and 2D graphs) of downward and upward radiance (in relative units) for oil-free seawater (on the left) and oil-polluted seawater (on the right) for 555 nm at chosen depths.
Figure 3 shows a cross-section of downward radiance for oil-polluted seawater and for free-of-oil seawater for greater depths like in Figure 2 (1, 2, 3, 4, and 5 m for oil-polluted seawater and 1, 2, 3, 4, 5, 7, and 10 m for oil-free seawater) for the chosen wavelength of 555 nm. In the case of oil-polluted seawater at a depth of 5 m, negligible radiance was recorded, whereas in the case of free-of-oil seawater, the irradiance was recorded even at a depth of 10 m. However, in both cases, these values decrease with depth, and there is a visible flattening. However, there is no evidence that in the real case such changes would be caused only by oil and not by natural components of seawater. Therefore, simulations were performed for different wavelengths.
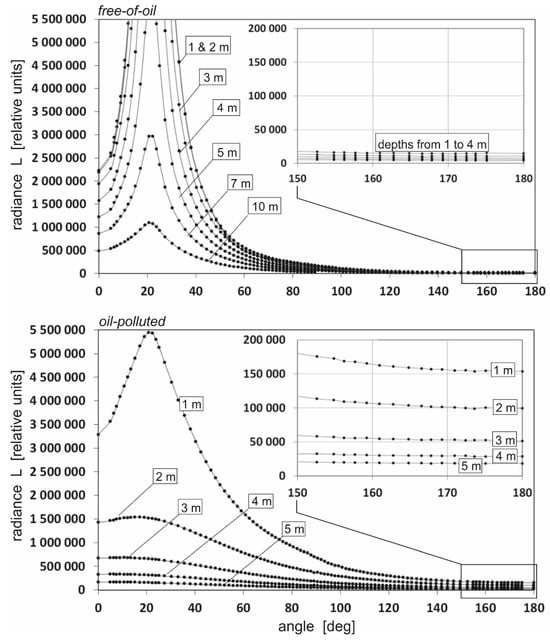
Figure 3.
Example of the directional cross-section of downward radiance for oil-polluted seawater (on the top) and for free-of-oil seawater (at the bottom) for various depths (wavelength 555 nm, azimuth 0°).
Based on the directional radiance distributions (illustrated in Figure 2 and Figure 3), the scalar irradiance values were calculated. The diversity of scalar irradiance at different depths and at different wavelengths is shown in the logarithmic scale in Figure 4 and Figure 5. Figure 4 shows differences between downward and upward scalar irradiance for oil-free seawater, while Figure 5 shows the same but in oil-polluted water. The linearity of the graphs is maintained only up to a depth of 5 m. At greater depths the slope of the graph changes due to the change in the IOPs of the seawater used in the sea model.
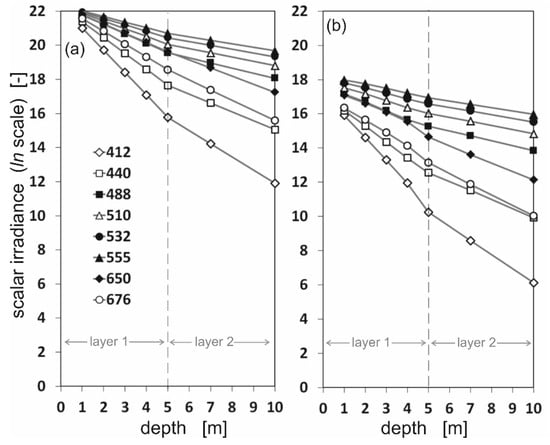
Figure 4.
The values of downward (a) and upward (b) scalar irradiance for eight chosen wavelengths under the sea surface at seven depths: 1 m, 2 m, 3 m, 4 m, 5 m, 7 m, and 10 m, for oil-free seawater.
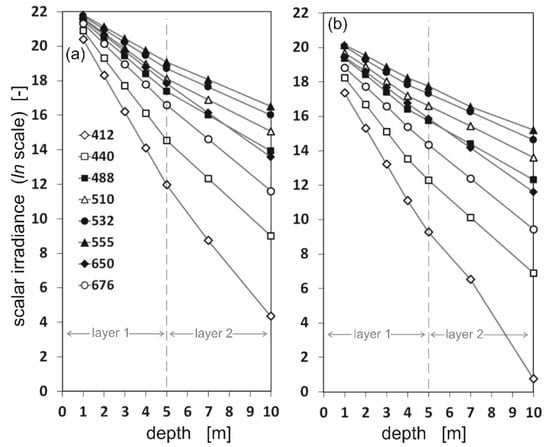
Figure 5.
The values of downward (a) and upward (b) scalar irradiance for eight chosen wavelengths under the sea surface at seven depths: 1 m, 2 m, 3 m, 4 m, 5 m, 7 m, and 10 m, for oil-polluted seawater.
Figure 4 and Figure 5 show that the irradiance values decrease rapidly, especially for wavelengths 412, 440, and 676 nm. The photons arriving from down were in trace quantities at a depth of 10 m, especially for oil-polluted water (Figure 5). This may be due to the fact that for Baltic Sea waters, the minimum absorption occurs in the green, yellow, and orange wavelengths, i.e., in the range from approximately 460 to 600 nm. However, shorter wavelengths are absorbed by Chromophoric Dissolved Organic Matter (CDOM) and longer wavelengths by water molecules [19].
The spectral index values for all 28 combinations of wavelengths for downward and upwelling scalar irradiance were determined. The spectral indexes for seawater polluted with an oil-in-water emulsion and seawater free of oil for irradiance readings for four depths of 1 m, 2 m, 5 m, and 10 m were defined as the ratio of the upwelling scalar irradiance for the longer wavelengths to the upwelling scalar irradiance for the shorter wavelengths and as the ratio of the downward scalar irradiance for the longer wavelengths to the downward scalar irradiance for the shorter wavelengths. The highest value of the index for oil-free water and dispersed oil is recorded for the wavelength combination 555/412 (Figure 6). Moreover, Figure 6 also shows the differences between the values of the spectral index for oil-polluted seawater and oil-free seawater for scalar irradiance readings. The values of the spectral index increase with decreasing depth, and these indicators are ten times higher (for depths of 5 m and 10 m) for oil-polluted than oil-free waters.
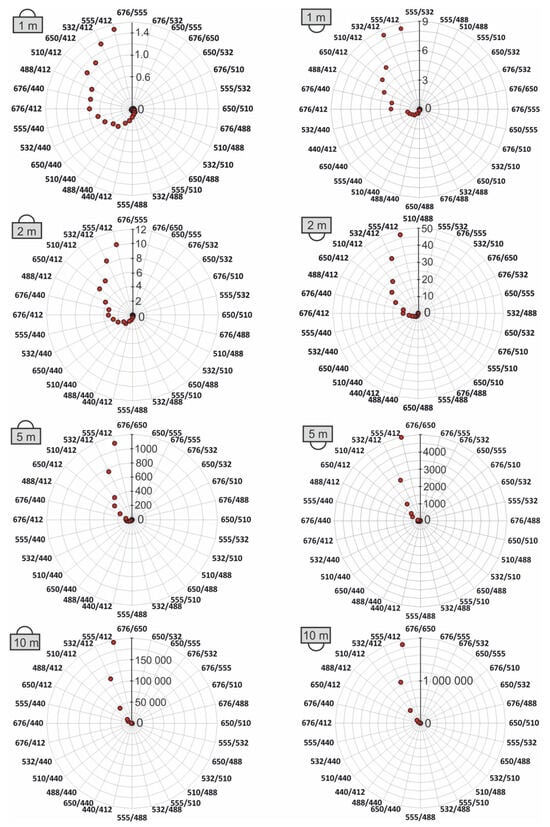
Figure 6.
The differences between the values of the spectral index for oil-polluted seawater and oil-free seawater for downward scalar irradiance readings (irradiance meter directed upward) (left). The differences between the values of the spectral index for oil-polluted seawater and oil-free seawater for upward scalar irradiance readings (irradiance meter directed downward) (right). The scales on the radial axes were selected for each case separately in order to best visualize the obtained results. Values of differences for every wavelength combination in Table 3 and Table 4 are shown.
Figure 6 consists of two columns of polar plots that analyze differences in the spectral index values between oil-polluted and oil-free seawater under chosen depths (1 m, 2 m, 5 m, 10 m). Specifically, it focuses on scalar irradiance: downward scalar irradiance (light coming from the above-left column) and upward scalar irradiance (light coming from the below-right column). The radial axis of Figure 6 represents the magnitude of the difference in spectral index between polluted and oil-free water. Whereas the angular axis represents various spectral index combinations, marked by wavelength ratios λi/λi, where λi = 412 nm, 440 nm, 488 nm, 510 nm, 532 nm, 555 nm, 650 nm, and 676 nm (e.g., 532/440, 488/412, etc.).
Table 3 and Table 4 show that for a depth of 1 m and for downward scalar irradiance, very small differences are observed (1.5 maximum). On the other hand, for upwelling scalar irradiance, slightly more pronounced changes are observed (8.4 maximum). For 2 m downward, scalar irradiance shows moderate differences (maximum 10.1). However, upwelling scalar irradiance is characterized by a significant increase (maximum 47.1). Oil pollution starts to strongly affect upwelling scalar irradiance, especially around the green–blue region (e.g., 555/412). At a depth of 5 m, a large increase in the spectral index for downward scalar irradiance readings is observed (maximum 1103), showing that oil pollution has cumulative effects on how light propagates downward as it travels deeper. For downward scalar irradiance readings for the same depth, a huge spike is observed (maximum 4137). Finally, for a depth of 10 m and for downward scalar irradiance, a very large difference is observed (maximum 194,865). For upward scalar irradiance, the maximal difference amounts to 189,257, matching the downward trend, meaning the spectral signature of oil becomes very strong and distinct at such depth.
Table 3.
The differences between the values of the spectral index for oil-polluted seawater and oil-free seawater for downward scalar irradiance (irradiance meter directed upward) readings for chosen depths (λi = 412 nm, 440 nm, 488 nm, 510 nm, 532 nm, 555 nm, 650 nm, and 676 nm).
Table 4.
The differences between the values of the spectral index for oil-polluted seawater and oil-free seawater for upward scalar irradiance readings (irradiance meter directed downward) for chosen depths (λi = 412 nm, 440 nm, 488 nm, 510 nm, 532 nm, 555 nm, 650 nm, and 676 nm).
It was confirmed that the spectral index of 555/412 is the most favorable combination of two wavelengths for the underwater detection of oil-in-water emulsions. Based on a comparison of the present and previous studies, the present results provide strong evidence that a scalar irradiance should be chosen instead of a radiance or vector irradiance sensor for detection of oil-in-water emulsions (Figure 7). This is also a highly advantageous result from a technical perspective, as a downward-facing sensor is less likely to accumulate various types of contaminants, such as organic and mineral deposits.
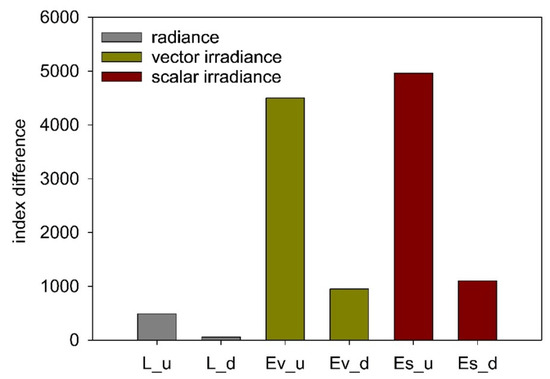
Figure 7.
The differences between the values of the spectral index for oil-polluted seawater and oil-free seawater for upward radiance (L_u) [16], downward radiance (L_d) [17], upward vector irradiance (Ev_u) [18], downward vector irradiance (Ev_d) [18], upward scalar irradiance (Es_u), and downward scalar irradiance (Es_d) readings at a depth of 5 m.
This study evidenced that the sensitivity of the potential oil detector increases during its submersion. At the same time, it is worth noting that the amount of light decreases with depth, which could prevent the detector from working. However, while radiance meters become virtually useless at low light levels, scalar irradiance sensors can still operate effectively, providing more efficient data acquisition in difficult lighting conditions. This is due to the cumulative optical effects that oil has on light as solar photons travel longer in water. The numbers in Table 3 and Table 4 are the result of the simulation of the migration of a large number of virtual photons in the ocean depths. Each photon is subject to the probability of scattering or absorption (‘death’) at each section of its path. These probabilities are a strict consequence of the absorption and the scattering coefficients. In this article, the values of these coefficients that are realistic for the southern region of the Baltic Sea were assumed. Therefore, if we generalize the conclusions from the obtained results, they should be treated as qualitative but certainly reliable in relation to the guidelines for the design of a system for monitoring the purity of waters at risk of contamination with oils dispersed in water. It is possible that our findings could be useful for developing or refining algorithms in ocean color remote sensing, especially in detecting oil spills from satellite or aerial platforms. Moreover, in the future, integration of values obtained on the basis of scalar irradiance sensors proposed in this work and multi-parameter algorithms for remote sensing reflectance, absorption, or backscattering mentioned in [26,27,28,29] can provide enhanced tools for tracking and monitoring oil-in-water emulsions, particularly in optically complex water areas like those in the southern Baltic Sea.
This study builds upon previous research in the field of marine remote sensing by incorporating an additional and often overlooked variable: the total amount of light energy available in all directions at a given point underwater, also known as scalar irradiance. While earlier studies primarily focused on directional light measurements such as radiance or vector irradiance, this work emphasizes the importance of capturing the omnidirectional nature of light as it interacts with the aquatic environment.
Importantly, the findings demonstrate that oil pollution can be detected even when the oil is present in the form of highly diluted emulsions. This highlights a significant advancement in detection capability, as it opens the door to identifying subtle or early-stage pollution events that might otherwise go unnoticed until they manifest more severely.
The omnidirectional sensitivity of the detector is particularly beneficial in deeper waters, where light levels are naturally reduced and directional measurements using radiance meters become less reliable. The ability to detect subtle differences in spectral indices at greater depths extends the range of detection instruments based on the scalar irradiance meter principle, making them more suitable for long-term environmental monitoring in marine environments. For example, while radiance meters become virtually useless at low light levels, scalar irradiance sensors can still operate effectively, providing more consistent data acquisition in difficult lighting conditions.
Another key observation is the depth-dependent behavior of detector sensitivity. The results show a notable increase in the sensitivity of the spectral index to oil presence as the sensor is submerged deeper. This is likely due to the cumulative optical effects that oil has on light as it travels through water. However, this increased sensitivity is limited by a concurrent decrease in the total available light energy at greater depths, which may impose practical limits on the sensor’s effectiveness if ambient light falls below a functional threshold.
The findings suggest that a scalar irradiance meter would serve as the most efficient type of light detector for this purpose. Unlike vector irradiance sensors, which are directionally dependent, a scalar irradiance meter collects light from all upward directions within the water column, making it particularly suited for capturing diffuse light. This is critical in marine environments, where suspended matter and varying light conditions can significantly affect detection accuracy.
The simulations and analysis were conducted with a model of seawater exhibiting relatively high turbidity, characteristic of the Baltic Sea. In such environments, light attenuation is more pronounced due to the presence of suspended particulate matter, CDOM, and other optically active substances. Despite these challenges, the results showed that it should still be possible to detect oil pollution by optimizing the detection parameters, such as wavelength selection and sensor orientation.
It is worth noting that in marine areas with higher water transparency, such as open ocean waters or tropical seas, the detection of oil dispersed in the water column is expected to be more effective. This is because lower turbidity allows light to travel further, enhancing the detector’s ability to distinguish oil from the surrounding water. Therefore, while the system modeled here is optimized for the relatively challenging optical conditions of the Baltic Sea, it holds even greater promise for application in clearer waters.
4. Conclusions
This research focused on identifying optimal structural and functional parameters for an optical sensor capable of detecting environmentally hazardous oil substances, in this case, oil dispersed in seawater (oil-in-water emulsion). Through numerical simulation, this study confirms that employing a measurement system based on the detection of solar light intensity at two specific wavelengths, approximately 555 nm and approximately 412 nm, is optimal. The findings presented in this work suggest that a scalar irradiance meter would serve as the most efficient type of light detector. Unlike a vector irradiance sensor, which is directionally dependent, a scalar irradiance meter collects light evenly from all directions of the lower hemisphere within the water column.
The results of this research contribute valuable insights toward the development of an efficient optical sensor system that could play a crucial role in the early detection and management of oil spills and leaks along navigation routes, as well as near marine infrastructure.
The scientific significance of the obtained results primarily pertains to the southern Baltic Sea. Similar work can be carried out for other ocean regions, as well as for inland surface waters, but only as measurement data regarding the Inherent Optical Properties (IOPs) of these waters accumulates.
Author Contributions
Conceptualization, Z.O. and B.L.; methodology, Z.O.; formal analysis, Z.O. and B.L.; investigation, Z.O. and B.L.; data curation, Z.O.; writing original draft preparation, Z.O. and B.L.; writing review and editing, Z.O. and B.L.; visualization, Z.O. and B.L. All authors have read and agreed to the published version of the manuscript.
Funding
This research received no external funding.
Data Availability Statement
The datasets used and analyzed during the current study are available from the corresponding author upon request.
Acknowledgments
This paper was supported by Gdynia Maritime University grants, No. WM/2025/PZ/04. Thanks to Jacek Piskozub for support in improving the MC code.
Conflicts of Interest
The authors declare no conflicts of interest.
References
- Wu, L.; Yang, Y.; Maheshwari, M. Strain prediction for critical positions of FPSO under different loading of stored oil using GAIFOA-BP neural network. Mar. Struct. 2020, 72, 102762. [Google Scholar] [CrossRef]
- Vidal, P.C.J.; González, M.O.A.; Melo, D.C.; Ferreira, P.O.; Sampaio, P.G.V.; Lima, L.O. Conceptual framework for the decommissioning process of offshore oil and gas platforms. Mar. Struct. 2020, 85, 103262. [Google Scholar] [CrossRef]
- Piscopo, V.; Sciacca, A. Improved outflow model for oil tankers following collision events and investigation of relevant statistical properties by Monte Carlo simulation. Mar. Struct. 2025, 101, 103779. [Google Scholar] [CrossRef]
- Hercos, V.B.; Ferreira, M.L.R. Risk assessment of the erosive process in the production pipeline of an Wet Christmas Tree as an indicator for inspection request. Mar. Struct. 2025, 101, 103765. [Google Scholar] [CrossRef]
- Yang, J.; Wang, J.; Hu, Y.; Ma, Y.; Li, Z.; Zhang, J. Hyperspectral Marine Oil Spill Monitoring Using a Dual-Branch Spatial Spectral Fusion Model. Remote Sens. 2023, 15, 4170. [Google Scholar] [CrossRef]
- Lu, Y.; Shi, J.; Hu, C.; Zhang, M.; Sun, S.; Liu, Y. Optical Interpretation of Oil Emulsions in the Ocean—Part II: Applications to Multi-band Coarse-resolution Imagery. Mar. Sci. Fac. Publ. 2020, 242, 111778. [Google Scholar] [CrossRef]
- Zhong, Z.; You, F. Oil spill response planning with consideration of physicochemical evolution of the oil slick: A multiobjective optimization approach. Comput. Chem. Eng. 2011, 35, 1614–1630. [Google Scholar] [CrossRef]
- Fingas, M. Oil Spill Science and Technology, 2nd ed.; Elsevier: Amsterdam, The Netherlands, 2017. [Google Scholar]
- Fingas, M. The Challenges of Remotely Measuring Oil Slick Thickness. Remote Sens. 2018, 10, 319. [Google Scholar] [CrossRef]
- Fingas, M.; Brown, C.E. Review of Oil Spill Remote Sensing. In Proceedings of the 45th AMOP Technical Seminar on Environmental Contamination and Response, Conference Paper, Edmonton, AB, Canada, 6–8 June 2023; pp. 435–469. [Google Scholar]
- Sun, S.; Chen, Y.; Chen, X.; Ai, B.; Zhao, J. Optical discrimination of emulsified oil in optically complex estuarine waters. Mar. Pollut. Bull. 2022, 184, 114214. [Google Scholar] [CrossRef] [PubMed]
- Conolly, R.M.; Conolly, F.N.; Hayes, M.A. Oil spill from the Era: Mangroves taking eons to recover. Mar. Pollut. Bull. 2020, 153, 110965. [Google Scholar] [CrossRef] [PubMed]
- Guzman, H.M.; Kaiser, S.; Weil, E. Assessing the long-term effects of a catastrophic oil spill on subtidal coral reef communities off the Caribbean coast of Panama (1985–2017). Mar. Biodivers. 2020, 50, 28. [Google Scholar] [CrossRef]
- Hafeez, S.; Wong, M.S.; Abbas, S.; Kwok, C.Y.T.; Nichol, J.; Lee, K.H.; Tang, D.; Pun, L. Detection and Monitoring of Marine Pollution Using Remote Sensing Technologies. In Monitoring of Marine Pollution 2019; IntechOpen: London, UK, 2019; p. 81657. [Google Scholar]
- Zhang, J.; Xiang, Y.; Wang, C.; Chen, Y.; Tjin, S.C.; Wei, L. Recent Advances in Optical Fiber Enabled Radiation Sensors. Sensors 2022, 22, 3. [Google Scholar] [CrossRef]
- Lednicka, B.; Otremba, Z.; Piskozub, J. Modelling the upwelling radiance detected in a seawater column for oil-in-water emulsion tracking. Sci. Rep. 2023, 13, 23098. [Google Scholar] [CrossRef]
- Lednicka, B.; Otremba, Z.; Piskozub, J. Light penetrating the seawater column as the indicator of oil suspension—Monte Carlo modelling for the case of the southern Baltic Sea. Sensors 2023, 23, 1175. [Google Scholar] [CrossRef]
- Lednicka, B.; Otremba, Z.; Piskozub, J. Vector irradiance modelling in a seawater column for assessing the detection capabilities of an oil-in-water emulsion. Opt. Express 2024, 32, 29424–29435. [Google Scholar] [CrossRef]
- Dera, J. Marine Physics, 2nd ed.; PWN 2003; Elsevier: Warszawa, Poland, 1992; p. 541. (In Polish) [Google Scholar]
- Cox, C.; Munk, W.H. Statistics of the sea surface derived from sun glitter. J. Mar. Res. 1954, 13, 198–227. [Google Scholar]
- Sagan, S. The Inherent Water Optical Properties of Baltic Waters; Rozprawy i Monografie 2008; IOPAN Sopot: Sopot, Poland, 2008; p. 244. (In Polish) [Google Scholar]
- Ohi, N.; Makinen, C.P.; Mitchell, R.; Moisan, T.A. Absorption and Attenuation Coefficients Using WET Labs Ac-S in the Mid-Atlantic Bight: Field Measurements and Data Analysis; NASA/TM–2008–214157; Wallops Coastal Ocean Observation Laboratory Project Document Series 3; NASA: Washington, DC, USA, 2008. [Google Scholar]
- Lin, Z.; Lee, Z.; Ondrusek, M.; Liu, X. Hyperspectral absorption and backscattering coefficients of bulk water retrieved from a combination of remote-sensing reflectance and attenuation coefficient. Opt. Express 2018, 26, 157–177. [Google Scholar] [CrossRef]
- Röttgers, R.; McKee, D.; Woźniak, S.B. Evaluation of scatter corrections for ac-9 absorption measurements in coastal waters. Methods Oceanogr. 2013, 7, 21–39. [Google Scholar] [CrossRef]
- McKee, D.; Cunningham, A.; Craig, S. Semi-empirical correction algorithm for AC-9 measurements in a coccolithophore bloom. Appl. Opt. 2003, 42, 4369–4374. [Google Scholar] [CrossRef] [PubMed]
- Ogashawara, I.; Mishra, D.R.; Gitelson, A.A. Remote Sensing of Inland Waters: Background and Current State of the Art. In Bio-Optical Modeling and Remote Sensing of Inland Waters; Elsevier Inc.: Amsterdam, The Netherlands, 2017; p. 24. [Google Scholar]
- Woźniak, S.B.; Meler, J. Modelling Water Colour Characteristics in an Optically Complex Nearshore Environment in the Baltic Sea; Quantitative Interpretation of the Forel-Ule Scale and Algorithms for the Remote Estimation of Seawater Composition. Remote Sens. 2020, 12, 2852. [Google Scholar] [CrossRef]
- Deutsch, E.S.; Cardille, J.A.; Koll-Egyed, T.; Fortin, M.J. Landsat 8 Lake Water Clarity Empirical Algorithms: Large-Scale Calibration and Validation Using Government and Citizen Science Data from across Canada. Remote Sens. 2021, 13, 1257. [Google Scholar] [CrossRef]
- Lednicka, B.; Kubacka, M.; Freda, W.; Haule, K.; Ficek, D.; Sokólski, M. Multi-Parameter Algorithms of Remote Sensing Reflectance, Absorption and Backscattering for Coastal Waters of the Southern Baltic Sea Applied to Pomeranian Lakes. Water 2023, 15, 2843. [Google Scholar] [CrossRef]


Disclaimer/Publisher’s Note: The statements, opinions and data contained in all publications are solely those of the individual author(s) and contributor(s) and not of MDPI and/or the editor(s). MDPI and/or the editor(s) disclaim responsibility for any injury to people or property resulting from any ideas, methods, instructions or products referred to in the content. |
© 2025 by the authors. Licensee MDPI, Basel, Switzerland. This article is an open access article distributed under the terms and conditions of the Creative Commons Attribution (CC BY) license (https://creativecommons.org/licenses/by/4.0/).