Article

Comparison of Techniques for Respiratory Rate Extraction from Electrocardiogram and Photoplethysmogram

by
Alfonso Maria Ponsiglione
1,*,†,
Michela Russo
1,2,*,†,
Maria Giovanna Petrellese
3,
Annalisa Letizia
3,
Vincenza Tufano
3,
Carlo Ricciardi
1,
Annarita Tedesco
4,
Francesco Amato
1,‡ and
Maria Romano
1,‡
1
Department of Electrical Engineering and Information Technology, University of Naples Federico II, Via Claudio 22, 80125 Naples, Italy
2
Neurological Clinic of Hospital San Giovanni di Dio and Ruggi d’Aragona, Via San Leonardo, 80132 Salerno, Italy
3
Teoresi S.p.A. Group, Via Perugia 24, 10152 Torino, Italy
4
Department of Public Healtcare, University of Naples Federico II, Via S. Pansini, 80131 Napoli, Italy
*
Authors to whom correspondence should be addressed.
These authors contributed equally to this work.
These authors supervised equally on this work.
Sensors 2025, 25(16), 5136; https://doi.org/10.3390/s25165136
Submission received: 13 June 2025 / Revised: 4 August 2025 / Accepted: 15 August 2025 / Published: 19 August 2025

Abstract

Background: Respiratory rate (RR) is a key vital sign and one of the most sensitive indicators of physiological conditions, playing a crucial role in the early identification of clinical deterioration. The monitoring of RR using electrocardiography (ECG) and photoplethysmography (PPG) aims to overcome limitations of traditional methods in clinical settings. Methods: The proposed approach extracts RR from ECG and PPG signals using different morphological and temporal features from publicly available datasets (iAMwell and Capnobase). The algorithm was used to develop and test with a selection of relevant ECG (e.g., R-peak, QRS area, and QRS slope) and PPG (amplitude and frequency modulation) characteristics. Results: The results show promising performance, with the ECG-derived signal using the R-peak–based method yielding the lowest error, with a mean absolute error of 0.99 breaths/min in the iAMwell dataset and 3.07 breaths/min in the Capnobase dataset. In comparison, the RR PPG-derived signal showed higher errors of 5.10 breaths/min in the iAMwell dataset and 10.66 breaths/min in the Capnobase dataset, for the FM and AM method, respectively. Bland–Altman analysis revealed a small negative bias, approximately −0.97 breaths/min for the iAMwell dataset (with limits of agreement from −2.62 to 0.95) and −1.16 breaths/min for the Capnobase dataset (limits of agreement from −3.37 to 1.10) in the intra-subject analysis. In the inter-subject analysis, the bias was −0.84 breaths/min (limits of agreement from −1.76 to 0.20) for iAMwell and −1.22 breaths/min (limits of agreement from −7.91 to 5.35) for Capnobase, indicating a slight underestimation. Conversely, the PPG-derived signal tended to overestimate RR, resulting in higher variability and reduced accuracy. These findings highlight the higher reliability of ECG-derived features for RR estimation in the analyzed datasets. Conclusion: This study suggests that the proposed approach could guide the design of cost-effective, non-invasive methods for continuous respiration monitoring, offering a reliable tool for detecting conditions like stress, anxiety, and sleep disorders.

1. Introduction

The respiratory rate (RR) is one of the most informative indicators of physiological state and a vital sign for the early detection of clinical deterioration. Continuous monitoring of respiration plays a crucial role in the diagnosis and management of a wide range of conditions. In healthy subjects at rest, normal RR ranges between 16 and 20 breaths per minute; an increased RR may indicate fever, dehydration, anxiety, mental stress, asthma, pulmonary diseases, or heart conditions [1,2].
Conversely, a decreased RR can be associated with drug use, metabolic abnormalities, sleep apnea events, and other disorders [3]. In addition, the coupling between respiration and heart rate represents a key parameter both for the detection of pathological conditions [4,5,6,7] and for studying cardiorespiratory system interactions [8].
In general hospital settings, respiration can be measured using both direct and indirect methods. Direct measurements involve assessing air flow, pressure, and temperature through the lungs using devices such as spirometers. Indirect measurements rely on thoracic volume changes, detected through transthoracic inductance or impedance plethysmography systems [9].
However, these methods present several limitations—they are often time-consuming, costly, and require bulky equipment. Furthermore, contact-based sensors or masks may interfere with natural breathing patterns. The extraction of RR is also highly susceptible to motion artifacts, making these systems less suitable for applications that require continuous, unobtrusive monitoring, such as in polysomnography or stress assessment.
For these reasons, there is a clinical need for algorithms capable of extracting the RR from waveforms that are already collected in the hospital setting. One such approach involves estimating RR from electrocardiogram (ECG) and photoplethysmography (PPG) signals [10,11,12,13,14]. Indeed, respiratory activity influences both ECG and PPG signals. In the case of the ECG signal, respiration affects heart rate variability as well as beat morphology. On the one hand, respiration modulates heart rate, which increases during inspiration and decreases during expiration, a phenomenon known as respiratory sinus arrhythmia (RSA) [15,16]. On the other hand, ECG morphology is also influenced by respiration due to relative movements of the electrodes with respect to the heart and changes in thoracic impedance caused by lung filling and emptying [17]. As for PPG signals, the reduction in stroke volume during ventricular filling induces amplitude variations in the PPG signal, reflecting respiratory activity [18].
Ultimately, both ECG and PPG signals are influenced by respiratory activity through three types of modulation—amplitude modulation (AM), baseline wander (BW), and frequency modulation (FM) [19]. AM refers to variations in peak amplitude observed in both ECG and PPG signals. BW affects the low-frequency baseline of these signals, introducing slow fluctuations unrelated to physiological activity [20,21,22]. Finally, FM appears as beat-to-beat variations in the duration of cardiac cycles, detectable in both ECG and PPG [19,23]. BW and AM in the ECG are also influenced by changes in the orientation of the heart’s electrical axis relative to the electrodes, as well as variations in thoracic impedance [19]. BW in the PPG signal is caused by changes in tissue blood volume [21], while AM in the PPG is associated with respiration-induced changes in stroke volume [22]. FM in ECG and PPG is due to RSA, which causes the heart rate to increase during inspiration and decrease during exhalation [19]. The intensity of each modulation can vary between subjects, depending on their physiological parameters and other characteristics such as gender, age, health condition, weight, and height [19,24].
Therefore, while ECG measures heart rhythm and electrical activity, and PPG is used for detecting blood volume changes in the microvascular bed via pulse oximetry, both signals are closely correlated with the RR and are routinely acquired in clinical settings. This makes them strong candidates for inexpensive and non-invasive RR monitoring. Over the past decade, Charlton et al. [25] conducted a comprehensive comparison of over 100 algorithms for estimating RR from ECG and PPG signals. Their review covered a wide range of methods that use either ECG or PPG as input signals [26,27,28,29,30]. Most of these algorithms focus on optimizing the filtering stages to enhance the signal-to-noise ratio, thereby improving the reconstruction of the respiratory signal [31,32,33].
In contrast, the present study introduces a methodological pipeline designed to guide researchers in extracting RR from ECG or PPG signals while avoiding unnecessary processing steps. To ensure reproducibility and promote an adaptable workflow, we tested the proposed pipeline on two publicly available datasets: iAMwell [34] and Capnobase [35]. Specifically, we analyzed a wide range of morphological and temporal features derived from ECG signals (R-peak, QRS area, up-slope, down-slope) and PPG signals (frequency modulation and amplitude modulation) to identify and compare the most accurate and robust features for RR estimation, accounting for both intra- and inter-subject variability. The results provide valuable insights that can inform the development of efficient, non-invasive, and low-cost systems for continuous respiratory monitoring.

2. Materials and Methods

2.1. Dataset

We evaluated the proposed method on two publicly available datasets, the iAMwell open-source dataset [34] and Capnobase [35], to verify the generalization performance of the algorithm across different scenarios.
The iAMwell dataset contains simultaneously recorded ECG, PPG, and respiratory signals from athletes and non-athletes during an experimental protocol, including rest, exercise, and recovery phases. All signals were sampled at 2000 Hz. In this study, we focused on the acceleration phase, lasting approximately 8 min, characterized by a gradual increase in running speed and corresponding physiological changes.
The Capnobase dataset includes simultaneously recorded ECG, PPG, and respiratory signals from 42 subjects undergoing elective surgery and routine anesthesia. The recordings, lasting about 8 min, were sampled at 300 Hz. We considered only 19 spontaneous breathing cases for our analysis.

2.2. Signal Processing and Analysis

Before detailing the algorithms for ECG and PPG analysis, it is important to highlight that all records, including ECG, PPG, and respiratory signals, were divided into segments. To determine the optimal segment length for accurate RR prediction, we tested windows of 20, 30, and 60 s to allow a fair comparison. The 30-s window consistently provided the best accuracy in RR estimation, in agreement with previous literature, which demonstrated that longer windows tend to result in higher mean errors [36,37].

2.2.1. ECG Pre-Processing and Analysis

The following flowchart (Figure 1) illustrates the ECG analysis step-by-step.
As is commonly done to improve the signal-to-noise ratio (SNR) and ensure accurate detection of the QRS complex while enhancing the quality of the extracted respiratory signal, denoising of the raw ECG signal was applied. Each step of the algorithm, shown in the workflow of Figure 1, follows traditional signal processing methodologies widely discussed in the literature [38,39,40]. The selection of parameters for each processing step was made empirically, based on the characteristics of the ECG signal and the specific requirements of the analysis.
In the preprocessing stage, a cascade of low-pass and high-pass filters was used to remove the P and T waves, as well as electromyography artifacts. The cut-off frequencies for the band-pass filter were set to 5 Hz (low-pass) and 40 Hz (high-pass). The next step, QRS complex detection, can be challenging due to physiological variability and various types of noise present in the ECG signal. The Pan–Tompkins algorithm [41], known for its robustness in detecting QRS complexes, was employed. The Q and S waves were identified by searching for local minima before and after the R-peak, as illustrated in Figure 2.
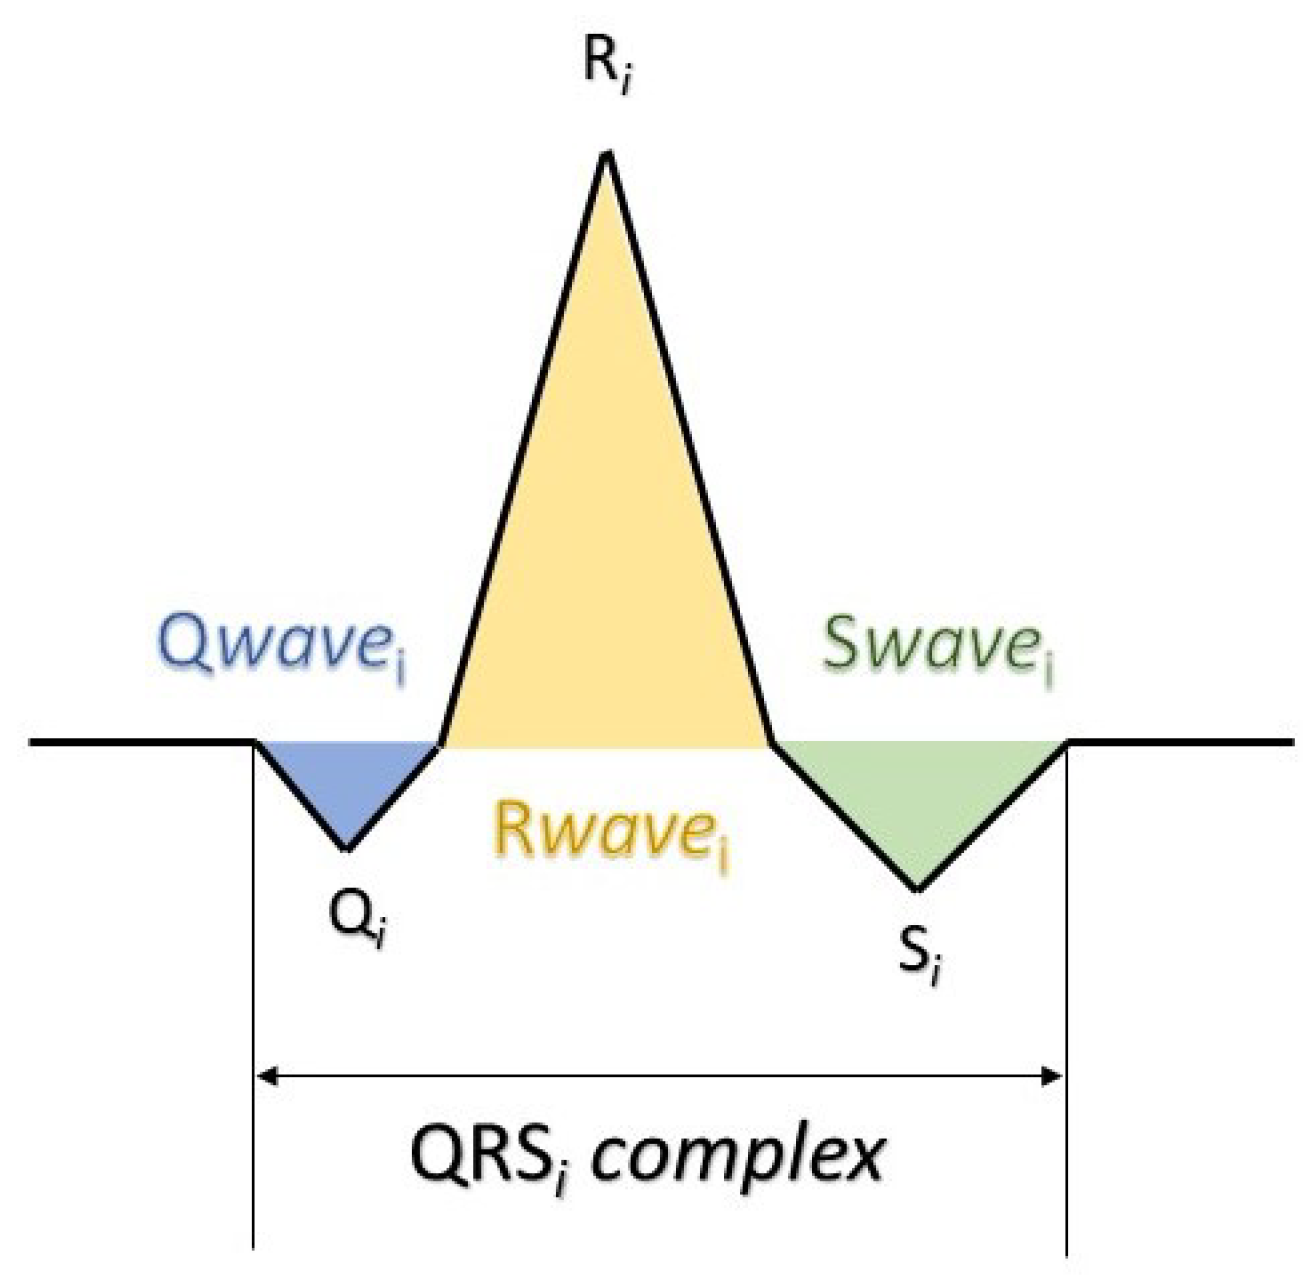
For QRS features extraction, four morphological features were extracted: R-peak (amplitude), QRS slopes (up-slope and down-slope), and QRS area, as described in [42]. Let us denote by Q R S i the i-th QRS complex of the total ECG signal (Figure 2); the computation of the morphological features is outlined as follows (Figure 3):
R i = m a x ( x j ) j Q R S i
U p S l o p e i = m a x ( a b s ( x j x j 1 ) ) j Q i , R i
D o w n S l o p e i = m a x ( a b s ( x j + 1 x j ) ) j R i , S i
The area is calculated by approximating the integral with trapezoids. The following equation describes the total area used in this study:
A r e a ( Q R S i ) = a b s ( a r e a ( Q w a v e i ) ) + a b s ( a r e a ( R w a v e i ) ) + a b s ( a r e a ( S w a v e i ) )
Finally, based on these features, the ECG-derived respiration (EDR) signals were extracted. To reconstruct a continuous respiration waveform, cubic spline interpolation was applied to the detected peaks of these features. Since different QRS parameters are influenced by respiration in varying ways, a separate EDR signal was generated for each extracted QRS feature, enabling a more comprehensive representation of the respiratory pattern.

2.2.2. PPG Pre-Processing and Analysis

Figure 4 illustrates the step-by-step processing of the PPG signal. Similar to the ECG processing, the methodologies for PPG signal processing were based on established techniques from the literature, and the parameters were set empirically.
The raw PPG signal was first filtered using an 8th-order Butterworth low-pass filter with a cut-off frequency of 10 Hz to remove high-frequency noise. Next, an 11-level wavelet decomposition was applied to further smooth the signal, as recommended in the literature for PPG preprocessing [43,44,45,46]. To enhance the extraction of respiratory-related variations, a Savitzky–Golay polynomial filter was employed [47] for more precise detection of RR from the reference signals.
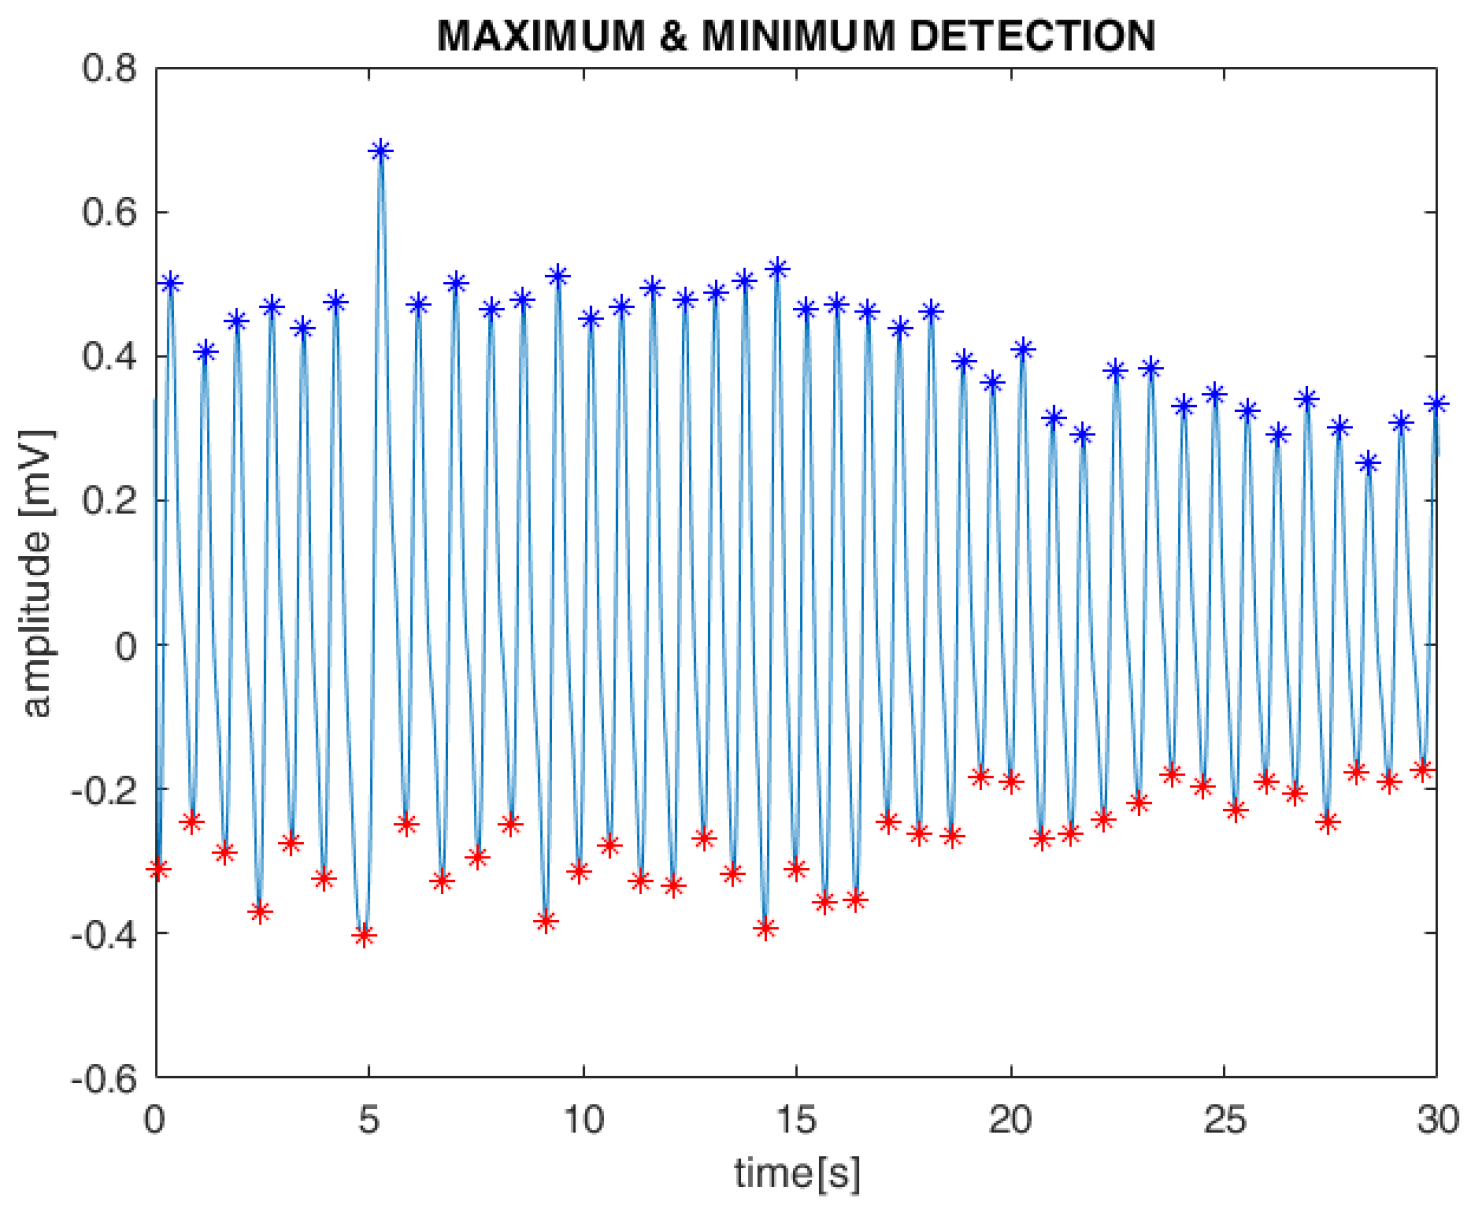
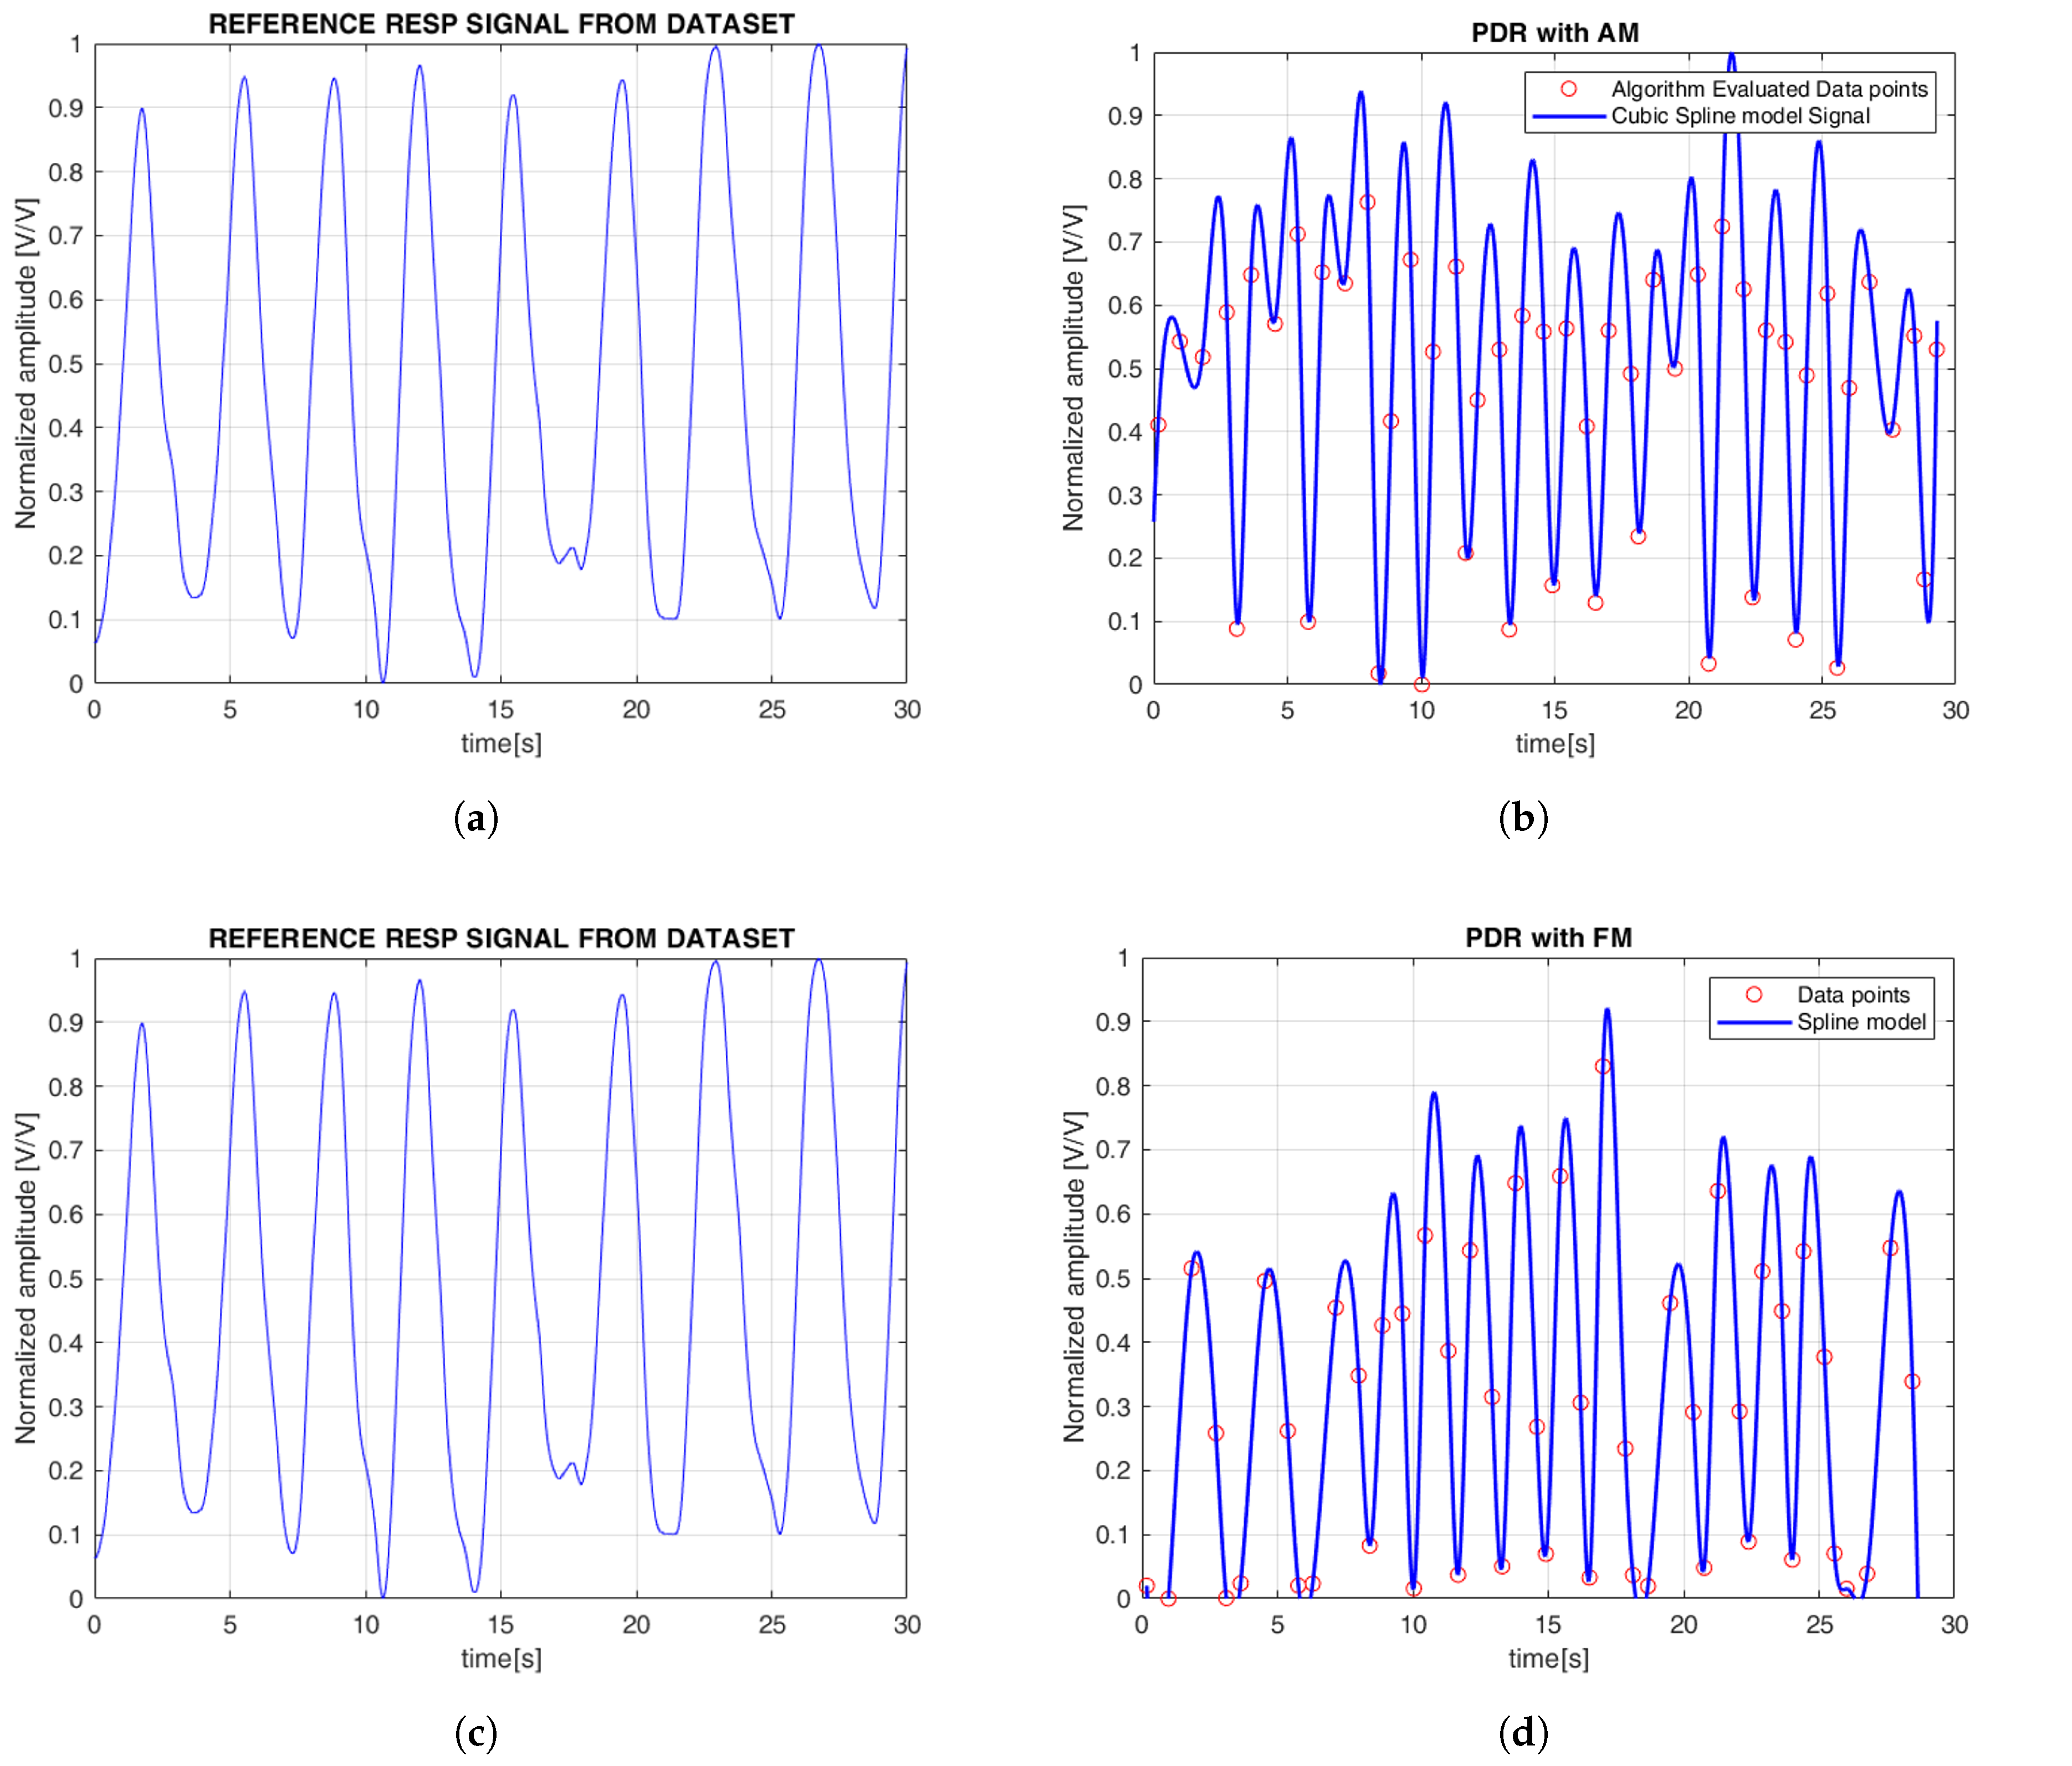
Subsequently, the systolic maximum and minimum values of the PPG waveform, along with the intervals between them, were detected using standard MATLAB toolboxes. These features were extracted from both the AM and FM components of the filtered PPG signals (Figure 5). Finally, as with the ECG, cubic spline interpolation was used to reconstruct the PPG-derived respiration (PDR) signal.

2.3. Respiratory Rate Extraction

In each case, RR was estimated by counting the number of respiratory peaks within a fixed 30-s time window. RR was computed for each reference respiratory signal and derived from the individual ECG and PPG characteristics, using the following formula:
RR = N peaks T · 60
where N peaks is the number of detected respiratory peaks in a window of duration T = 30 s. RR is expressed in breaths per minute (breaths/min).

2.4. Quantitative Analysis

A quantitative analysis was carried out using the following three performance metrics:
  • Mean Absolute Error (MAE)
    MAE = 1 N i = 1 N f i f i ^
  • Mean Absolute Percentage Error (MAPE)
    MAPE = 100 N i = 1 N f i f i ^ f i
  • Root Mean Square Error (RMSE)
    RMSE = 1 N i = 1 N f i f i ^ 2
where f i and f i ^ represent the reference and estimated RRs, respectively, and N is the number of observations.
Additionally, the Pearson correlation coefficient ( ρ ) was computed to assess the linear relationship between derived and reference RR. Interpretation of ρ typically follows these conventional thresholds: values below 0.3 indicate a weak correlation, values between 0.3 and 0.7 suggest a moderate correlation, and values above 0.7 are considered indicative of a strong correlation. This statistical measure complements the error-based metrics by capturing the degree of trend agreement between signals.
The analysis was conducted on two levels, as follows: intra-subject analysis, where for each subject, the RR values were computed across all time windows (e.g., for subject 1, we considered all 15 windows), allowing us to assess how each subject’s respiratory rate varied over time; and inter-subject analysis, where for each time window, the RR values were compared across all subjects (e.g., for time window 1, we considered the RR of all subjects), enabling us to evaluate variability between subjects. This dual approach allowed us to capture both intra-subject variability over time and differences in estimation performance across subjects. The evaluation metrics (MAE, RMSE, MAPE, and ρ ) were calculated for the overall values, obtained as the average of the intra-subject means followed by the average of the inter-subject means.
Furthermore, to assess and compare the accuracy and reliability of the two measurements, the Wilcoxon signed-rank test was performed on the within and between analysis by comparing the average derived and reference RRs.
Moreover, Bland–Altman (BA) analysis in and between subjects was used to visually assess the agreement between the two measurements. In the graphical representation of BA analysis, the mean of the two measurements is plotted on the x-axis, while the difference between the measurements is plotted on the y-axis. To obtain the limits of agreement, defined as the mean of the differences ±1.96 times the standard deviation (i.e., 95% of the confidence interval), the mean of differences (bias) and the standard deviation of differences were calculated. This method allows for evaluating errors, such as the distance of bias from zero. The overall statistical significance was set to α = 0.05 .

3. Results

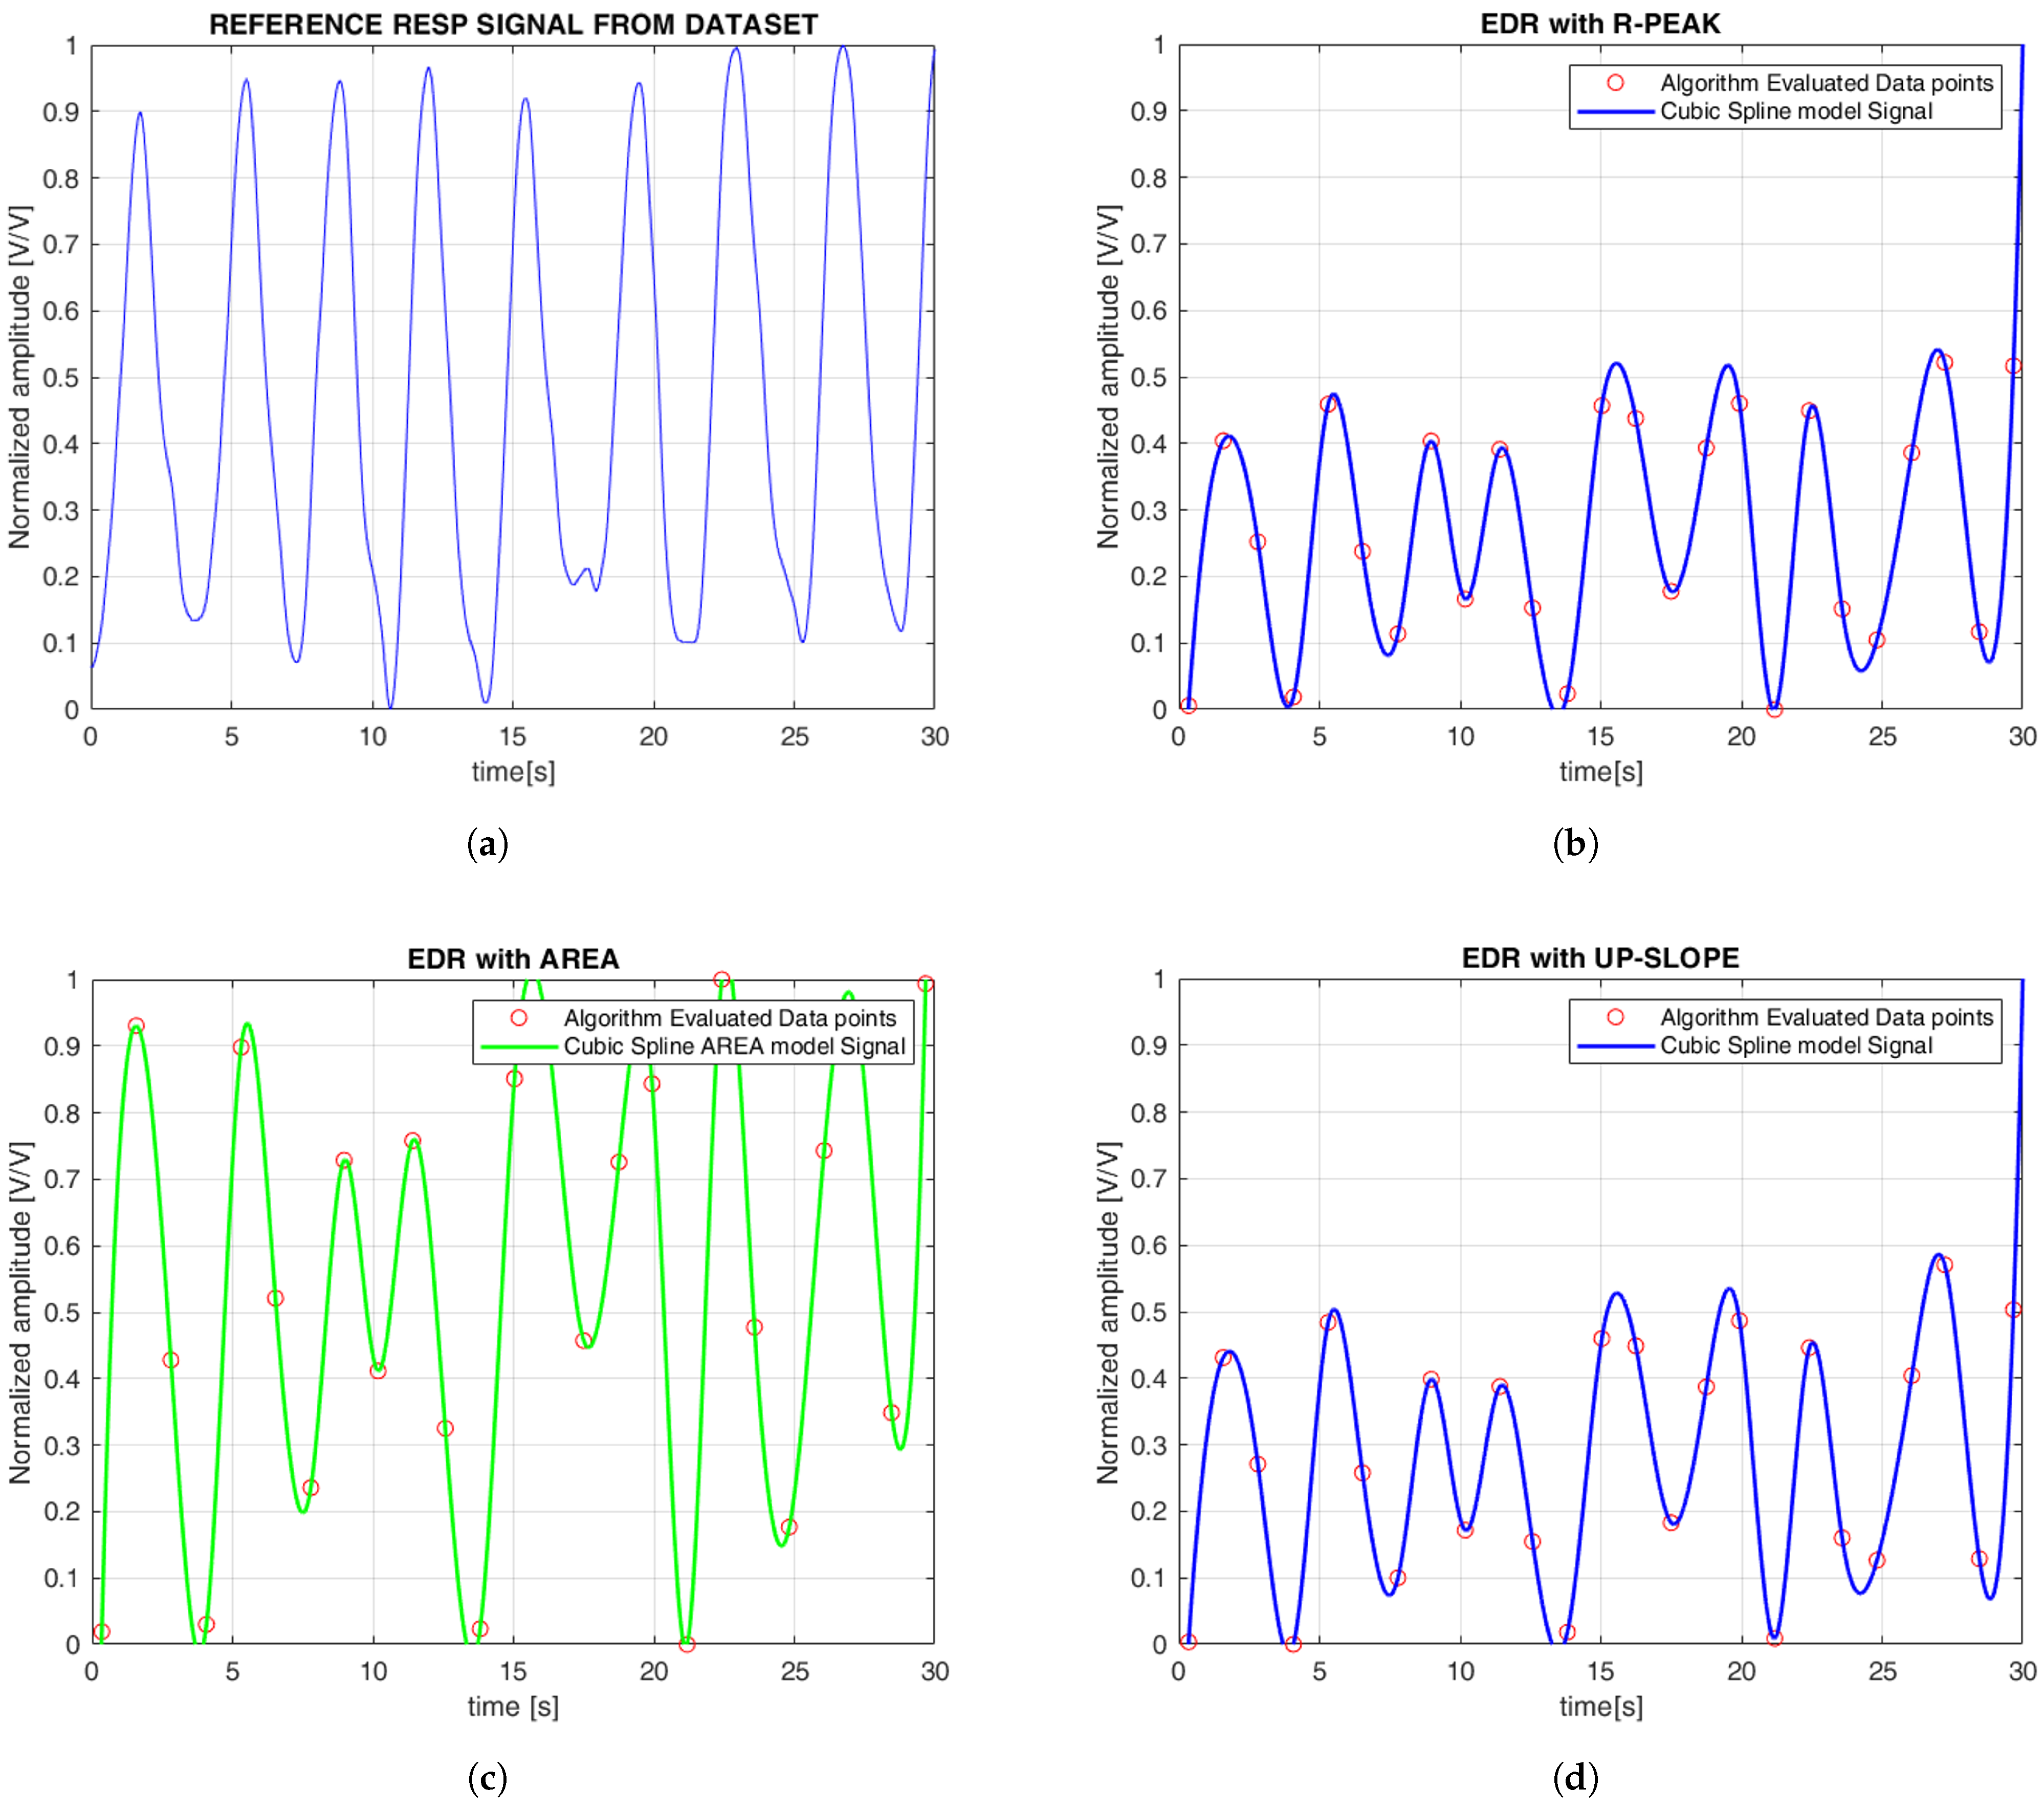
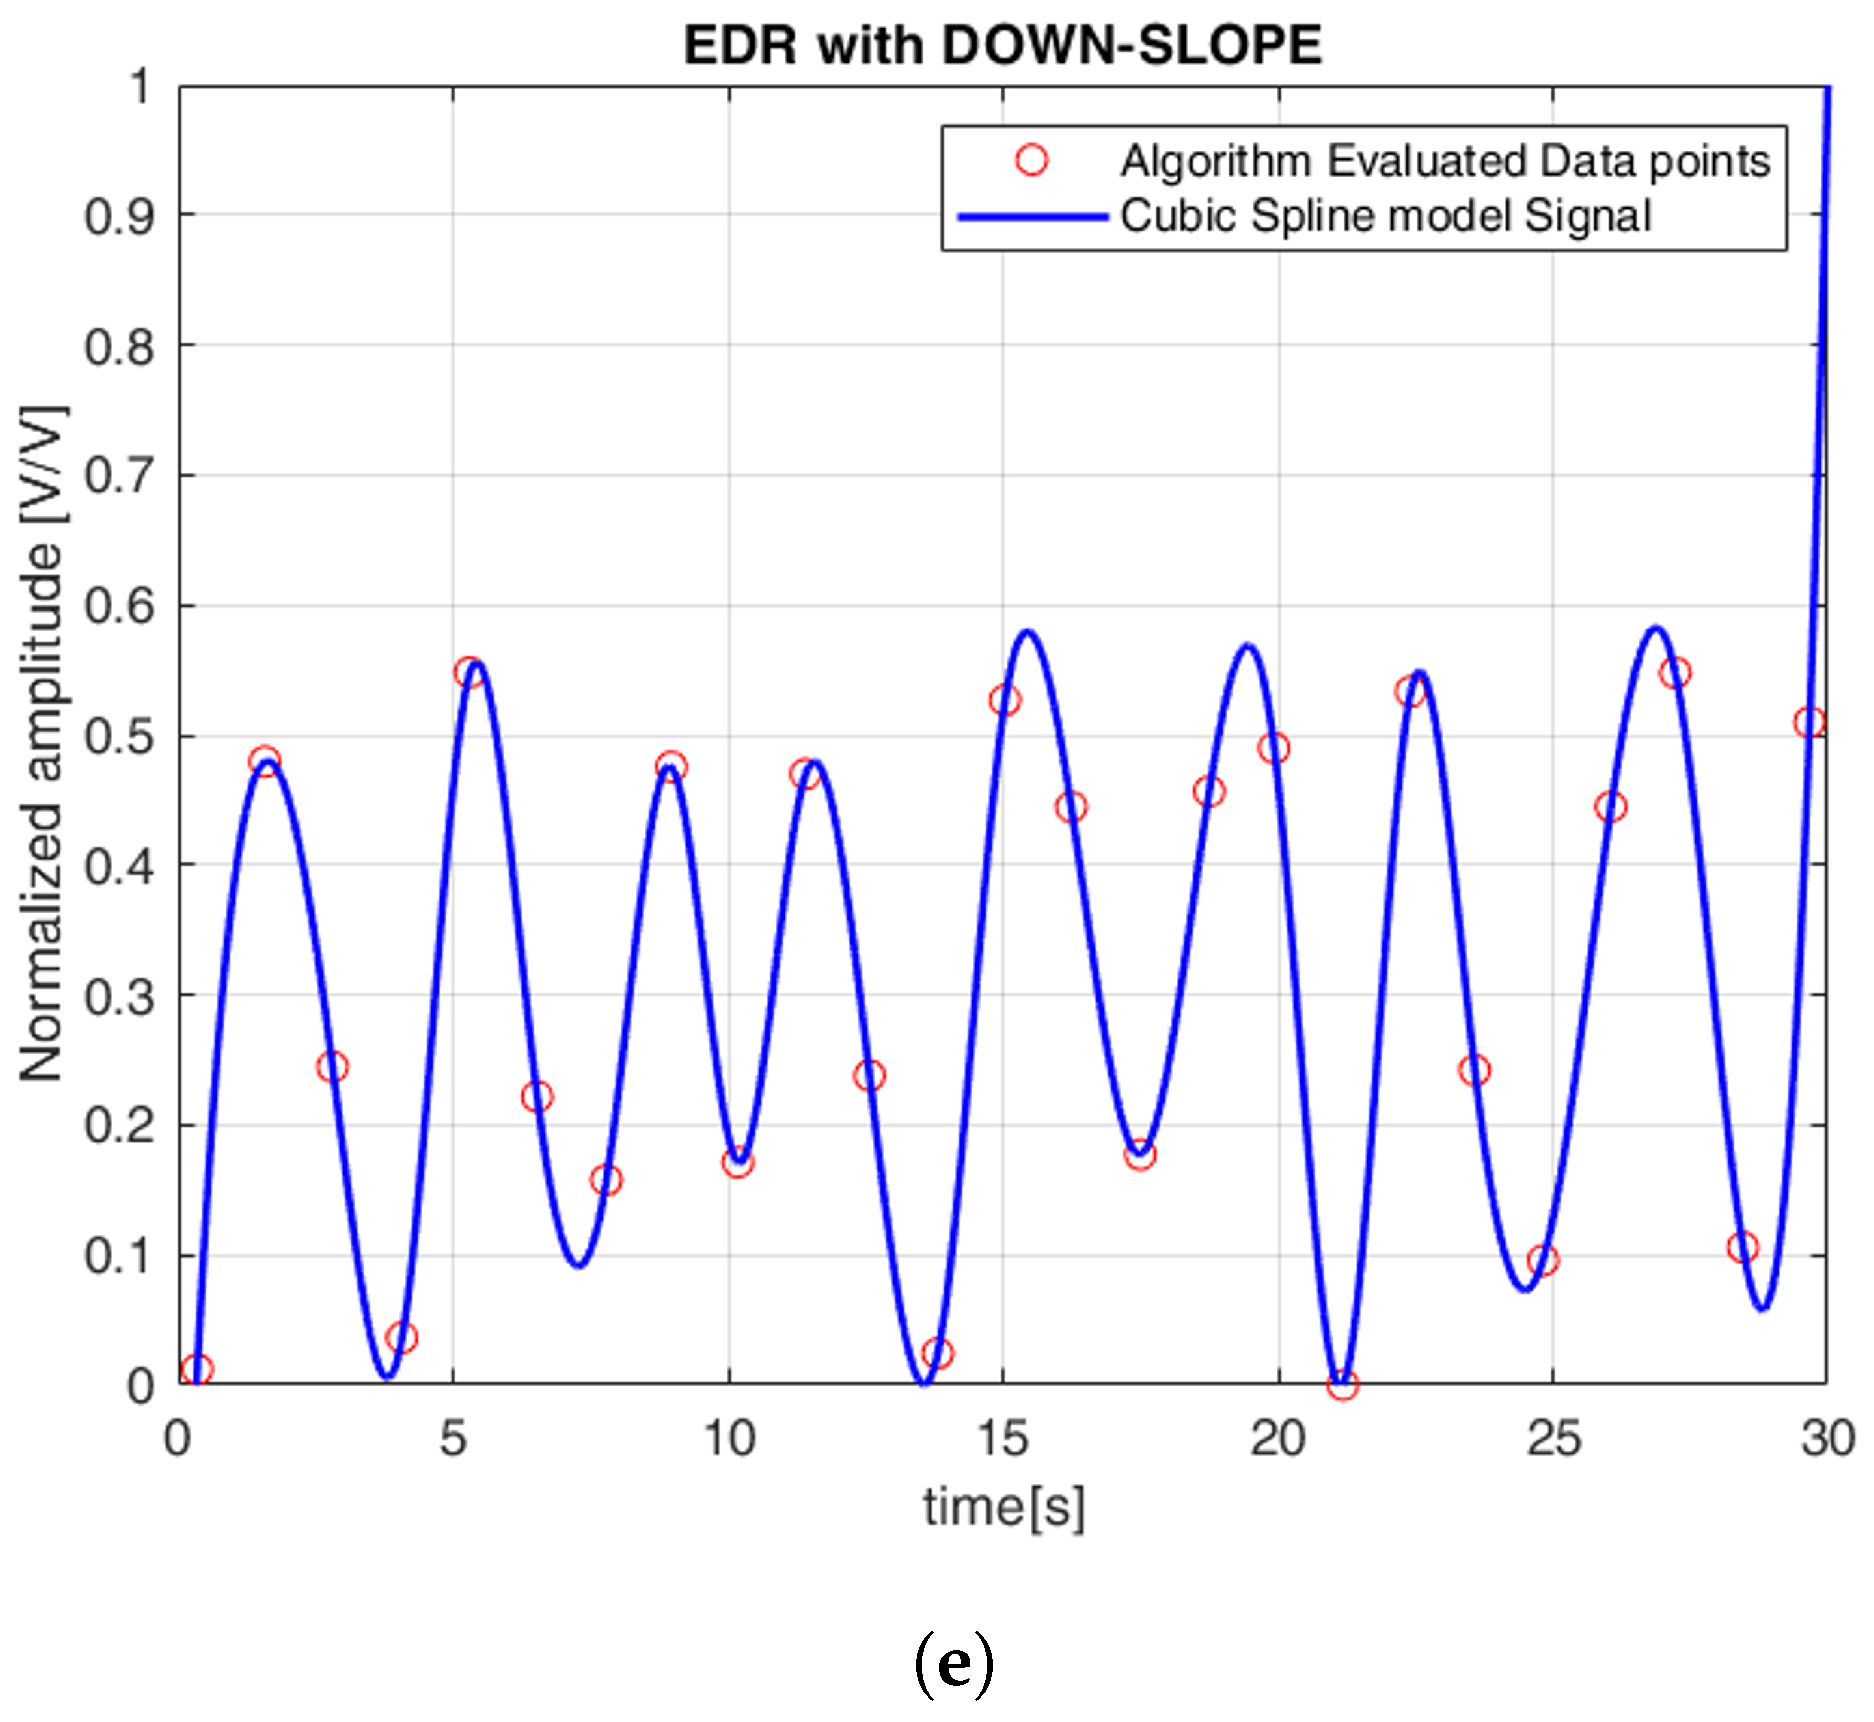
In this section, we present both qualitative and quantitative evaluations of the ECG- and PPG-estimated signals compared to the reference signals. Figure 6 illustrates the continuous EDR signal reconstructed using cubic spline interpolation, applied to QRS morphological features. To simplify the comparison between the reference and estimated signals, the amplitudes were normalized, with all plots displayed between 0 and 1. Specifically, the R-peak, QRS slope (both up-slope and down-slope), and QRS area were extracted, with each feature generating a separate EDR signal that reflects the respiratory variations associated with that particular morphological feature. Similarly, Figure 7 shows the PDR signals derived from the AM and FM components of the PPG signal. Both features were analyzed, and cubic spline interpolation was used to reconstruct a continuous respiration signal derived from the PPG.
Table 1 shows the performance metrics for the ECG and PPG signals for both datasets. The results clearly show that ECG signals outperform PPG signals in terms of accuracy of breath rate estimation, as reflected in consistently lower MAE, MAPE, and RMSE values for ECG-based methods. Specifically, ECG-based methods (such as the R peak, QRS area, and QRS slope) showed lower and more consistent errors in both datasets. In the iAMwell dataset, MAE ranged from 0.99 to 1.04 breaths/min, while in the Capnobase dataset, it increased to between 3.07 and 3.74 breaths/min, still within a reasonably low error range. In contrast, PPG-based methods (FM and AM) showed significantly higher MAE values, ranging between 5.10 and 5.12 breaths/min in iAMwell and increasing substantially in Capnobase (10.66 and 13.90 breaths/min), indicating poorer performance. Looking at MAPE, the ECG methods maintained relatively low errors (9.45–9.94% in iAMwell and around 30.78% in Capnobase), while PPG showed substantially higher error rates: 26.65–27.17% in iAMwell and more than 100% in Capnobase, reflecting a much less reliable estimation. The RMSE values follow the same trend—the ECG resulted in 2.68–2.86 pbm in iAMwell and 11.71–13.46 breaths/min in Capnobase, while the PPG results were consistently worse in both datasets.
Regarding correlation, a moderate and statistically significant relationship was observed for ECG-based methods in both data sets. Specifically, for the R-peak–based method, the correlation coefficient was ρ = 0.700 in the iAMwell dataset (p-value = 0.010) and ρ = 0.642 in the Capnobase dataset (p-value = 0.015). For the QRS area method, the correlation was ρ = 0.684 in iAMwell and ρ = 0.535 in Capnobase (p-values = 0.021 and 0.016, respectively). The up-slope method yielded ρ = 0.672 in iAMwell (p-value = 0.024), while the down-slope method showed a lower correlation of ρ = 0.600 (p-value = 0.036). In Capnobase, the QRS slopes showed a significant correlation (p-value = 0.029, and p-value = 0.038, respectively), but with respect to ρ < 0.50. In contrast, PPG-based methods demonstrated weak correlations in both datasets, with all ρ values below 0.5, indicating a limited association between PPG-derived estimates and the reference respiratory rate.
Table 2 and Table 3 present the within-subject comparison between the derived and reference average RR values for both datasets, respectively.
Table 4 and Table 5 present the between-subject comparison between the derived and reference average RR values for each dataset, respectively.
To assess the agreement between the estimated and reference RR, the Bland–Altman bias and limits of agreement for each method, for both ECG and PPG signals, and for both datasets (iAMwell and Capnobase), are summarized in Table 6.
It is worth noting that ECG-based methods tend to underestimate the RR, whereas PPG-based methods generally overestimate it. Among all evaluated techniques, the R-peak–based method demonstrated the most stable and accurate performance, with consistently low bias values and performance metrics in both within-subject and between-subject analyses, and across the iAMwell and Capnobase datasets. Given its robustness, low systematic error, and consistent performance, the BA plots are reported only for the R-peak–based method, as a representative example of the best-performing approach.
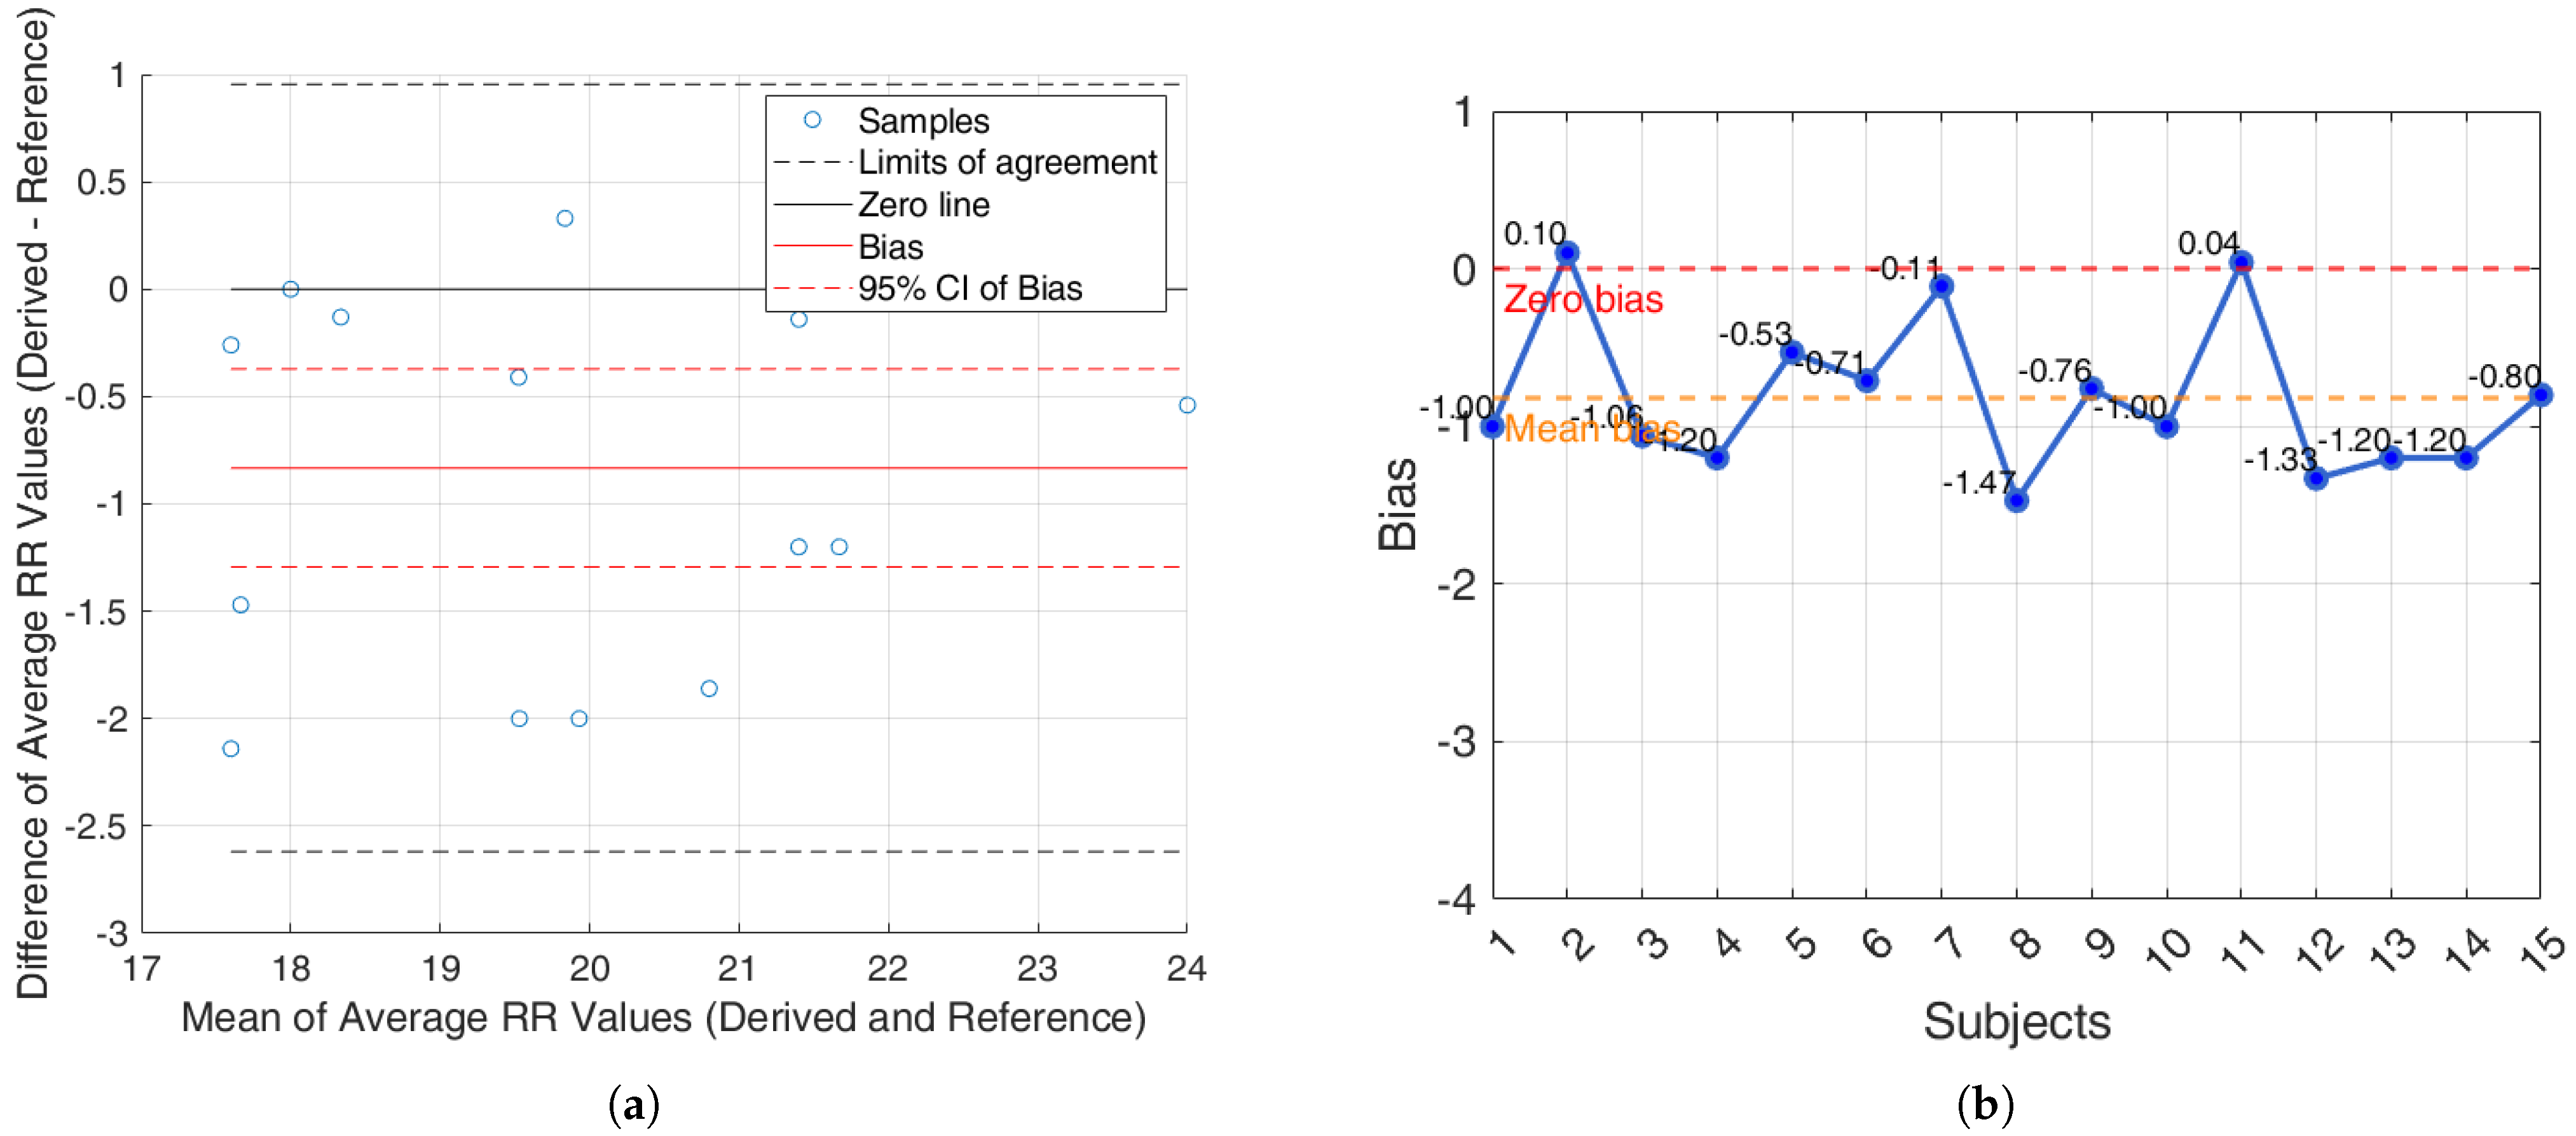
For the iAMwell dataset, the BA analysis based on the agreement within subjects is shown in Figure 8a. In Figure 8b, the bias for each subject is reported.
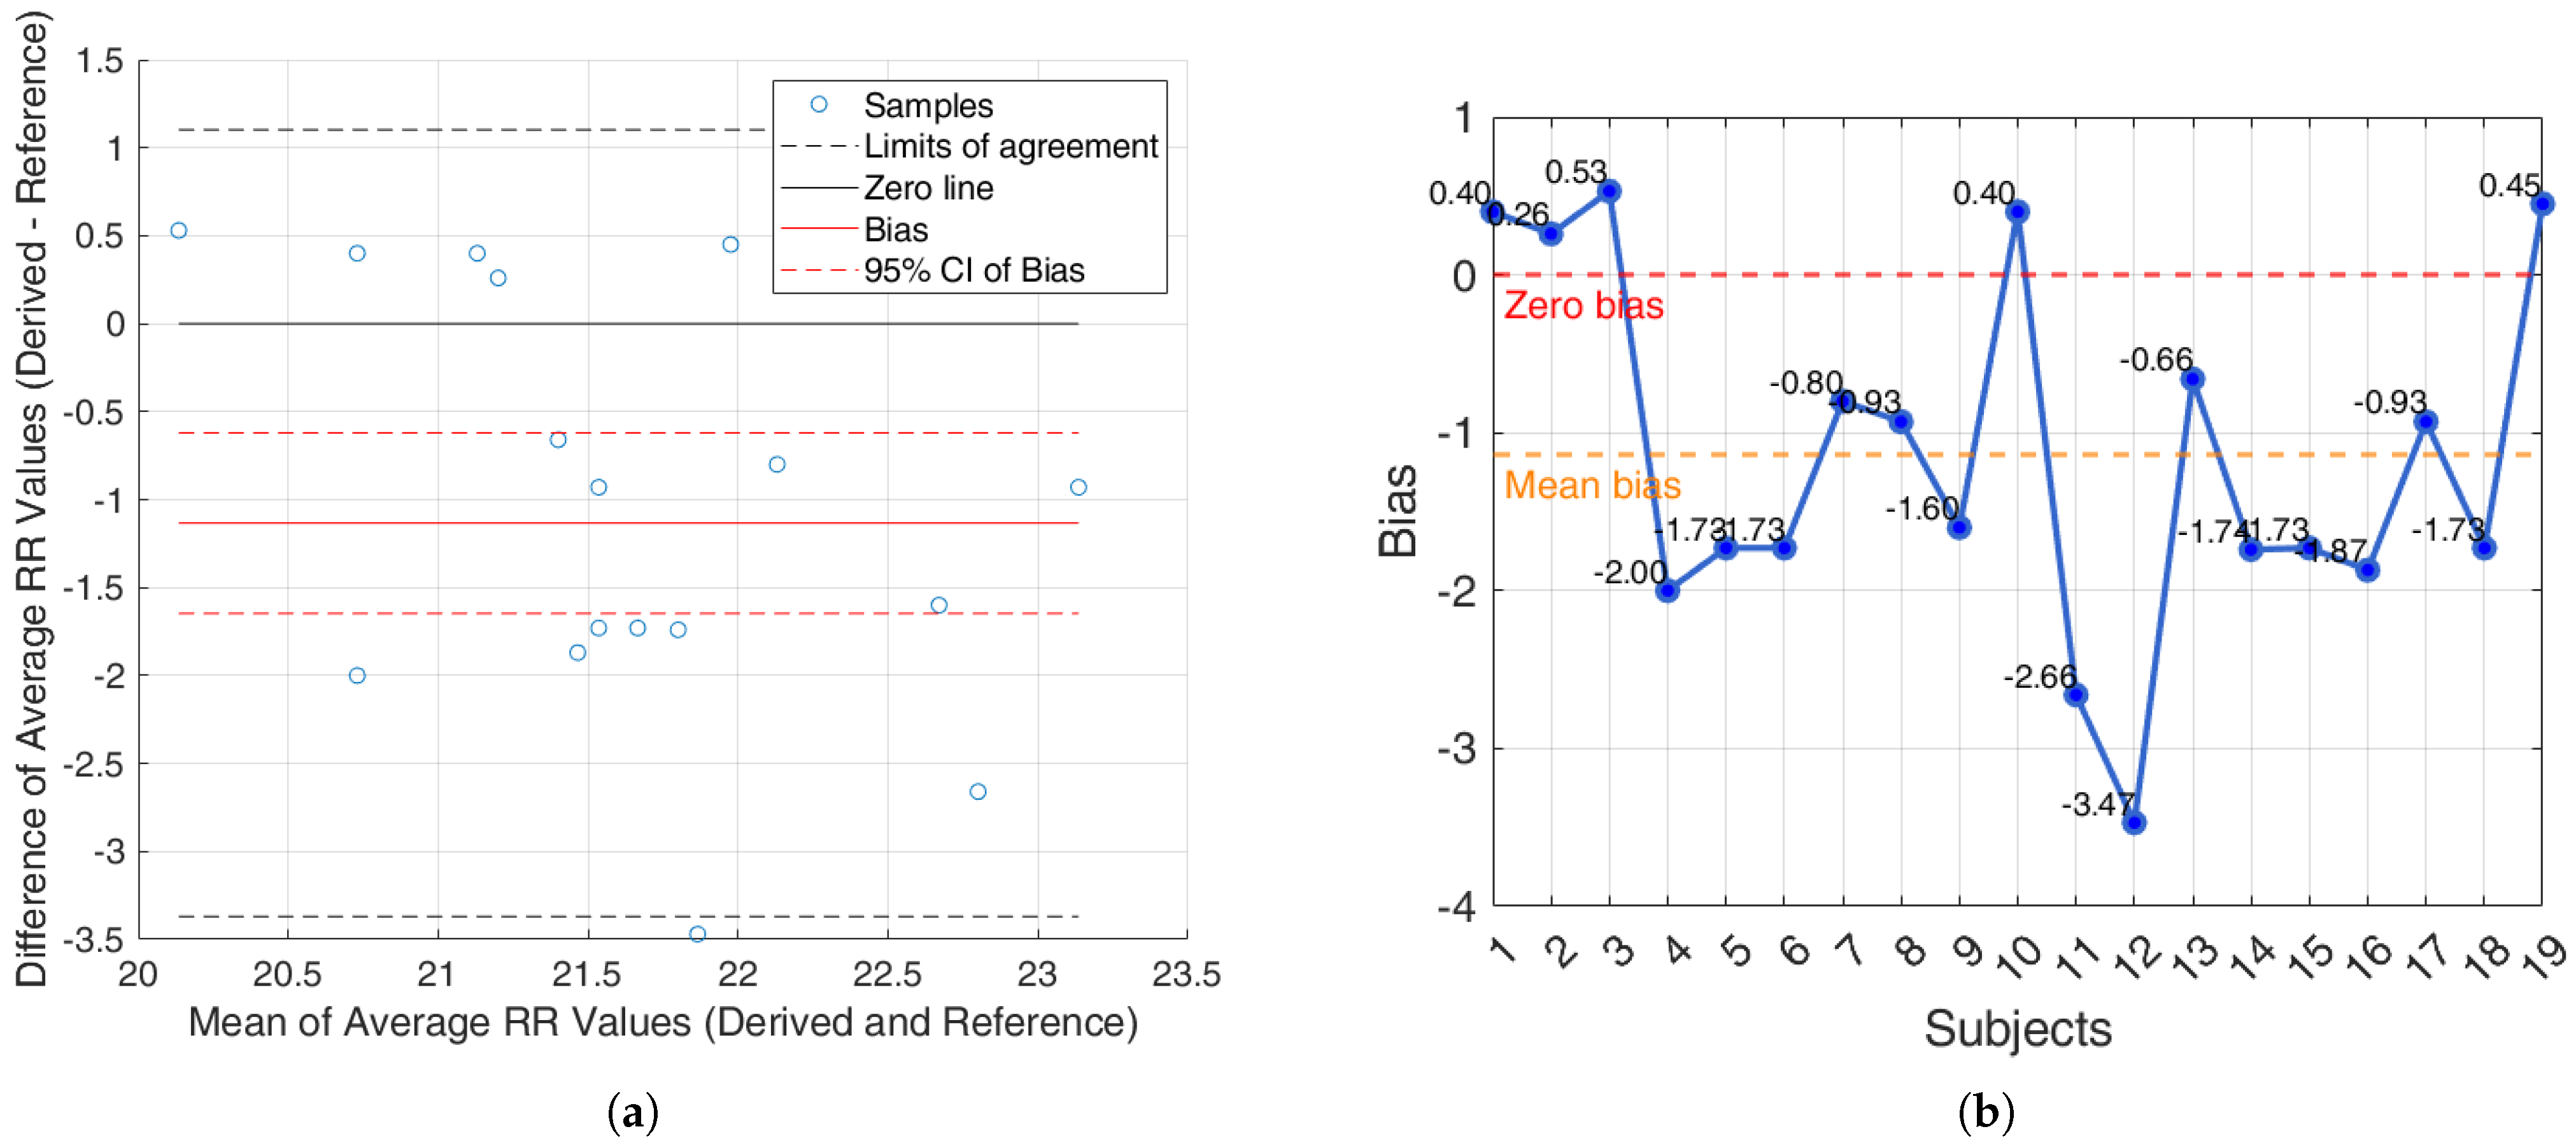
For the Capnobase dataset, the BA analysis based on the agreement within subjects is shown in Figure 9a. In Figure 9b, the bias for each subject is reported.
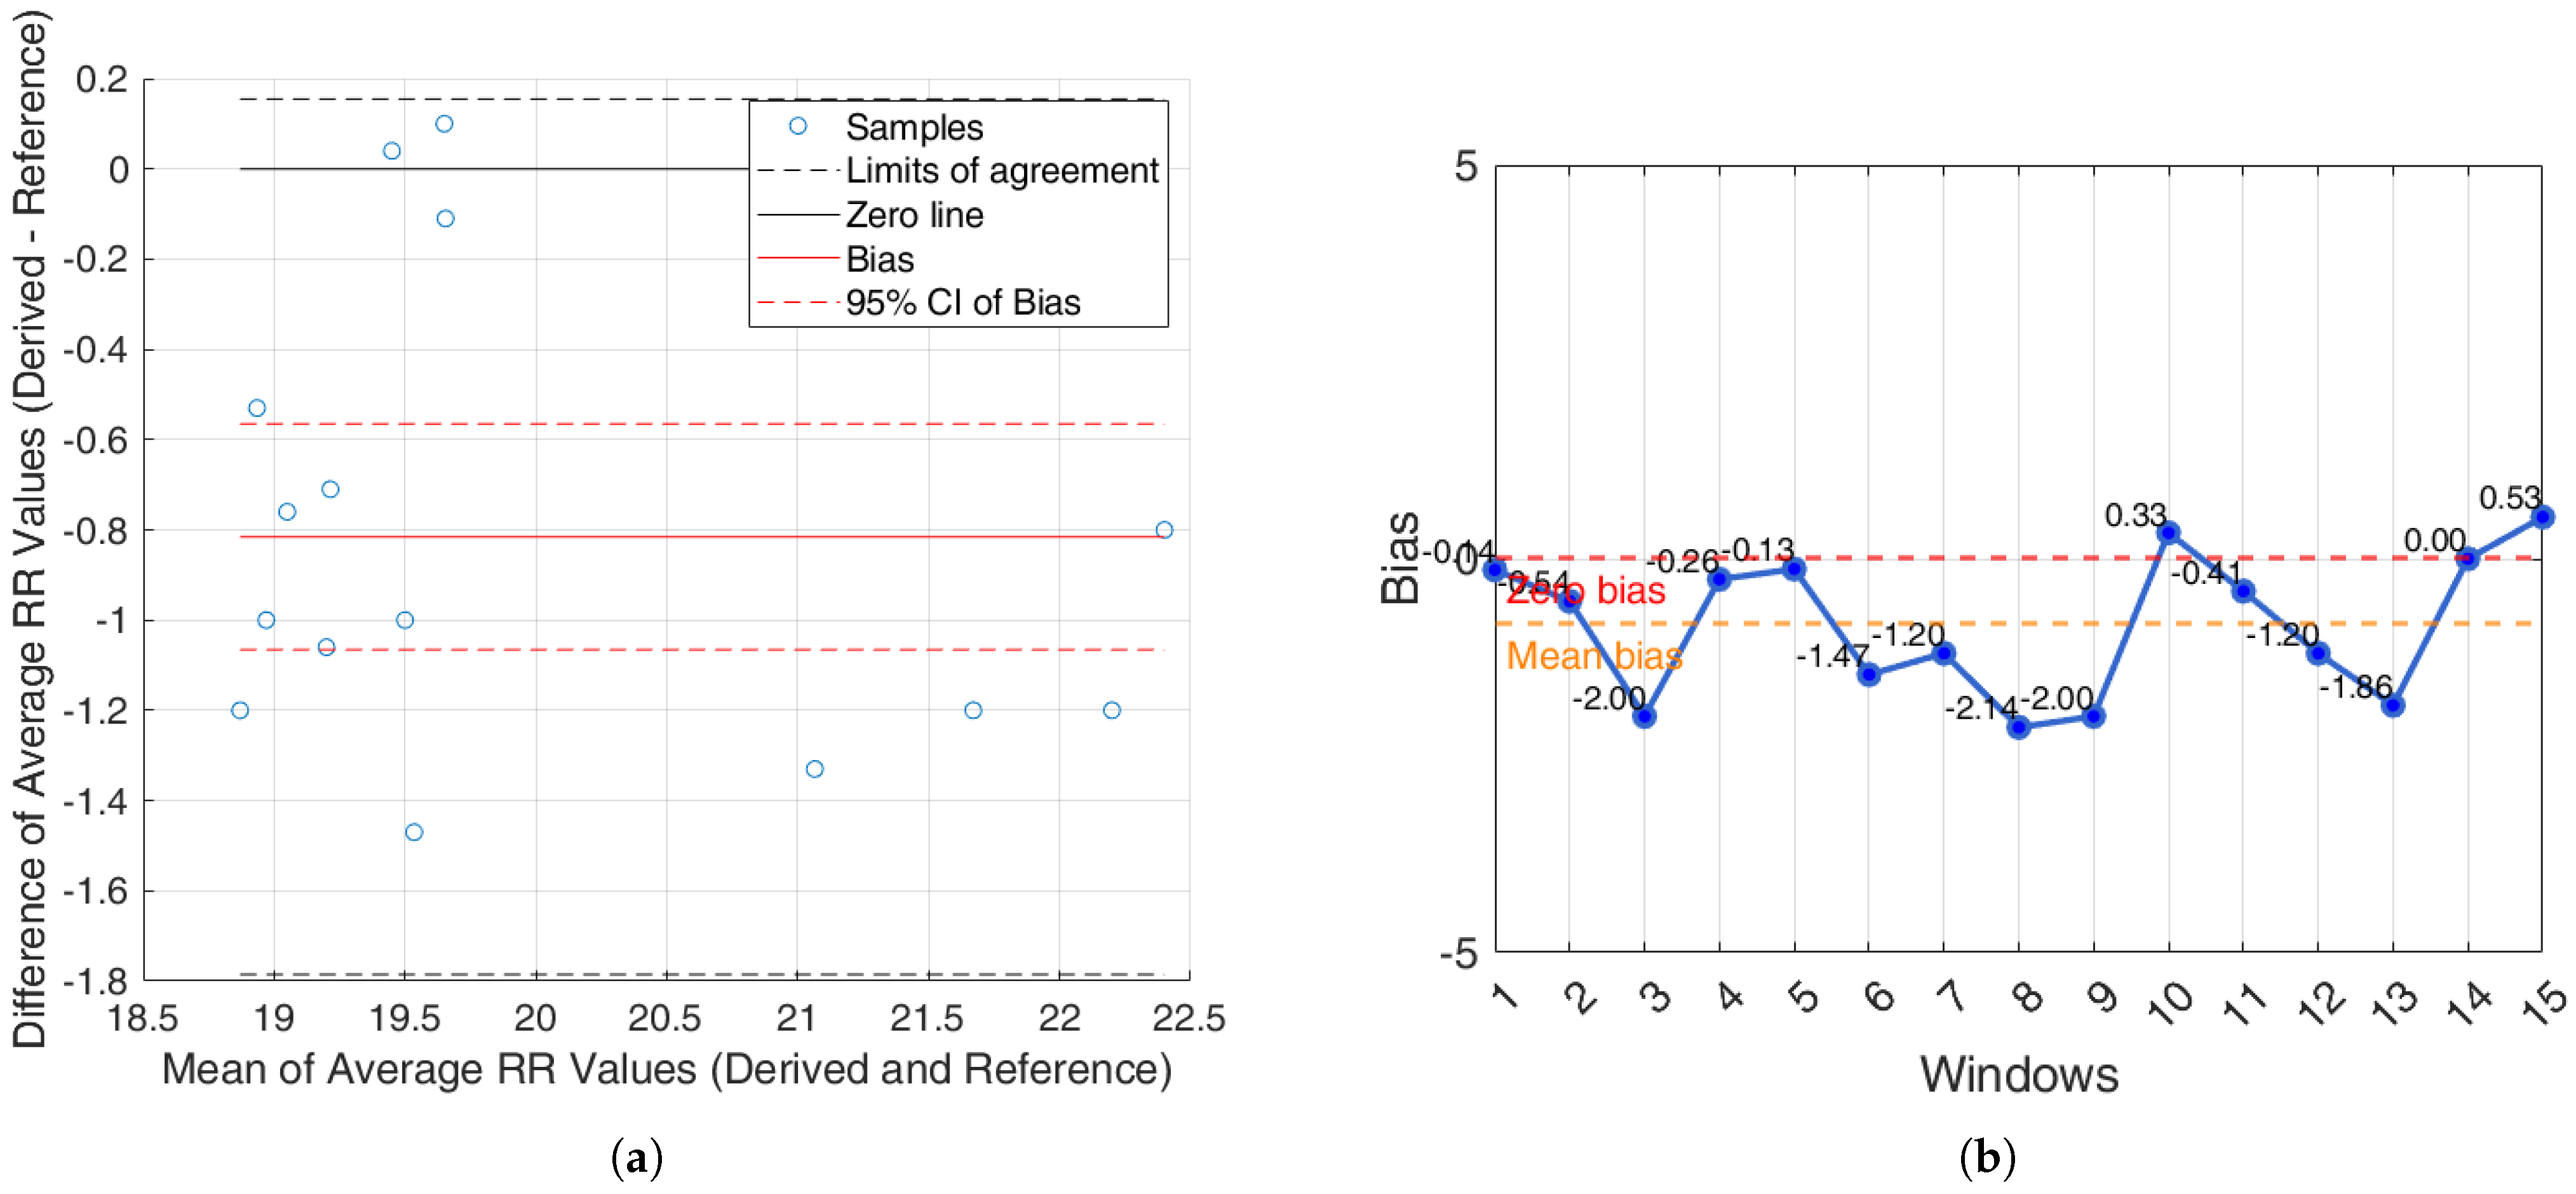
For the iAMwell dataset, the BA analysis based on the agreement between subjects, which shows the average RR (derived and reference), is shown in Figure 10a. In Figure 10b, the bias for each window is reported.
For the Capnobase dataset, the BA analysis based on the agreement between subjects, which shows the average RR (derived and reference), is shown in Figure 11a. In Figure 11b, the bias for each window is reported.

4. Discussion

Numerous methods have been proposed in the literature for extracting EDR and PDR signals, aiming to enable automated and non-invasive monitoring of RR in both clinical and everyday settings. These techniques are mainly divided into two categories, namely, filter-based and feature-based approaches [19,25]. Filter-based methods apply band-pass filters directly to isolate respiratory frequency components [48,49], while feature-based approaches extract beat-by-beat characteristics (e.g., QRS area and duration, peak amplitude, PPG pulse width) that reflect respiratory modulation [30,50,51,52]. In 2016, Charlton et al. [25] conducted a comprehensive comparison of various algorithms for estimating RR from ECG and PPG signals, under both ideal and real clinical conditions. Their findings showed that algorithms generally performed better when applied to ECG rather than PPG signals.
The present work lies in the proposal of a methodological pipeline for RR estimation, based on the extraction of morphological features from ECG and PPG signals, aimed at identifying the most accurate and robust features. Although we focus on a single algorithm and a limited set of six features, the proposed method is simple to implement, computationally efficient, and relies on key fiducial points commonly used for both ECG and PPG. To validate the pipeline, two publicly available datasets, which include both healthy and pathological subjects, were used, allowing us to assess performance across different populations. Additionally, RR estimation was evaluated across all time windows of the signals, providing a realistic measure of performance across varying signal quality. In line with previous literature [36,37], results demonstrated that a 30-s time window yielded the highest accuracy for RR estimation. By contrast, although Charlton et al. [25] also used 32-s windows, they excluded segments with poor signal quality, meaning their reported performance is based only on clean, high-quality windows. Our approach, therefore, offers a more representative evaluation under real-world conditions.
Based on the obtained results, it is possible to observe that the derived signal and the reference signal oscillate with a similar pattern, especially in the case of ECG-derived signals, which allowed for the reconstruction of the EDR signal with good performance. In contrast, while the signal derived from the PPG also displayed a similar visual pattern, it exhibited a higher oscillatory rate. To further detail, we performed a quantitative evaluation by calculating error metrics in order to provide a more accurate assessment of each method (Table 1). Indeed, the ECG-features methods showed the lowest values compared to the PPG-features methods in both datasets. In accordance with previous findings reported in the literature [25], the findings of the present study suggest that the algorithms for RR estimation based on ECG features outperform those relying on PPG characteristics. The ECG features are intentionally simple and interpretable, mainly based on amplitudes and slopes around the R-wave. This simplicity offers advantages, especially in terms of computational load and physiological interpretability, thereby facilitating simpler real-time applications. While our study did not directly explore the physiological mechanisms underlying these features, previous research has linked QRS slopes to cardiac ischemia biomarkers and identified variations in R-wave amplitude as relevant in contexts such as sleep apnea detection [42]. These results are further supported by the statistical analyses performed. From the Wilcoxon signed rank test within the within-subject analysis, the derived breathing rates from the ECG-derived features are very close to the reference values, with few statistically significant differences (Table 2 and Table 3). A similar trend was observed in the between-subjects analysis (Table 4 and Table 5). In contrast, PPG-derived features exhibited a higher number of statistically significant differences, suggesting greater variability and reduced consistency in estimating RR both within and between subjects (Table 4 and Table 5).
Additionally, an agreement analysis was performed to evaluate the consistency between estimated and reference respiratory signals, offering a holistic view of each method’s reliability. ECG-derived features (R-peak, QRS area, up-slope, down-slope) exhibit relatively small bias values across both datasets and conditions, with most values close to or below ±1 breaths/min. Among the ECG-features, the R-peak showed the lowest error rates, confirming its superior reliability for RR estimation. In particular, the RR predicted by the proposed algorithms showed promising results, aligning well with the reference respiratory signals. The BA plots based on inter-subject agreement show a mean difference (bias) of −0.97 breaths/min in iAMwell and −1.16 breaths/min in Capnobase, indicating a systematic underestimation by the derived method. All data points fall within the limits of agreement, suggesting good consistency between the two methods. No apparent trend is observed between the differences and the mean values. Similarly, the intra-subject BA analysis reveals a bias of −0.84 breaths/min in iAMwell and −1.22 breaths/min in the Capnobase, again indicating systematic underestimation. In this case, all data points also lie within the agreement limits, further confirming the reliability of the derived method. In contrast, the PPG-derived features (FM and AM) show greater variability. While AM and FM components on the iAMwell dataset present moderately higher bias. In particular, the AM values remain relatively stable between intra- and inter-subject evaluations. Notably, the Capnobase dataset reveals more pronounced fluctuations—FM exhibits a high positive bias in both the intra- and inter-subject analyses (13.45 and 19.83 breaths/min, respectively). Additionally, the limits of agreement are wider in the inter-subject analysis. This may be attributed to the greater variability among subjects, as also suggested by Pimentel et al. [53]. Consistent with this trend, it is worth noting that ECG-based methods tend to underestimate the RR, whereas PPG-based methods generally overestimate it.
Although PPG is widely used in wearable devices due to its ease of acquisition and non-invasiveness, respiration signals derived from PPG showed lower performance compared to those obtained from ECG. This can be attributed to PPG’s greater sensitivity to motion artifacts, especially during physical activity, but also to vascular and tissue changes that may occur even in the absence of movement, such as in clinically ill patients. Factors like vasoconstriction, hypothermia, a deep gasp, or a yawn could degrade the signal and impact the accuracy of PPG-derived respiratory rate estimates [54,55,56]. Considering our results, the respiratory signal in the Capnobase dataset is of the capnographic type, meaning it is measured based on CO2 oscillations. This signal is sensitive to changes in pulmonary blood flow distribution and perfusion, and it may be less reliable than thoracic respiratory measurements. In contrast, the iAMwell dataset captures respiratory activity through variations in abdominal and thoracic circumference using inductive sensors. Considering that AM in the PPG signal is primarily driven by intrathoracic pressure changes [19] and not directly influenced by ventilation, we hypothesize that the PPG signal may correlate more strongly with the inductive respiratory signal from the iAMwell dataset, based on thoracic and abdominal circumferences, than with the capnogram from the Capnobase dataset, which reflects CO2 oscillations. This could explain the observed differences in performance between the two datasets.
Considering FM, as mentioned in the introduction, it originates from RSA, a physiological response in which respiration induces changes in intrathoracic pressure. For example, inhalation induces an increase that stretches the sinoatrial node and increases heart rate. Since ECG directly captures the heart’s electrical activity, it provides a more direct and accurate measure of RSA-induced FM compared to PPG.
Finally, it is worth noting that the findings from the iAMwell dataset showed that the acceleration phase of the exercise protocol revealed a clear increase in RR, consistent with the expected physiological response to exercise. Starting from a baseline of 19 breaths/min, RR gradually increased as treadmill speed accelerated, reaching up to 22 breaths/min. This trend reflects the body’s natural adjustment to physical exertion, confirming that the algorithm effectively captures the expected changes in breathing rate during exercise, making it a reliable tool for monitoring respiratory responses to varying intensities.
While only a limited number of studies have simultaneously leveraged both ECG and PPG signals [26,27,28,29,30], the majority of existing research has primarily focused on the technical development of filters and signal reconstruction methods [31,32,33], rather than on analyzing how different features extracted from source signals (i.e., ECG or PPG) impact the accuracy of RR estimation. As a result, direct comparison with existing literature is not straightforward.
A key strength of this study is the use of two complementary datasets, including both healthy and pathological subjects, which allows a more robust and clinically relevant evaluation of the proposed RR estimation methods. As a future development, working with more customized and clinically diverse datasets is still recommended, as this would allow for a more comprehensive validation and further optimization of the proposed approach. Future work will also explore the fusion of features from both ECG and PPG signals to improve estimation accuracy. Moreover, the influence of various technical (e.g., sampling frequency, measurement site, protocol), clinical (e.g., diseases, comorbidities), and socio-demographic (e.g., age, gender, body max index) factors on signal quality and reliability will be thoroughly investigated. Such an approach could ultimately offer a low-cost and efficient tool for early screening of potential pathologies or serve as a set of biomarkers for unhealthy lifestyle detection.

5. Conclusions

In conclusion, this study demonstrated the possibility of extracting respiratory patterns from both ECG and PPG signals. However, quantitative analysis showed that the signals derived from the ECG yielded more accurate results compared to PPG. The analysis highlighted that ECG-derived features provide more reliable estimations compared to PPG-based ones. The proposed feature selection approach allowed for the identification of the most informative parameters, improving robustness against intra- and inter-subject variability. These findings represent a promising step toward the development of cheap, non-invasive, and easily deployable respiration monitoring systems. Potential clinical applications may include continuous respiratory monitoring in intensive care units, post-operative settings, or during anesthesia, as well as remote and home-based monitoring for patients with chronic respiratory diseases such as asthma or sleep apnea. Future research will further validate and extend these results to broader and more diverse populations and conditions.

Author Contributions

Conceptualization, A.M.P., M.R. (Michela Russo), M.R. (Maria Romano) and F.A.; methodology, M.G.P., V.T., A.L., M.R. (Michela Russo), A.M.P. and C.R.; software, M.G.P., V.T. and A.L.; validation, A.M.P., M.R. (Michela Russo), M.R. (Maria Romano) and F.A.; formal analysis, A.M.P., M.R. (Michela Russo), C.R., A.T., M.R. (Maria Romano) and F.A.; investigation, A.M.P., M.R. (Michela Russo), M.R. (Maria Romano), C.R., A.T. and F.A.; data curation, A.M.P., M.R. (Michela Russo), M.G.P., V.T. and A.L.; writing—original draft preparation, M.G.P., V.T., A.L., A.M.P., M.R. (Michela Russo), M.R. (Maria Romano) and F.A.; writing—review and editing, A.M.P., M.R. (Michela Russo), C.R., A.T., M.R. (Maria Romano) and F.A.; visualization, A.M.P., M.R. (Michela Russo), C.R., A.T., M.R. (Maria Romano) and F.A.; supervision, M.R. (Maria Romano) and F.A. All authors have read and agreed to the published version of the manuscript.

Funding

This research received no external funding.

Institutional Review Board Statement

Not applicable.

Data Availability Statement

The data used in this study are publicly available as described in [34,35].

Conflicts of Interest

Authors Maria Giovanna Petrellese, Annalisa Letizia and Vincenza Tufano were employed by the Teoresi S.p.A. Group. The remaining authors declare that the research was conducted in the absence of any commercial or financial relationships that could be construed as a potential conflict of interest.

Abbreviations

The following abbreviations are used in this manuscript:
AMAmplitude Modulation
BABland-Altman
ECGElectrocardiogram
EDRElectrocardiogram-Derived Respiration
FMFrequency Modulation
MAEMean Absolute Error
MAPEMean Absolute Percentage Error
PDRPhotoplethysmography Derived Respiration
PPGPhotoplethysmography
RMSERoot Mean Square Error
RRRespiratory Rate
RSARespiratory Sinus Arrhythmia
SDStandard Deviation

References

  1. Masaoka, Y.; Homma, I. Anxiety and respiratory patterns: Their relationship during mental stress and physical load. Int. J. Psychophysiol. 1997, 27, 153–159. [Google Scholar] [CrossRef] [PubMed]
  2. Park, S.B.; Khattar, D. Tachypnea. In StatPearls [Internet]; StatPearls Publishing: St. Petersburg, FL, USA, 2024. Available online: https://www.ncbi.nlm.nih.gov/books/NBK541062/ (accessed on 10 April 2025).
  3. Dempsey, J.A.; Veasey, S.C.; Morgan, B.J.; O’Donnell, C.P. Pathophysiology of sleep apnea. Physiol. Rev. 2010, 90, 47–112. [Google Scholar] [CrossRef] [PubMed]
  4. Choi, J.; Gutierrez-Osuna, R. Removal of respiratory influences from heart rate variability in stress monitoring. IEEE Sens. J. 2011, 11, 2649–2656. [Google Scholar] [CrossRef]
  5. Varon, C.; Caicedo, A.; Testelmans, D.; Buyse, B.; Van Huffel, S. A novel algorithm for the automatic detection of sleep apnea from single-lead ECG. IEEE Trans. Biomed. Eng. 2015, 62, 2269–2278. [Google Scholar] [CrossRef]
  6. Hernando, A.; Lazaro, J.; Gil, E.; Arza, A.; Garzón, J.M.; Lopez-Anton, R.; De La Camara, C.; Laguna, P.; Aguiló, J.; Bailón, R. Inclusion of respiratory frequency information in heart rate variability analysis for stress assessment. IEEE J. Biomed. Health Inform. 2016, 20, 1016–1025. [Google Scholar] [CrossRef]
  7. De Chazal, P.; Heneghan, C.; Sheridan, E.; Reilly, R.; Nolan, P.; O’Malley, M. Automated processing of the single-lead electrocardiogram for the detection of obstructive sleep apnoea. IEEE Trans. Biomed. Eng. 2003, 50, 686–696. [Google Scholar] [CrossRef]
  8. Bartsch, J.P.; Schumann, A.Y.; Kantelhardt, J.W.; Penzel, T.; Ivanov, P.C. Phase transitions in physiologic coupling. Proc. Natl. Acad. Sci. USA 2012, 109, 10181–10186. [Google Scholar] [CrossRef]
  9. Charlton, P.H.; Bonnici, T.; Tarassenko, L.; Clifton, D.A.; Beale, R.; Watkinson, P.J.; Alastruey, J. An impedance pneumography signal quality index: Design, assessment and application to respiratory rate monitoring. Biomed. Signal Process. Control 2021, 65, 102339. [Google Scholar] [CrossRef]
  10. Charlton, P.H.; Villarroel, M.; Salguiero, F. Waveform analysis to estimate respiratory rate. In Secondary Analysis of Electronic Health Records; Springer: Berlin/Heidelberg, Germany, 2016; pp. 377–390. [Google Scholar]
  11. Baker, S.; Xiang, W.; Atkinson, I. Determining respiratory rate from photoplethysmogram and electrocardiogram signals using respiratory quality indices and neural networks. PLoS ONE 2021, 16, e0249843. [Google Scholar] [CrossRef]
  12. Orphanidou, C. Derivation of respiration rate from ambulatory ECG and PPG using ensemble empirical mode decomposition: Comparison and fusion. Comput. Biol. Med. 2017, 81, 45–54. [Google Scholar] [CrossRef]
  13. Nayan, N.A.; Jaafar, R.; Risman, N.S. Development of respiratory rate estimation technique using electrocardiogram and photoplethysmogram for continuous health monitoring. Bull. Electr. Eng. Inform. 2018, 7, 487–494. [Google Scholar] [CrossRef]
  14. Charlton, P.H.; Bonnici, T.; Tarassenko, L.; Alastruey, J.; Clifton, D.A.; Beale, R.; Watkinson, P.J. Breathing rate estimation from the electrocardiogram and photoplethysmogram: A review. IEEE Rev. Biomed. Eng. 2017, 11, 2–20. [Google Scholar] [CrossRef] [PubMed]
  15. Russo, M.A.; Santarelli, D.M.; O’Rourke, D. The physiological effects of slow breathing in the healthy human. Breathe 2017, 13, 298–309. [Google Scholar] [CrossRef] [PubMed]
  16. Kotani, K.; Hidaka, I.; Yamamoto, Y.; Ozono, S. Analysis of respiratory sinus arrhythmia with respect to respiratory phase. Methods Inf. Med. 2000, 39, 153–156. [Google Scholar] [CrossRef]
  17. Varon, C.; Morales, J.; Lázaro, J.; Orini, M.; Deviaene, M.; Kontaxis, S.; Testelmans, D.; Buyse, B.; Borzée, P.; Sörnmo, L.; et al. A comparative study of ECG-derived respiration in ambulatory monitoring using the single-lead ECG. Sci. Rep. 2020, 10, 5704. [Google Scholar] [CrossRef]
  18. Buda, A.J.; Pinsky, M.R.; Ingels, N.B., Jr.; Daughters, G.T.; Stinson, E.B.; Alderman, E.L. Effect of intrathoracic pressure on left ventricular performance. N. Engl. J. Med. 1979, 301, 453–459. [Google Scholar] [CrossRef]
  19. Charlton, P.H.; Bonnici, T.; Tarassenko, L.; Alastruey, J.; Clifton, D.A.; Beale, R.; Watkinson, P.J. Extraction of respiratory signals from the electrocardiogram and photoplethysmogram: Technical and physiological determinants. Physiol. Meas. 2017, 38, 669. [Google Scholar] [CrossRef]
  20. Bailón, R.; Sörnmo, L.; Laguna, P. ECG-derived respiratory frequency estimation. In Advanced Methods and Tools for ECG Data Analysis; Artech House, Inc.: Norwood, MA, USA; London, UK, 2006; Chapter 8; pp. 215–244. [Google Scholar]
  21. Nitzan, M.; Faib, I.; Friedman, H. Respiration-induced changes in tissue blood volume distal to occluded artery, measured by photoplethysmography. J. Biomed. Opt. 2006, 11, 040506. [Google Scholar] [CrossRef]
  22. Meredith, D.J.; Clifton, D.; Charlton, P.; Brooks, J.; Pugh, C.W.; Tarassenko, L. Photoplethysmographic derivation of respiratory rate: A review of relevant physiology. J. Med. Eng. Technol. 2012, 36, 1–7. [Google Scholar] [CrossRef]
  23. Berntson, G.G.; Cacioppo, J.T.; Quigley, K.S. Respiratory sinus arrhythmia: Autonomic origins, physiological mechanisms, and psychophysiological implications. Psychophysiology 1993, 30, 183–196. [Google Scholar] [CrossRef] [PubMed]
  24. Li, J.; Jin, J.; Chen, X.; Sun, W.; Guo, P. Comparison of respiratory-induced variations in photoplethysmographic signals. Physiol. Meas. 2010, 31, 415. [Google Scholar] [CrossRef] [PubMed]
  25. Charlton, P.H.; Bonnici, T.; Tarassenko, L.; Clifton, D.A.; Beale, R.; Watkinson, P.J. An assessment of algorithms to estimate respiratory rate from the electrocardiogram and photoplethysmogram. Physiol. Meas. 2016, 37, 610. [Google Scholar] [CrossRef] [PubMed]
  26. Ahlstrom, C.; Johansson, A.; Lanne, T.; Ask, P. A respiration monitor based on electrocardiographic and photoplethysmographic sensor fusion. In Proceedings of the 26th Annual International Conference of the IEEE Engineering in Medicine and Biology Society, San Francisco, CA, USA, 1–5 September 2004; pp. 2311–2314. [Google Scholar]
  27. Ding, X.-R.; Zhang, Y.-T.; Tsang, H.K.; Karlen, W. A pulse transit time based fusion method for the noninvasive and continuous monitoring of respiratory rate. In Proceedings of the 2016 38th Annual International Conference of the IEEE Engineering in Medicine and Biology Society (EMBC), Orlando, FL, USA, 16–20 August 2016; pp. 4240–4243. [Google Scholar]
  28. Madhav, K.V.; Raghuram, M.; Krishna, E.H.; Komalla, N.R.; Reddy, K.A. Extraction of respiratory activity from ECG and PPG signals using vector autoregressive model. In Proceedings of the 2012 IEEE International Symposium on Medical Measurements and Applications Proceedings, Piscataway, NJ, USA, 18–19 May 2012; pp. 1–4. [Google Scholar]
  29. Mann, S.; Orglmeister, R. ECG, PPG and ABP sensor fusion for a PCA-based respiratory activity estimation. Biomed. Eng. Tech. 2012, 57, 232–235. [Google Scholar] [CrossRef]
  30. Orphanidou, C.; Fleming, S.; Shah, S.A.; Tarassenko, L. Data fusion for estimating respiratory rate from a single-lead ECG. Biomed. Signal Process. Control 2013, 8, 98–105. [Google Scholar] [CrossRef]
  31. Zhang, X.; Ding, Q. Respiratory rate monitoring from the photoplethysmogram via sparse signal reconstruction. Physiol. Meas. 2016, 37, 1105. [Google Scholar] [CrossRef]
  32. Zhang, X.; Ding, Q. Respiratory rate estimation from the photoplethysmogram via joint sparse signal reconstruction and spectra fusion. Biomed. Signal Process. Control 2017, 35, 1–7. [Google Scholar] [CrossRef]
  33. Chung, I.-Q.; Yu, J.-T.; Hu, W.-C. Estimating heart rate and respiratory rate from a single lead electrocardiogram using ensemble empirical mode decomposition and spectral data fusion. Sensors 2021, 21, 1184. [Google Scholar] [CrossRef]
  34. Elia, R.; Papa, K.; Theocharides, T.; Orphanidou, C. ECG, PPG, RSP signals from athletes and non-athletes during exercise-iAMwell. Zenodo 2017. [Google Scholar] [CrossRef]
  35. Karlen, W. CapnoBase IEEE TBME Respiratory Rate Benchmark. Borealis, 2021. Version V1. Available online: https://borealisdata.ca/dataset.xhtml?persistentId=doi:10.5683/SP2/NLB8IT (accessed on 20 April 2025).
  36. Lazazzera, R.; Carrault, G. Breathing rate estimation methods from PPG signals, on CAPNOBASE database. Comput. Cardiol. 2020, 2020, 9344066. [Google Scholar]
  37. Lin, Y.; Song, X.; Zhao, Y.; Zhang, C.; Ding, X. Continuous respiratory rate monitoring through temporal fusion of ECG and PPG signals. PLoS ONE 2025, 20, e0325307. [Google Scholar] [CrossRef] [PubMed]
  38. Blanco-Velasco, M.; Weng, B.; Barner, K.E. ECG signal denoising and baseline wander correction based on the empirical mode decomposition. Comput. Biol. Med. 2008, 38, 1–13. [Google Scholar] [CrossRef] [PubMed]
  39. Chandrakar, C.; Kowar, M.K. Denoising ECG signals using adaptive filter algorithm. Int. J. Soft Comput. Eng. 2012, 2, 120–123. [Google Scholar]
  40. Joshi, S.L.; Vatti, R.A.; Tornekar, R.V. A survey on ECG signal denoising techniques. In Proceedings of the 2013 International Conference on Communication Systems and Network Technologies, Gwalior, India, 6–8 April 2013; pp. 60–64. [Google Scholar]
  41. Pan, J.; Tompkins, W.J. A real-time QRS detection algorithm. IEEE Trans. Biomed. Eng. 1985, 3, 230–236. [Google Scholar] [CrossRef]
  42. Lázaro, J.; Reljin, N.; Bailón, R.; Gil, E.; Noh, Y.; Laguna, P.; Chon, K.H. Electrocardiogram derived respiratory rate using a wearable armband. IEEE Trans. Biomed. Eng. 2020, 68, 1056–1065. [Google Scholar] [CrossRef]
  43. Murthy, V.S.; Ramamoorthy, S.; Srinivasan, N.; Rajagopal, S.; Rao, M.M. Analysis of photoplethysmographic signals of cardiovascular patients. In Proceedings of the 2001 23rd Annual International Conference of the IEEE Engineering in Medicine and Biology Society, Istanbul, Turkey, 25–28 October 2001; pp. 2204–2207. [Google Scholar]
  44. Lee, H.-W.; Lee, J.-W.; Jung, W.-G.; Lee, G.-K. The periodic moving average filter for removing motion artifacts from PPG signals. Int. J. Control Autom. Syst. 2007, 5, 701–706. [Google Scholar]
  45. Joseph, G.; Joseph, A.; Titus, G.; Thomas, R.M.; Jose, D. Photoplethysmogram (PPG) signal analysis and wavelet de-noising. In Proceedings of the 2014 Annual International Conference on Emerging Research Areas: Magnetics, Machines and Drives (AICERA/iCMMD), Kerala, India, 24–26 July 2014; pp. 1–5. [Google Scholar]
  46. Tang, S.K.D.; Goh, Y.Y.S.; Wong, M.L.D.; Lew, Y.L.E. PPG signal reconstruction using a combination of discrete wavelet transform and empirical mode decomposition. In Proceedings of the 2016 6th International Conference on Intelligent and Advanced Systems (ICIAS), Kuala Lumpur, Malaysia, 15–17 August 2016; pp. 1–4. [Google Scholar]
  47. Schafer, R.W. What is a Savitzky-Golay filter? [Lecture Notes]. IEEE Signal Process. Mag. 2011, 28, 111–117. [Google Scholar] [CrossRef]
  48. Lindberg, L.-G.; Ugnell, H.; Öberg, P. Monitoring of respiratory and heart rates using a fibre-optic sensor. Med. Biol. Eng. Comput. 1992, 30, 533–537. [Google Scholar] [CrossRef]
  49. Addison, P.S.; Watson, J.N. Secondary transform decoupling of shifted nonstationary signal modulation components: Application to photoplethysmography. Int. J. Wavelets Multiresolution Inf. Process. 2004, 2, 43–57. [Google Scholar] [CrossRef]
  50. Sobron, A.; Romero, I.; Lopetegi, T. Evaluation of methods for estimation of respiratory frequency from the ECG. In Proceedings of the 2010 Computing in Cardiology, Belfast, UK, 26–29 September 2010; pp. 513–516. [Google Scholar]
  51. Karlen, W.; Raman, S.; Ansermino, J.M.; Dumont, G.A. Multiparameter respiratory rate estimation from the photoplethysmogram. IEEE Trans. Biomed. Eng. 2013, 60, 1946–1953. [Google Scholar] [CrossRef]
  52. Lázaro, J. Non-Invasive Techniques for Respiratory Information Extraction Based on Pulse Photoplethysmogram and Electrocardiogram. Available online: https://zaguan.unizar.es/record/31895/files (accessed on 15 March 2025).
  53. Pimentel, M.A.F.; Charlton, P.H.; Clifton, D.A. Probabilistic estimation of respiratory rate from wearable sensors. In Wearable Electronics Sensors: For Safe and Healthy Living; Springer: Berlin/Heidelberg, Germany, 2016; pp. 241–262. Available online: https://link.springer.com/book/10.1007/978-3-319-18191-2 (accessed on 20 April 2025).
  54. Tamura, T.; Maeda, Y.; Sekine, M.; Yoshida, M. Wearable photoplethysmographic sensors—Past and present. Electronics 2014, 3, 282–302. [Google Scholar] [CrossRef]
  55. Allen, J. Photoplethysmography and its application in clinical physiological measurement. Physiol. Meas. 2007, 28, R1. [Google Scholar] [CrossRef]
  56. Nilsson, L.M. Respiration Signals from Photoplethysmography. Anesth. Analg. 2013, 117, 859–865. [Google Scholar] [CrossRef]
Figure 1. ECG processing workflow.
Sensors 25 05136 g001
Figure 2. QRS complex detection algorithm output. The colored points are referred to as Q-peak (blue), R-peak (pink), and S-peak (green), respectively.
Sensors 25 05136 g002
Figure 3. QRS complex detection algorithm output. The colored points are referred to as Q-peak (blue), R-peak (pink), and S-peak (green), respectively.
Sensors 25 05136 g003
Figure 4. Photoplethysmogram processing workflow.
Sensors 25 05136 g004
Figure 5. PPG peaks detection: colored points indicate maximum values (blue) and minimum values (red), respectively.
Sensors 25 05136 g005
Figure 6. Comparison of respiratory signals derived from different methods: (a) reference respiratory signal; (b) electrocardiogram-derived respiration (EDR) derived from R-peak; (c) EDR derived from area; (d) EDR derived from up-slope; (e) EDR derived from down-slope. The red circles represent the discrete data points obtained from the applied methods over time. The continuous line represents the EDR signal reconstructed using cubic spline interpolation based on these points. The signal is normalized and expressed in arbitrary units [V/V], with time shown in seconds [s].
Sensors 25 05136 g006aSensors 25 05136 g006b
Figure 7. (a,c) Reference respiratory signals are displayed; (b) the photoplethysmogram-derived respiration (PDR) with amplitude modulation (AM); (d) PDR from frequency modulation (FM). The red circles represent the discrete data points obtained from the applied methods over time. The continuous line represents the PDR signal reconstructed using cubic spline interpolation based on these points. The signal is normalized and expressed in arbitrary units [V/V], with time shown in seconds [s].
Sensors 25 05136 g007
Figure 8. iAMwell dataset. (a) Bland–Altman plot for the R-peak based on intra-subject analysis, showing agreement between the average derived and reference RRs; (b) bias computed on each subject (breaths/min). The red line indicates the zero-bias reference, while the orange line represents the mean bias.
Sensors 25 05136 g008
Figure 9. Capnobase dataset. (a) Bland–Altman plot for the R-peak based on intra-subject analysis, showing agreement between the average derived and reference RRs; (b) bias computed on each subject (breaths/min). The red line indicates the zero-bias reference, while the orange line represents the mean bias.
Sensors 25 05136 g009
Figure 10. iAMwell dataset. (a) Bland–Altman plot for the R-peak based on inter-subject analysis, showing agreement between the average derived and reference RRs; (b) bias computed on each window (breaths/min). The red line indicates the zero-bias reference, while the orange line represents the mean bias.
Sensors 25 05136 g010
Figure 11. Capnobasedataset. (a) Bland–Altman plot for the R-peak based on inter-subject analysis, showing agreement between the average derived and reference RRs; (b) bias computed on each window (breaths/min). The red line indicates the zero-bias reference, while the orange line represents the mean bias.
Sensors 25 05136 g011
Table 1. Performance metrics of ECG morphological characteristics and PPG with AM and FM techniques.
R-PeakQRS AreaUp-SlopeDown-SlopeFMAM
iAMwell dataset
MAE0.991.021.021.045.105.12
MAPE (%)9.459.789.649.9426.6527.17
RMSE2.752.862.832.686.106.11
ρ 0.700 *0.684 *0.672 *0.600 *<0.5<0.5
Capnobase dataset
MAE3.073.743.193.3213.9010.66
MAPE (%)27.3336.5029.3329.95136.77105.65
RMSE11.7113.4613.4112.90181.66181.66
ρ 0.642 *0.535 *0.497 *0.476 *<0.5<0.5
ECG = electrocardiogram; PPG = photoplethysmogram; AM = amplitude modulation; FM = frequency modulation; MAE = mean absolute error; MAPE = mean absolute percentage error; RMSE = root mean square error; ρ = Pearson correlation coefficient. * Statistically significant with p < 0.05.
Table 2. Intra-subject estimates for the iAMwell dataset. Comparison of estimated and reference RR within-subject. For each subject, the mean ± standard deviation of RR (breaths/min) estimates is reported along with the corresponding p-values assessing temporal variation.
ReferenceR-PeakQRS AreaUp-SlopeDown-SlopeFMAM
Patient Mean ± SD Mean ± SD p-Value Mean ± SD p-Value Mean ± SD p-Value Mean ± SD p-Value Mean ± SD p-Value Mean ± SD p-Value
Subject 1 21.47 ± 3.07 21.33 ± 4.25 0.719 20.80 ± 4.77 0.093 20.93 ± 4.46 0.087 21.33 ± 4.32 0.698 21.20 ± 3.98 0.703 23.46 ± 3.51 0.105
Subject 2 24.27 ± 2.37 23.73 ± 1.98 0.366 23.60 ± 2.03 0.272 23.73 ± 2.25 0.305 22.87 ± 2.25 0.417 20.53 ± 3.58 0.006 * 22.67 ± 2.89 0.145
Subject 3 20.93 ± 3.70 18.93 ± 3.69 0.011 * 18.93 ± 3.69 0.011 * 18.93 ± 3.69 0.011 * 19.07 ± 3.37 0.008 * 20.80 ± 4.87 0.850 22.53 ± 4.30 0.257
Subject 4 17.73 ± 1.98 17.47 ± 2.44 0.546 16.93 ± 2.37 0.083 17.20 ± 2.24 0.206 17.73 ± 1.98 0.454 22.00 ± 4.84 0.018 * 23.87 ± 5.73 0.004 *
Subject 5 18.40 ± 2.03 18.27 ± 2.82 0.774 18.13 ± 2.88 0.527 18.00 ± 2.93 0.408 18.40 ± 2.03 0.317 20.53 ± 5.63 0.205 22.40 ± 5.51 0.019 *
Subject 6 18.40 ± 3.04 16.93 ± 3.11 0.041 * 17.07 ± 3.01 0.150 17.20 ± 3.45 0.098 16.93 ± 2.49 0.027 * 30.93 ± 4.20 0.062 23.87 ± 5.26 0.007 *
Subject 7 22.00 ± 2.73 20.80 ± 2.58 0.146 20.53 ± 2.56 0.098 20.13 ± 2.33 0.045 * 19.60 ± 2.41 0.011 * 18.40 ± 3.79 0.011 * 22.13 ± 4.86 0.937
Subject 8 18.67 ± 2.69 16.53 ± 1.41 0.007 * 16.67 ± 1.80 0.011 * 16.27 ± 2.49 0.018 * 16.27 ± 2.49 0.014 * 20.40 ± 5.13 0.194 22.80 ± 5.64 0.022 *
Subject 9 20.53 ± 2.67 18.53 ± 2.77 0.497 18.13 ± . 20 0.398 18.67 ± 2.23 0.485 17.87 ± 2.45 0.365 20.26 ± 3.85 0.937 22.53 ± 4.87 0.138
Subject 10 19.67 ± 1.84 20.00 ± 1.85 0.882 19.33 ± 1.45 0.719 19.33 ± 2.09 0.756 19.20 ± 1.90 0.426 21.61 ± 4.22 0.081 23.87 ± 4.81 0.025 *
Subject 11 19.73 ± 3.11 19.32 ± 2.89 0.726 18.93 ± 2.91 0.654 19.33 ± 2.99 0.687 18.93 ± 2.25 0.654 25.73 ± 3.01 0.002 * 22.67 ± 3.59 0.045 *
Subject 12 22.27 ± 4.77 21.07 ± 2.92 0.446 20.13 ± 2.77 0.055 19.87 ± 2.45 0.070 20.67 ± 3.35 0.062 26.13 ± 3.33 0.031 * 24.40 ± 3.13 0.063
Subject 13 21.73 ± 2.60 19.87 ± 2.97 0.029 * 20.40 ± 3.14 0.093 20.27 ± 3.82 0.070 20.27 ± 3.20 0.084 26.41 ± 3.14 0.004 * 26.27 ± 3.79 0.008 *
Subject 14 18.00 ± 3.12 18.00 ± 3.55 0.951 17.87 ± 3.42 0.856 18.13 ± 4.10 0.884 18.27 ± 3.28 0.786 26.93 ± 3.69 0.001 * 25.73 ± 3.53 0.001 *
Subject 15 21.87 ± 3.42 22.40 ± 3.20 0.671 22.62 ± 3.40 0.595 22.77 ± 3.00 0.399 22.97 ± 3.01 0.476 25.86 ± 3.50 0.043 * 26.13 ± 3.96 0.040 *
Mean ± SD = media ± standard deviation; * Statistical significance at 0.05.
Table 3. Intra-subject estimates for the Capnobase dataset. Comparison of estimated and reference RR within-subject. For each subject, the mean ± standard deviation of RR (breaths/min) estimates is reported along with the corresponding p-values assessing temporal variation.
ReferenceR-PeakQRS AreaUp-SlopeDown-SlopeFMAM
Patient Mean ± SD Mean ± SD p Mean ± SD p Mean ± SD p Mean ± SD p Mean ± SD p Mean ± SD p
Subject 120.53 ± 5.1520.93 ± 3.450.49722.13 ± 3.160.16521.20 ± 3.450.47221.73 ± 3.010.17032.67 ± 12.250.001 *27.20 ± 12.350.068
Subject 221.07 ± 5.2821.33 ± 3.520.61122.80 ± 2.240.20621.07 ± 3.200.65120.93 ± 3.690.88732.13 ± 11.450.001 *28.13 ± 9.870.005 *
Subject 319.87 ± 4.4420.40 ± 3.560.59523.07 ± 3.200.016 *20.93 ± 3.530.25320.67 ± 3.440.43635.20 ± 15.060.001 *29.73 ± 13.670.005 *
Subject 421.73 ± 4.5619.73 ± 3.990.17821.60 ± 3.870.65520.00 ± 4.960.38319.73 ± 4.830.26535.47 ± 14.550.003 *30.53 ± 13.640.038 *
Subject 522.53 ± 6.2920.80 ± 4.390.08521.60 ± 3.870.72622.93 ± 3.100.44921.47 ± 4.030.44537.33 ± 14.900.001 *30.40 ± 14.270.027 *
Subject 622.40 ± 6.2120.67 ± 4.760.25522.27 ± 3.450.97520.80 ± 4.390.38420.53 ± 4.440.21834.53 ± 13.320.002 *28.93 ± 12.960.059
Subject 722.53 ± 5.1421.73 ± 4.530.71923.73 ± 3.010.27721.73 ± 4.330.27721.60 ± 3.940.69137.47 ± 15.010.001 *31.07 ± 14.080.032 *
Subject 823.60 ± 6.0222.67 ± 4.050.43722.80 ± 3.100.47222.40 ± 4.420.20122.00 ± 4.000.13637.07 ± 15.750.002 *31.87 ± 15.110.047 *
Subject 923.47 ± 5.8021.87 ± 4.690.40022.67 ± 3.900.63622.00 ± 4.660.37122.27 ± 4.460.47435.20 ± 12.350.003 *31.07 ± 13.410.042 *
Subject 1020.93 ± 5.4821.33 ± 2.890.59121.87 ± 2.770.24521.20 ± 2.910.79720.93 ± 3.010.78633.47 ± 12.110.001 *27.60 ± 11.440.043 *
Subject 1124.13 ± 6.0121.47 ± 4.440.07021.60 ± 3.140.06520.80 ± 4.830.035 *21.33 ± 4.510.09636.27 ± 13.220.003 *32.53 ± 14.860.049 *
Subject 1223.60 ± 5.1820.13 ± 5.260.011 *20.80 ± 3.760.12421.07 ± 4.950.022 *20.53 ± 5.320.036 *36.27 ± 15.100.005 *32.27 ± 15.910.042 *
Subject 1321.73 ± 5.7421.07 ± 4.270.82122.67 ± 2.350.41021.33 ± 4.450.75320.80 ± 4.330.55037.73 ± 15.130.001 *33.33 ± 15.490.014 *
Subject 1422.67 ± 5.6820.93 ± 4.530.41022.13 ± 3.340.89221.20 ± 4.130.32120.93 ± 4.460.37236.80 ± 13.750.002 *33.33 ± 15.320.022 *
Subject 1522.53 ± 6.1520.80 ± 3.360.41021.87 ± 2.770.42321.07 ± 3.280.29020.40 ± 2.850.12437.47 ± 12.590.001 *33.20 ± 13.390.011 *
Subject 1622.40 ± 5.0120.53 ± 4.500.57022.53 ± 3.500.41921.47 ± 4.870.72020.27 ± 4.130.08535.60 ± 13.650.001 *30.93 ± 15.360.044 *
Subject 1722.00 ± 5.0121.07 ± 5.180.55722.13 ± 3.250.41921.87 ± 4.310.72021.33 ± 4.190.08537.60 ± 13.420.001 *30.40 ± 14.990.019 *
Subject 1822.40 ± 5.7220.67 ± 4.390.09521.73 ± 3.770.77120.93 ± 4.650.13321.07 ± 4.130.34735.33 ± 15.710.004 *30.27 ± 15.800.043 *
Subject 1921.75 ± 5.2122.20 ± 4.750.07821.73 ± 3.770.77120.93 ± 4.650.13321.07 ± 4.130.34735.33 ± 15.710.004 *30.27 ± 15.800.043 *
Mean ± SD = media ± standard deviation; * Statistical significance at 0.05.
Table 4. Inter-subject estimates for the iAMwell dataset. Comparison of estimated and reference RR between subjects. For each subject, the mean ± standard deviation of RR (breaths/min) estimates is reported along with the corresponding p-values assessing temporal variation.
ReferenceR-PeakQRS AreaUp-SlopeDown-SlopeFMAM
Window Mean ± SD Mean ± SD p-Value Mean ± SD p-Value Mean ± SD p-Value Mean ± SD p-Value Mean ± SD p-Value Mean ± SD p-Value
Window 1 20.00 ± 2.94 19.00 ± 3.40 0.614 19.43 ± 3.27 0.350 19.29 ± 3.38 0.185 19.29 ± 3.73 0.233 25.20 ± 3.61 0.002 * 27.73 ± 2.72 0.001 *
Window 2 19.60 ± 3.22 19.70 ± 3.40 0.415 19.07 ± 3.28 0.635 18.67 ± 2.89 0.654 19.20 ± 3.36 0.521 23.87 ± 2.97 0.467 22.40 ± 3.79 0.099
Window 3 19.73 ± 3.01 18.67 ± 3.60 0.132 18.67 ± 3.60 0.043 * 18.13 ± 3.89 0.046 * 18.53 ± 3.58 0.021 * 24.13 ± 6.02 0.023 * 24.67 ± 3.83 0.007 *
Window 4 19.47 ± 3.07 18.27 ± 3.20 0.754 17.87 ± 3.25 0.107 18.27 ± 3.20 0.010 * 17.73 ± 2.81 0.010 * 20.93 ± 5.55 0.046 * 20.13 ± 4.03 0.022 *
Window 5 19.20 ± 2.24 18.67 ± 3.35 0.771 18.00 ± 3.21 0.047 * 17.87 ± 2.67 0.026 * 18.53 ± 3.60 0.340 19.87 ± 4.44 0.160 20.53 ± 3.81 0.026 *
Window 6 19.57 ± 3.16 18.86 ± 2.57 0.238 18.71 ± 2.55 0.230 19.14 ± 2.57 0.546 18.43 ± 2.50 0.201 28.00 ± 3.12 0.001 * 31.33 ± 4.11 0.001 *
Window 7 19.71 ± 2.58 19.60 ± 4.22 0.218 19.60 ± 4.29 0.301 19.33 ± 4.25 0.365 19.60 ± 3.94 0.342 23.60 ± 2.64 0.164 24.67 ± 3.97 0.069
Window 8 20.27 ± 3.61 18.80 ± 3.61 0.088 18.93 ± 3.37 0.102 18.80 ± 3.69 0.093 18.67 ± 3.35 0.078 20.27 ± 2.60 0.111 22.40 ± 2.64 0.007 *
Window 9 19.43 ± 3.96 18.40 ± 3.48 0.465 18.43 ± 3.34 0.421 18.40 ± 3.64 0.463 18.13 ± 3.50 0.078 22.93 ± 5.75 0.089 23.87 ± 3.74 0.005 *
Window 10 19.47 ± 4.10 18.67 ± 3.90 0.881 18.00 ± 3.81 0.077 18.13 ± 3.58 0.089 18.23 ± 3.81 0.075 20.67 ± 4.93 0.369 21.33 ± 3.67 0.086
Window 11 19.60 ± 3.31 19.47 ± 3.66 0.473 19.47 ± 3.16 0.475 19.20 ± 3.10 0.387 19.07 ± 3.01 0.286 23.33 ± 2.46 0.004 * 25.07 ± 2.49 0.002 *
Window 12 21.73 ± 3.01 20.40 ± 3.22 0.235 20.40 ± 3.04 0.201 20.13 ± 3.50 0.352 19.87 ± 3.16 0.038 * 20.93 ± 5.16 0.164 24.00 ± 3.21 0.025 *
Window 13 22.27 ± 3.61 21.07 ± 1.98 0.216 21.33 ± 2.96 0.281 21.07 ± 2.71 0.213 21.33 ± 2.99 0.212 19.33 ± 6.35 0.043 * 20.40 ± 5.19 0.025 *
Window 14 22.80 ± 3.99 21.60 ± 3.56 0.546 20.80 ± 3.61 0.045 * 21.45 ± 3.74 0.410 21.47 ± 3.66 0.421 24.00 ± 2.82 0.042 * 24.27 ± 2.91 0.039 *
Window 15 22.80 ± 3.99 22.00 ± 2.73 0.498 21.60 ± 2.53 0.081 21.47 ± 3.16 0.075 21.60 ± 2.53 0.082 20.67 ± 4.26 0.042 * 22.53 ± 2.97 0.687
Mean ± SD = media ± standard deviation; * Statistical significance at 0.05.
Table 5. Inter-subject estimates for the Capnobase dataset. Comparison of estimated and reference RR between subjects. For each subject, the mean ± standard deviation of RR (breaths/min) estimates is reported along with the corresponding p-values assessing temporal variation.
ReferenceR-PeakQRS AreaUp-SlopeDown-SlopeFMAM
Window Mean ± SD Mean ± SD p-Value Mean ± SD p-Value Mean ± SD p-Value Mean ± SD p-Value Mean ± SD p-Value Mean ± SD p-Value
Window 120.78 ± 3.5120.67 ± 4.000.65522.89 ± 2.590.003 *20.67 ± 4.000.65520.56 ± 3.680.31734.56 ± 4.160.001 *27.11 ± 3.230.001
Window 226.33 ± 2.8526.22 ± 2.730.70526.22 ± 3.060.80326.33 ± 2.590.98726.44 ± 2.960.73939.22 ± 5.280.001 *23.11 ± 3.010.001 *
Window 322.67 ± 1.8122.00 ± 1.680.16321.89 ± 1.750.21621.89 ± 2.110.21822.11 ± 2.110.44926.67 ± 3.220.001 *21.89 ± 4.420.398
Window 422.22 ± 1.9320.89 ± 2.190.017 *21.56 ± 2.430.44220.78 ± 2.490.035 *21.22 ± 2.490.13627.67 ± 3.160.001 *27.11 ± 3.080.001 *
Window 527.00 ± 4.4125.67 ± 5.190.15825.00 ± 5.140.049 *25.56 ± 5.110.08624.33 ± 5.580.010 *42.89 ± 7.800.001 *35.33 ± 4.120.001
Window 618.89 ± 3.8920.67 ± 2.570.10922.44 ± 1.890.010 *21.22 ± 2.840.037 *21.11 ± 2.490.023 *22.56 ± 3.200.008 *22.67 ± 2.910.003 *
Window 723.67 ± 2.5023.33 ± 2.170.71623.11 ± 1.410.27223.89 ± 1.450.76222.33 ± 1.970.05129.44 ± 7.940.012 *22.11 ± 3.660.138
Window 821.11 ± 3.1621.67 ± 2.930.13222.11 ± 3.180.020 *21.67 ± 3.160.13221.56 ± 3.110.24832.78 ± 7.230.001 *21.00 ± 3.450.808
Window 930.22 ± 7.2922.11 ± 3.320.002 *21.67 ± 2.500.001 *22.44 ± 3.180.001 *21.56 ± 1.760.001 *37.22 ± 5.660.008 *30.89 ± 5.950.532
Window 1025.89 ± 3.8516.22 ± 3.280.001 *20.56 ± 3.200.002 *15.89 ± 2.950.001 *16.11 ± 3.600.001 *54.00 ± 10.740.001 *57.89 ± 10.210.001 *
Window 1122.11 ± 4.3619.33 ± 2.990.019 *20.11 ± 2.320.07120.00 ± 2.910.028 *19.44 ± 2.810.010 *42.00 ± 12.140.001 *39.00 ± 13.320.001 *
Window 1215.22 ± 1.2217.11 ± 2.300.013 *21.11 ± 2.760.001 *18.44 ± 2.960.003 *18.44 ± 2.530.002 *22.11 ± 2.110.001 *16.11 ± 5.160.473
Window 1316.56 ± 2.9716.78 ± 1.700.63320.00 ± 2.470.009 *17.11 ± 2.190.45917.22 ± 2.490.40340.11 ± 20.170.001 *39.00 ± 16.880.001 *
Window 1422.44 ± 5.4723.22 ± 4.560.35723.78 ± 2.730.17222.89 ± 4.400.47522.44 ± 5.250.79535.44 ± 16.660.049 *32.78 ± 14.180.403
Window 1518.33 ± 2.9319.22 ± 2.490.35122.00 ± 2.830.00520.11 ± 3.030.11320.56 ± 2.640.04149.67 ± 19.960.001 *44.67 ± 16.120.001 *
Mean ± SD = media ± standard deviation; * Statistical significance at 0.05.
Table 6. Bland–Altman analysis: bias and limit of agreement (in breaths/min) for each method across the two datasets.
MethodR-PeakQRS AreaUp-SlopeDown-SlopeFMAM
iAMwell (Intra-subject)
Bias−0.97−0.95−1.02−1.072.493.66
Lower Limit−2.62−2.76−2.91−3.21−5.71−1.34
Upper Limit0.950.680.921.1711.327.69
Capnobase (Intra-subject)
Bias−1.160.11−1.00−1.1613.458.52
Lower Limit−3.37−2.80−3.07−3.3610.725.74
Upper Limit1.102.791.281.0116.3411.23
iAMwell (Inter-subject)
Bias−0.84−0.95−1.02−1.072.743.31
Lower Limit−1.76−2.05−1.92−2.05−3.78−3.34
Upper Limit0.200.10−0.250.108.069.96
Capnobase (Inter-subject)
Bias−1.220.07−0.97−1.2019.838.48
Lower Limit−7.91−7.17−7.91−8.37−4.35−13.10
Upper Limit5.357.305.975.9730.7529.87
Disclaimer/Publisher’s Note: The statements, opinions and data contained in all publications are solely those of the individual author(s) and contributor(s) and not of MDPI and/or the editor(s). MDPI and/or the editor(s) disclaim responsibility for any injury to people or property resulting from any ideas, methods, instructions or products referred to in the content.