Article

A Novel Method for Localizing PD Source in Power Transformer: Considering NLOS Propagation of Electromagnetic Waves

1
State Grid Shandong Electric Power Research Institute, Jinan 250003, China
2
School of Electrical Engineering and Automation, Wuhan University, Wuhan 430072, China
*
Author to whom correspondence should be addressed.
Sensors 2025, 25(16), 5099; https://doi.org/10.3390/s25165099 (registering DOI)
Submission received: 8 July 2025 / Revised: 27 July 2025 / Accepted: 6 August 2025 / Published: 16 August 2025
(This article belongs to the Section Electronic Sensors)

Abstract

A novel partial discharge (PD) source localization method was proposed based on the traditional time difference in arrival (TDOA) method. Specifically, the non-line-of-sight (NLOS) propagation phenomenon of the ultra-high-frequency (UHF) signal was considered, and the NLOS propagation error was approximately replaced by a constant, thereby limiting the effect of NLOS propagation. Moreover, the strategy of utilizing more than four sensors was adopted to reduce the possible effect of overcorrection on NLOS propagation. In this paper, the derivation and implementation process of the proposed method is introduced from the perspectives of mathematical model and geometrical model, and its localization results were compared with the traditional TDOA method through an experimental study. The results showed that the speed of error increase of the traditional method presented faster, and the increment of sensor number helped to improve the localization accuracy, but the reduction in localization error becomes insignificant when the sensors exceed six. Finally, the experimental verifications were conducted based on a 35 kV testing transformer with six sensor installations. The experiments found that the proposed localization method had a better calculated accuracy and stability; the obtained minimum calculated error was 10.88 cm, the calculated accuracy can be improved by 82.04% and 78.94%, respectively, with six sensors than four and five sensors arrangement.

1. Introduction

As one of the most crucial equipment in the power system, the insulation reliability of large power transformers is related to the safe and stable operation of the transformer itself and even the whole power system [1,2]. During long-term operation, power transformers often experience insulation damage due to partial discharge (PD), which can ultimately lead to insulation degradation or even failure. However, PD characteristics can serve as indicators of insulation condition and are commonly employed for insulation detection and condition diagnosis purposes [3,4]. The ultra-high frequency (UHF) method is widely used in PD detection due to its advantages of high sensitivity, strong anti-interference ability, and non-contact measurement [5,6]. Moreover, the target signal detected by the UHF method is the electromagnetic wave generated by partial discharge, and the propagation characteristics of electromagnetic waves will change due to their location in power equipment; thus, the UHF method can also be used for localizing the position of the partial discharge source [7].
The time difference in arrival (TDOA) method has emerged as a prominent method for locating UHF PD sources due to its high accuracy and simple principle [8,9]. This method assumes that the electromagnetic wave propagates along a straight line, and four UHF sensors are used to collect the PD signals at the same time. Afterwards, the signal acquired by one of the sensors is taken as the reference, and the time delay between the remaining three signals and the reference signal can be calculated. Finally, the 3D spatial coordinates of the PD source position can be obtained by solving the hyperbolic localization equations [10,11].
It can be seen that the conventional TDOA method presents relatively high accuracy in locating PD sources in GIS. However, when it is applied to large power transformers, due to the existence of the core, windings, and other structures will block the electromagnetic wave signals so that they cannot be propagated along a straight line [12]; the TDOA localization results will be a great deviation, or even positioning failure.
The TDOA method has been widely recognized for its accuracy in localizing PD sources in equipment like GIS with simple internal structures [13]. However, it still faces difficulties when applied to large power transformers due to the existence of complex inter-elements such as the core and windings. These elements obstruct the straight-line propagation of electromagnetic waves, leading to the so-called non-line-of-sight (NLOS) propagation phenomenon of the signal, which may cause significant deviations in the localization results or even localization failures. Du et al. investigated the impact of the iron core and winding on the propagation time of electromagnetic wave signals in a 110 kV real transformer. The results demonstrated that the measured propagation time was much larger than the straight-line propagation time when the PD source and the UHF detection antenna were separated by the presence of an iron core and winding, and the error can be up to more than 5 ns [14]. In response to the problem of low positioning accuracy caused by the NLOS propagation of the ultrasonic signals, Jia et al. proposed a PD source localization method for transformers under the condition of complex multipath signal propagation, which provided a solution to the localization problem of electromagnetic wave signals in NLOS propagation scenarios [15]. However, due to the propagation of electromagnetic wave signals being more than five orders of magnitude faster than that of ultrasonic signals, resulting in a smaller time delay, the impact of the NLOS propagation phenomenon on localization accuracy should become more severe.
Currently, no effective strategy exists to address the issue of diminished location accuracy caused by NLOS propagation of electromagnetic waves. Therefore, this paper proposes a method for localizing the PD source position in transformers while considering NLOS propagation effects. Firstly, a mathematical model was constructed to correct the positioning deviation caused by NLOS propagation, and an analysis of the geometric framework underlying the model was conducted. In addition, the strategy of utilizing more than four UHF sensors was proposed to enhance localization accuracy. Finally, the feasibility and efficacy of the proposed method were verified through both lab and on-site experiments.

2. Localization Model of Transformer Partial Discharge Source

2.1. Mathematical Model

A three-dimensional coordinate system is established with one corner of the transformer serving as the spatial origin, as shown in Figure 1. Here, the power transformer is simplified as a rectangular box. P represents the PD source, while S denotes UHF sensors installed around the transformer.
The three-dimensional spatial coordinates of P and each UHF sensor Si are expressed as P (xP, yP, zP) and Si (xi, yi, zi) (i = 1, 2, …, N), respectively. The distance along which the electromagnetic wave propagates from P to Si can be represented by the following equation:
r i = c t i = d i + b i + n i
Here, ri represents the actual distance for the electromagnetic wave signal propagating from P to Si. c denotes the speed of the electromagnetic wave propagation, and ti indicates the time for the electromagnetic signal to travel from P to Si. Sensor 1 is established as the reference sensor. For N sensors, Sensor 1 is established as the reference sensor, and t1 is the propagation time for the electromagnetic wave signal from P to S1. Therefore, the propagation time ti for the sensor Si can be expressed in terms of t1 and the signal time delay Δt1i:
t i = t 1 + Δ t 1 i
Based on (1), ri can be represented by three components: di, bi, and ni. Where di denotes the straight line distance from P to Si, and can be expressed as follows:
d i = ( x i x P ) 2 + ( y i y P ) 2 + ( z i z P ) 2
In addition, bi represents the propagation distance error induced by NLOS phenomena such as reflection, refraction, and diffraction of electromagnetic wave signals. When the electromagnetic wave signals undergo NLOS propagation inside the transformer, the propagation path is correspondingly elongated. Consequently, this error component manifests as a positive deviation, that is, bi ≥ 0.
Here, bi denotes the measurement error due to Gaussian random noise, and it is generally considered that ni obeys a Gaussian distribution with a mean of zero and a variance of σ2 [16]. Therefore, the problem of localizing the coordinates of the PD source can be reformulated as the following Maximum Likelihood Estimation (MLE) problem:
arg   min x P , y P , z P i = 1 N ( r i d i b i ) 2 σ 2
It can be seen that, if bi is known, the (4) possesses a unique solution. However, the specific propagation path of the electromagnetic wave signal inside the transformer is unknown, and the distribution of bi cannot be obtained. If bi = ridi, (4) can have an infinite number of solutions. In order to make the problem solvable, a constant b ^ is used here to approximate bi instead, thereby (4) is transformed into
arg   min x P , y P , z P i = 1 N ( r i d i b ^ ) 2 σ 2
The method of employing a constant b ^ as an approximation for bi will inevitably result in a decrease in localization accuracy, where the value of b ^ exerts a direct influence on this accuracy. Selecting a suitable value of b ^ is the critical point to actualize the PD source localization. To quantitatively evaluate the substitution effect of b ^ value, the approximation error ρ is defined as follows:
ρ = [ i = 1 N ( r i d i b i ) 2 σ 2 i = 1 N ( r i d i b ^ ) 2 σ 2 ] 2
In general, the NLOS propagation error has a much more serious effect on the localization results compared to the Gaussian random error, i.e., bi >> ni, then (6) can be expressed as
ρ [ i = 1 N ( b i b ^ ) 2 σ 2 ] 2
A smaller ρ implies that the chosen value of b ^ provides a more effective approximation, thereby minimizing the decline in localization accuracy. The optimal value of b ^ is attained when (7) equals zero, that is,
b ^ = arg min [ i = 1 N ( b i b ^ ) 2 σ 2 ] 2     = arg min i = 1 N ( b i b ^ ) 2 σ 2     = i = 1 N b i N
However, since the distribution of bi is unknown, it is still hard to ascertain the optimal value of b ^ . Nevertheless, given that ri = di + bi + ni > bi, the upper bound of b ^ can be presented as
b ^ < i = 1 N r i N
Note that a certain geometrical relationship should also be satisfied between the sensors Si, Sj, and the PD source:
c ( t 1 + Δ t 1 i ) + c ( t 1 + Δ t 1 j ) = r i + r j d i + d j d i j
Substituting (2), (3), (9), and (10) as constraints into (5), the problem of localizing the PD source can be rewritten as
arg   min t 1 , x P , y P , z P , b ^ i = 1 N ( r i d i b ^ ) 2 σ 2 s . t .   r i = c ( t 1 + Δ t i 1 )         d i = ( x i x P ) 2 + ( y i y P ) 2 + ( z i z P ) 2         b ^ < i = 1 N r i N         c ( t 1 + Δ t 1 i ) + c ( t 1 + Δ t 1 j ) = r i + r j d i + d j d i j
As seen, (11) is an objective function to describe the nonlinear optimization problem, and in order to transform it into an unconstrained optimization problem, an external penalty function [17] is added to the objective function (11) here. The constraints involving t1 and b ^ are integrated into the original objective function, substantially increasing the value of the objective function for points that do not satisfy Equations (9) and (10), while leaving the objective function value unchanged for points that do satisfy these equations. Thus, (11) is reformulated as
min ( x s , y s , z s ) , b ^ , t 1 i = 1 N ( r i d i b ^ ) 2 σ 2 + M × [ max ( 0 , β ^ i = 1 N r i N ) + i j max ( 0 , d i j c ( Δ t 1 i + Δ 1 j ) 2 c t 1 ) ] s . t . d i = ( x s x i ) 2 + ( y s x i ) 2 + ( z s z i ) 2

2.2. Geometrical Model

Based on the mathematical form of localization equations, it needs at least four sensors to localize the PD source P within the three-dimensional space.
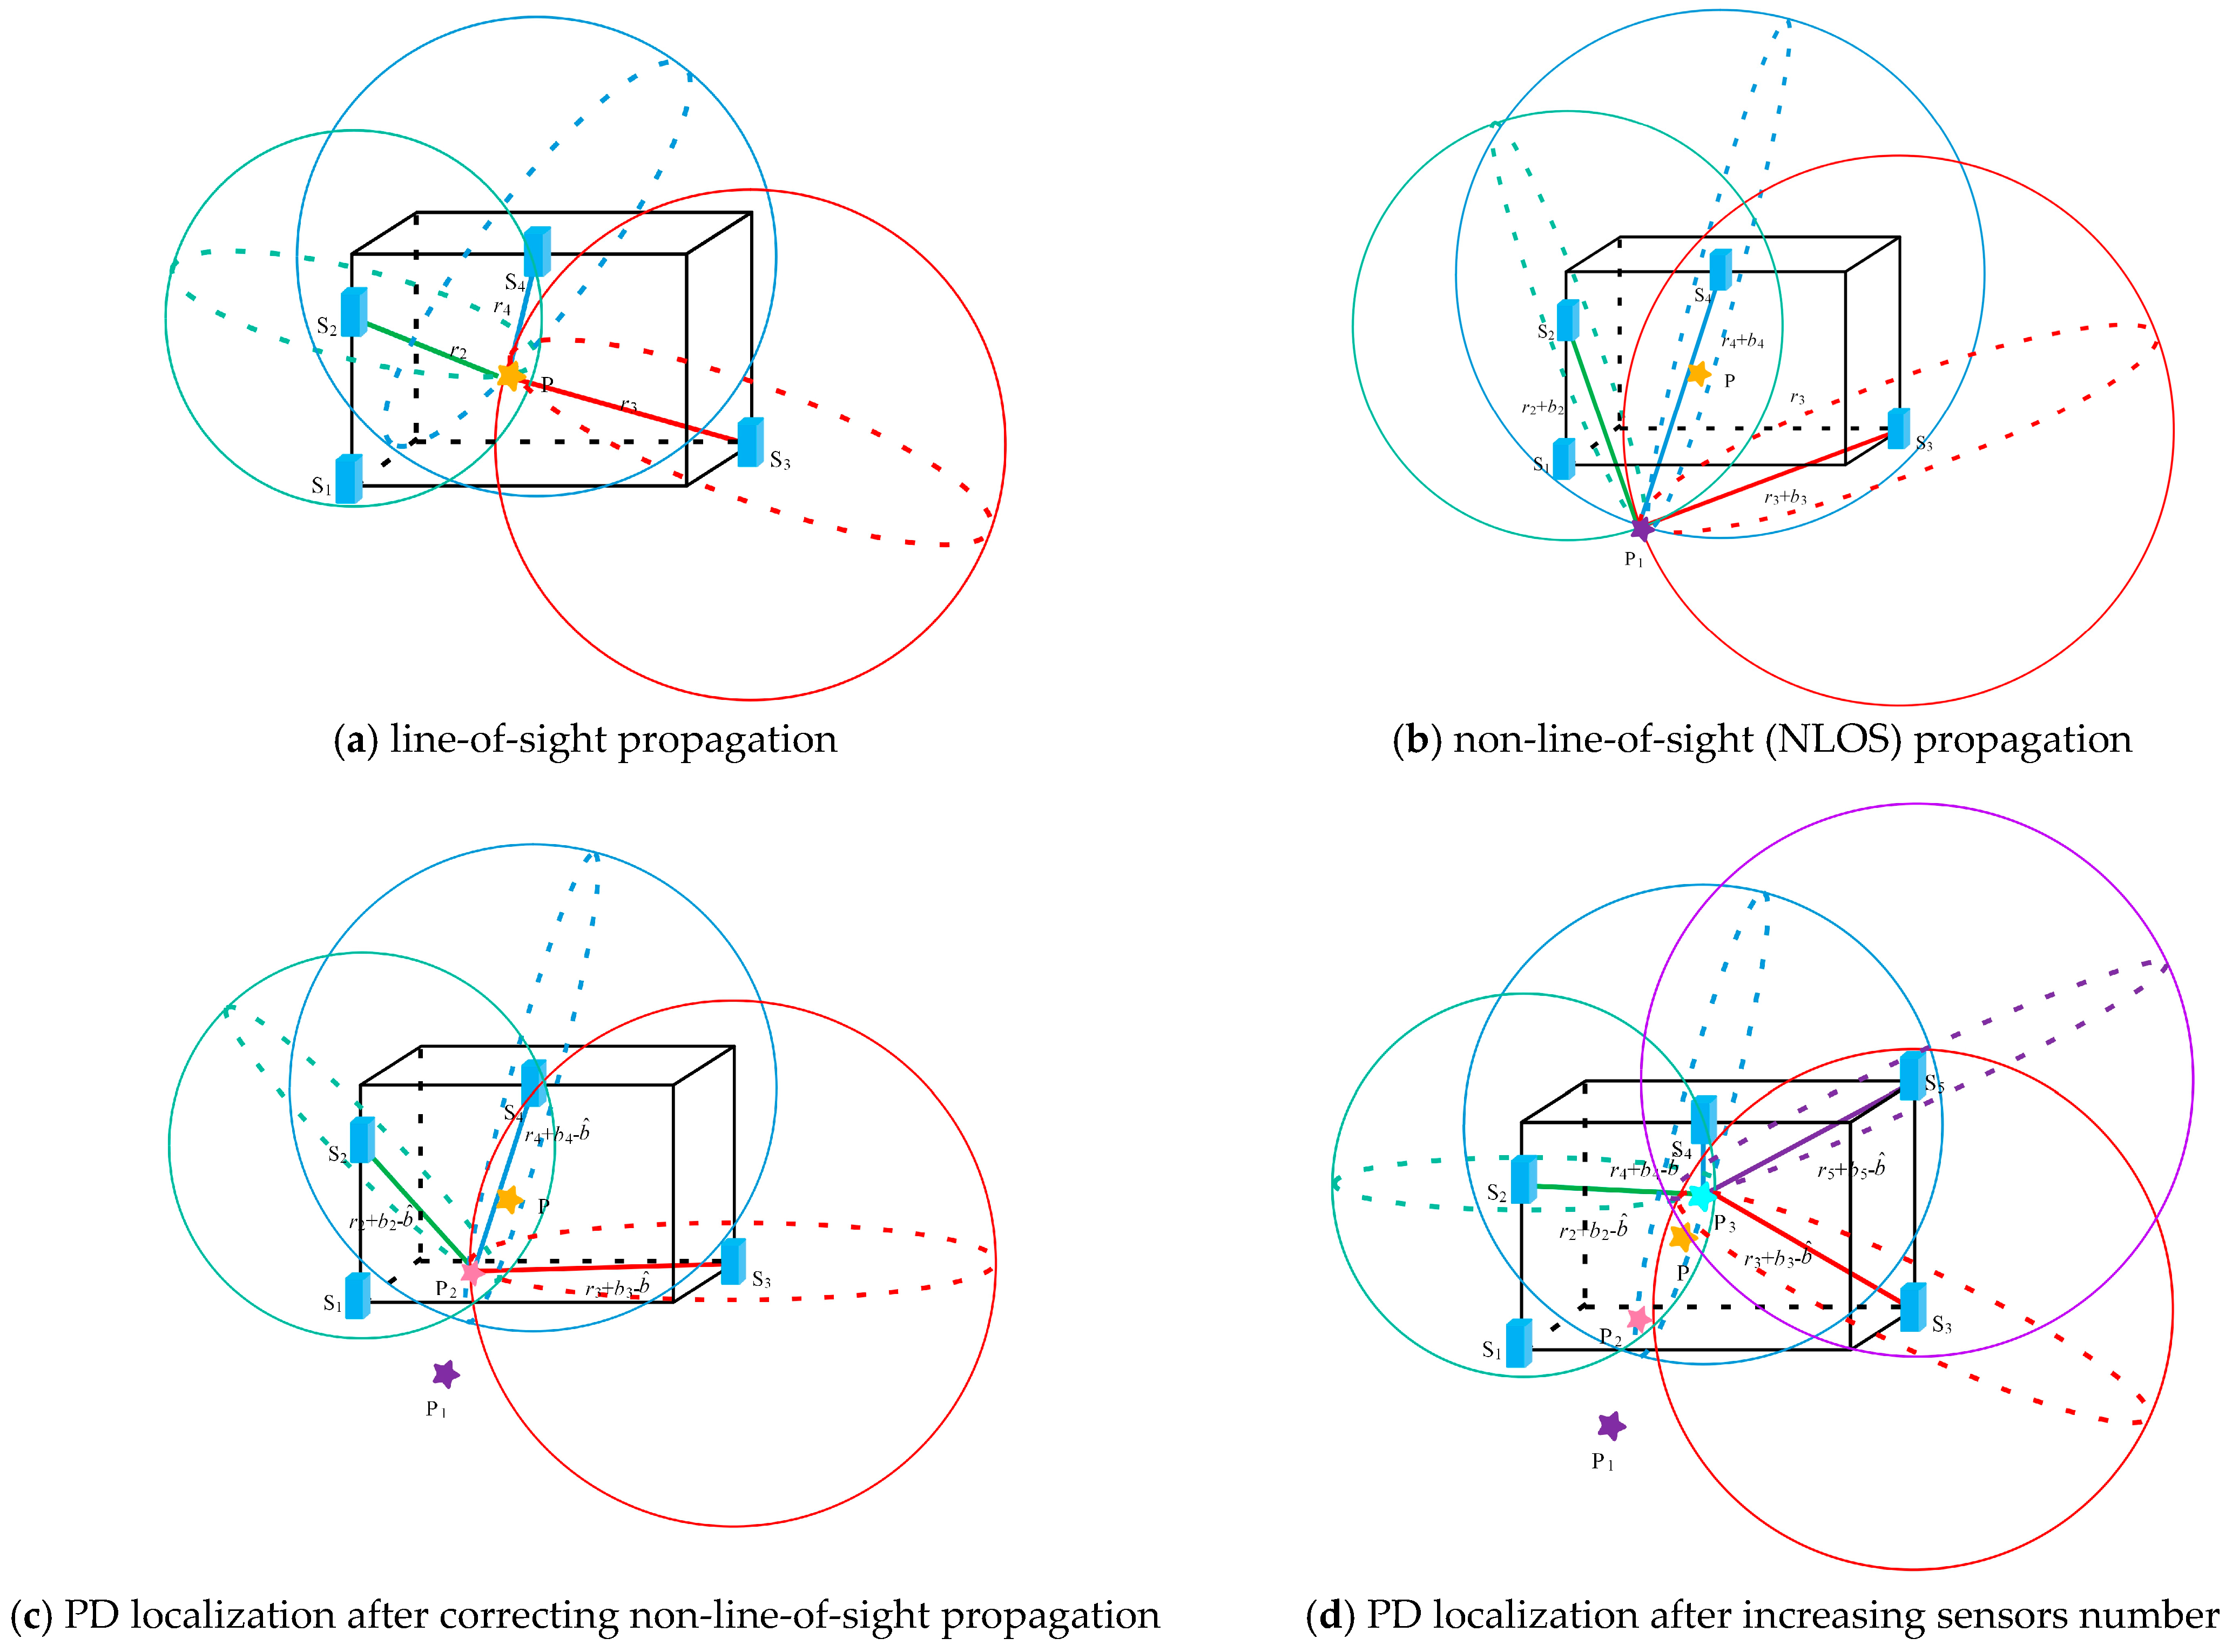
Taking four sensors as an example, if S1 is the reference sensor, its time delays between sensors S2, S3, and S4 are Δt12, Δt13, and Δt14 respectively. are the time delays. Then the radii rd2, rd3, and rd4 of the localization circle are determined by combining the propagation time t1 for the electromagnetic wave signal to travel from P to S1. When there is no measuring error in Δt12, Δt13, and Δt14, the localization circles will intersect at the actual position of the PD source, as illustrated in Figure 2a.
However, the distance errors b2, b3, and b4 introduced by NLOS propagation will increase the length of rd2, rd3, and rd4. As a consequence, the intersection point of the localization circles will not coincide with the actual position of the PD source, and may even fall outside the transformer, leading to localization failure, as shown in Figure 2b. And it should be noted that it is hard to correct the propagation path of electromagnetic wave signals by gradually reducing the localization circle radius when b2, b3, and b4 are unknown.
Based on Equation (5), if a constant b ^ is used to substitute for b2, b3, and b4, the radius of each localization circle would be reduced by an equal amount, which leads to a decrease in localization accuracy. According to (12), the value of b ^ is calculated, and its minimum is attained where the sum of the squared distances to each localization circle is the smallest, as illustrated in Figure 2c.
Moreover, it can be seen from (9) that b ^ only has an upper limit, so when the number of sensors is small, the radius reduction range of the localization circle will become large, which may result in an overcorrection on NLOS propagation errors. Thus, to further improve the localization accuracy, the strategy of increasing the number of sensors should be adopted. It is because the increased number of sensors can narrow the range of b ^ , suppressing the overcorrection of errors introduced by NLOS propagation, as shown in Figure 2d.

2.3. Localization Process of PD Source

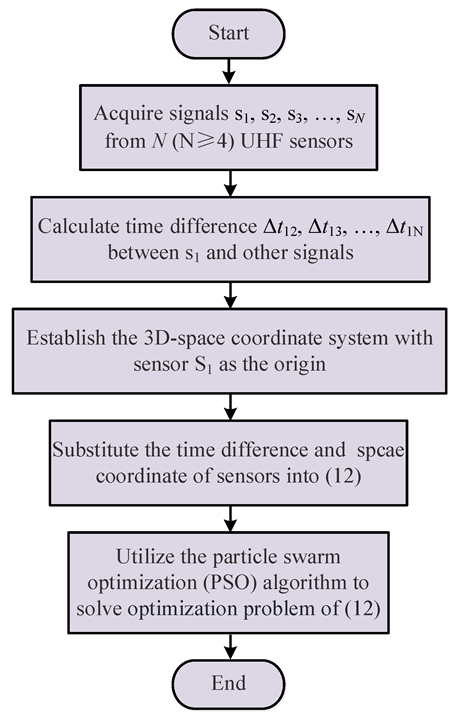
The localization process of PD source is shown in Figure 3, and the detailed description are as follows:
(1) The N (N ≥ 4) UHF sensors S1, S2, S3, …, SN, placed in random positions around the PD source, are utilized to simultaneously collect PD signals s1, s2, s3, …, sN.
(2) Taking s1 as the reference signal, the signal time difference Δt12, Δt13, …, Δt1N between s1 and s2, s3, …, sN are calculated, respectively, by the energy accumulation method [18], and the calculated results are then substituted into (12).
(3) Taking the sensor S1 as the origin, a 3D spatial coordinate system is established. The coordinates (xi, yi, zi) of the sensor Si (where i = 1, 2, …, N) are then substituted into (12).
(4) To solve the optimization problem of (12). Here, the Particle Swarm Optimization (PSO) algorithm is employed, and the obtained solution (xs, ys, zs) is the 3D spatial coordinates of the PD source.

3. Experimental Study on Factors Influencing Localization Accuracy

3.1. Experimental Platform

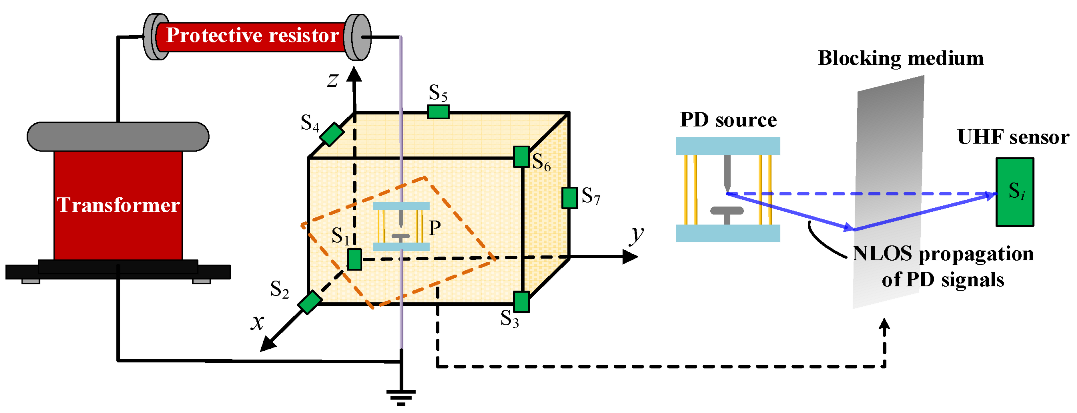
In order to study the calculated accuracy of the localization method under the influence of NLOS propagation of the signal, an experimental platform of UHF PD localization was established, as shown in Figure 4. The localization test area was set up as a cube space with a side length of 300 cm, and a total of seven sensors were arranged in the space. The coordinates of the sensors were as follows: S1 (0, 0, 0), S2 (300, 0, 0), S3 (300, 300, 0), S4 (150, 0, 300), S5 (0, 150, 300), S6 (300, 300, 300), and S7 (0, 300, 150), while the coordinate of PD source was (246, 203, 42). The test circuit consists of a transformer (with a rated voltage of 100 kV and a capacity of 50 kVA), a protective resistor (5 kΩ), and an insulating defect simulated by a pair of needle-plate electrode structures.
Moreover, to simulate NLOS propagation of the electromagnetic wave, an iron sheet (10 cm × 100 cm, thickness 1 cm) was directly attached in front of the selected UHF sensor, as shown in Figure 4. The frequency range of PD UHF signals mainly spans from 300 MHz to 1.5 GHz [19,20], corresponding to a wavelength λ range of approximately 0.2–1 m. In the 300 MHz–1 GHz range, the 10 cm width is generally smaller than λ/2, so the blocking effect is relatively weak, and the electromagnetic wave bypasses the sheet, thus simulating NLOS propagation. The metallic sheet was placed directly against the sensor front, so the direct wave is almost entirely obstructed, and the received signal is dominated by diffracted and reflected components.

3.2. The Effect of NLOS Propagation of UHF Signals on Localization Accuracy

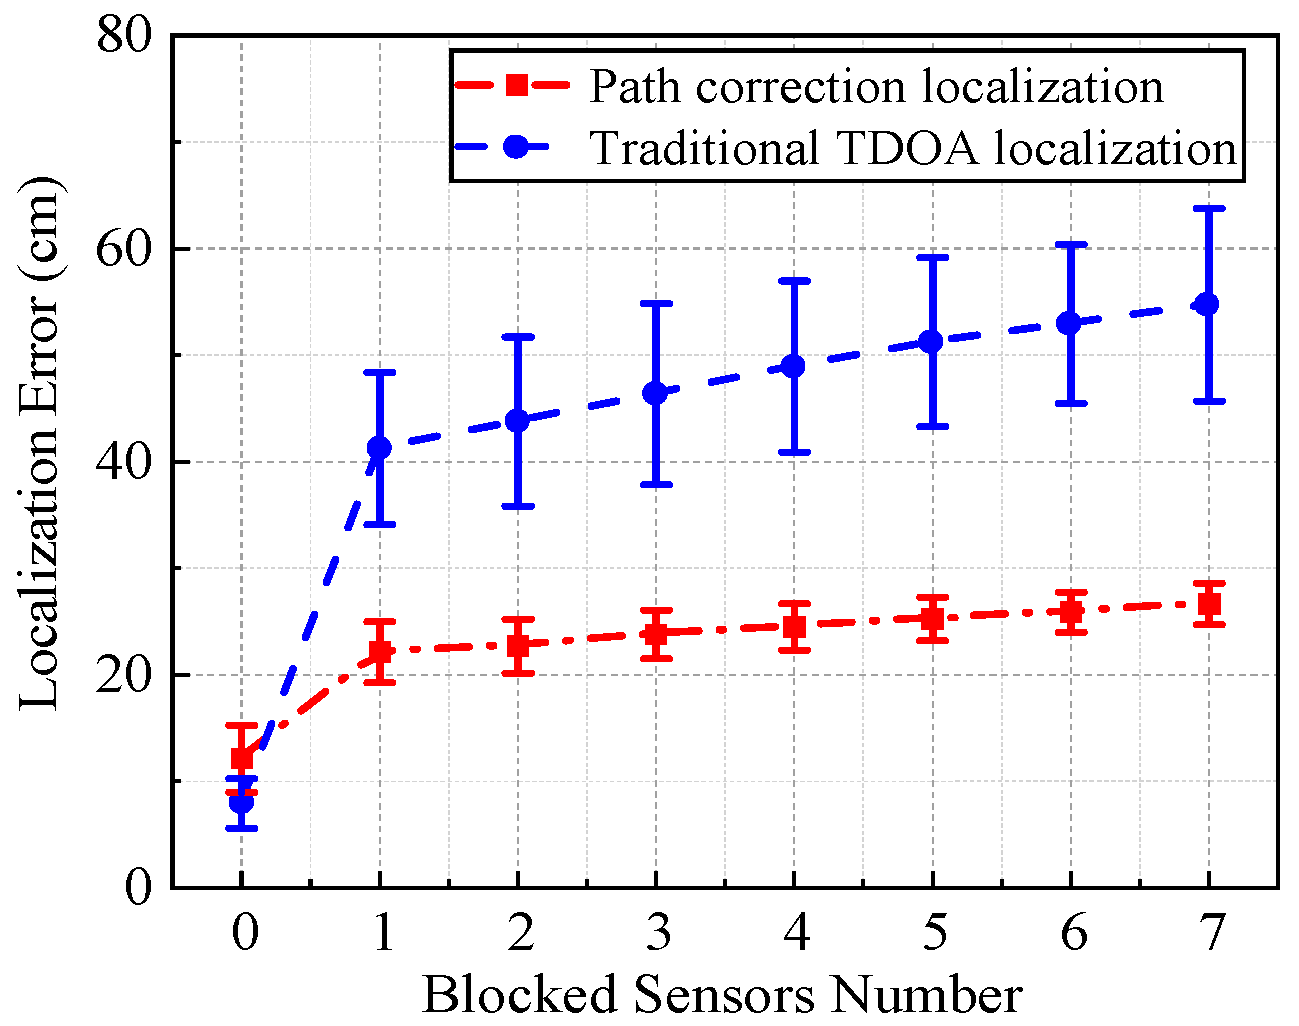
In this section, all seven sensors were involved in the localization process, and the difference in localization results between the proposed method and traditional TDOA method was compared by altering the number of sensors blocked by the medium, as shown in Figure 5. The Euclidean distance between the localization result and the actual PD source was calculated as the localization error. The smaller the localization error, the better the accuracy of the localization method. It should be noted that when the number of blocked sensors is unchanged, the error bars can be calculated by multiple groups of localization.
It can be seen that when there were no blocked sensors, the localization error of the traditional TDOA localization method was relatively small due to the absence of NLOS propagation. However, the proposed path correction method exhibited a slightly higher localization error because of the overcorrection of NLOS propagation. The localization deviation was only about 20 cm. With the increase in the number of blocked sensors, the localization errors of these two methods tended to gradually increase, and the error of the traditional TDOA localization method grew significantly faster than that of the path correction method. It can be concluded that the NLOS path correction method is superior when there exists one or more blocked sensors.

3.3. The Effect of the Number of Sensors on the Localization Accuracy of the NLOS Path Correction Method

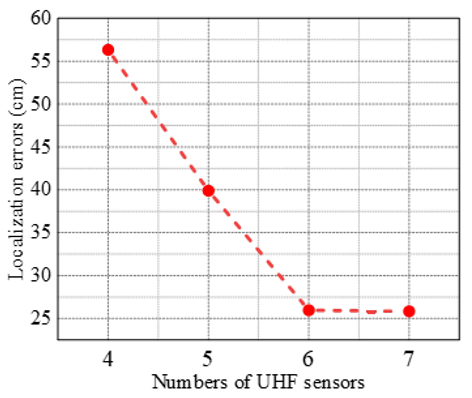
Moreover, in order to discuss the effect of sensors’ number on the localization accuracy of the NLOS path correction method and to ensure a suitable number of involved UHF sensors, here the localization error was calculated with different numbers of sensors, as illustrated in Figure 6, and all of the involved sensors were blocked by the medium. It can be seen that the localization error decreased significantly during the process of increasing the sensor number from four to six, i.e., from 56.32 cm to 25.83 cm. However, when the number of sensors exceeded six, the rate of reduction in localization error became relatively slow. The probable reason for this is that at this point the upper limit of b ^ no longer decreases, but converges to some fixed value, so that there is no longer a significant improvement in positioning accuracy.
From the above analysis, it can be found that, as the number of blocked sensors increases, the localization errors of both the traditional TDOA method and the NLOS path correction method will increase. In addition, the traditional TDOA method can only maintain higher localization accuracy when all sensors are unblocked. When any sensor is obstructed, the localization accuracy will be significantly reduced, and the localization performance becomes inferior to the NLOS method. Due to the complex internal structure of actual power transformers, there are unavoidable obstructions between the internal PD source and the UHF sensors mounted on the enclosure. So the NLOS path correction localization method presents a more accurate localization. Moreover, increasing the number of sensors involved is conducive to further improving the localization accuracy.

4. Experimental Verification and Results

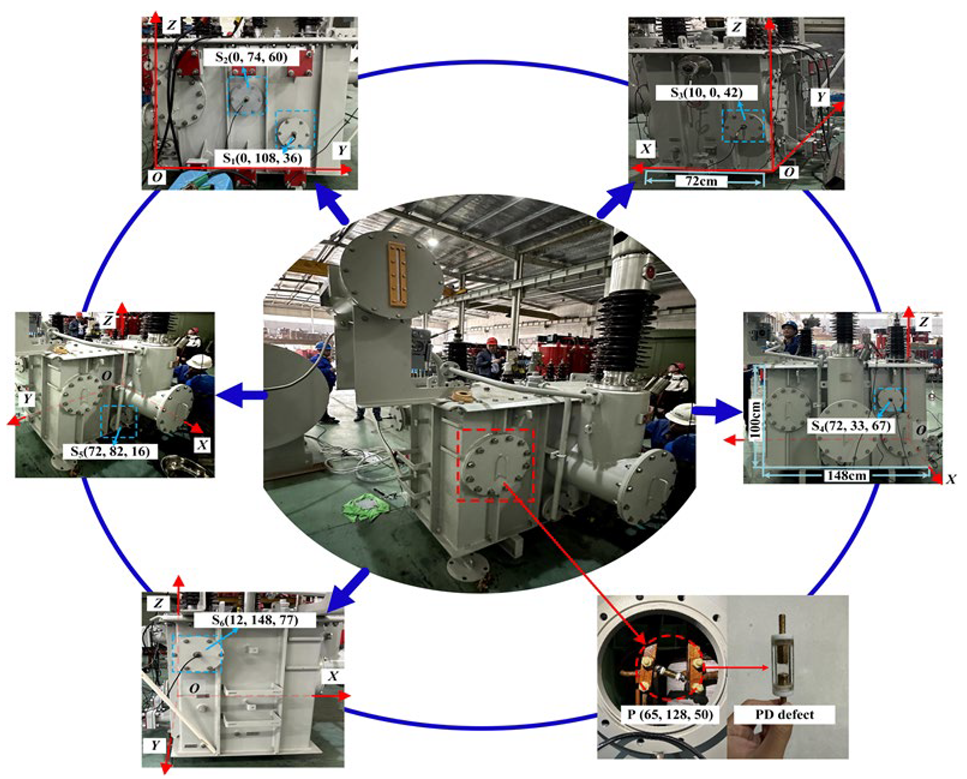
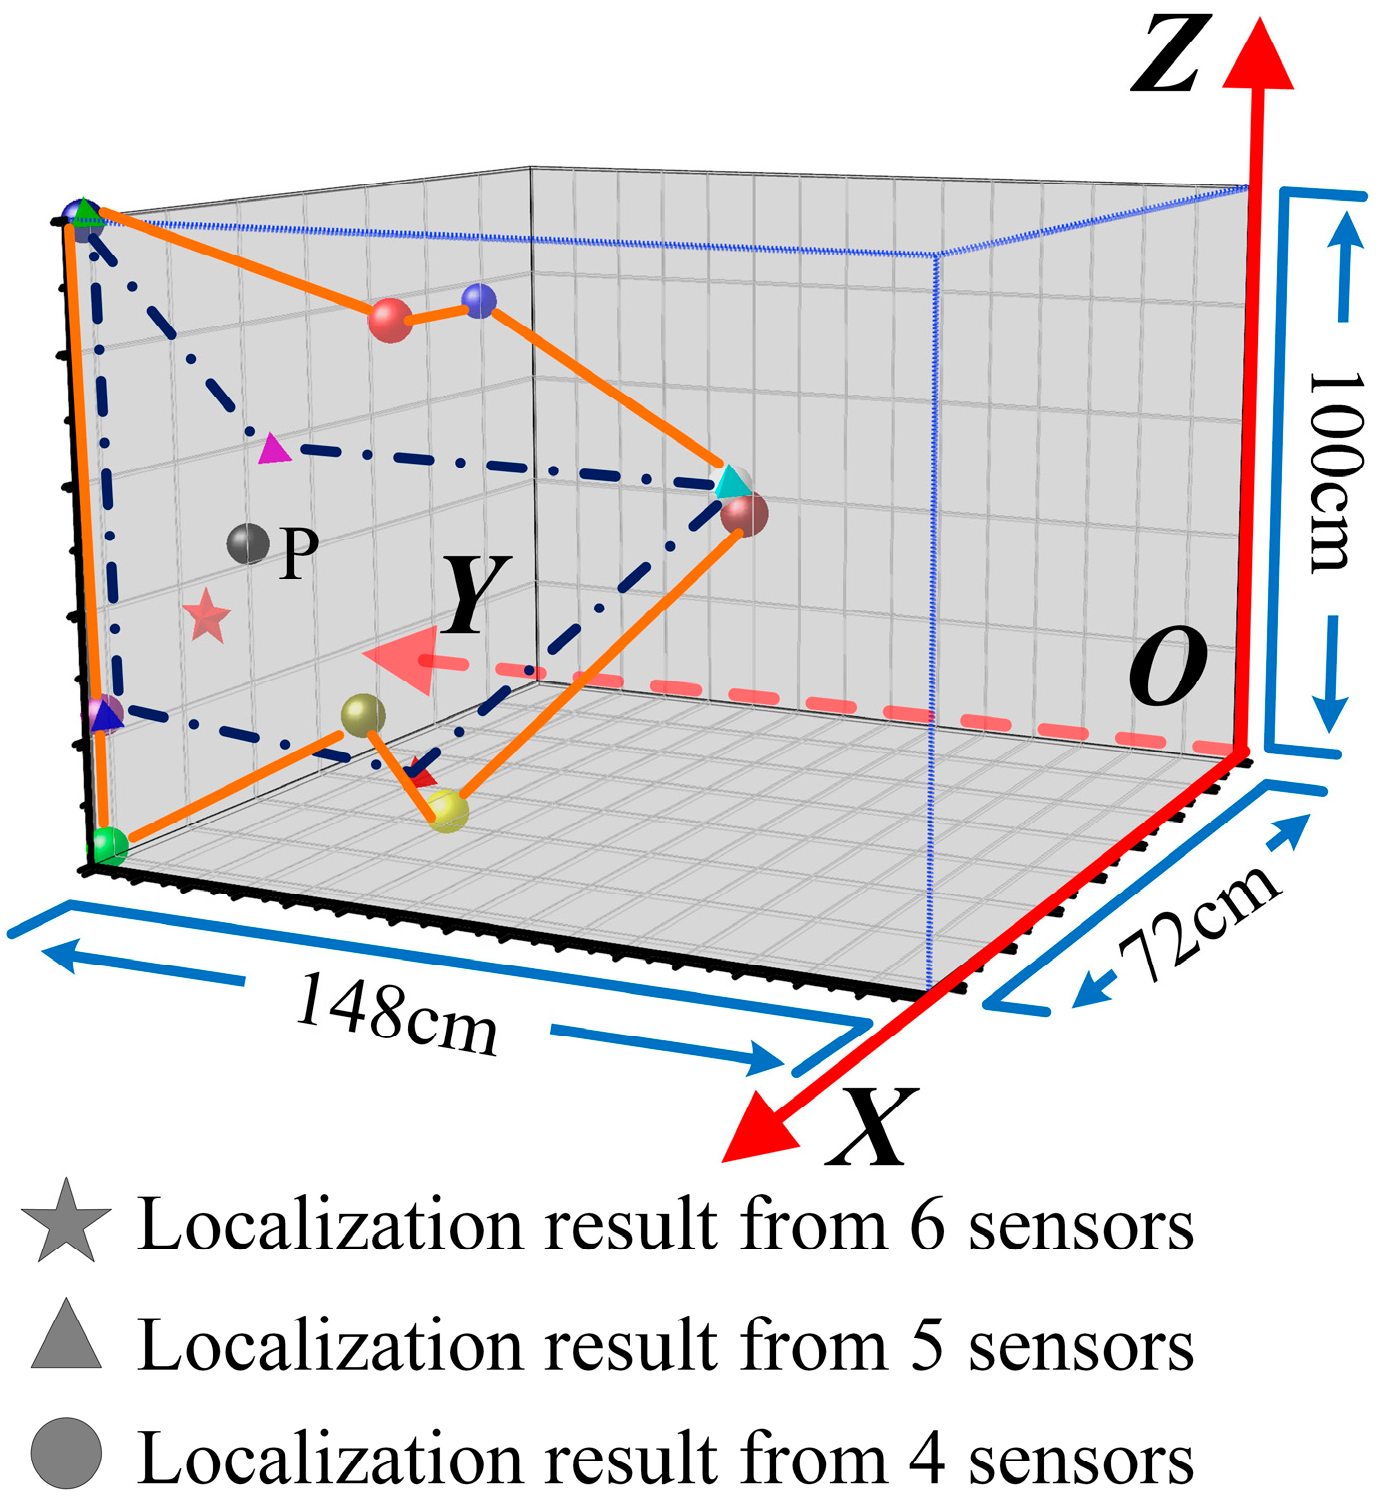
To verify the reliability of the proposed PD localization method, a verification experimental platform was established based on a testing oil-immersed transformer (YOD-500/35) manufactured by Shenda Electric Group Co.,Ltd. from Zhejiang Province, China. The capacity and rated voltage of the transformer are 500 kVA and 35 kV, respectively, and the size of the transformer is 72 cm × 148 cm × 100 cm. As shown in Figure 7, one of the transformer corners was selected as the origin, and then the spatial coordinate can be built. Here, six UHF sensors were installed inside the transformer, and the coordinates of the sensors were S1 (0, 108, 36), S2 (0, 74, 60), S3 (10, 0, 42), S4 (72, 33, 67), S5 (72, 82, 16), S6 (12, 148, 77). In addition, the PD defect was made of an air gap between the rod–rod electrodes, and it was also installed into the transformer, as shown in Figure 7. The position of the PD defect was P (65, 128, 50). Note that all of the units of coordinates are cm.
The layout of the verification platform is shown in Figure 8, and its elements contained a testing transformer with six UHF sensors installed, a localization software system, a signal amplification device, and a PD wave display.
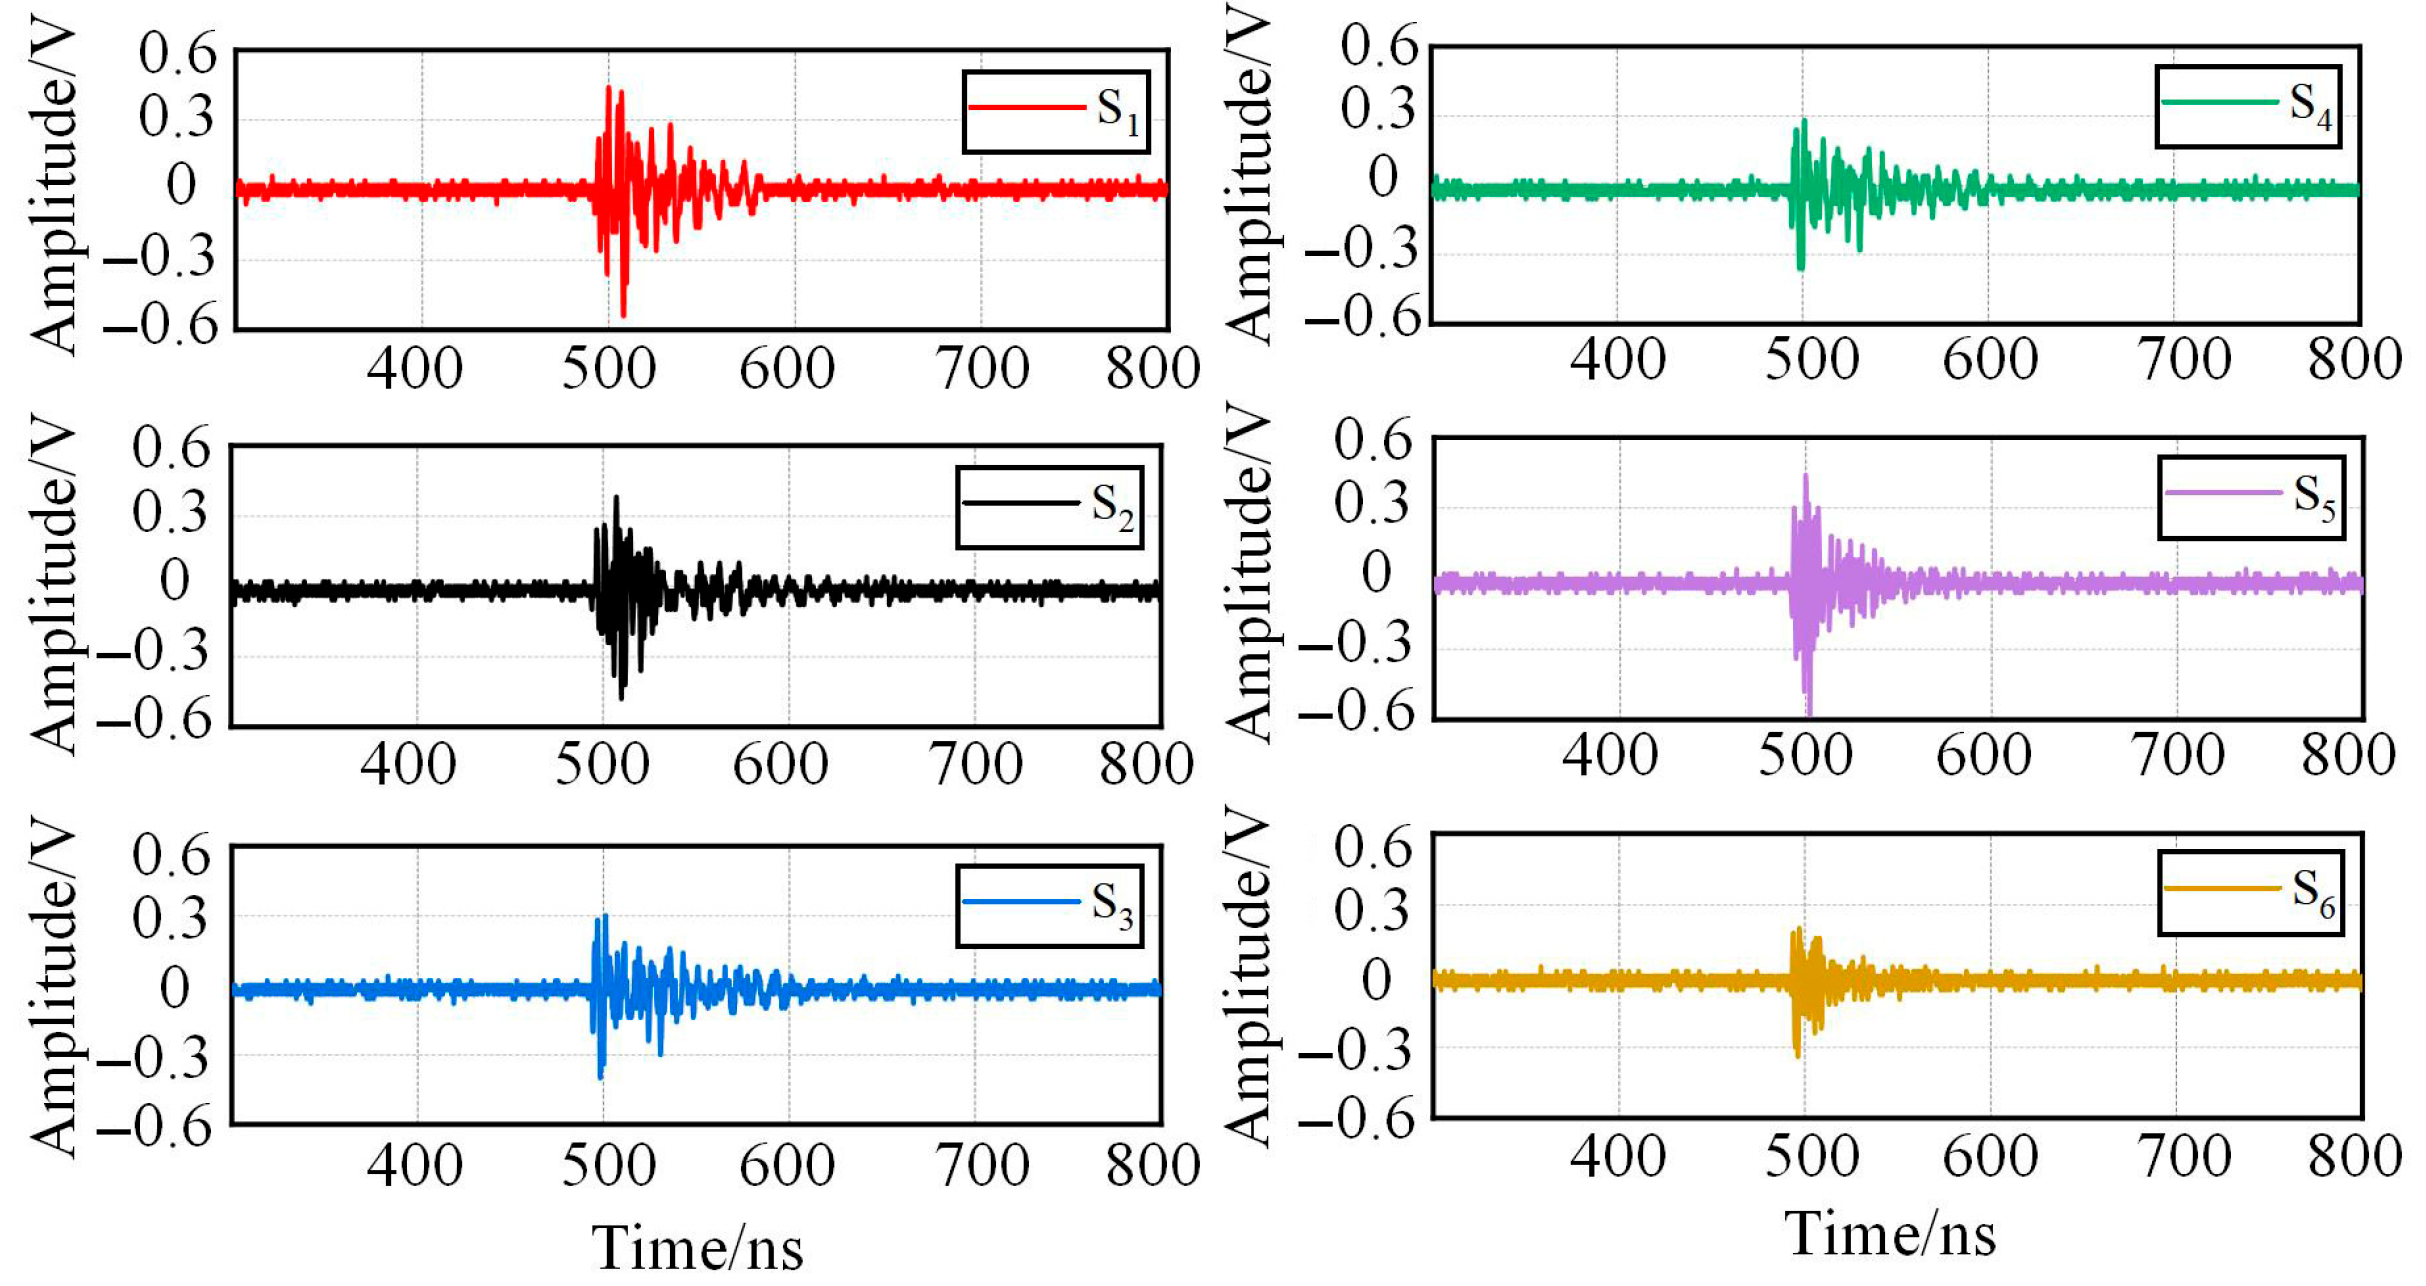
Once the PD occurs, the sensors will capture original UHF signals, then deliver these UHF signals into the signal amplification device, thus the original PD signal can be amplified, and meanwhile, the wave of PD signal can be shown on the screen of PD wave display, one of the detection results of PD wave is shown in Figure 9.
Due to the small size of the transformer in this experiment, the received PD signal amplitude of each sensor was significant. Under this condition, the localization method proposed in this paper can be used to determine the partial discharge location. The amplified signals will be input into the localization software. Here, the proposed NLOS path correction method was packaged into the localization software, and all calculations followed the process in Figure 3.
Here, the Sensor S1 was selected as the reference sensor, and the calculated accuracy of the proposed PD localization method was discussed based on the following two parts:

4.1. Comparison Between the Traditional TDOA Method

In this part, the PD signals from six sensors were utilized, and then the coordinate of the PD source was calculated by the traditional TDOA method and NLOS path correction method, respectively. The calculated results and localization errors were obtained from three times of experiments, as shown in Table 1.
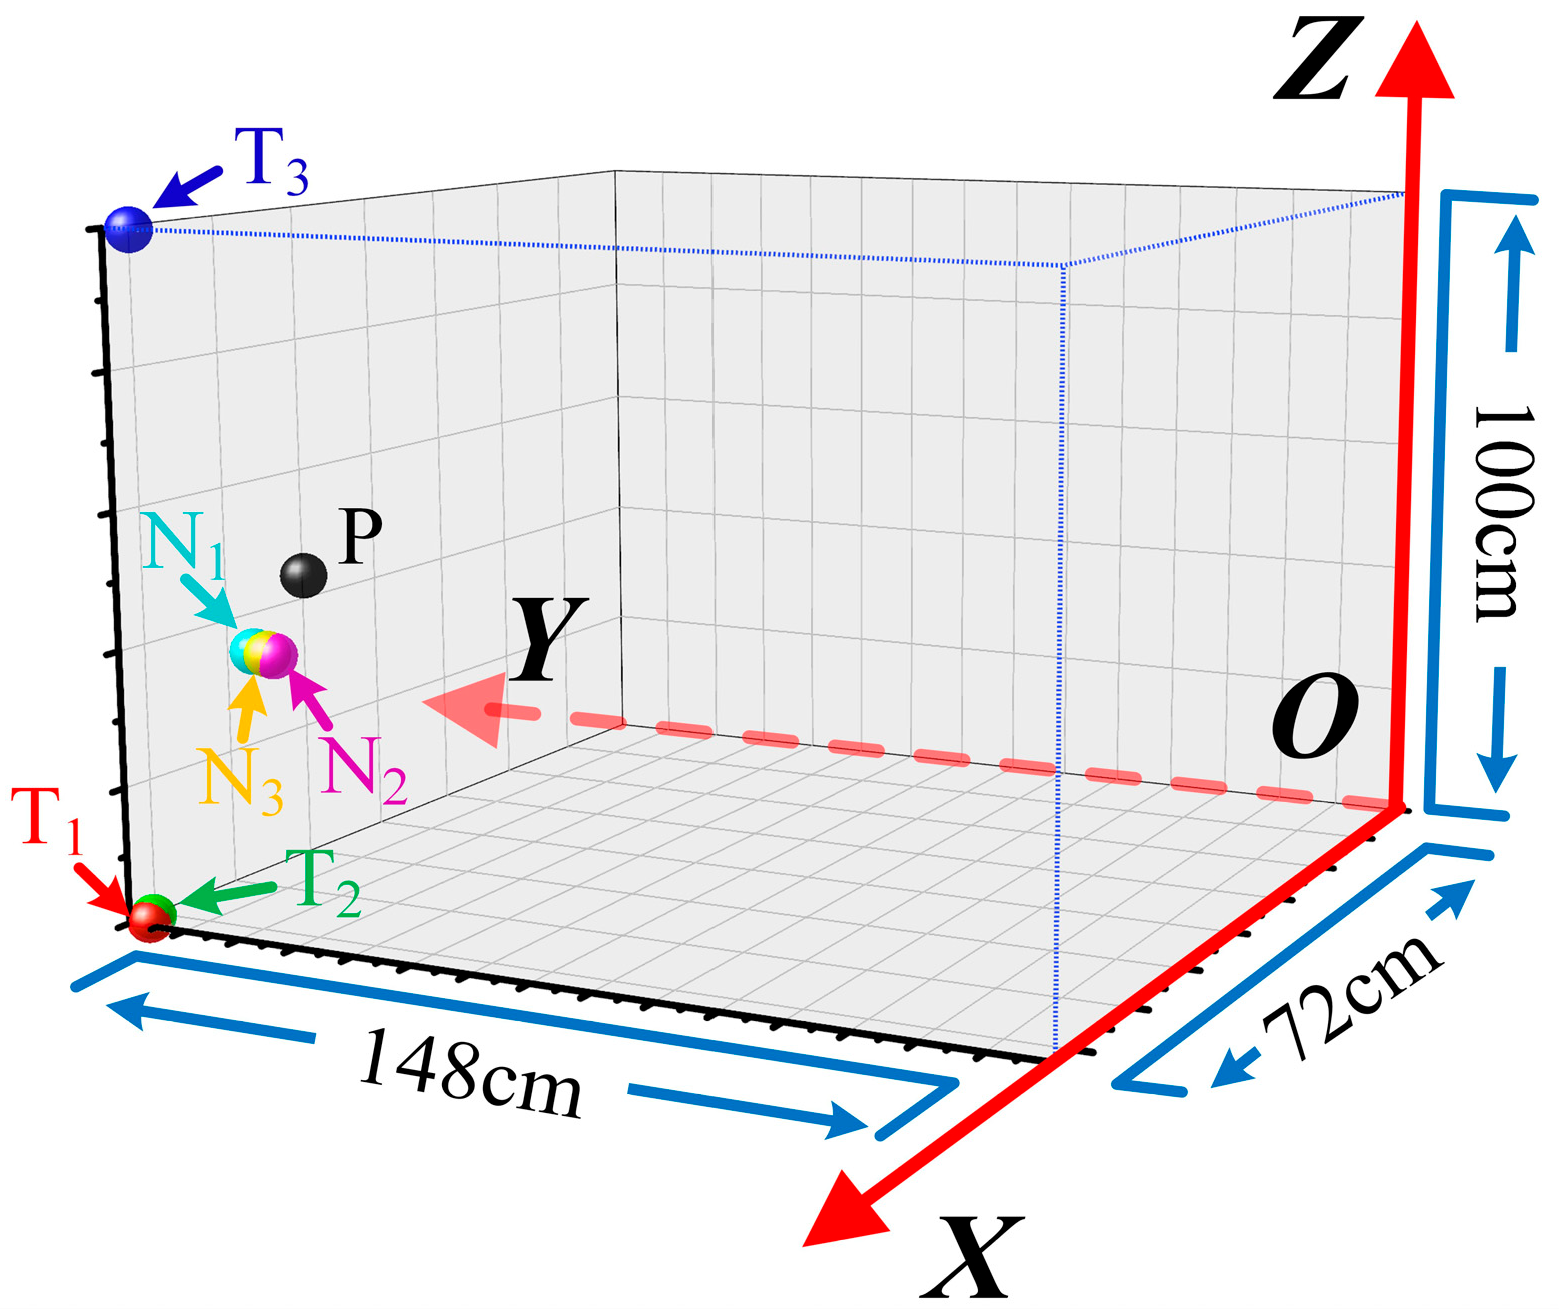
And the spatial distributions of the localized position from these two methods are illustrated in Figure 10. Note that the localization error was defined as the spatial distance between the calculated coordinate and the real position of the PD defect. The localized results of traditional TDOA method and NLOS path correction method were T1 (71.91, 147.90, 0.09), T2 (71.50, 148.00, 0.44), T3 (71.20, 148.00, 99.58) and N1 (71.58, 127.69, 41.34), N2 (71.91, 123.70, 41.17), N3 (72.00, 124.77, 41.40), respectively. It can be seen that the calculated errors of the traditional TDOA method are relatively larger, and the errors obtained from all three experiments exceed 50 cm, and the spatial distributions of the traditional TDOA method are random and scattered, which means the computational process is unstable, leading to significant deviations in the outcomes of each calculation. When it comes to the NLOS path correction method, the spatial positions of the localization results from each experiment almost overlap. It indicates that the calculated stability of this method is improved. Further, the localized precision of the NLOS method also significantly surpasses that of the traditional TDOA method. The range of calculated errors is only within 10.88~12.01 cm.

4.2. Influence of the Sensors’ Number on Calculated Accuracy of the Proposed NLOS Path Correction Method

In order to certify the superiority of the number of sensors adopted in this study, here the influence of the number of sensors on calculated accuracy was discussed based on the proposed NLOS path correction method.
The measured signals were extracted from Experiment 1, and the localization results are shown in Table 2. As for the condition of four and five sensors arrangement, the range of localization error was 33.62 cm~98.55 cm and 22.39~96.76 cm. In addition, with sensors’ number increasing, the average error decreased from 60.60 cm to 10.88 cm. Here, the improving rate of calculated accuracy is defined as
η = E n E m E n × 100 %
Here, η represents the improving rate of calculated accuracy, Em and En represent the localization error when the number of sensors was m and n, respectively.
Based on (13), as seen, when the sensors’ number increased from four to five, the improvement rate of calculated accuracy was 14.72%. And when sensors’ number increased to six, compared to the results with four and five sensors, the localization errors were improved by 82.04% and 78.94%, respectively. It can be seen that the arrangement with 6 sensors has a more significant effect on the improvement of calculated accuracy.
The spatial distribution of a different number of sensors is shown in Figure 11. The localization results under all conditions of sensor numbers are centered around the actual position of the PD source, indicating that the proposed NLOS path correction method has a certain degree of calculated accuracy. By connecting the localization points with the same sensor number arrangement, a localization spatial region can be formed. It is found that the area of the spatial region from four sensors localization was larger than that of five sensors, which means that increasing the sensor number helps to enhance the stability of the localization calculation, obtaining a smaller dispersion and higher calculated accuracy in the localization results. When the sensor number increased to six, the calculated result became closer to the actual position of the PD source. In addition, some of the calculated results of four and five sensors were close to the edge of the transformer casing, which may be due to the different positions of the involved sensors during the computation process, and the influence of NLOS of UHF signals varies greatly under different sensor arrangements. However, the experiments with six sensors possess enough sensors to arrange the sensors around the discharge source, thus significantly reducing the negative impact of NLOS on calculations.

5. Conclusions

In this paper, a PD source localization method considering the NLOS propagation phenomenon of electromagnetic waves in a transformer was proposed, i.e., the NLOS path correction method. The conclusions are summarized as follows:
(1) The proposed PD source localization method can correct the NLOS localization errors of electromagnetic wave signals.
Moreover, the localization accuracy can be improved by increasing the number of UHF sensors.
(2) Compared to the traditional TDOA method, which employs only four UHF sensors, using more than four UHF sensors can reduce the localization error to within 30 cm, but the improvement of localization accuracy becomes insignificant when the UHF sensor number exceeds six.
(3) The experimental verification was conducted based on a testing transformer (YOD-500/35) with six UHF sensors installed inside the transformer. The results showed that, compared to the traditional TDOA method, the proposed NLOS path correction method enables us to localize the PD source position more accuracy, and the calculated process of NLOS path correction method seemed to be more stable, leading to its calculated spatial position becoming more concentrated and even tended to overlap and the range of calculated errors only within 10.88 cm~12.01 cm. In addition, compared to the results with four and five sensors, the calculated accuracy of the six-sensor arrangement was improved by 82.04% and 78.94%, respectively. The localization with six sensors is more accurate and stable, significantly reducing the negative impact of NLOS on calculations.
The validation of this study is now completed on a 35 kV test transformer. The platform is small in size, so all sensors are able to capture localized discharge signals with a high signal-to-noise ratio. It should be noted that the attenuation of UHF signals in large transformers in real substations may be higher than in this experimental environment. Therefore, the effectiveness of the method proposed in this paper is strictly dependent on the high SNR signal reception conditions. Further validation of its engineering applicability in more complex scenarios is needed in the future.
However, the transformer size in this study was small, so all sensors were able to capture localized discharge signals with high signal-to-noise ratios. It should be noted that the attenuation of UHF signals in large transformers in real substations may be higher than in this experimental environment. Therefore, the effectiveness of the method proposed in this paper is strictly dependent on the high SNR signal reception conditions. Further validation of its engineering applicability in more complex scenarios is needed in the future.

Author Contributions

Conceptualization, Q.Z., M.Z. and Z.P.; methodology, C.P. and C.G.; software, Q.Z., W.Z. and Z.P.; validation, Q.Z. and C.P.; formal analysis, Q.Z. and Z.P.; investigation, Q.Z., M.Z. and Z.P.; resources, M.Z. and C.G.; data curation, Q.Z. and C.G.; writing—original draft preparation, Q.Z. and W.Z.; writing—C.P. and Z.; visualization, Q.Z. and Z.P.; supervision, C.P.; project administration, Q.Z.; funding acquisition, Q.Z., M.Z. and W.Z. All authors have read and agreed to the published version of the manuscript.

Funding

This research was funded by the Science and Technology Project of State Grid Shandong Electric Power Company (520626230110).

Data Availability Statement

Data will be made available from the corresponding author upon reasonable request.

Acknowledgments

The authors gratefully acknowledge the financial support of the Science and Technology Project of State Grid Shandong Electric Power Company (520626230110).

Conflicts of Interest

The authors declare no conflicts of interest.

References

  1. Li, J.; Han, X.; Liu, Z.; Yao, X. A novel GIS partial discharge detection sensor with integrated optical and UHF methods. IEEE Trans. Power Deliv. 2016, 33, 2047–2049. [Google Scholar] [CrossRef]
  2. Thiviyanathan, V.A.; Ker, P.J.; Leong, Y.S.; Abdullah, F.; Ismail, A.; Jamaludin, M.Z. Power transformer insulation system: A review on the reactions, fault detection, challenges and future prospects. Alex. Eng. J. 2022, 61, 7697–7713. [Google Scholar] [CrossRef]
  3. Zhou, L.; Bai, L.; Zhang, J.; Cao, W.; Xiang, E. Measurement and diagnosis of PD characteristics of industrial cable terminations in extreme cold environment. IEEE Trans. Instrum. Meas. 2020, 70, 1500211. [Google Scholar] [CrossRef]
  4. Shahsavarian, T.; Pan, Y.; Zhang, Z.; Pan, C.; Naderiallaf, H.; Guo, J.; Li, C.; Cao, Y. A review of knowledge-based defect identification via PRPD patterns in high voltage apparatus. IEEE Access 2021, 9, 77705–77728. [Google Scholar] [CrossRef]
  5. Siegel, M.; Beltle, M.; Tenbohlen, S.; Coenen, S. Application of UHF sensors for PD measurement at power transformers. IEEE Trans. Dielectr. Electr. Insul. 2017, 24, 331–339. [Google Scholar] [CrossRef]
  6. Jiang, J.; Chen, J.; Li, J.; Yang, X.; Bie, Y.; Ranjan, P. Partial discharge detection and diagnosis of transformer bushing based on UHF method. IEEE Sens. J. 2021, 21, 16798–16806. [Google Scholar] [CrossRef]
  7. Jangjoo, M.A.; Allahbakhshi, M.; Mirzaei, H.R. UHF sensors positioning on the power transformer tank to enhance the partial discharge localization accuracy. Electr. Power Syst. Res. 2023, 218, 109174. [Google Scholar] [CrossRef]
  8. Dhara, S.; Koley, C.; Chakravorti, S. UHF Sensors Based Localization of Partial Discharge Sources in Air-Insulated Electrical Substation Using TDOA and Relative RSS Information. IEEE Trans. Instrum. Meas. 2023, 72, 3509909. [Google Scholar] [CrossRef]
  9. Zhang, Z.; Chen, W.; Wu, K.; Liu, H.; Chen, X.; Jiang, T. Novel approach for partial discharge localization based on fiber-optic F–P sensing array and modified TDOA in a 110-kV transformer. IEEE Trans. Instrum. Meas. 2024, 73, 9517711. [Google Scholar] [CrossRef]
  10. Xavier, G.V.; de Oliveira, A.C.; Silva, A.D.; Nobrega, L.A.; da Costa, E.G.; Serres, A.J. Application of time difference of arrival methods in the localization of partial discharge sources detected using bio-inspired UHF sensors. IEEE Sens. J. 2020, 21, 1947–1956. [Google Scholar] [CrossRef]
  11. Xue, N.; Yang, J.; Shen, D.; Xu, P.; Yang, K.; Zhuo, Z.; Zhang, L.; Zhang, J. The location of partial discharge sources inside power transformers based on TDOA database with UHF sensors. IEEE Access 2019, 7, 146732–146744. [Google Scholar] [CrossRef]
  12. Jangjoo, M.A.; Allahbakhshi, M.; Mirzaei, H.R. Ultra-high frequency sensors positioning on the power transformer to mitigate the negative effects on the partial discharge localization accuracy. IET Gener. Transm. Distrib. 2024, 18, 585–595. [Google Scholar] [CrossRef]
  13. Gao, Y.; Shen, Y.; Xia, F.; Jiang, H.; Zhou, Y.; Liu, D. GIS partial discharge signal monitoring device and localization method based on UHF sensor. J. Electr. Eng. 2022, 17, 244–250. (In Chinese) [Google Scholar]
  14. Du, J.; Chen, W.; Cui, L.; Zhang, Z.; Tenbohlen, S. Investigation on the propagation characteristics of PD-induced electromagnetic waves in an actual 110 kV power transformer and its simulation results. IEEE Trans. Dielectr. Electr. Insul. 2018, 25, 1941–1948. [Google Scholar] [CrossRef]
  15. Jia, J.; Hu, C.; Yang, Q.; Lu, Y.; Wang, B.; Zhao, H. Localization of partial discharge in electrical transformer considering multimedia refraction and diffraction. IEEE Trans. Ind. Inform. 2020, 17, 5260–5269. [Google Scholar] [CrossRef]
  16. Su, Z.; Shao, G.; Liu, H. A soft-minimum method for NLOS error mitigation in TOA systems. In Proceedings of the 2016 IEEE 84th Vehicular Technology Conference (VTC-Fall), Montreal, QC, Canada, 18–21 September 2016; pp. 1–4. [Google Scholar]
  17. Deb, K. An efficient constraint handling method for genetic algorithms. Comput. Methods Appl. Mech. Eng. 2000, 186, 311–338. [Google Scholar] [CrossRef]
  18. Tang, J.; Xie, Y. Partial discharge location based on time difference of energy accumulation curve of multiple signals. IET Electr. Power Appl. 2011, 5, 175–180. [Google Scholar] [CrossRef]
  19. Judd, M.; Farish, O.; Hampton, B. The excitation of UHF signals by partial discharges in GIS. IEEE Trans. Dielectr. Electr. Insul. 1996, 3, 213–228. [Google Scholar] [CrossRef]
  20. Schiewaldt, K.; de Castro, B.A.; Ardila-Rey, J.A.; Franchin, M.N.; Andreoli, A.L.; Tenbohlen, S. Assessment of UHF Frequency Range for Failure Classification in Power Transformers. Sensors 2024, 24, 5056. [Google Scholar] [CrossRef] [PubMed]
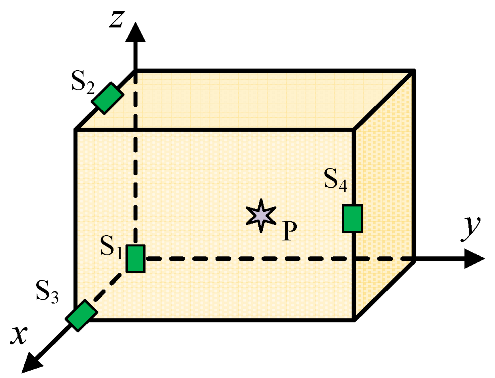
Figure 1. The coordinate system of the PD source localization model.
Sensors 25 05099 g001
Figure 2. Geometric schematic of PD source localization.
Sensors 25 05099 g002
Figure 3. The localization process of PD source.
Sensors 25 05099 g003
Figure 4. Experimental platform of UHF PD localization.
Sensors 25 05099 g004
Figure 5. The effect of the number of blocked sensors on localization accuracy.
Sensors 25 05099 g005
Figure 6. The effect of sensor numbers on localization accuracy of NLOS path correction method.
Sensors 25 05099 g006
Figure 7. The photo of the testing transformer and the positions of each UHF sensor from a different perspective.
Sensors 25 05099 g007
Figure 8. Verification platform of transformer PD localization.
Sensors 25 05099 g008
Figure 9. One of the detected results of PD signals from six sensors.
Sensors 25 05099 g009
Figure 10. Spatial distributions of PD source localization from different methods based on six sensors.
Sensors 25 05099 g010
Figure 11. Spatial distributions of PD source localization based on NLOS path correction method with different sensor numbers.
Sensors 25 05099 g011
Table 1. The comparison between different localization methods.
No.Traditional TDOA MethodNLOS Path Correction Method
Experiment 1Localization result (cm): T1 (71.91, 147.90, 0.09)
Calculated error (cm): 54.17
Localization result (cm): N1 (71.58, 127.69, 41.34)
Calculated error: 10.88
Experiment 2Localization result (cm): T2 (71.50, 148.00, 0.44)
Calculated error (cm): 53.83
Localization result (cm): N2 (71.91, 123.70, 41.17)
Calculated error (cm): 12.01
Experiment 3Localization result (cm): T3 (71.20, 148.00, 99.58)
Calculated error (cm): 53.82
Localization result (cm): N3 (72.00, 124.77, 41.40)
Calculated error (cm): 11.54
Table 2. Localization results of NLOS path correction method based on different sensor numbers.
Sensor NumberThe Sensors Participating in CalculationsLocalization Result
(cm)
Calculation Error (cm)Average Error
(cm)
4S1, S2, S3, S4(72.00, 90.38, 87.51)53.5860.60
S1, S2, S3, S5(72.00, 148.00, 2.68)51.85
S1, S2, S3, S6(12.00, 148.00, 77.00)62.75
S1, S2, S4, S5(72.00, 33.00, 67.00)96.76
S1, S2, S4, S6(72.00, 33.00, 67.00)96.76
S1, S2, S5, S6(72.00, 82.00, 16.00)57.63
S1, S3, S4, S5(72.00, 28.87, 96.99)38.17
S1, S3, S4, S6(72.00, 148.00, 100.00)54.30
S1, S3, S5, S6(72.00, 148.00, 23.89)33.62
S1, S4, S5, S6(72.00, 30.66, 63.74)98.55
5S1, S2, S3, S4, S5(72.00, 87.63 20.34)50.5851.68
S1, S2, S3, S4, S6(72.00, 148.00, 100.00)54.30
S1, S2, S3, S5, S6(72.00, 148.00, 22.94)34.37
S1, S2, S4, S5, S6(72.00, 33.00, 67.00)96.76
S1, S3, S4, S5, S6(71.37, 114.16,66.42)22.39
6S1, S2, S3, S4, S5, S6(71.58, 127.69, 41.34)10.8810.88
Disclaimer/Publisher’s Note: The statements, opinions and data contained in all publications are solely those of the individual author(s) and contributor(s) and not of MDPI and/or the editor(s). MDPI and/or the editor(s) disclaim responsibility for any injury to people or property resulting from any ideas, methods, instructions or products referred to in the content.