Article

Hierarchical Clustering Analysis for Positioning Two Intrusion Events at Different Locations Using Dual Mach-Zehnder Interferometers

Institute of Photonics Technologies, National Tsing Hua University, Hsinchu 300, Taiwan
*
Author to whom correspondence should be addressed.
Sensors 2025, 25(16), 5074; https://doi.org/10.3390/s25165074
Submission received: 18 July 2025 / Revised: 12 August 2025 / Accepted: 12 August 2025 / Published: 15 August 2025
(This article belongs to the Section Optical Sensors)

Abstract

Hierarchical clustering analysis is applied to the positioning of two simultaneously-occurring intrusion events in the case of a dual Mach-Zehnder interferometer used for intrusion detection. To simulate the two intrusion events, the sensing fibers of the dual Mach-Zehnder interferometer are heavily knocked at two different positions simultaneously. Then the clockwise (CW) and counter-clockwise (CCW) signals are loaded into a personal computer through a data acquisition module, and analyzed by Fourier transform method for determination of the time delay between the two signals. Hierarchical clustering analysis is then employed twice for dividing the data points in a feature space into several clusters according to the conditions required. To locate the two intrusions, the first clustering analysis is performed on the data points formed by signals detected in a 10 ms time period, with the centroid of the largest cluster being the location of a single intrusion event. Then, 100 pairs of CW and CCW signals detected sequentially are analyzed to give 100 locations. These 100 locations and their CP values (each standing for a ratio of a given spectral amplitude to the summation of the spectral amplitudes over the frequency band of 2500 to 5000 Hz) constitute 100 data points in a feature space for the second hierarchical clustering analysis, which then determines the respective locations of the two intrusion events. In the test of a 1036 m long fiber perimeter, we demonstrated an accuracy to within 21.55 m.

1. Introduction

There are a variety of fiber-optic sensors for perimeter intrusion detection, such as fiber Bragg grating sensors [1,2], Rayleigh backscattering based time-domain reflectometric sensors [3,4,5,6], and optical interferometric sensors, the last of which covers the use of techniques using Michelson interferometers [7,8], Sagnac interferometers [9,10], and Mach-Zehnder interferometers [11,12]. Techniques with merged types of interferometer such as those reported in the works of Refs. [13,14,15,16] also supported good location ability in disturbance detection.
Recently, dual Mach-Zehnder interferometers (DMZIs) have been studied for accurate location of the intrusion event occurring along sensing fibers. An experimental test demonstrated an average locating error of 390 m by using an 18.46 km long sensing interferometer [17]. With a polarization feedback-loop control used to eliminate the effect of polarization induced fading (PIF), a locating error of 160 m for a 112 km long DMZI was obtained [18]. Then, to mitigate the effect of PIF, a chaotic particle swarm optimization-based algorithm was used, achieving a locating error of ±20 m over a 2.25 km sensing cable [19], which was claimed to be one order of magnitude lower than that obtained by using a conventional interference visibility-based polarization control algorithm. To eliminate the influence of Rayleigh backscattering on the counter-clockwise (CCW) and clockwise (CW) signals in the DMZI system, a wavelength-division multiplexing technique was employed, achieving an accuracy to within 52.5 m in the case of a 61 km sensing length, which was much better than that obtained for a traditional DMZI [20]. Faraday rotating mirrors were used to eliminate the effect of PIF, leading to a locating error of ±25 m in the experiment using a 100-km sensing distance [21]. Most of the present DMZIs, like those mentioned above, used a cross correlation algorithm to determine the time delay between CCW and CW signals acquired, which is equivalent to the location of intrusion.
A Fourier spectral analysis method was presented to determine the location of an intrusion event without using the conventional cross-correlation method for a modified DMZI intrusion detection system with a locating error of <26 m for a 250 m (or 1036 m) long detection range [22]. The effect of PIF was reported not to appear in the long-term test for such a modified DMZI system. Later, a hierarchical clustering analysis method for this DMZI system was applied to determine the location of an intrusion event with maximum mean locating errors of 11.55 m [23].
However, all present DMZIs can locate only one intrusion event at a time. Researchers have achieved some progress toward simultaneously locating multiple events along the sensing fibers. Sun et al. proposed a way of locating multiple vibrations of different frequencies at different positions in their experiment with a ring-type Mach-Zehnder interferometer, although they addressed only the detection of multiple events of different frequencies at the same position [24]. On the other hand, Zhang et al. proposed an algorithm for locating two disturbances occurring simultaneously at different positions, but without experimental confirmation [25]. To address the issue of locating multiple intrusion events that simultaneously occur at different positions, this paper provides more concrete experimental location results for two simultaneous events. The rest of the paper is organized as follows. Section 2 outlines the principle of the proposed optical method for detecting two simultaneous intrusion events. In Section 3, experimental results are presented by using the hierarchical analysis method to find the absolute error in the positioning of two intrusion events. Section 4 concludes this work.

2. Outline of the Presented Measurement System

2.1. Detected Signals

We use our previous modified DMZI presented in [22] for intrusion positioning in this study. Figure 1 shows the DMZI with two polarization beam splitters/combiners (PBS1 and PBS2) used for an MZI structure. Two polarization-maintaining fiber couplers (PMFC1 and PMFC2) are also used to couple two waves into one path (or split one wave into two) for only one linearly polarized wave, e.g., the x polarized wave (i.e., they only operate for the x-polarized wave.). Each PC (polarization controller) is adjusted to obtain an output wave in a state approaching an x-polarized wave. There are two sites with 45 degree splicing between two principal axes of the spliced polarization-maintaining fibers (see cross marks in the figure). One site is between PMFC1 and PBS1, and the other site is between PBS2 and the Polarizer (which is an inline fiber polarizer with a polarization-maintaining fiber at its two ends).
A laser light is first split into two paths through a fiber coupler (FC). One of the split lights propagates through a PC, PMFC1, the MZI, the inline fiber polarizer, PMFC2, and is then detected by a photodetector (i.e., PD2). This light is referred to as CW light because it propagates clockwise in a loop. After the clockwise light passes through PMFC1 and the 45 degree splicing site, there are x-polarized and y-polarized light along the polarization maintaining fiber at the input end of PBS1. After propagating through PBS1, only x-polarized light and y-polarized light would propagate in the upper and the lower arms of the MZI, respectively. The two orthogonally-polarized lights then combine via PBS2, and interfere through the inline fiber polarizer, which delivers the interfered light along its polarization-maintaining fiber output end. The light then propagates along the fiber and reaches PMFC2 and then PD2. A CCW light is defined for the other split light, which propagates though a PC, PMFC2, the inline fiber polarizer, the MZI, PMFC1, and then is detected by PD1. A more detailed description of the operation of the modified DMZIs can be found in [22].
Two intrusions are supposed to occur simultaneously at two different positions such that the fibers are disturbed at positions z = d1 and z = d1 + d2, respectively, from PBS1, as shown in Figure 1. The time it takes the light to travel over the distance of d1, d2 and d3 is denoted by τ1, τ2 and τ3, respectively.
Suppose the phases incurred by the disturbances at z = d1 are Φ X 1 ( t ) (upper arm) and Φ Y 1 ( t ) (lower arm), while the disturbances at z = d1 + d2 are Φ X 2 ( t ) (upper arm) and Φ Y 2 ( t ) (lower arm). Then the detected optical powers by PD1 and PD2 can be expressed, respectively, as
I P D 1 t = I 1 [ 1 + cos Φ 1 t ( τ + τ 2 + τ 3 + Φ 2 t ( τ + τ 3 ) ]
and
I P D 2 t = I 2 [ 1 + cos Φ 1 t τ 1 + Φ 2 t ( τ 1 + τ 2 ) ]
where I1 and I2 are both constants, and Φ 1 ( t ) and Φ 2 ( t ) are Φ X 1 t Φ Y 1 ( t ) and Φ X 2 t Φ Y 2 ( t ) , respectively. Then, we define Φ 12 t = Φ 1 t + Φ 2 ( t τ 2 ) and Φ 21 t = Φ 2 t + Φ 1 ( t τ 2 ) . Equations (1) and (2) can thus be rewritten as
I P D 1 t = I 1 [ 1 + c o s ( Φ 21 t τ τ 3 ) ]
and
I P D 2 t = I 2 [ 1 + c o s ( Φ 12 t τ 1 ) ] ,
respectively.
There exists a range of τ 2 such that Φ 12 t equals Φ 21 t . Therefore, Equations (3) and (4) can be re-expressed as
I P D 1 t I 1 [ 1 + c o s ( Φ 12 t τ τ 3 ) ]
I P D 2 ( t ) I 2 [ 1 + c o s ( Φ 12 t τ 1 ) ]
We further explain the limitation of the range of τ 2 for Φ 12 t being equal to Φ 21 t . In fact, we need ω τ 2 to be small enough for exp(ω τ 2 ) to approximately be equal to 1. In the study, the range of ω is from 2π·2000 to 2π·5000, and thus 2π·5000 τ 2 should be small enough. This corresponds to the case that the separation between the two intrusion events should be smaller than 6366 m. The smaller the separation, the truer Φ 12 t equals Φ 21 t . In this study, the maximum separation would be 1036 m, which naturally makes Φ 12 t approximately equal to Φ 21 t . Because of this limitation of the separation, the maximum length of the DMZIs should also be smaller than 6366 m.
From Equations (5) and (6), the time delay between I P D 1 t and I P D 2 t is ( τ 1 + τ 2 + τ 3 + τ 3 ) τ 1 = τ 2 + 2 τ 3 when there are two simultaneous intrusion events occurring at z = d1 and z = d1 + d2. If τ 2   =   0 , the time delay becomes 2 τ 3 , and this case corresponds to an intrusion event occurring at z = L − v· τ 3 , or at a position of v· τ 3 away from PBS2, where L is the total length of the sensing fiber and v the light speed in the fiber. However, the time delay induced by the two simultaneous intrusion events is definitely mistaken for a case of only one intrusion event occurring at a position of v·( τ 2 + 2 τ 3 )/2.
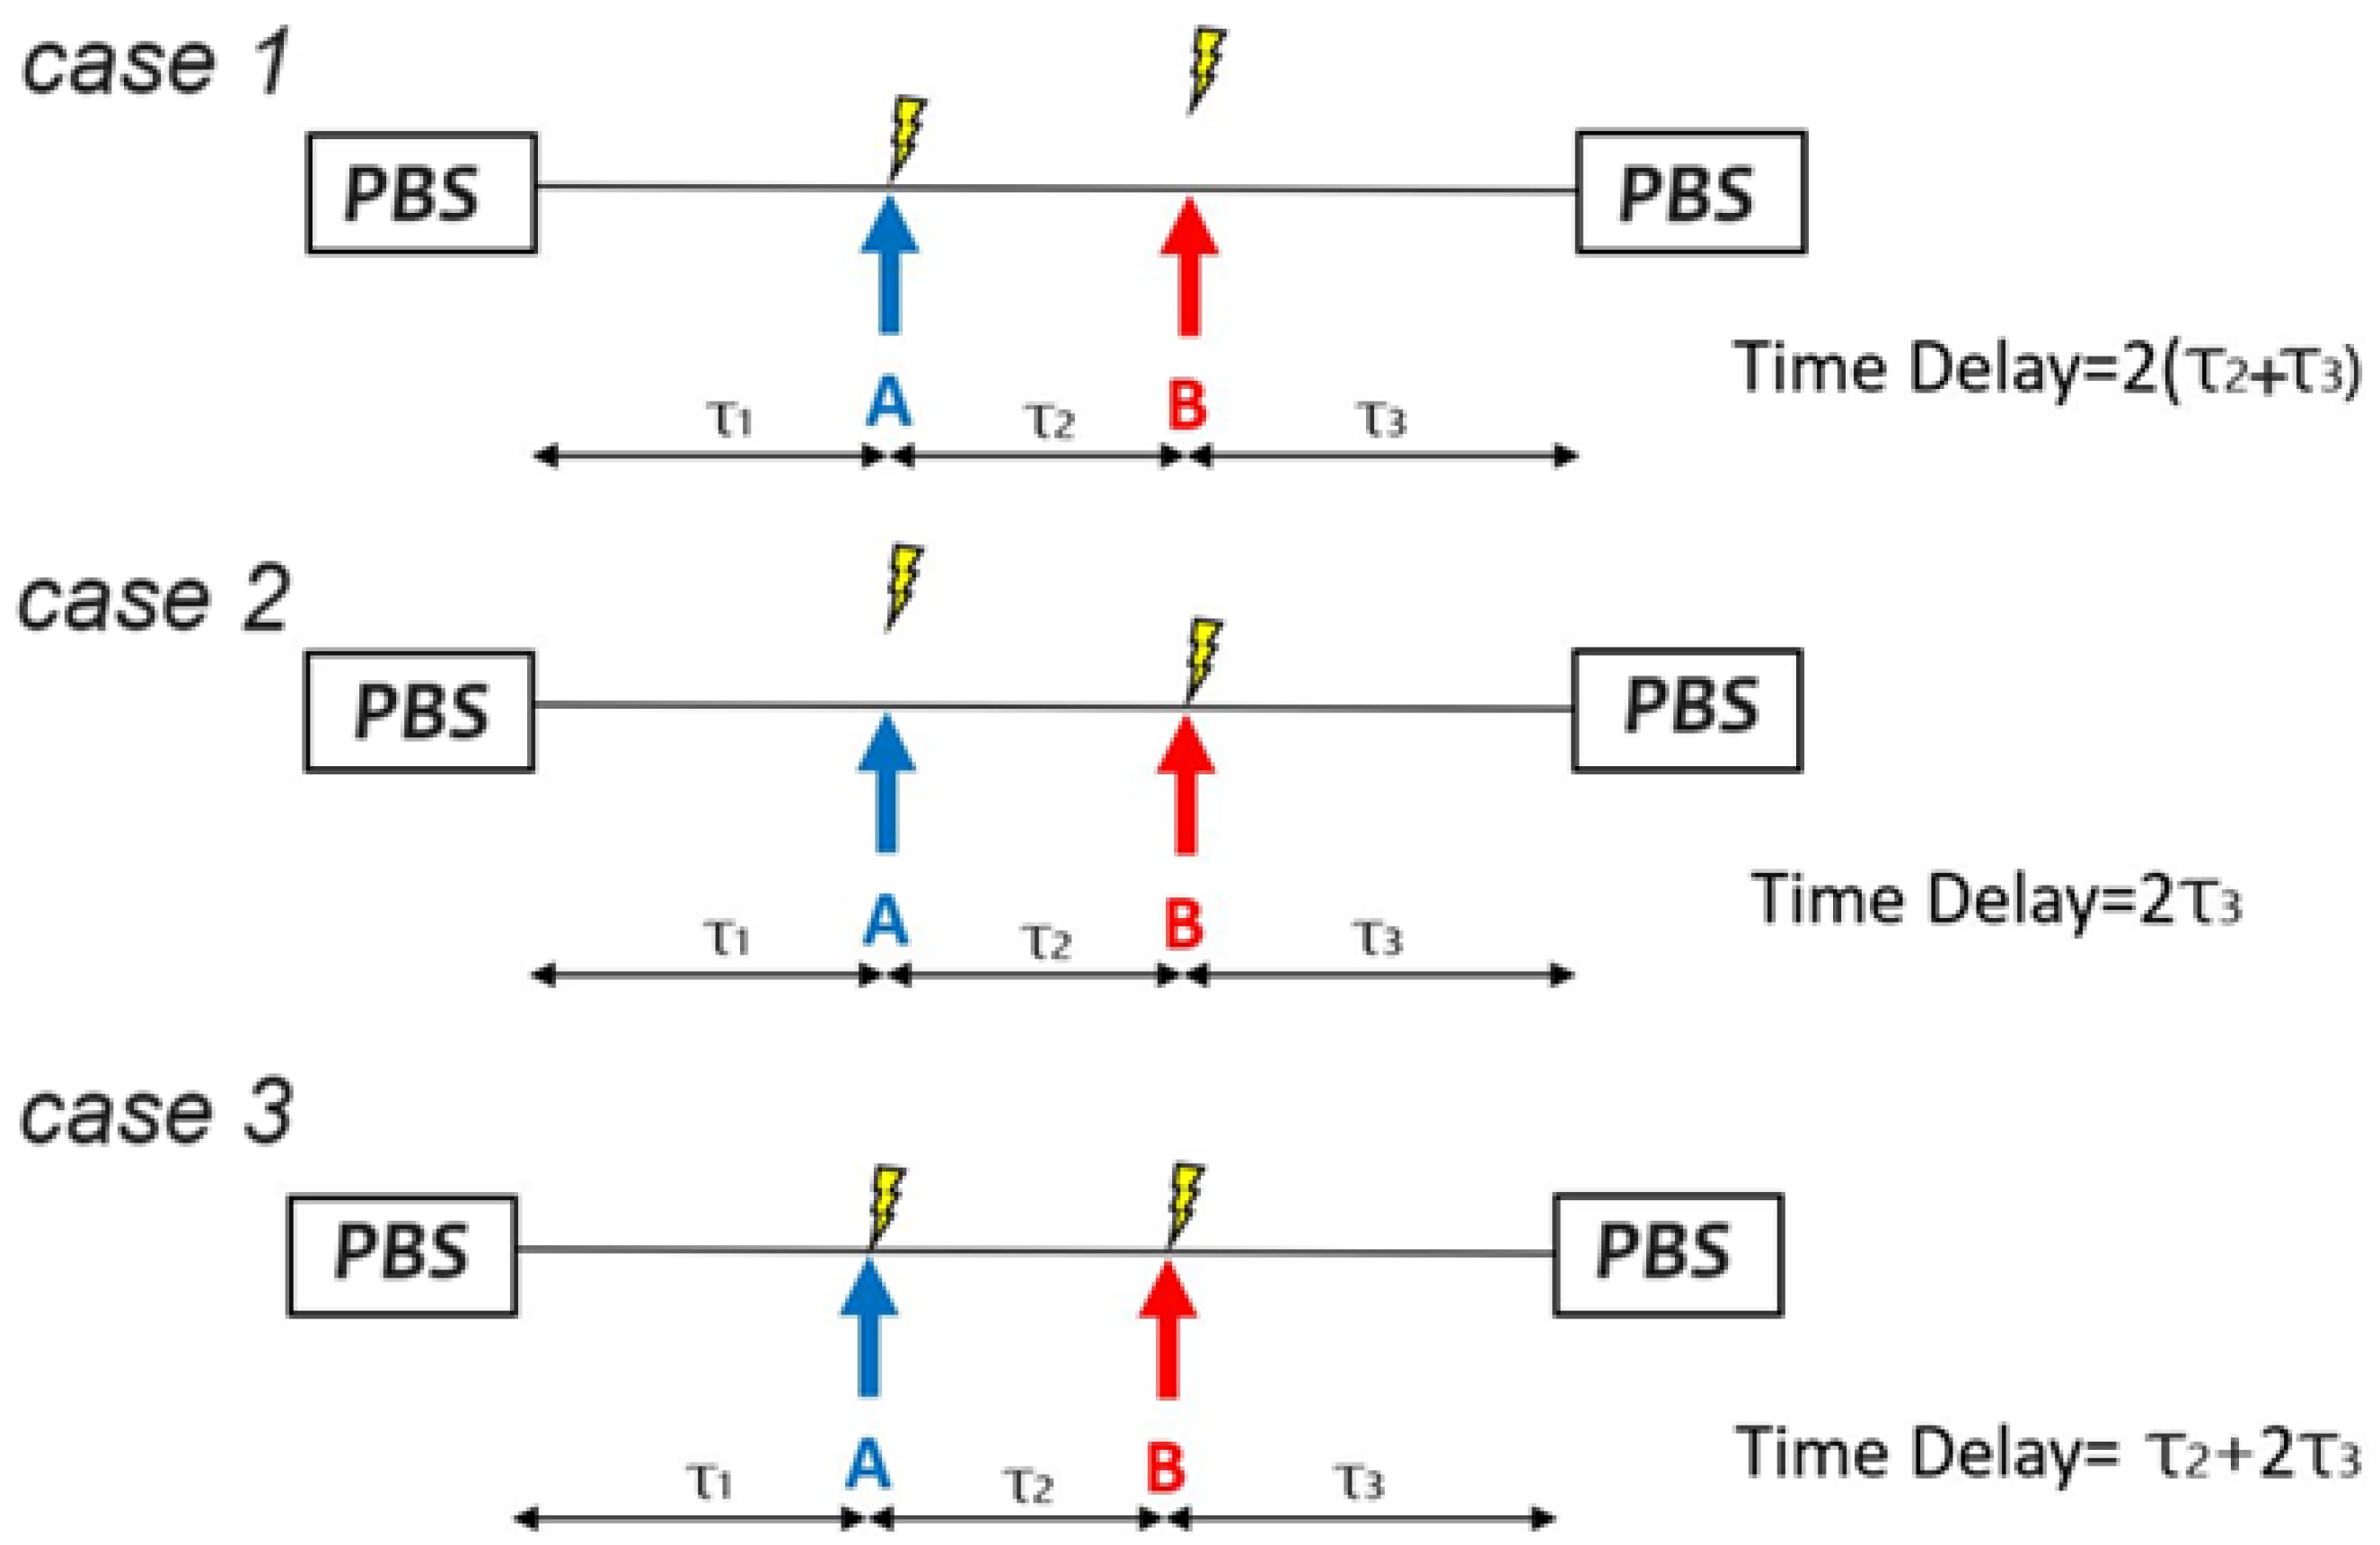
In the study, the detected signals IPD1 and IPD2 are acquired by a data acquisition module (DAQ) every 10 ms at a sample rate of 2 Msamples/s, and each acquired signal waveform has a time interval of 10 ms. In such a short time interval, the sensing fiber might be disturbed in three ways as shown in Figure 2, where the fiber is disturbed only at position A (case 1), only at position B (case 2), and simultaneously at positions A and B (case 3). When the fiber is disturbed at only one position, as in case 1 or case 2 of Figure 2, the intrusion location can be determined as usual by finding the time delay between the two detected signals IPD1 and IPD2, i.e., the CCW and CW signals. On the other hand, when the fiber is disturbed simultaneously at positions A and B, as in case 3 of Figure 2, there exists a time delay of τ 2 + 2 τ 3 between the two detected signals IPD1 and IPD2. Note that this time delay is equal to the average of the two time delays for cases 1 and 2, but is incorrect for determining the intrusion position. In summary, only the time delays in cases 1 and 2 are correct in determining the locations of disturbances, while the time delay in case 3 is not.
As aforementioned, the detected signals IPD1 and IPD2 are acquired every 10 ms and thus 100 pairs of detected signals would be acquired continuously within 1 s. For each pair, one time delay approaching 2 (τ2 + τ3), 2τ3 or τ 2 + 2 τ 3 can be found by hierarchical clustering analysis.

2.2. Hierarchical Clustering Analysis for Positioning

One time delay value will be obtained by using a hierarchical analysis, as we did in [23], and this time delay corresponds to a position which is defined by the distance from PBS2. The distance is expressed by position number, which is proportional to a real distance. The position number is defined to be a real distance from PBS2 (in meters) divided by 50. Here, 50 is the spatial resolution in meters resulting from the sampling rate of the DAQ used in the experiments. In this study, a unit value of position number represents a real distance of 50 m as in the work of [23]. In the first-step hierarchical analysis, feature coordinates such as (x, y), where x represents the position number and y the CP value, are used for each pair of detected signals. This x coordinate approaches one of the two intrusion positions, i.e., v·(τ2 + τ3) and v· τ 3 , or approaches v·( τ 2 + 2 τ 3 )/2, which are all expressed in terms of position number. By using 100 consecutive detected signals, we have 100 such kinds of feature coordinate. Then, by using these 100 feature coordinates as data points for the feature space in a hierarchical analysis, we seek the centroids of three largest clusters. Here, the x coordinates of the centroids represent the position numbers that could correspond to the intrusion positions for the three cases in Figure 2. The largest and the smallest position numbers of the three thus obtained then represent the two true intrusion positions as revealed by cases 1 and 2, respectively, and the position number between the largest and the smallest is false, which correspond to the time delay τ 2 + 2 τ 3 as revealed in case 3 of Figure 2. One hundred pairs of consecutive detected signals correspond to 100 data points in the feature space. We chose 100 data points because they correspond to detected signals acquired within 1 s time duration, and such time duration is considered to be proper here. If fewer data points are taken, the position of the centroid of each cluster in the second-step hierarchical analysis might be less accurate. In an opposite case with more data points, the positioning accuracy might be relatively high. However, the latter case refers to a longer positioning time required.
In this study, the 1036 m long sensing fiber of the DMZIs is continuously knocked at two positions to simulate simultaneous intrusions. The two intrusions occur simultaneously at two of the three positions that are at 1 m, 249 m and 643 m away from PBS2. These three positions correspond to position numbers of 0.02 (1 m), 4.98 (249 m), and 12.86 (643 m), respectively. That is, we consider three situations, i.e., intrusions occur simultaneously at positions 0.02 and 4.98 for situation 1, 0.02 and 12.86 for situation 2, and 4.98 and 12.86 for situation 3. When the sensing fiber is knocked in each situation, a series of IPD1 and IPD2 are obtained.

3. Experimental Results

3.1. Hierarchical Clustering Results for Intrusions at 0.02 and 4.98

Figure 3a,b shows the detected signal waveforms and their Fourier spectral amplitudes for the situation in which intrusions occur simultaneously at positions 0.02 and 4.98. Since the detected CW and CCW signals have a time delay between them, as revealed in the three cases of Figure 2, there is a phase shift spectrum that shows the dependence of time delay on frequency, and henceforth the dependence of position number on frequency, as shown in Figure 3c. On the other hand, from Figure 3b, we can see a spectrum of CP value, which is defined as a ratio of a given spectral amplitude to the summation of the spectral amplitudes over the frequency band of 2500 to 5000 Hz. The spectrum of CP value is shown in Figure 3d.
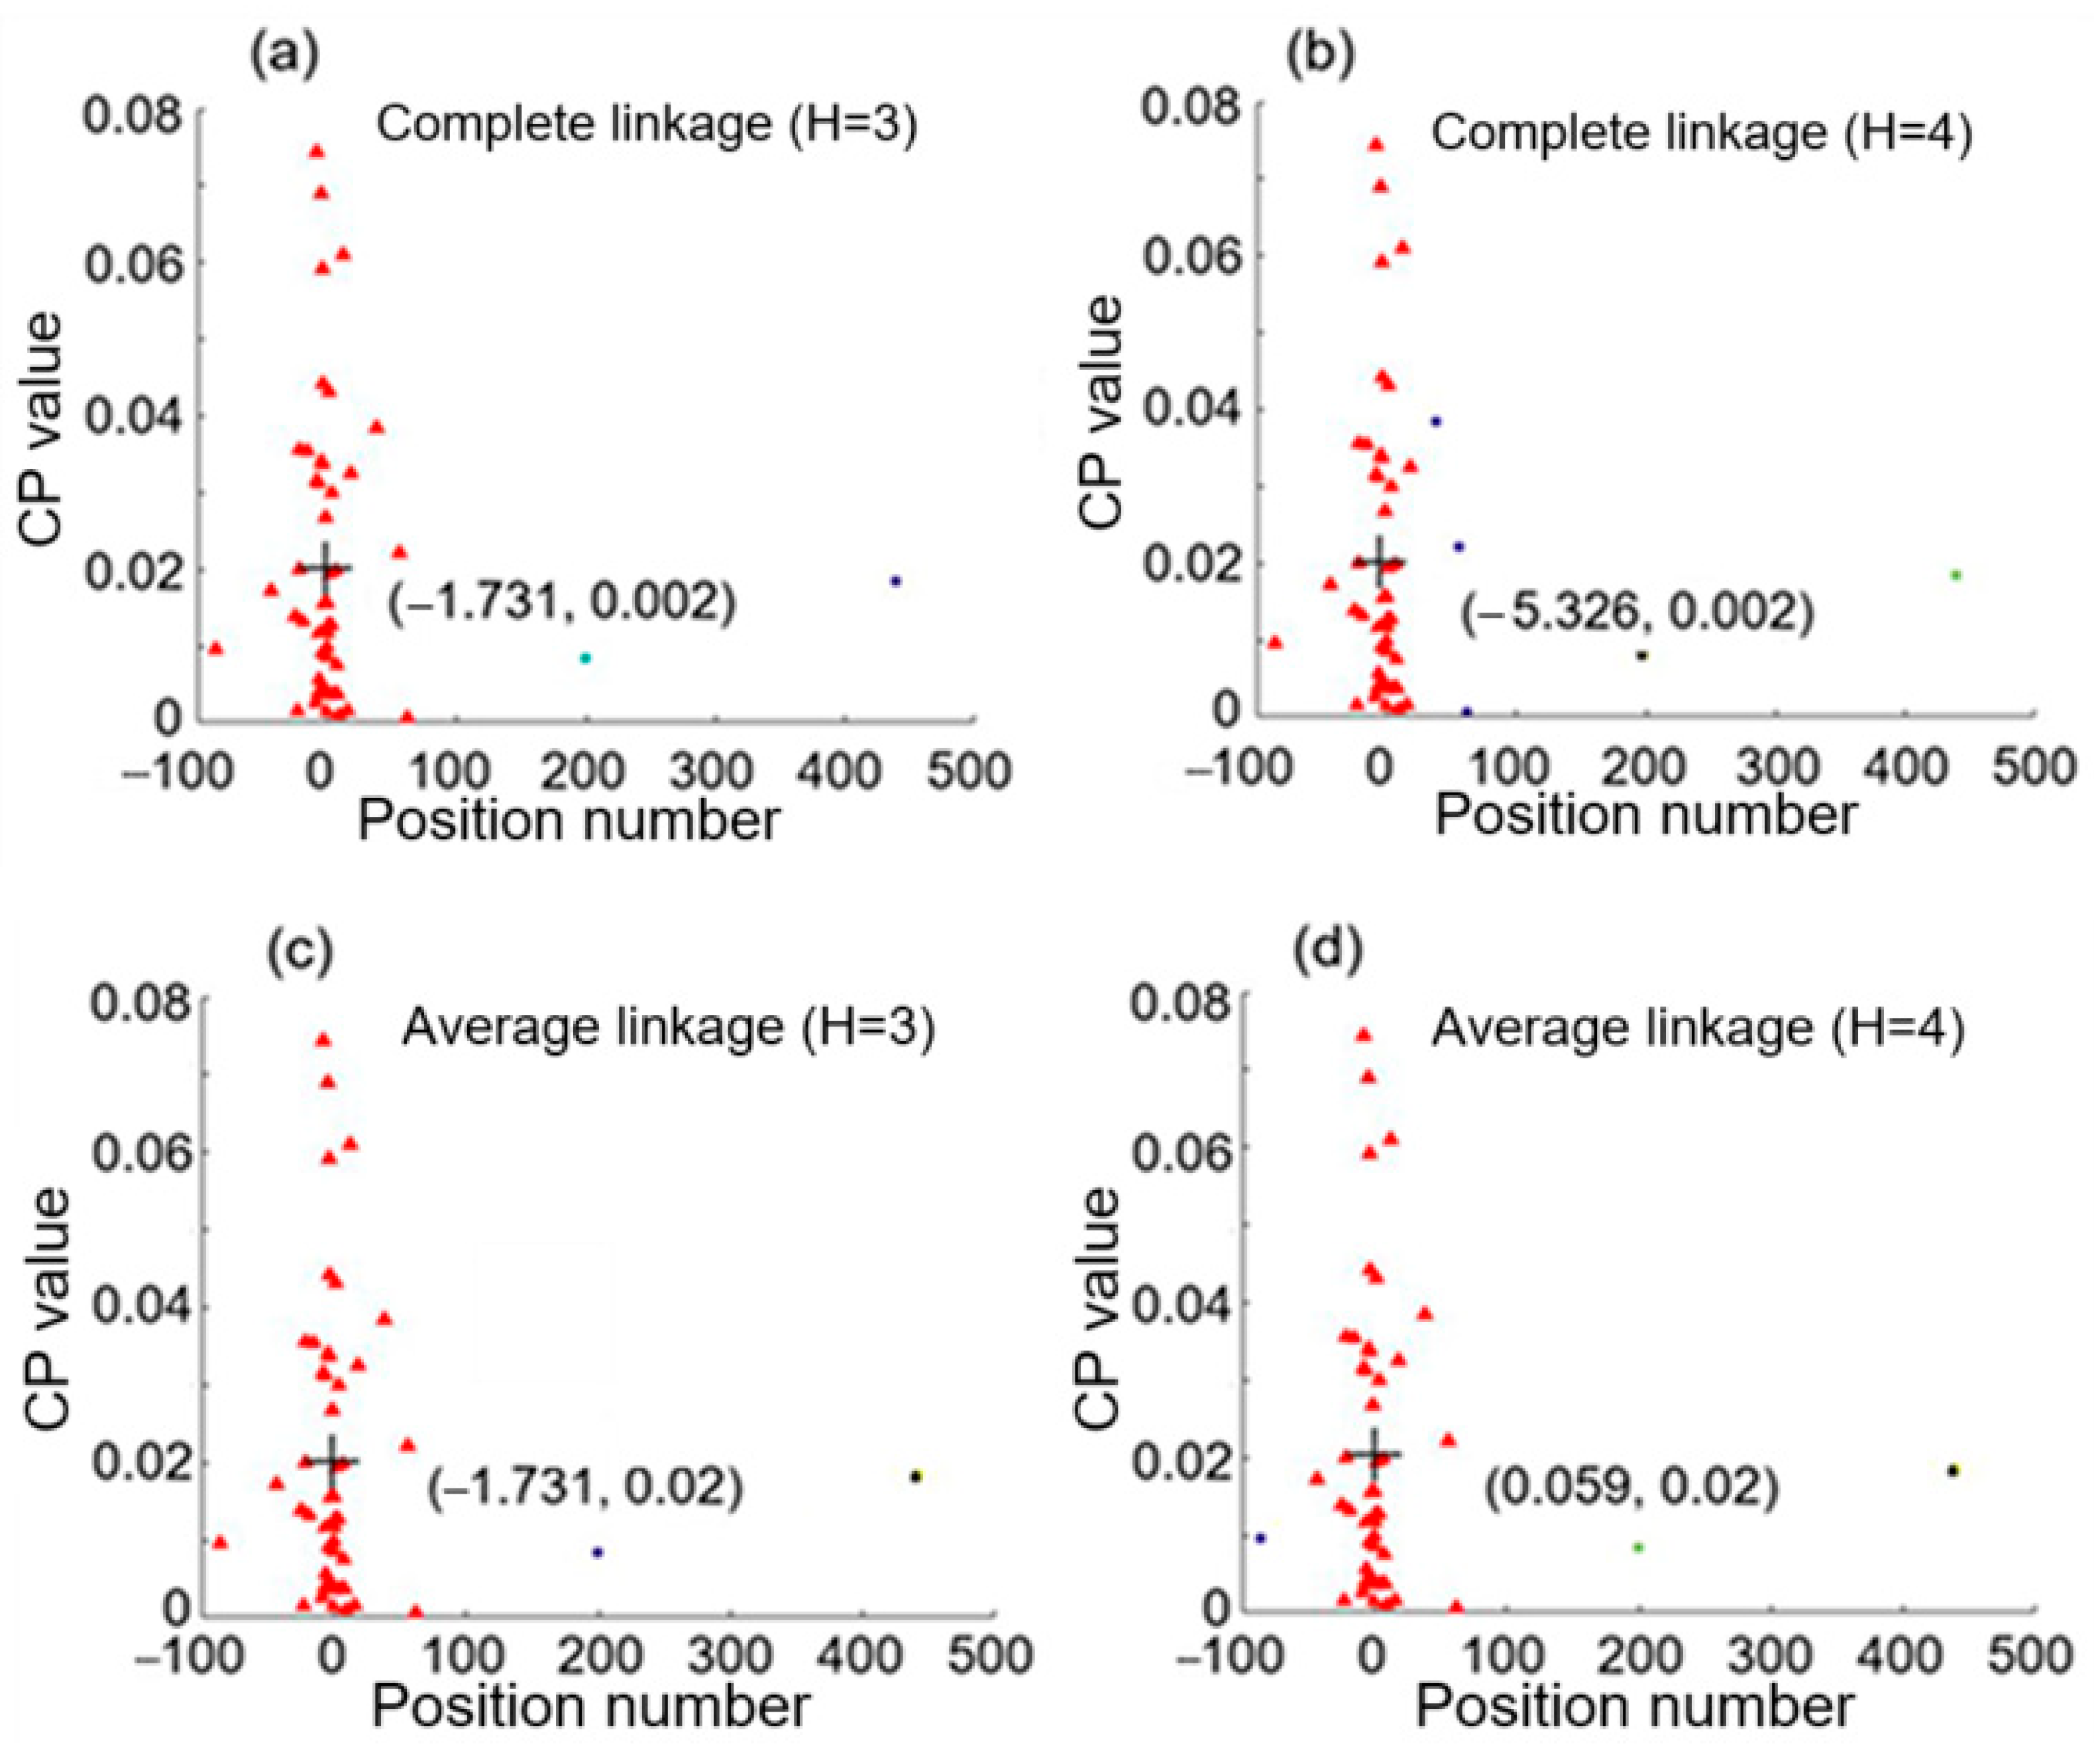
From Figure 3c,d, a position number at a given frequency reflects a CP value at that frequency. These two figures reveal that there is a relation between position number and CP value according to the spectral dependence. Therefore, they are used as a data point in the 2D feature space for hierarchical clustering analysis, and we will have 50 data points in the space, each corresponding to a specific frequency from 100 Hz to 5000 Hz at an interval of 100 Hz. Figure 4 shows the clustering results with complete linkage and average linkage used. Here the cluster numbers (i.e., the number of groups) H are chosen to be 3 and 4. Data points of different clusters are represented by different symbols, which have different shapes or colors for different clusters. The centroid of the largest group (or cluster) is marked by + and its coordinates are denoted. We can see that average linkage with H = 4 used in the clustering analysis revealed in Figure 4d gives the largest cluster having a centroid with the coordinates (0.059, 0.02), where the x coordinate 0.059 is close to 0.02 and represents only one intrusion event occurring as shown case 2 of Figure 2. In this case, the detected signals shown in Figure 3a yields only one single intrusion event occurring at position 0.059, which denotes a discrepancy of 0.039, i.e., 1.95 m in real distance, with respect to the real intrusion position 0.02. It is noted that this accurate result was obtained by using average linkage with H = 4, and that complete linkage or H = 3 cannot lead to such a result.
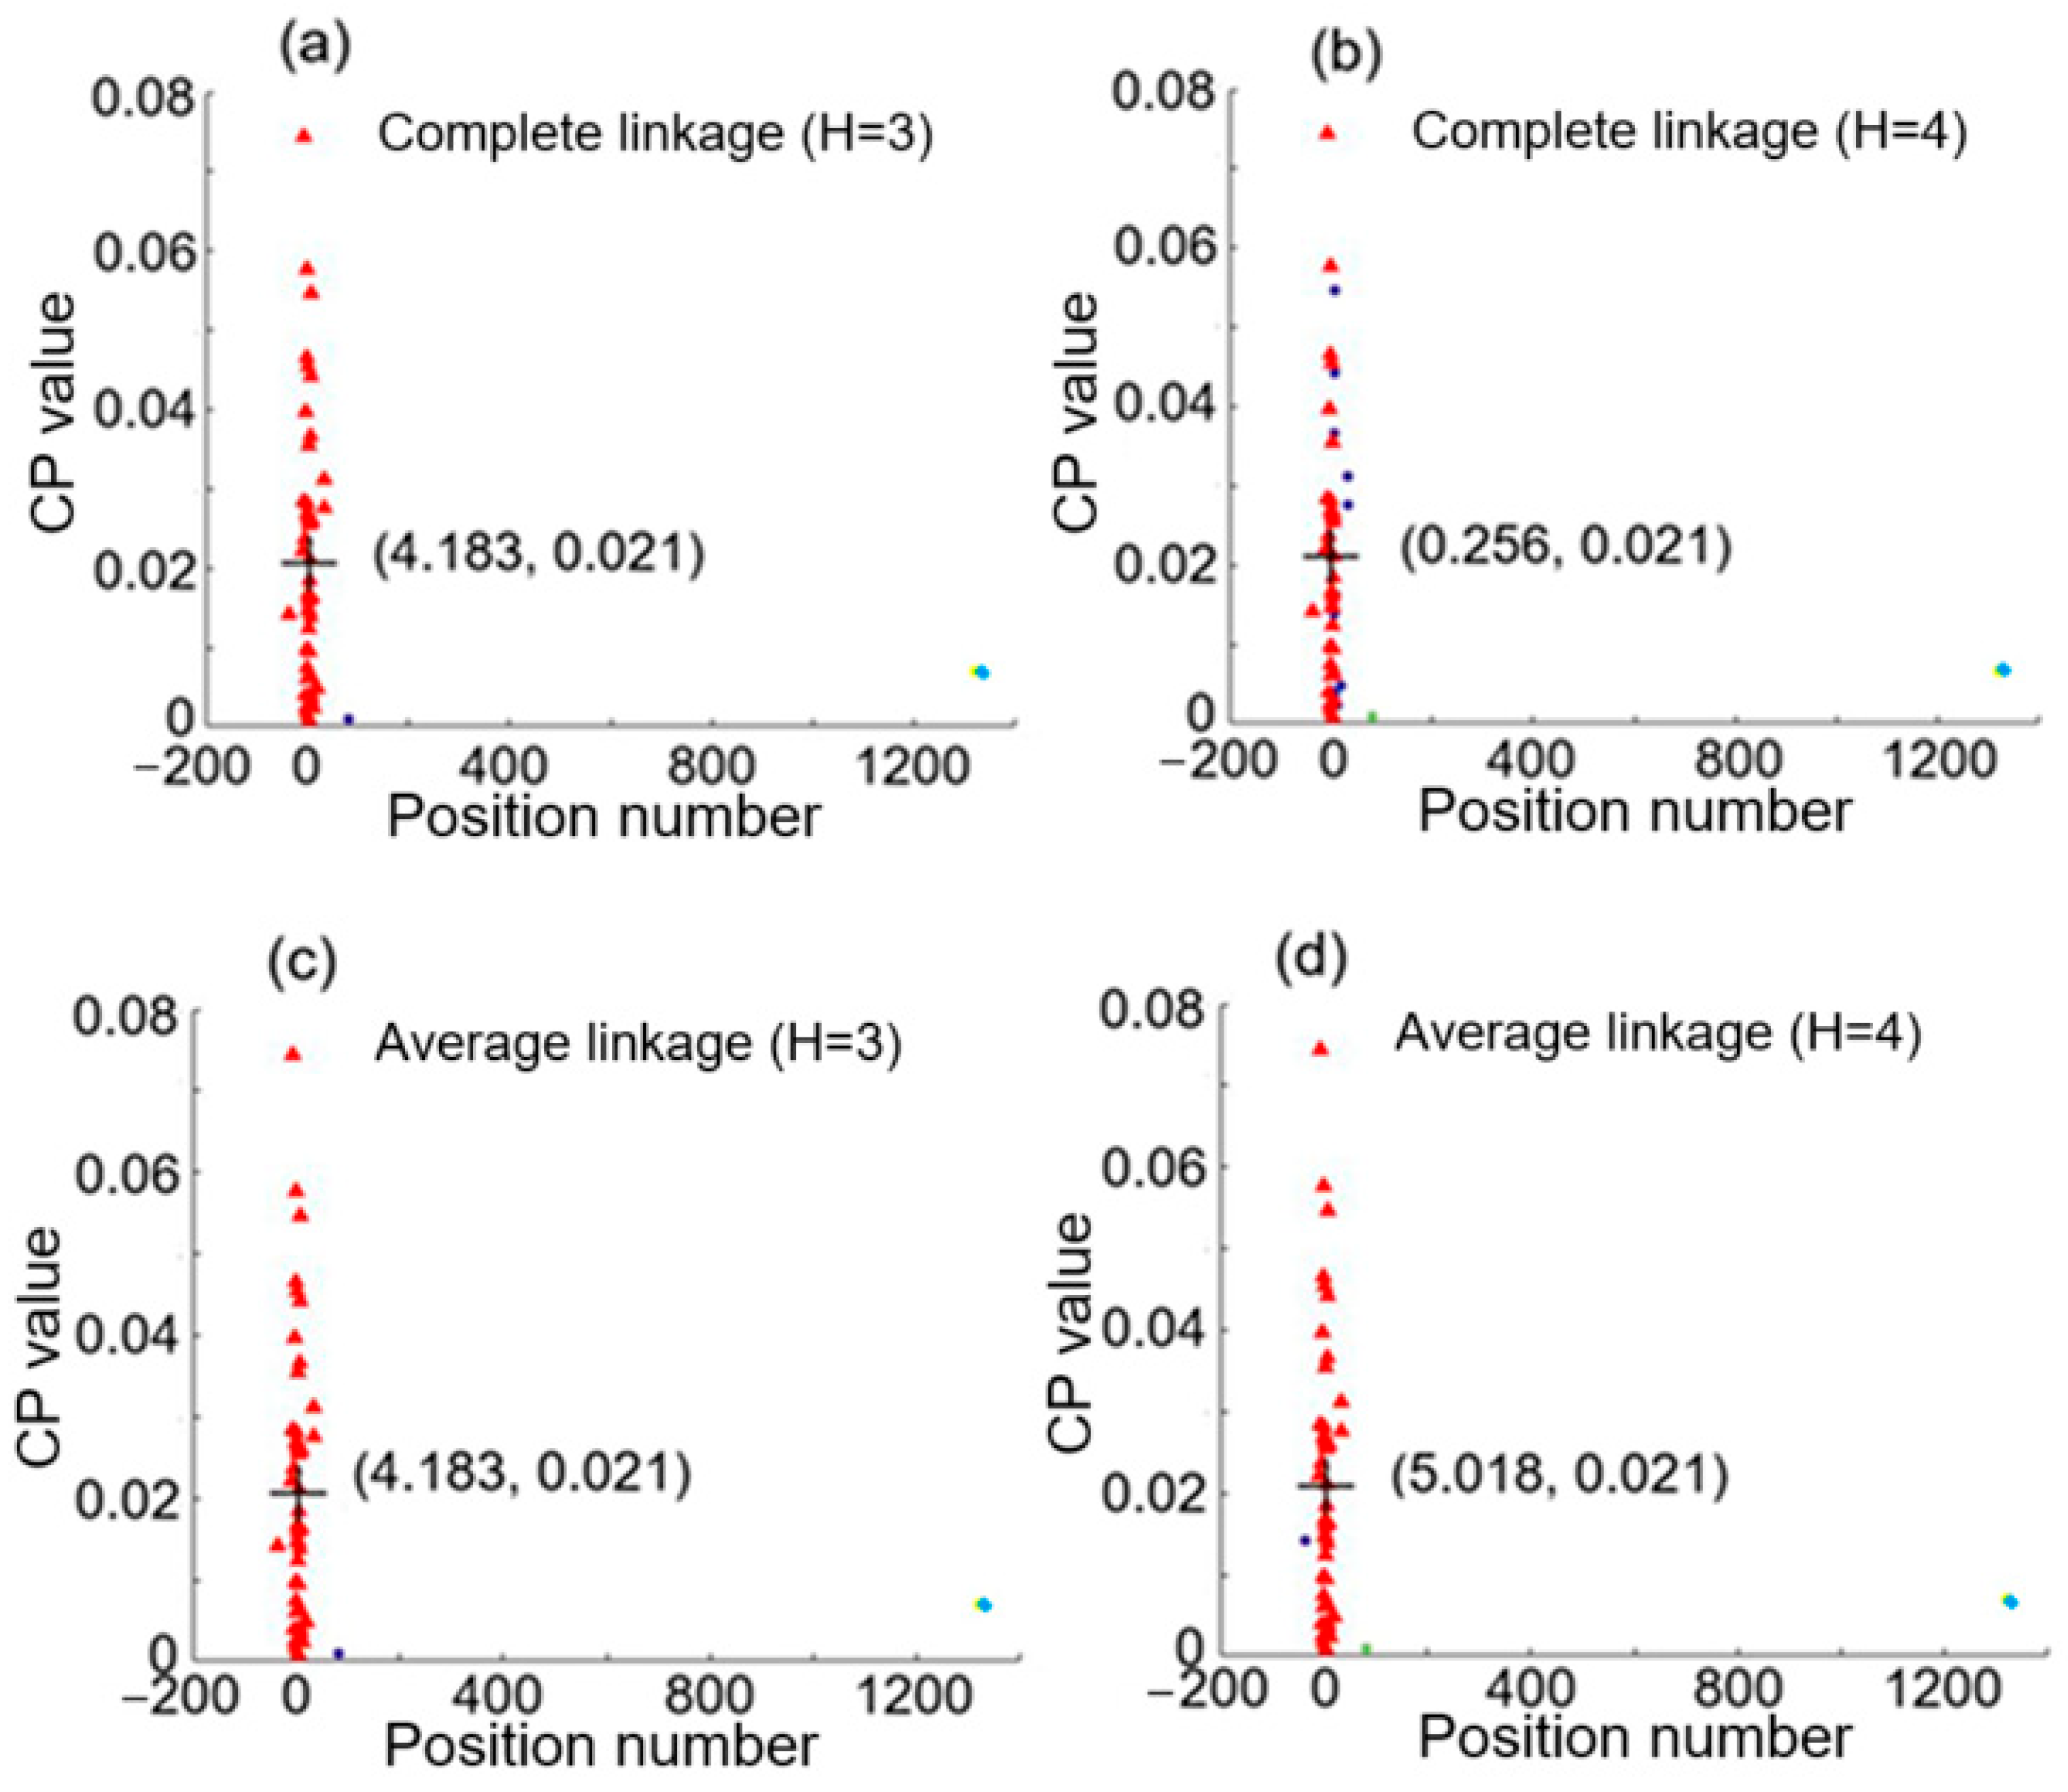
We then chose another pair of IPD1 and IPD2, and performed the hierarchical clustering analysis. Figure 5 shows the clustering results with complete linkage (H = 3 and 4) and average linkage (H = 3 and 4). Then, we found that average linkage using H = 4 gives centroid coordinates of (5.018, 0.021) for the largest cluster. The x coordinate 5.018 is quite close to 4.98, meaning that this pair of detected signals represents a single intrusion at position 5.016 with an error of 0.036 (i.e., an error of 1.8 m in real distance), as illustrated by case 1 of Figure 2.
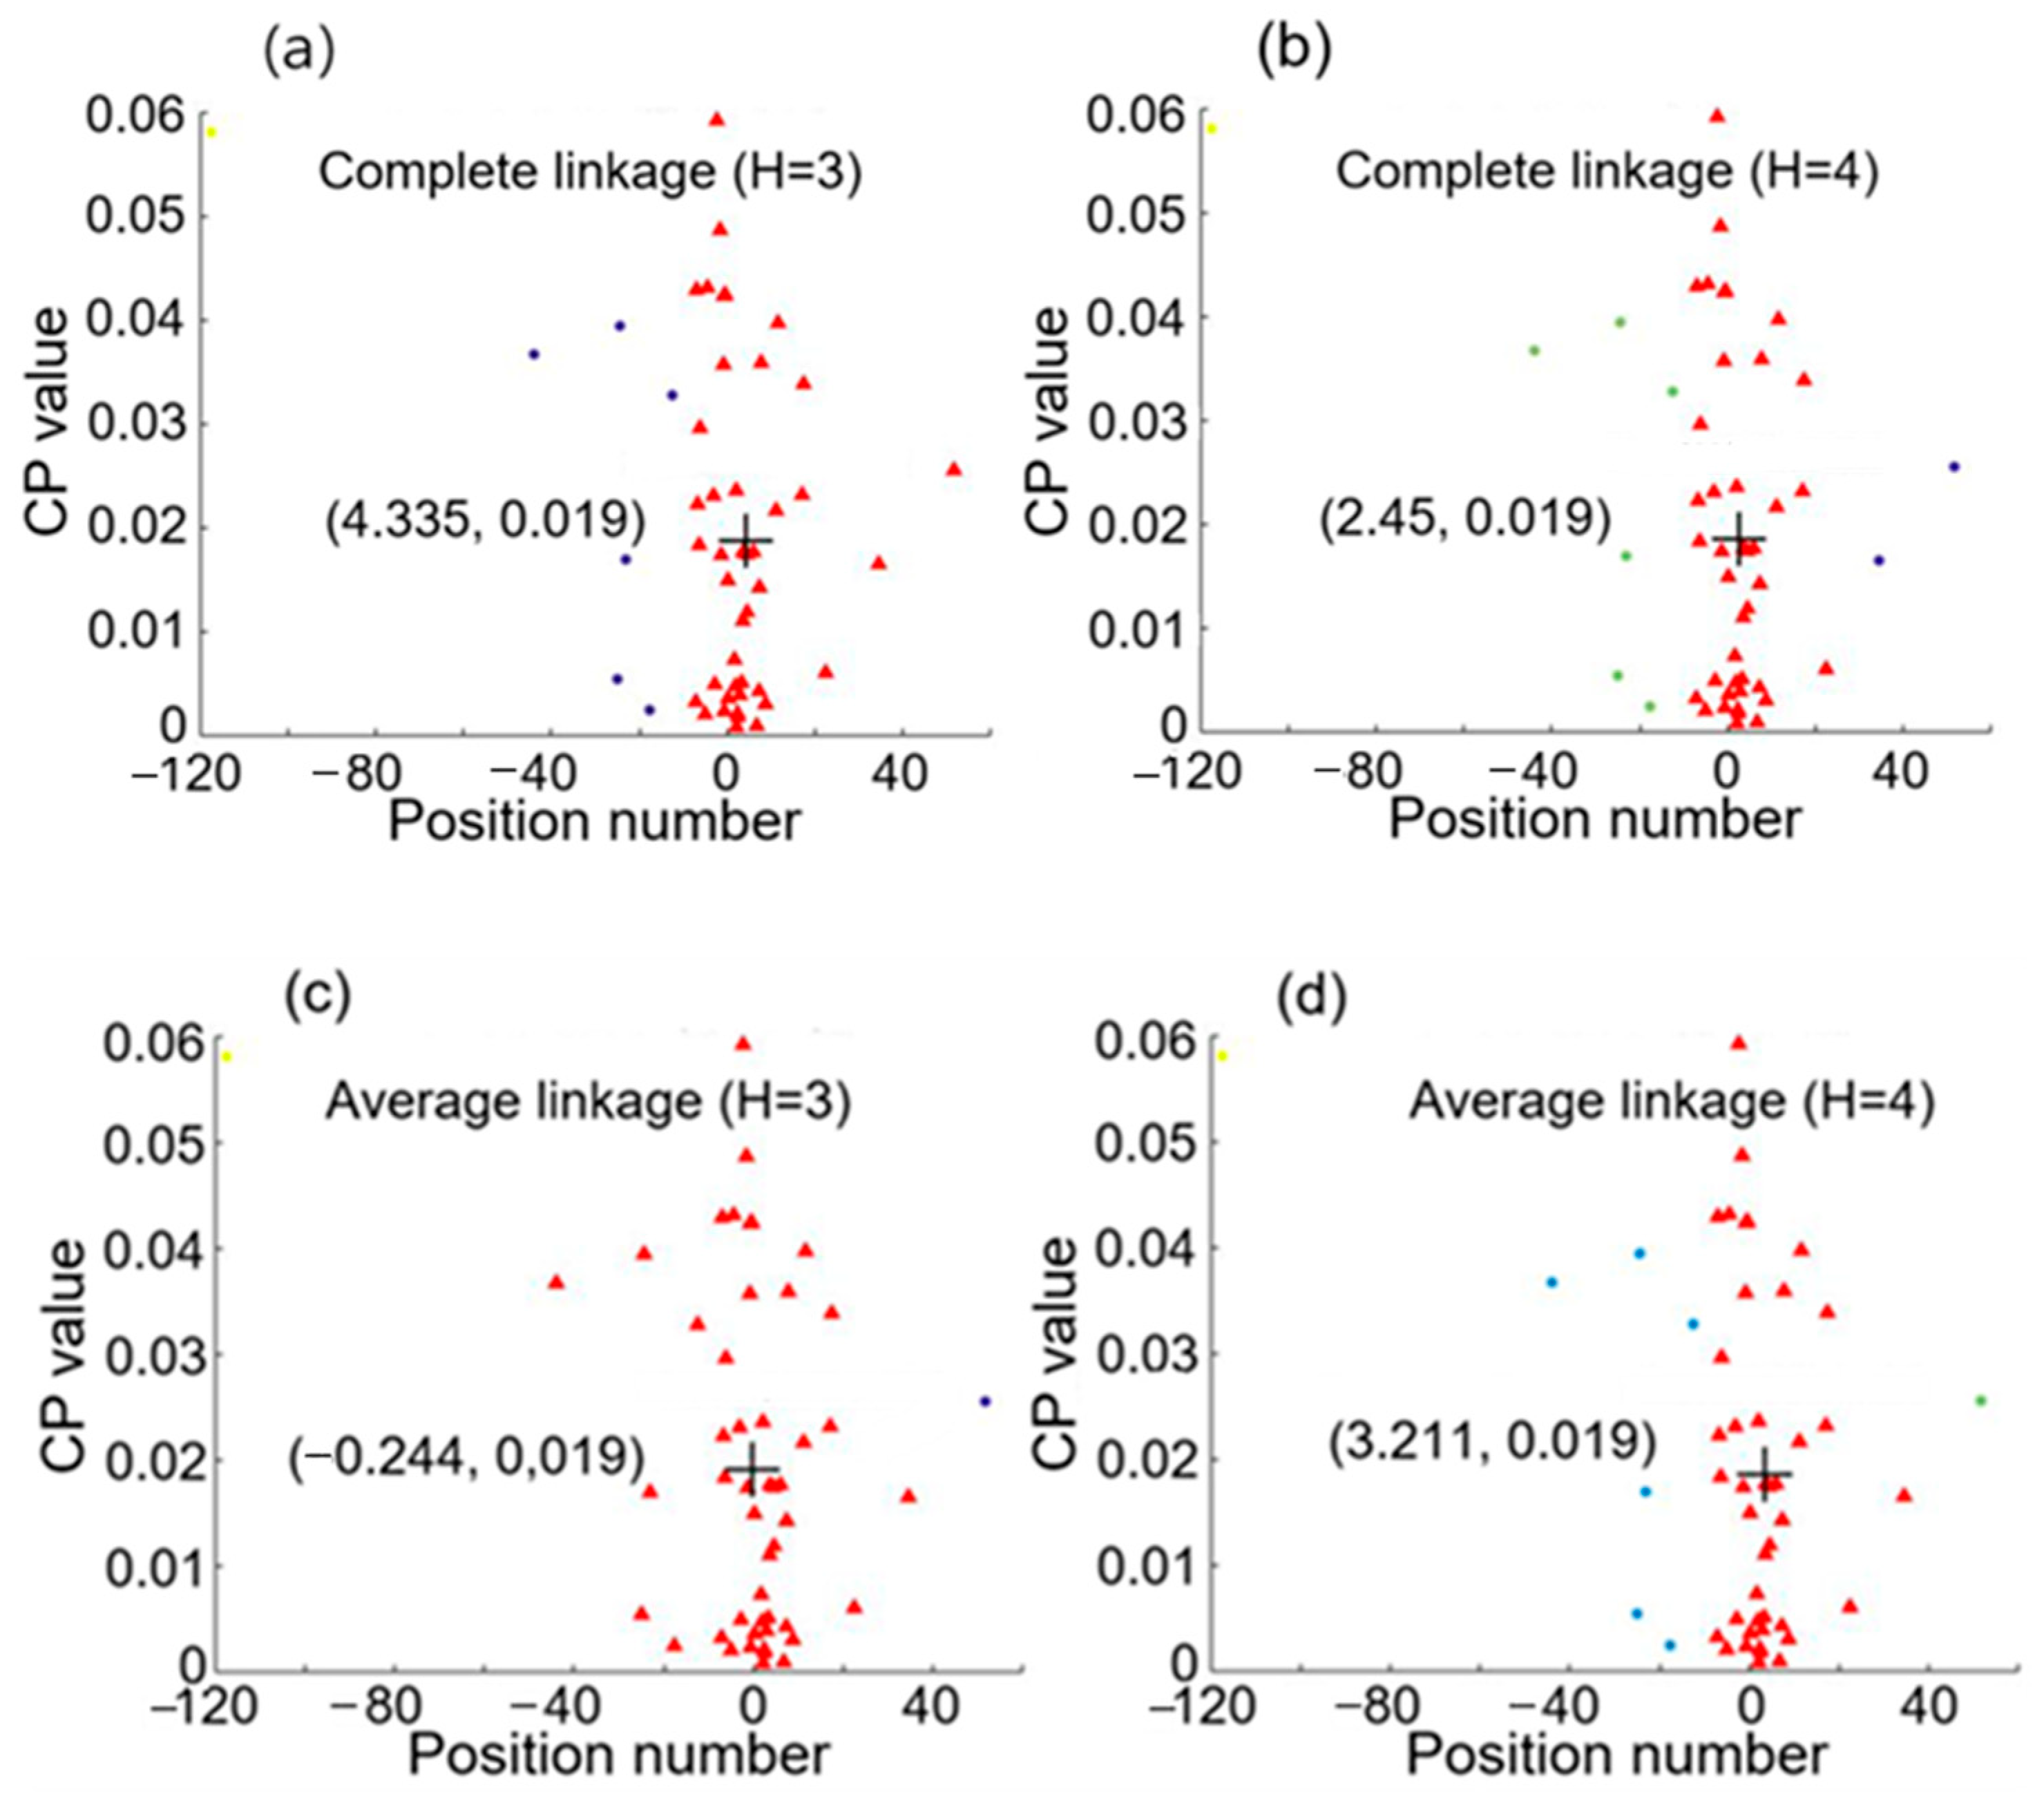
Then, again we chose another pair of IPD1 and IPD2, and performed the hierarchical clustering analysis. In this example, there is no position number approaching 0.02 and 4.98, and Figure 6b gives a centroid with its x coordinate approaching the average of 0.02 and 4.98, as is indicated by case 3 of Figure 2.
We also performed the first-step hierarchical clustering analysis when the sensing fibers were knocked simultaneously at two positions of 0.02 and 12.86 for situation 2, and 4.98 and 12.86 for situation 3. It was found that cases 1, 2 and 3 of Figure 2 existed for knocking at the two positions in situations 2 and 3. Then, we carried out an investigation such that the only partial band from 2000 Hz to 5000 Hz in the spectra of position number and CP value was considered and used to establish the 2D feature space with only 31 data points. This was carried out so that the intrusion position could be determined either to be more close to one of the two knocking positions, as revealed by cases 1 and 2 of Figure 2, or to be more close to the middle value of the two knocking positions, as indicated in case 3 of Figure 2, in the hierarchical clustering analysis, compared with the case when the full spectra of position number and CP value were used.
Next, we used 100 pairs of IPD1 and IPD2, consecutively acquired for every 1 s, to define the two intrusion positions. Each pair of detected signals is analyzed using complete linkage and average linkage with cluster number H = 3, 4, and 5, and considering the frequency band from 2000 Hz to 5000 Hz in the spectra of position number and CP value. In the hierarchical clustering analysis with each algorithm model, we then obtain 100 position numbers, which correspond to the three cases of Figure 2, and their associated CP values. Then, these 100 position numbers and CP values will be used for the second hierarchical clustering analysis with complete linkage and average linkage, using the cluster number H2 = 3, 4, 5, 6, 7, 8. In each of the second hierarchical clustering analysis, we will usually obtain the three largest clusters, and the x coordinates of their centroids correspond to the three cases of Figure 2. That is, we will have three position numbers, a smallest position number, a largest position number and an average value of the two position numbers. From interpretation of Figure 2, the smallest and the largest position number obtained are the two real intrusion positions, approximately, with little error. From this analysis, we can see which algorithm model (i.e., complete linkage or average linkage with an associated cluster number) achieves the best results.
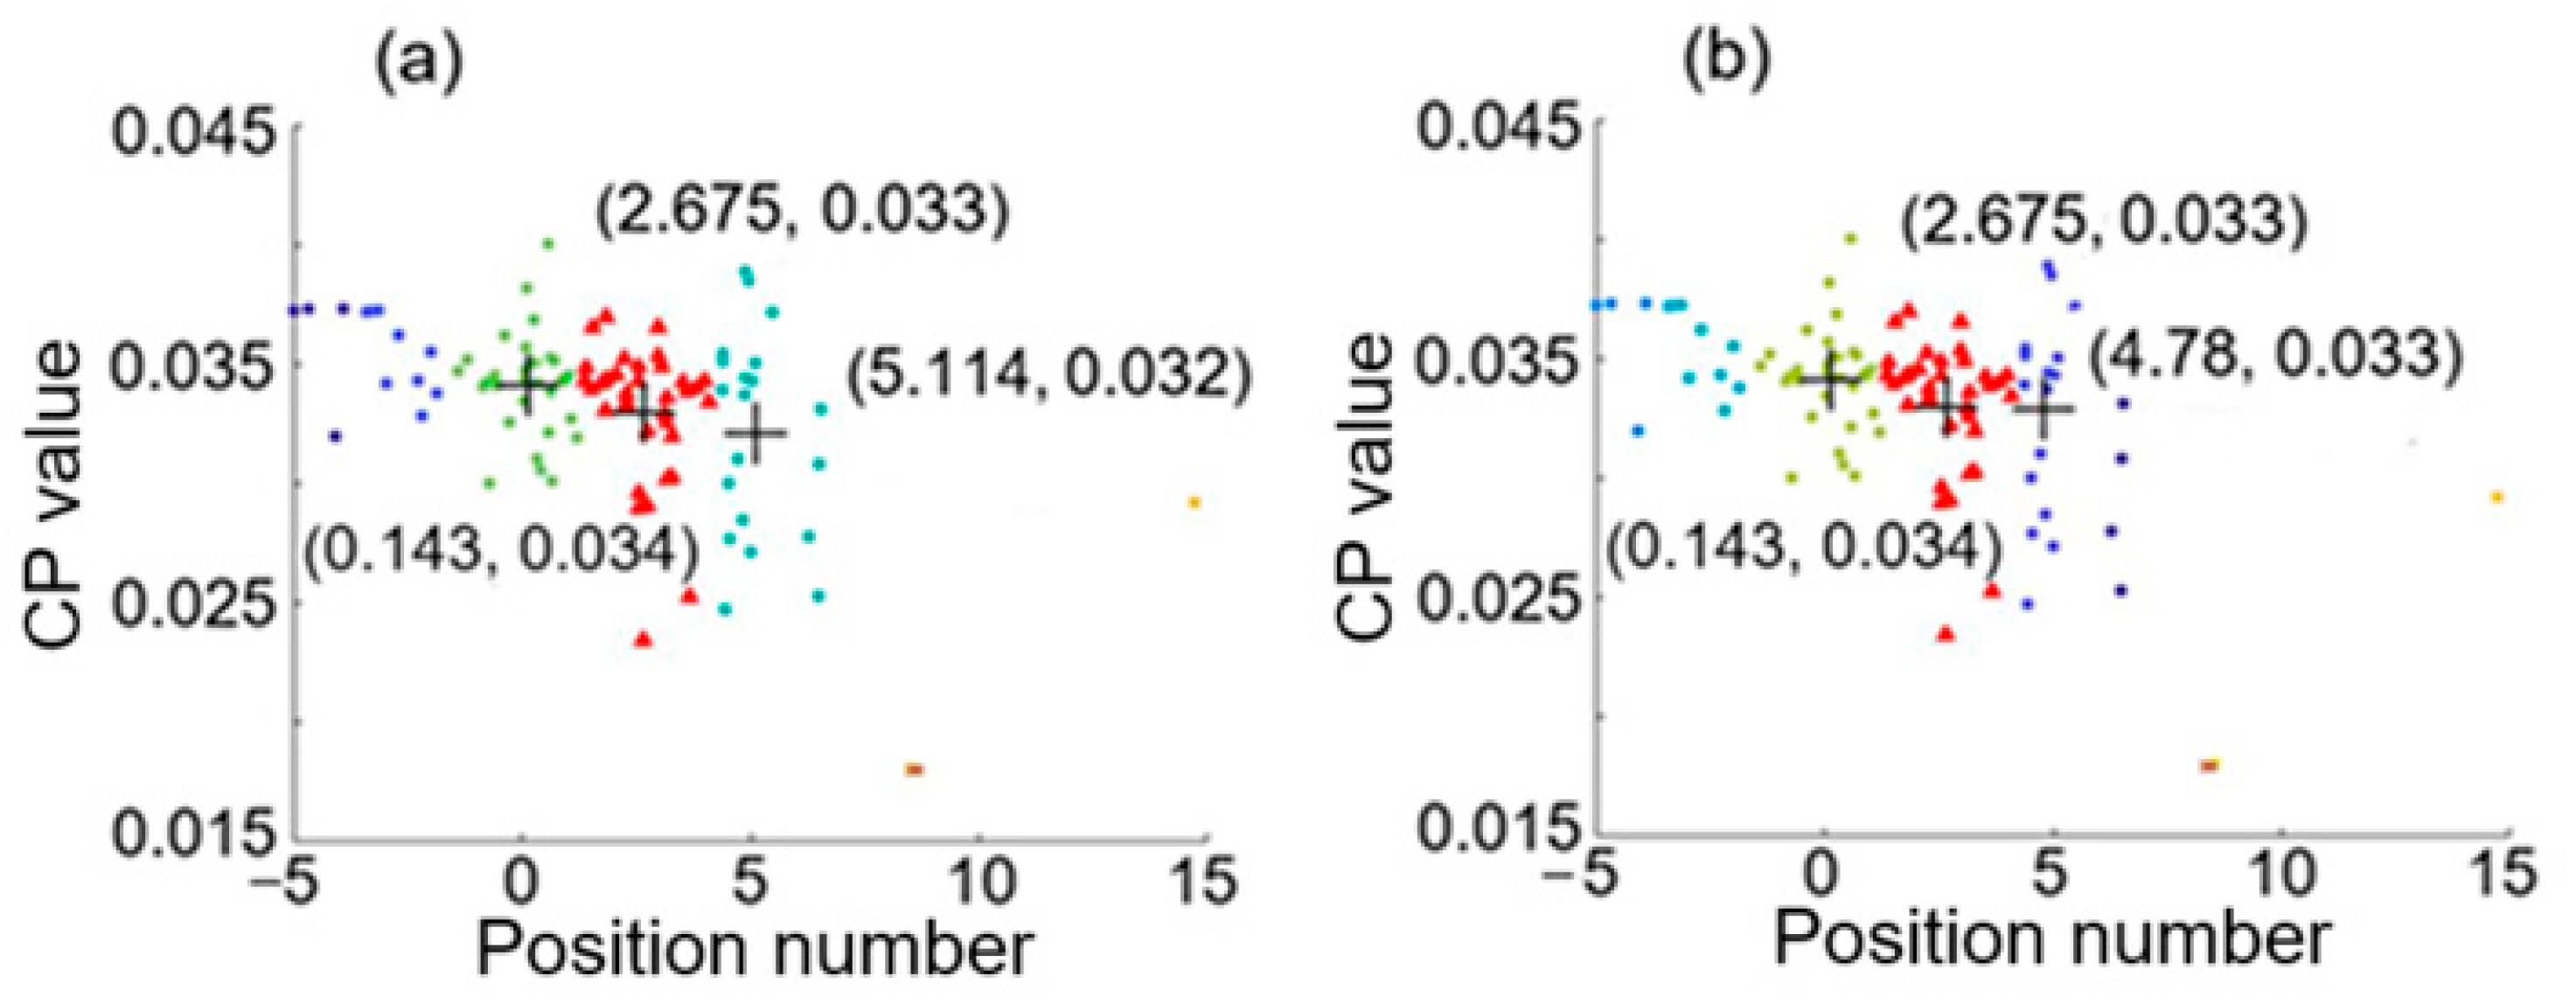
Figure 7 shows a feature space with the three largest clusters formed by using the first hierarchical clustering analysis with average linkage of H = 3 and the second hierarchical clustering analysis with (a) average linkage of H2 = 7 and (b) average linkage of H2 = 8, for the case of two intrusion positions at 0.02 and 4.98. From the smallest and largest values of the x coordinates of the three centroids marked by the symbol +, we can see that these results give 0.143 and 5.114 (or 4.78) for the two intrusion positions, and these estimated values are in a good agreement with the two real intrusion positions at 0.02 and 4.98.
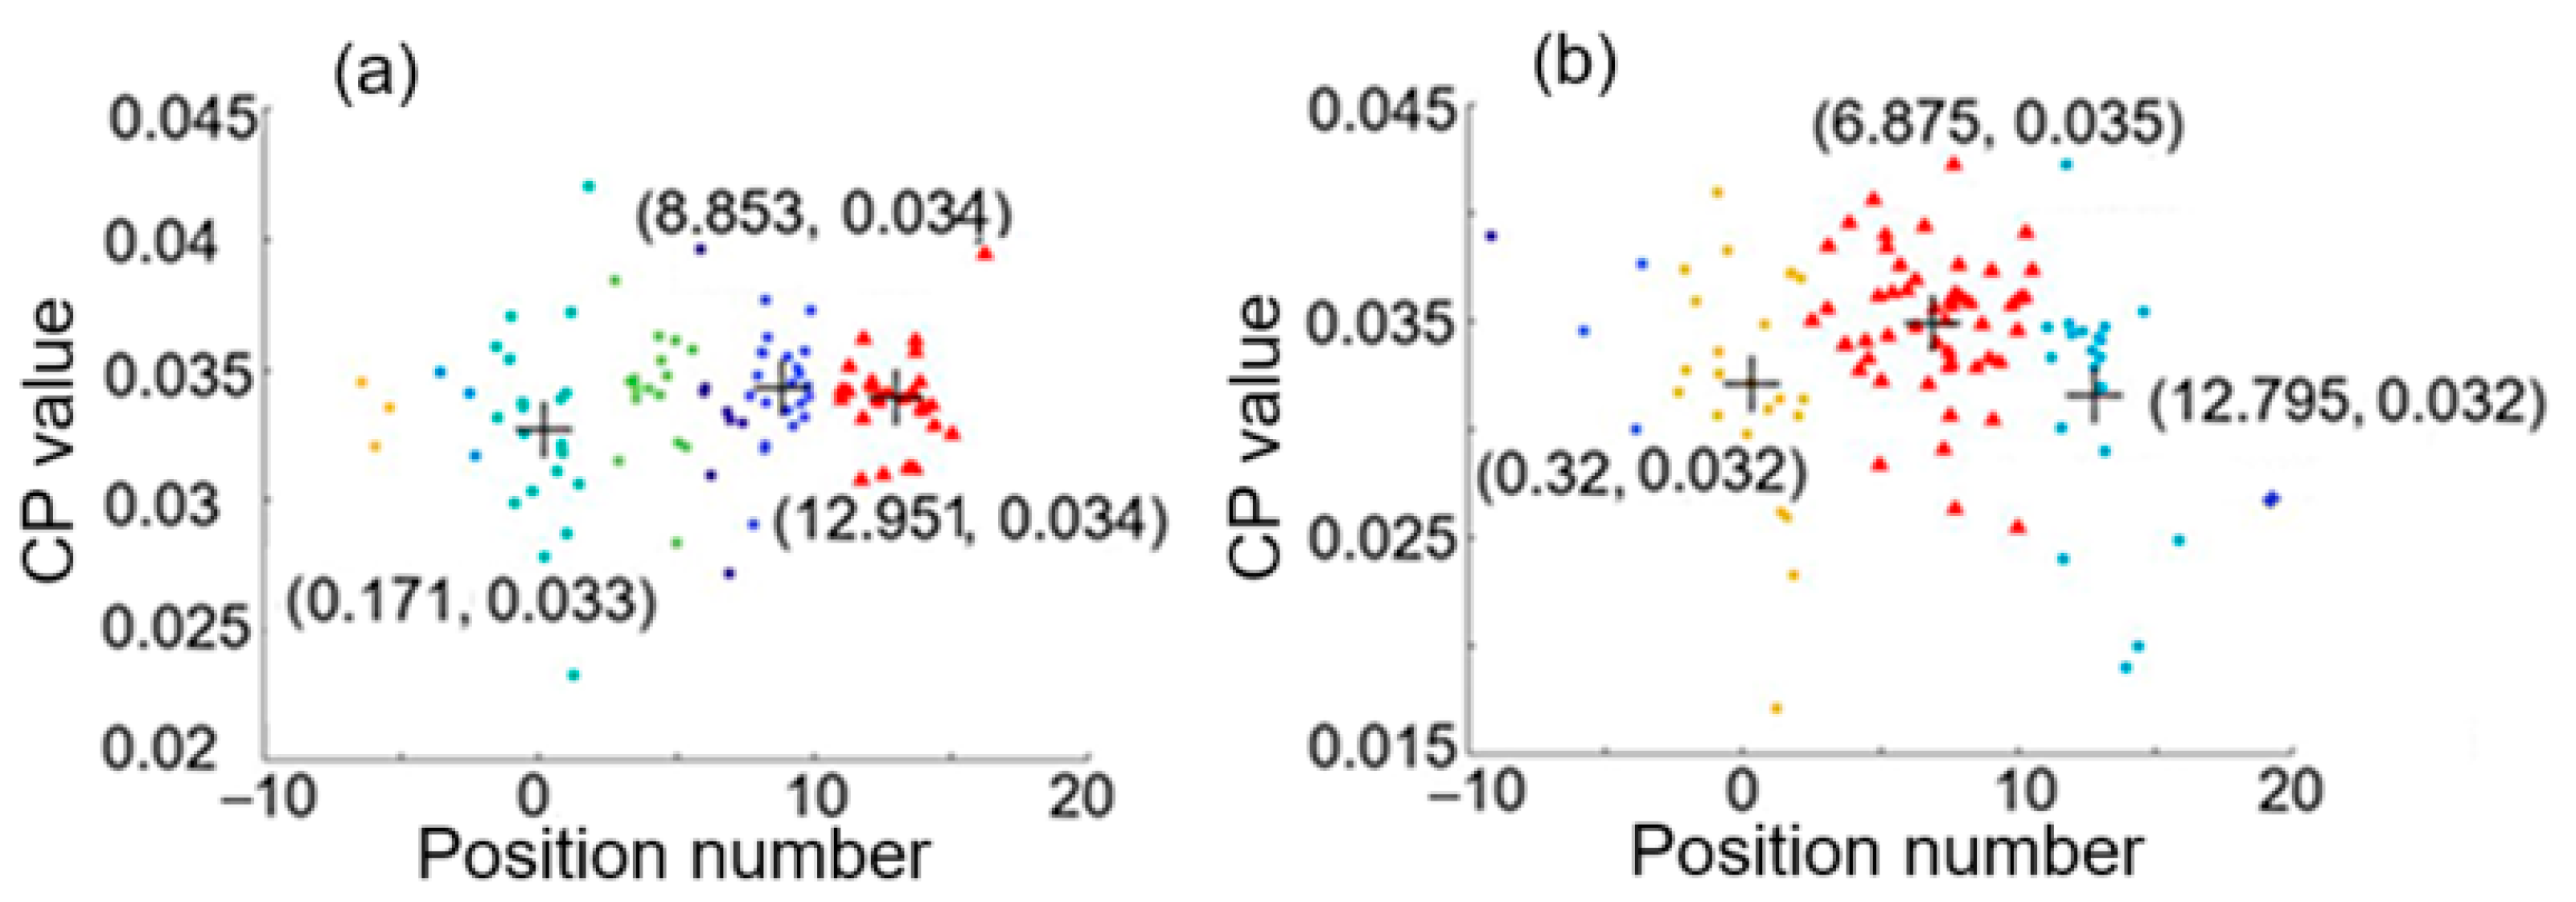
Figure 8 shows a feature space with the three largest clusters formed by using (a) the first hierarchical clustering analysis with average linkage of H = 3 and the second hierarchical clustering analysis with average linkage of H2 = 7, and by using (b) the first hierarchical clustering analysis with average linkage of H = 4 and the second hierarchical clustering analysis with average linkage of H2 = 6, for the case of two intrusion positions at 0.02 and 12.86. The two positions estimated are 0.171 and 12.951, respectively, as indicated by Figure 8a. The discrepancies between the real positions and the estimated positions are both small (smaller than 7.6 m in real distance).
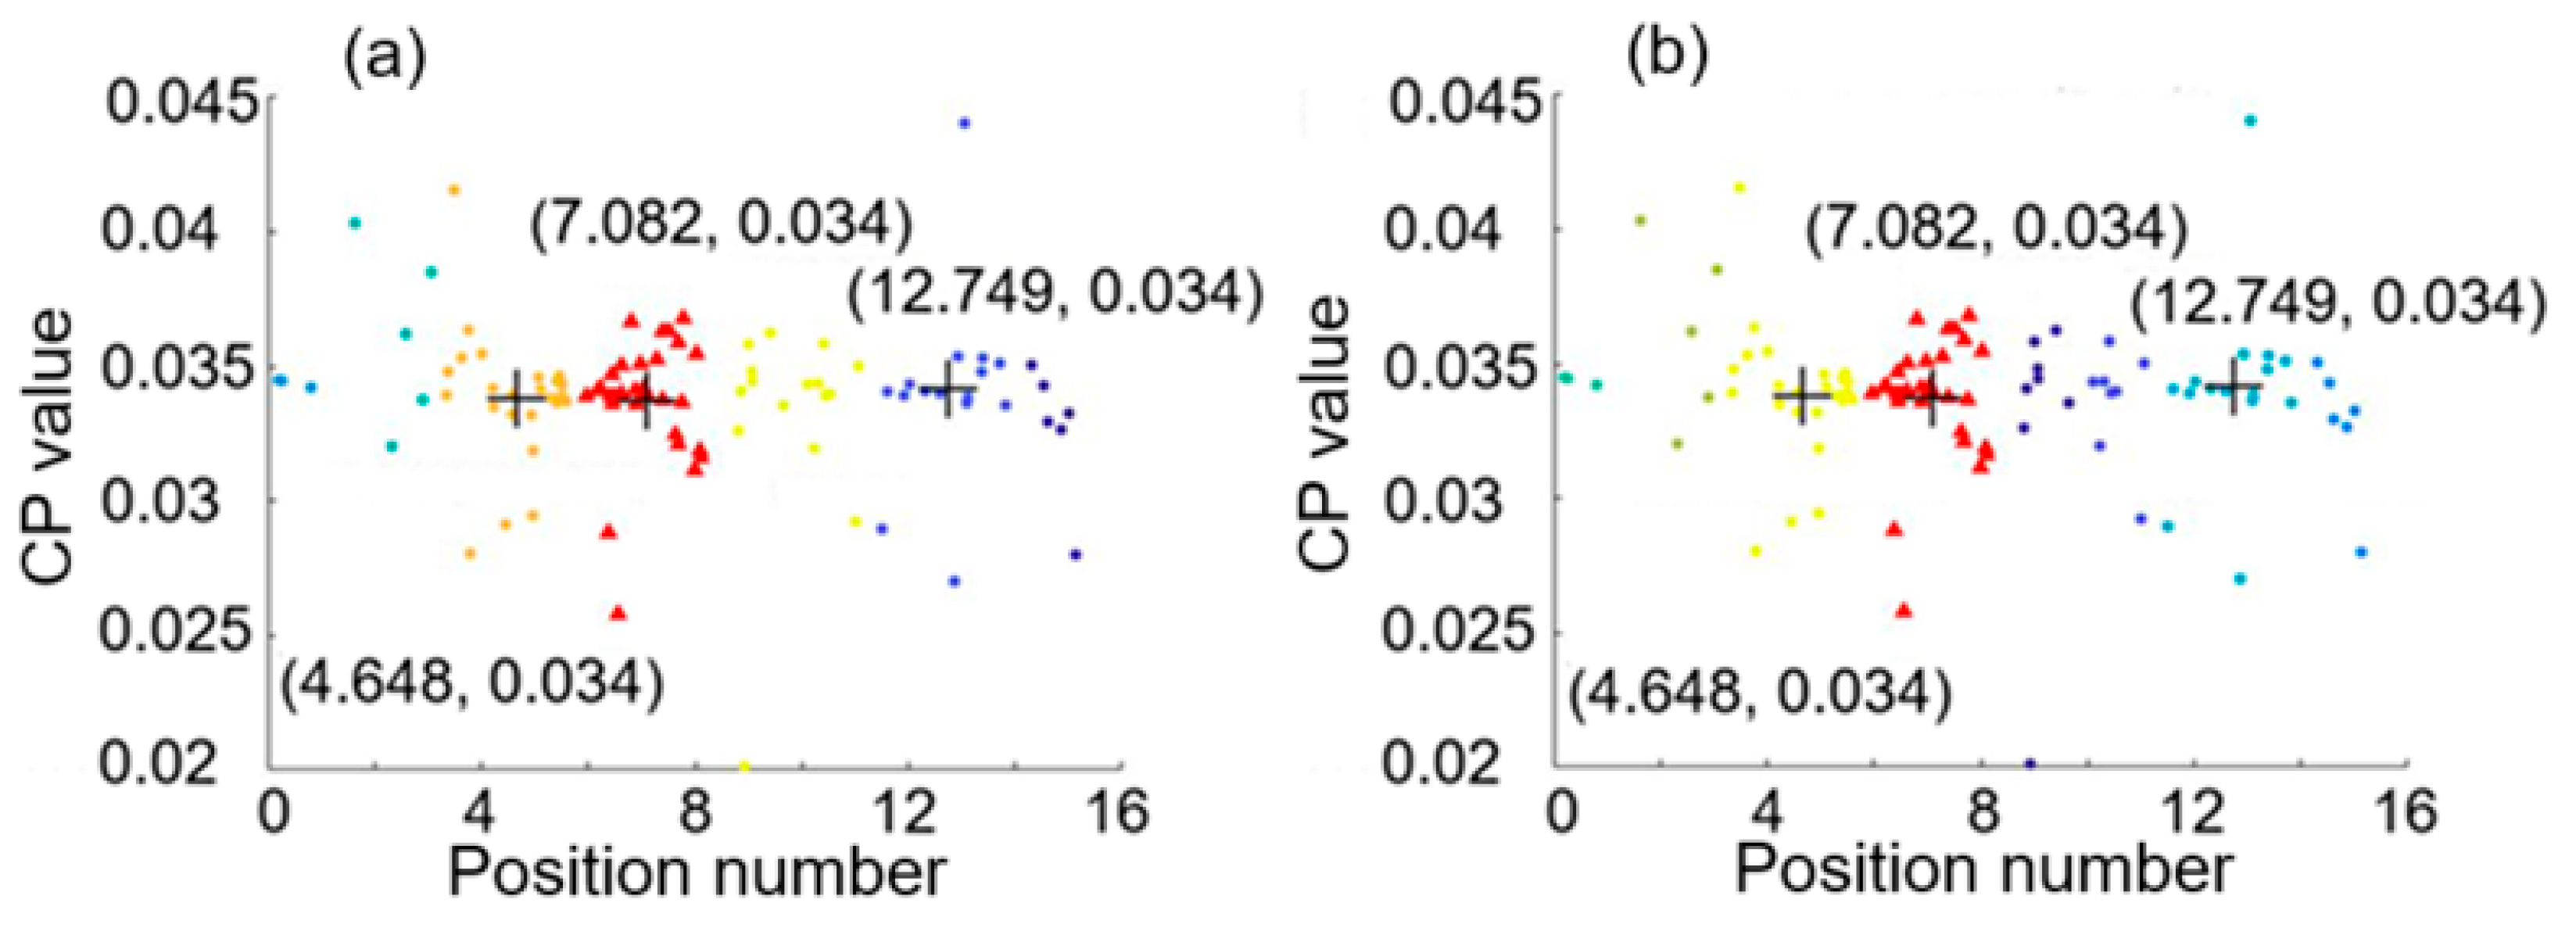
For the case of two intrusion positions at 4.98 and 12.86, the feature spaces with the three largest clusters formed by using the first hierarchical clustering analysis with average linkage of H = 3 and the second hierarchical clustering analysis with average linkage of H2 = 7 and average linkage of H2 = 8 are shown in Figure 9a and Figure 9b, respectively. The estimated positions are 4.684 and 12.749 from either Figure 9a or Figure 9b, which are close to the real positions 4.98 and 12.86, respectively.

3.2. Absolute Error in Positioning of Two Intrusion Events

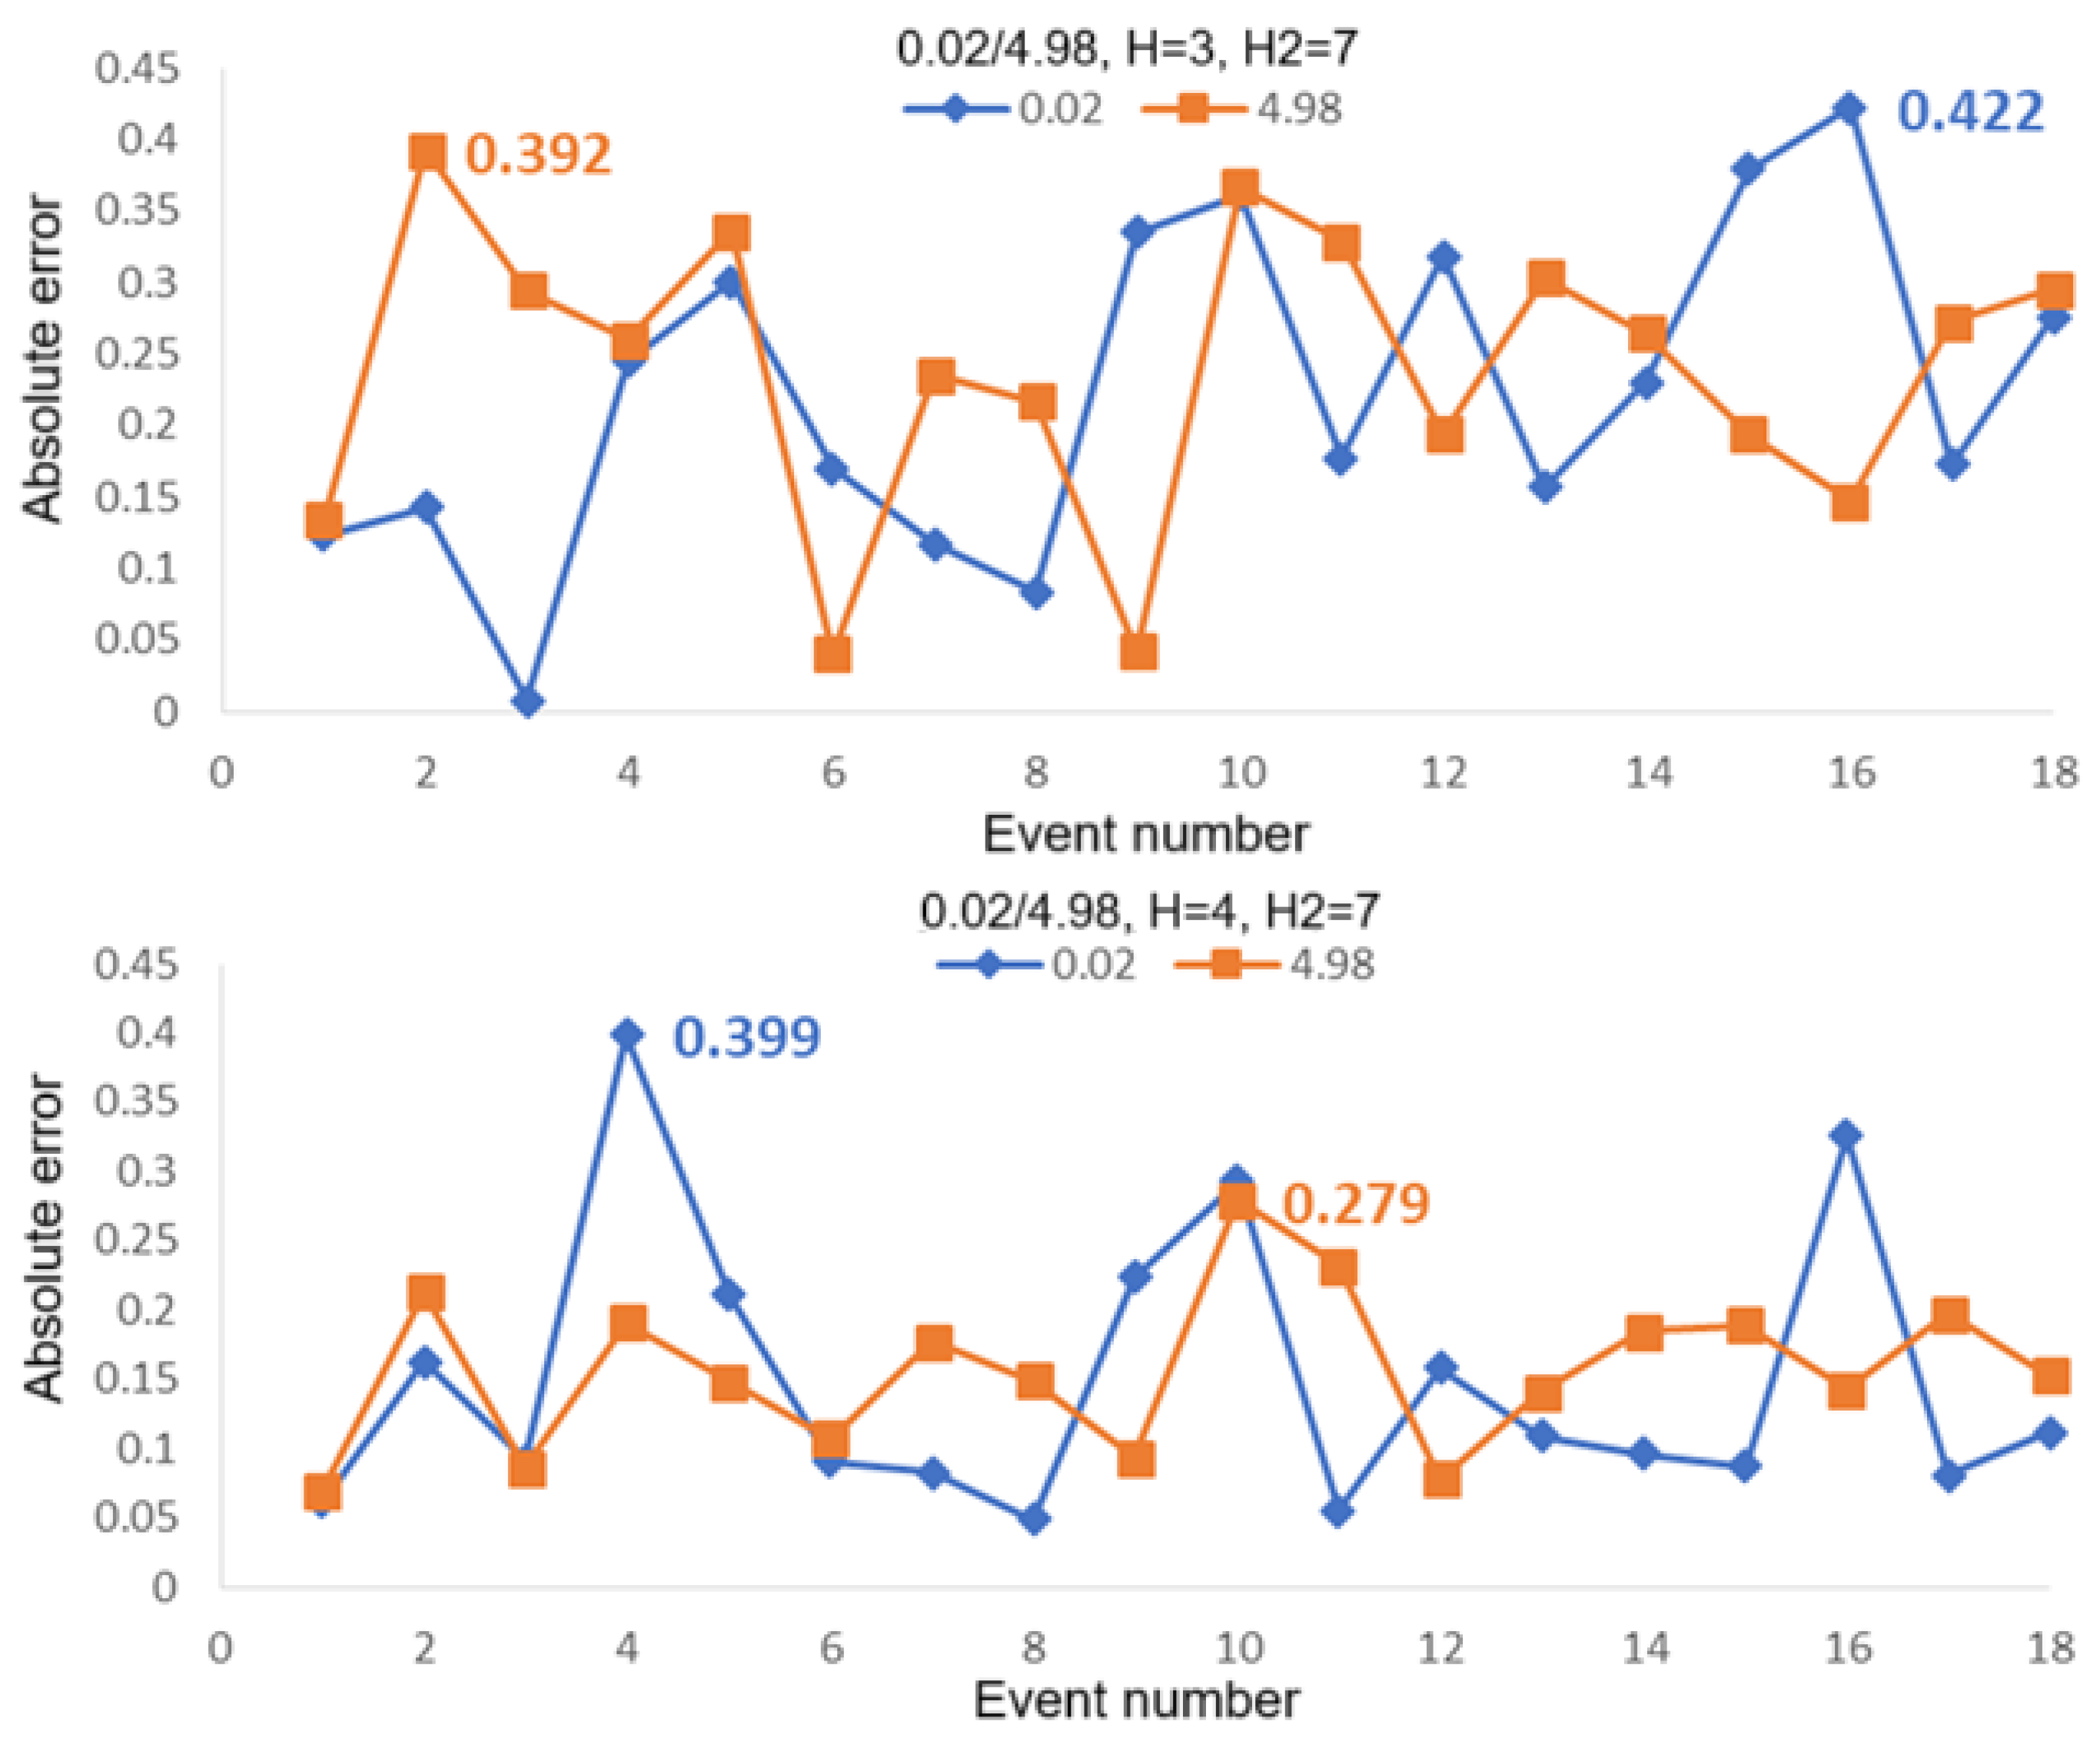
Note that, in this study, each intrusion event is assumed to last for one second, and 100 pairs of detected signals are acquired for two hierarchical clustering analyses. In the first hierarchical clustering analysis, each pair of detected signals was analyzed using complete linkage and average linkage with cluster number H = 3, 4, and 5 while, in the second hierarchical clustering analysis, 100 data points were analyzed using complete linkage and average linkage with the cluster number H2 = 3, 4, 5, 6, 7, 8. We knocked the sensing fibers simultaneously at two different positions to obtain 18 sets of detected signals with each set lasting for 1 s. That is, we disturbed the fibers 18 times and that represented 18 intrusion events simultaneously occurring at two positions. It was found that the first hierarchical clustering analysis with average linkage used for H = 3 and H = 4 could achieve the best positioning performance, together with the second hierarchical clustering analysis with average linkage for H2 = 7. Below, we use absolute error to define the magnitude of positioning discrepancy between the estimated intrusion position and the real intrusion position for each intrusion event. The absolute errors were computed by using the first hierarchical clustering analysis with average linkage for H = 3 and H = 4 and using the second hierarchical clustering analysis with average linkage for H2 = 7, and are shown in the following figures.
Figure 10 shows the computed absolute errors for the case of two intrusion positions of 0.02 and 4.98 for 18 intrusion events. Average linkage with H2 = 7 was used in the second hierarchical clustering analysis, while average linkage with H = 3 (upper figure) and H = 4 (lower figure) were used in the first hierarchical clustering analysis. It can be seen from this set of figures that the maximum absolute error for H = 3 is 0.422, corresponding to 21.1 m in real distance, and is 0.399 for H = 4, corresponding to 19.95 m in real distance. Figure 11 shows the computed absolute errors for the case of two intrusion positions of 0.02 and 12.86 for 18 intrusion events. The maximum absolute errors are 0.526 (corresponding to 26.3 m in real distance for H = 3) and 0.431 (corresponding to 21.55 m in real distance for H = 4). Figure 12 shows the computed absolute errors for the case of two intrusion positions of 4.98 and 12.86 for 18 intrusion events. The maximum absolute error is 0.474 for H = 3, corresponding to 23.7 m in real distance, while it is 0.386 (corresponding to 19.3 m in real distance) for H = 4. Here, the maximum absolute errors are all obtained by using average linkage in the first and the second hierarchical clustering analyses. It can be seen that, if we choose H = 4 in the first hierarchical clustering analysis, the maximum errors would be smaller compared with those for H = 3.

4. Conclusions and Discussion

A clustering analysis method has been used for determining the positions of two intrusion events simultaneously occurring at two different positions. The basic principle of this means of locating relies on the fact that there are three cases that can occur for the two simultaneous intrusions. By using a first hierarchical clustering analysis for every pair of CW and CCW detected signals that are acquired within 10 ms, we can obtain three results, and there are three positions found. Besides the two intrusion positions, we can find a position that is between these two. By denoting an intrusion event within 1 s, we then detect 100 pairs of CW and CCW signals by applying a second hierarchical clustering analysis to choose the correct two positions for the intrusion events. In a test of 18 sets of simultaneous intrusion events, we have the largest position error of 21.55 m if an average linkage with a cluster number of 4 in the first hierarchical clustering analysis and an average linkage with a cluster number of 7 in the second hierarchical clustering analysis are used.
To maintain a good interference visibility at the output end of the MZI, the x-polarized light at the upper arm and that at the lower arm must have equal power. Once good visibility is achieved, the shapes of the CCW and CW signals are the same, except for a time delay that corresponds to the disturbance location. To maintain an equal power between the two polarized lights over short lengths, the fiber cable that contains the sensing fibers cannot be bent randomly to avoid coupling between x and y polarizations in the fiber. However, it is inevitable that such coupling may occur over a long fiber that extends to regions with a varying temperature distribution.
To finding the centers of clustering in each step, we need to calculate the spectra of position number and CP values, as indicated by Figure 3c,d. Then we find the centroid of the cluster in the first step for processing each of the 100 pairs of signals, and the three centroids of the clusters would be found in the second step of the hierarchical clustering analysis. The computational cost required for implementing a real-time system with the two-step hierarchical clustering algorithm and intrusion positioning depends on software handling and memory required. Present computer science technology can handle this kind of work. Therefore, deploying a prompt positioning algorithm based on the two-step hierarchical clustering analysis is feasible.
The concept of quantum-enhanced sensing for a nonlinear interferometer was brought up to possibly improve the phase estimation accuracy of the interferometer [26] and could minimize the positioning error for DMZIs. Practical work for applying such a quantum-enhanced sensing theory to positioning of the intrusion events in DMZI remains as an interesting issue.

Author Contributions

Conceptualization, L.W.; methodology, L.W.; software, T.-W.C.; validation, T.-W.C.; formal analysis, L.W.; investigation, T.-W.C.; resources, T.-W.C.; data curation, T.-W.C.; writing—original draft preparation, L.W.; writing—review and editing, L.W.; visualization, L.W.; supervision, L.W.; project administration, L.W.; funding acquisition, L.W. All authors have read and agreed to the published version of the manuscript.

Funding

This research was funded by National Science and Technology Council, Taiwan, grant number MOST 111-2221-E-007-025.

Institutional Review Board Statement

Not applicable.

Informed Consent Statement

Not applicable.

Data Availability Statement

The data presented in this study are available in this article.

Conflicts of Interest

The authors declare no conflicts of interest.

References

  1. Wu, H.; Rao, Y.; Tang, C.; Wu, Y.; Gong, Y. A novel FBG-based security fence enabling to detect extremely weak intrusion signals from nonequivalent sensor nodes. Sens. Actuators A Phys. 2011, 167, 548–555. [Google Scholar] [CrossRef]
  2. Chen, Y.; Zhou, L.-X.; Liu, H.-L. A fiber Bragg grating sensor perimeter intrusion localization method optimized by improved particle swarm optimization algorithm. IEEE Sens. J. 2018, 18, 1243–1249. [Google Scholar] [CrossRef]
  3. Juarez, J.C.; Maier, E.W.; Choi, K.N.; Taylor, H.F. Distributed fiber-optic intrusion sensor system. J. Light. Technol. 2005, 23, 2081–2087. [Google Scholar] [CrossRef]
  4. Masoudi, A.; Belal, M.; Newson, T.P. A distributed optical fibre dynamic strain sensor based on phase-OTDR. Meas. Sci. Technol. 2013, 24, 085204. [Google Scholar] [CrossRef]
  5. Peng, F.; Wu, H.; Jia, X.-H.; Rao, Y.-J.; Wang, Z.-N.; Peng, Z.-P. Ultralong high-sensitivity Φ-OTDR for high spatial resolution intrusion detection of pipelines. Opt. Exp. 2014, 22, 13804–13810. [Google Scholar] [CrossRef]
  6. Aktas, M.; Akgun, T.; Demircin, M.U.; Buyukaydin, D. Deep learning based multi-threat classification for phase-OTDR fiber optic distributed acoustic sensing applications. In Proceedings of the SPIE Commercial + Scientific Sensing and Imaging, Anaheim, CA, USA, 9–13 April 2017; Volume 10208, pp. 75–92. [Google Scholar]
  7. Hong, X.; Wu, J.; Zuo, C.; Liu, F.; Guo, H.; Xu, K. Dual Michelson interferometers for distributed vibration detection. Appl. Opt. 2011, 50, 4333–4338. [Google Scholar] [CrossRef]
  8. Qin, L.; Wang, H.; Li, L.; Liang, S.; Zhong, X. Fiber-optic sensor based on Michelson interferometers for distributed disturbance detection. Infr. Laser Eng. 2015, 44, 205–209. [Google Scholar]
  9. Russell, S.J.; Brady, K.R.C.; Dakin, J.P. Real-time location of multiple time-varying strain disturbances, acting over a 40-km fiber section, using a novel dual-Sagnac interferometer. J. Light. Technol. 2001, 19, 205–213. [Google Scholar] [CrossRef]
  10. Xu, W.; Zhang, C.; Liang, S.; Li, L.; Lin, W.; Yang, Y. Fiber-optic distributed sensor based on a Sagnac interferometer with a time delay loop for detecting time-varying disturbance. Microw. Opt. Technol. Lett. 2009, 51, 2564–2567. [Google Scholar] [CrossRef]
  11. Chen, Q.; Jin, C.; Bao, Y.; Li, Z.; Li, J.; Lu, C.; Yang, L.; Li, G. A distributed fiber vibration sensor utilizing dispersion induced walk-off effect in a unidirectional Mach-Zehnder interferometer. Opt. Express 2014, 22, 2167–2173. [Google Scholar] [CrossRef]
  12. Liu, X.; Wang, Y.; Zhang, J.; Wang, D.; Lv, Y.; Zhang, M.; Jin, B.; Wang, Y. Pulse-modulated Mach–Zehnder interferometer for vibration location. Opt. Comm. 2019, 437, 27–32. [Google Scholar] [CrossRef]
  13. Spammer, S.; Swart, P.; Chtcherbakov, A. Merged Sagnac-Michelson interferometer for distributed disturbance detection. J. Light. Technol. 1997, 15, 972–976. [Google Scholar] [CrossRef]
  14. Chtcherbakov, A.A.; Swart, P.L.; Spammer, S.J. Mach–Zehnder and modified Sagnac-distributed fiber-optic impact sensor. Appl. Opt. 1998, 37, 3432–3437. [Google Scholar] [CrossRef] [PubMed]
  15. Chtcherbakov, A.A.; Swart, P.L.; Spammer, S.J.; Lacquet, B.M. Modified Sagnac/Mach-Zehnder interferometer for distributed disturbance sensing. Microw. Opt. Technol. Lett. 1999, 20, 34–36. [Google Scholar]
  16. Song, Q.; Zhou, P.; Peng, H.; Hu, Y.; Xiao, Q.; Wu, H.; Jia, B. Improved localization algorithm for distributed fiber-optic sensor based on merged Michelson-Sagnac interferometer. Opt. Express 2020, 28, 7207–7220. [Google Scholar] [CrossRef]
  17. Luo, G.; Zhang, C.; Li, L.; Ma, Z.; Lan, T.; Li, C.; Lin, W. Distributed fiber optic perturbation locating sensor based on dual Mach-Zehnder interferometer. In Proceedings of the International Symposium on Photoelectronic Detection and Imaging: Technology and Applications, Beijing, China, 9–12 September 2007; Volume 6622, pp. 66220z1–66220z7. [Google Scholar]
  18. Tu, D.; Xie, S.; Jiang, Z.; Zhang, M. Ultra long distance distributed fiber-optic system for intrusion detection. In Proceedings of the Advanced Sensor Systems and Applications V, Beijing, China, 5–9 November 2012; Volume 8561, pp. 354–359. [Google Scholar]
  19. Chen, Q.; Liu, T.; Liu, K.; Jiang, J.; Ding, Z.; Zhang, L.; Li, Y.; Pan, L.; Ma, C. An elimination method of polarization-induced phase shift and fading in dual Mach–Zehnder interferometry disturbance sensing system. J. Light. Technol. 2013, 31, 3135–3141. [Google Scholar] [CrossRef]
  20. Ma, C.; Liu, T.; Liu, K.; Jiang, J.; Ding, Z.; Pan, L.; Tian, M. Long-range distributed fiber vibration sensor using an asymmetric dual Mach–Zehnder interferometers. J. Light. Technol. 2016, 34, 2235–2239. [Google Scholar] [CrossRef]
  21. Huang, J.; Chen, Y.; Song, Q.; Peng, H.; Zhou, P.; Xiao, Q.; Jia, B. Distributed fiber-optic sensor for location based on polarization-stabilized dual-Mach-Zehnder interferometer. Opt. Express 2020, 28, 24820–24832. [Google Scholar] [CrossRef]
  22. Ho, H.-R.; Hsieh, C.-Y.; Hsu, Y.-C.; Wang, L. Modified dual Mach-Zehnder interferometers with new locating algorithm for intrusion detection. Opt. Express 2021, 29, 34341–34359. [Google Scholar] [CrossRef]
  23. Li, M.-C.; Wang, L. Dual Mach-Zehnder Interferometers with hierarchical clustering analysis method applied for positioning the intrusion. IEEE Sens. J. 2022, 23, 1179–1190. [Google Scholar] [CrossRef]
  24. Sun, Q.; Liu, D.; Wang, J.; Liu, H. Distributed fiber-optic vibration sensor using a ring Mach-Zehnder interferometer. Optics Comm. 2008, 281, 1538–1544. [Google Scholar] [CrossRef]
  25. Zhang, C.; Li, Q.; Liang, S.; Lin, W.; Li, L.; Zhong, X. Location algorithm for multi-disturbances in fiber-optic distributed disturbance sensor using a Mach-Zehnder interferometer. In Proceedings of the 9th International Conference on Optical Communications and Networks, Nanjing, China, 24–27 October 2010; pp. 102–107. [Google Scholar]
  26. Abouelkhir, N.-E.; Slaoui, A.; Saidi, E.H.; Laamara, R.A.; El Hadfi, H. Enhancing phase sensitivity in Mach-Zehnder interferometer with various detection schemes using SU(1,1) coherent states. J. Opt. Soc. Am. B 2025, 42, 495–508. [Google Scholar] [CrossRef]
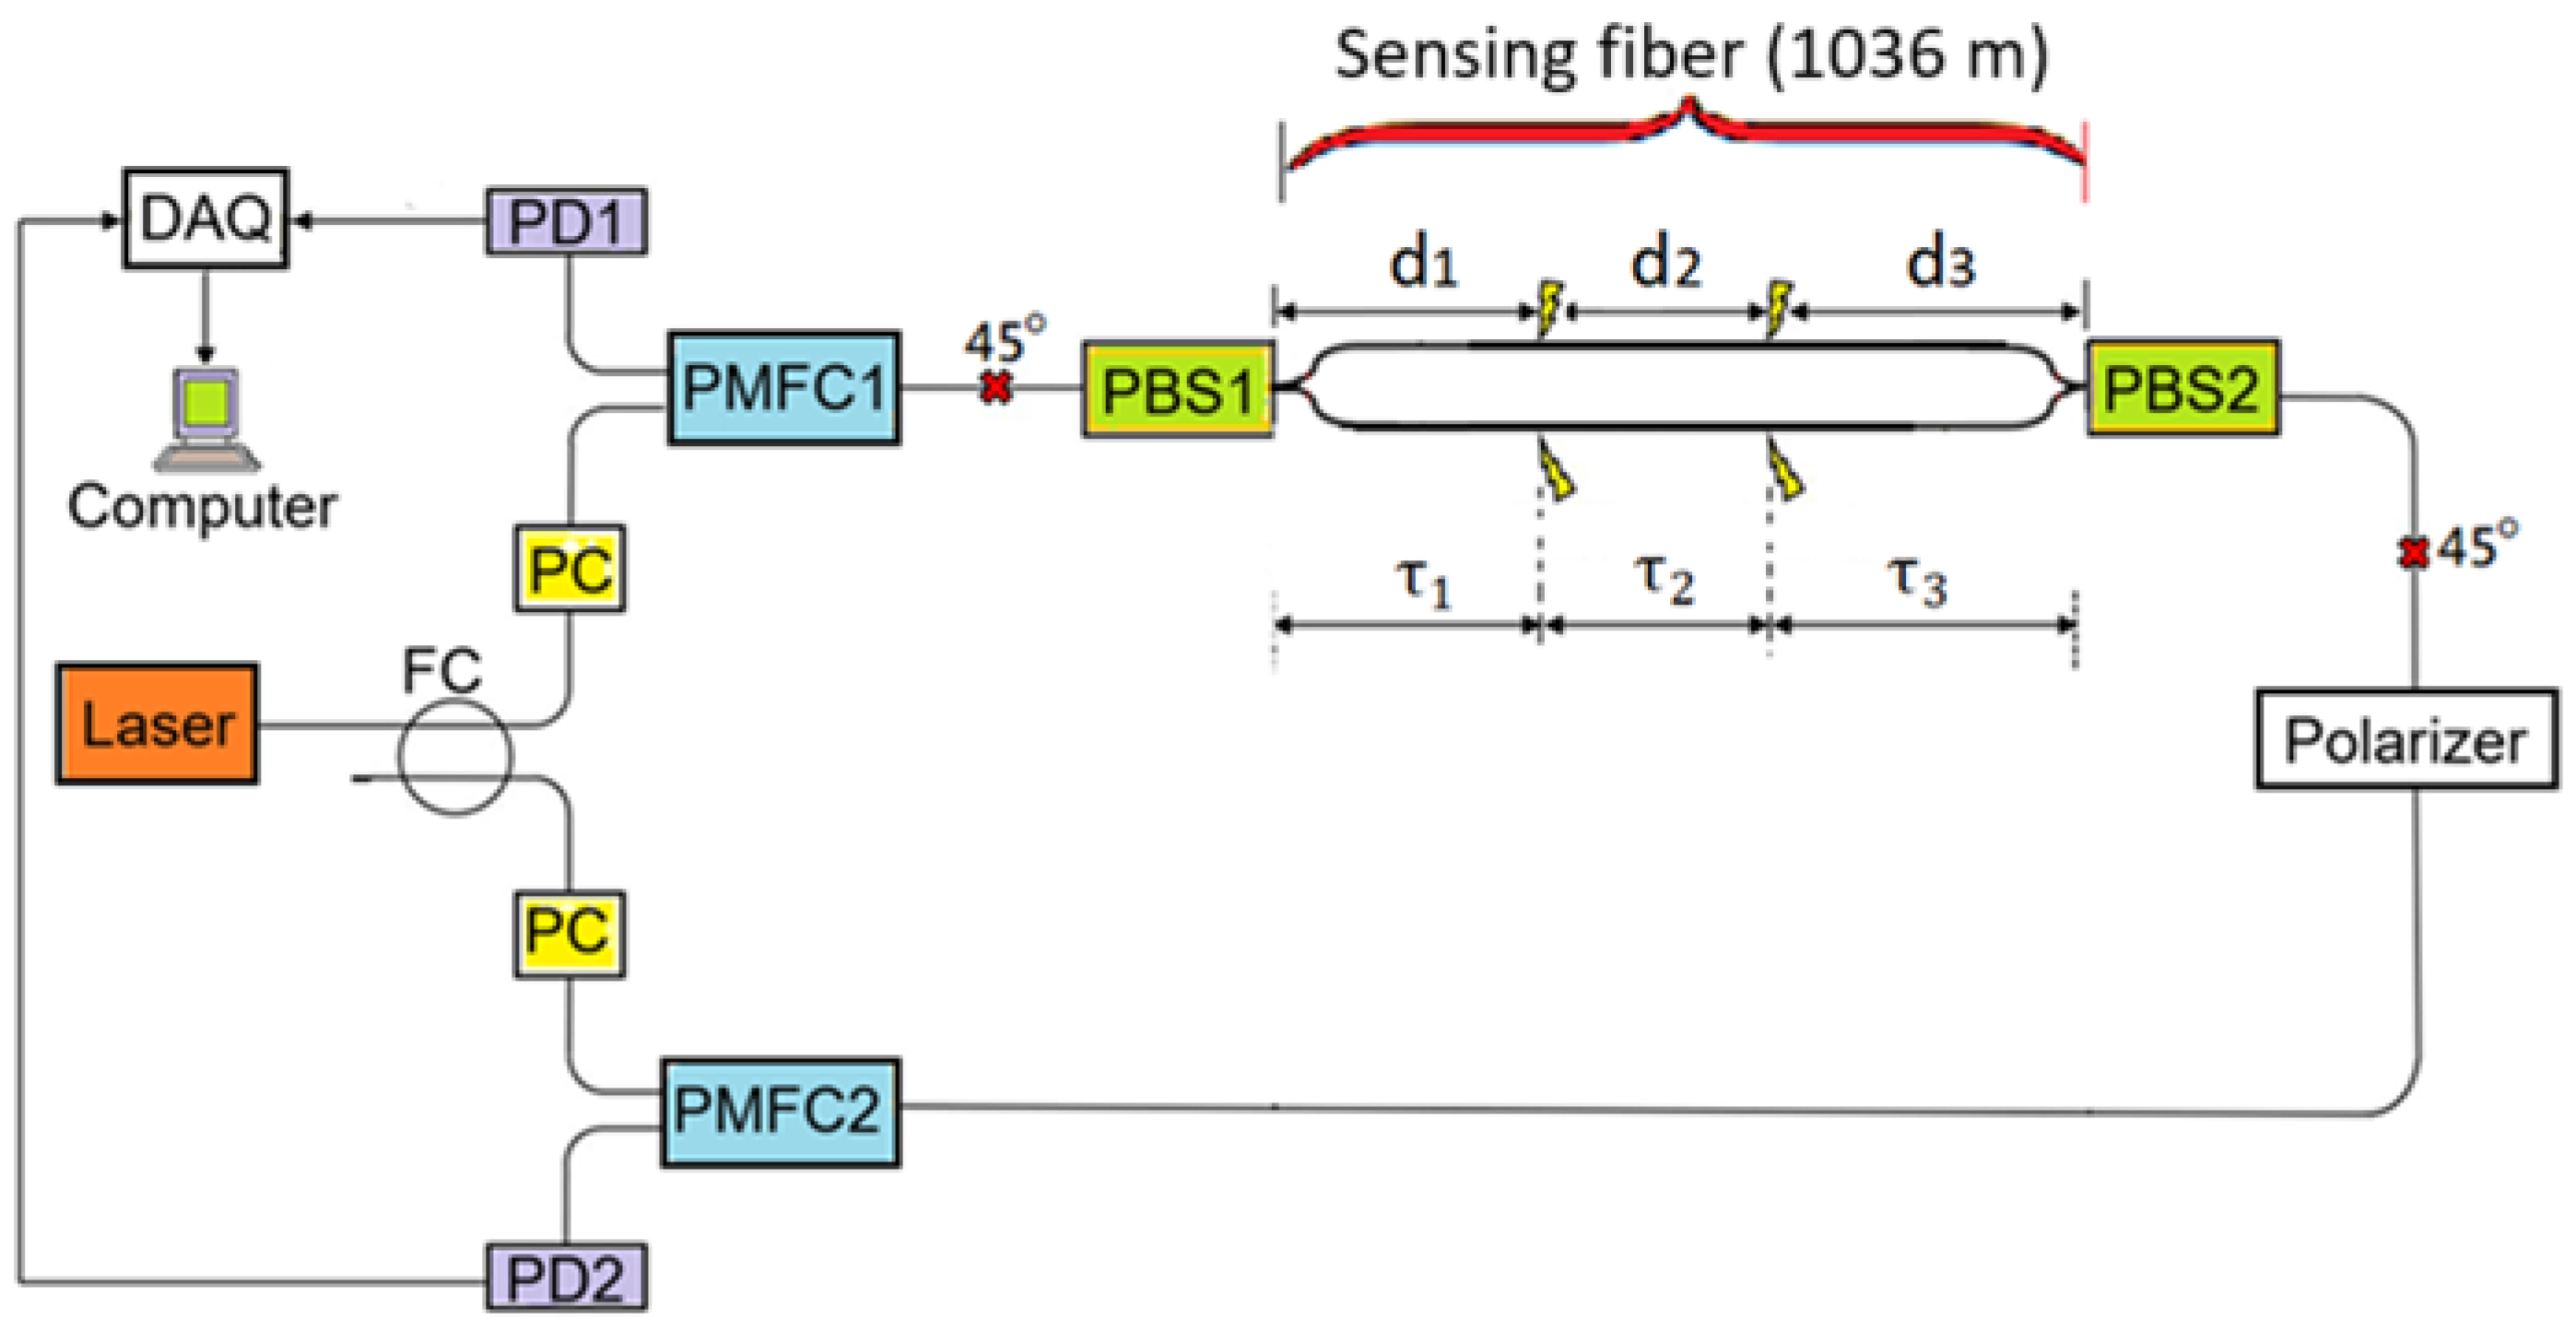
Figure 1. DMZI system for positioning two different intrusion events occurring at different locations. FC: 3 dB fiber coupler; PD1 and PD2: photodetector; PC: polarization controller; DAQ: data acquisition card; PMFC1 and PMFC2: polarization maintaining fiber coupler; PBS1 and PBS2: polarization beam splitter. The symbol × denotes 45 degree splicing between the principal axes of two polarization maintaining fibers.
Sensors 25 05074 g001
Figure 2. Practical situations when two intrusion events occur simultaneously at positions A and B. Case 1: only one intrusion occurs at position A. Case 2: only one intrusion occurs at position B. Case 3: intrusions occur simultaneously at positions A and B. PBS: polarization beam splitter used for the MZI.
Sensors 25 05074 g002
Figure 3. Detected signal waveforms of IPD1 and IPD2 (a) and their signal spectra (b). Spectrum of position number (c) and spectrum of CP value (d).
Sensors 25 05074 g003
Figure 4. Hierarchical clustering results for knocking simultaneously at positions 0.02 and 4.98. (a,b) are obtained by using complete linkage with cluster number H equal, respectively, to 3 and 4, while (c,d) are obtained by using average linkage with cluster number H equal, respectively, to 3 and 4.
Sensors 25 05074 g004
Figure 5. Hierarchical clustering results for knocking simultaneously at positions 0.02 and 4.98. (a,b) are obtained by using complete linkage with cluster number H equal, respectively, to 3 and 4, while (c,d) are obtained by using average linkage with cluster number H equal, respectively, to 3 and 4.
Sensors 25 05074 g005
Figure 6. Hierarchical clustering results for knocking simultaneously at positions 0.02 and 4.98. (a,b) are obtained by using complete linkage with cluster number H equal, respectively, to 3 and 4, while (c,d) are obtained by using average linkage with cluster number H equal, respectively, to 3 and 4.
Sensors 25 05074 g006
Figure 7. Feature space with three largest clusters formed by using the first hierarchical clustering analysis with average linkage of H = 3 and the second hierarchical clustering analysis with (a) average linkage of H2 = 7 and (b) average linkage of H2 = 8, for the case of two intrusion positions at 0.02 and 4.98.
Sensors 25 05074 g007
Figure 8. Feature space with the three largest clusters formed by using (a) the first hierarchical clustering analysis with average linkage of H = 3 and the second hierarchical clustering analysis with average linkage of H2 = 7 and (b) the first hierarchical clustering analysis with average linkage of H = 4 and the second hierarchical clustering analysis with average linkage of H2 = 6, for the case of two intrusion positions at 0.02 and 12.86.
Sensors 25 05074 g008
Figure 9. Feature space with the three largest clusters formed by using the first hierarchical clustering analysis with average linkage of H = 3 and the second hierarchical clustering analysis with (a) average linkage of H2 = 7 and (b) average linkage of H2 = 8, for the case of two intrusion positions at 4.98 and 12.86.
Sensors 25 05074 g009
Figure 10. Absolute errors computed for 18 intrusion events by using the first hierarchical clustering analysis with average linkage for H = 3 (upper) and H = 4 (lower). The second hierarchical clustering analysis was used with average linkage for H2 = 7 in the two figures for the case of intrusion positions 0.02 and 4.98.
Sensors 25 05074 g010
Figure 11. Absolute errors computed for 18 intrusion events by using the first hierarchical clustering analysis with average linkage for H = 3 (upper) and H = 4 (lower). The second hierarchical clustering analysis was used with average linkage for H2 = 7 in the two figures for the case of intrusion positions 0.02 and 12.86.
Sensors 25 05074 g011aSensors 25 05074 g011b
Figure 12. Absolute errors computed for 18 intrusion events by using the first hierarchical clustering analysis with average linkage for H = 3 (upper) and H = 4 (lower). The second hierarchical clustering analysis was used with average linkage for H2 = 7 in the two figures for the case of intrusion positions 4.98 and 12.86.
Sensors 25 05074 g012
Disclaimer/Publisher’s Note: The statements, opinions and data contained in all publications are solely those of the individual author(s) and contributor(s) and not of MDPI and/or the editor(s). MDPI and/or the editor(s) disclaim responsibility for any injury to people or property resulting from any ideas, methods, instructions or products referred to in the content.